Article

A Methodology for the Design and Engineering of Smart Product Service Systems: An Application in the Manufacturing Sector

1
Department of Management, Information and Production Engineering, University of Bergamo, Viale Marconi, 5, Dalmine, 24044 Bergamo, Italy
2
Research Center on Innovation and Service Management in Industrial Firms (ASAP), 50100 Florence, Italy
*
Author to whom correspondence should be addressed.
Sustainability 2023, 15(1), 64; https://doi.org/10.3390/su15010064
Submission received: 13 October 2022 / Revised: 12 December 2022 / Accepted: 19 December 2022 / Published: 21 December 2022

Abstract

:
The combination of servitization and digitalization is increasingly changing the economy and society at the global level towards sustainability goals. Companies are shifting their business models, typically oriented to selling products, towards providing bundles of products and services and integrating them with technologies enabling data collection and analysis, resulting in the so-called smart Product Service Systems (PSS). Different approaches and techniques have been put forth to design PSS and, more recently, smart PSS, but they continue to primarily concentrate on establishing value propositions and ignore the question of what sort of operational data can be gathered and used to deliver the PSS solution. Therefore, manufacturing companies willing to expand their portfolio with new advanced services nowadays still face multiple challenges. To address this gap, this study proposes the Service Engineering Methodology for the engineering of smart PSS (SEEM-Smart), which takes into account the trade-off between customer satisfaction and internal efficiency with a focus on data gathering and information flow. The methodology is then applied in a real-world setting. The case study shows the application of the SEEM-Smart for engineering a new data-driven service offering enabled by a cloud-based platform supporting the service provision.

1. Introduction

In recent years, sustainability trends and digitalization phenomena have been changing the economy and society at the global level. The digitalization path started to spread with the Industry 4.0 revolution, following concepts such as Internet of Things (IoT), machine learning, big data analytics, and so on, and becoming increasingly used in the industrial context. Indeed, one of the main advantages of Industry 4.0 technologies is that they not only make it possible to gather and analyze vast volumes of data from industrial assets and other sources but also use such data to support decision-making toward reaching process optimization or sustainable goals [1]. In this context, the servitization phenomenon appears to be dramatically affected by digitalization [2,3]. For decades, servitization has led manufacturing companies to shift from their product-oriented business models toward providing services in addition to physical products to meet the needs of clients [4]. While initially manufacturing companies found difficulties in structuring themselves to provide satisfiable services, nowadays, digital technologies might be used as a bridge to overcome these problems while also providing capabilities to offer additional services [2]. Such interconnection of digitalization and servitization (i.e., digital servitization) has led to the definition of data-driven offerings in which the combination of tangible products and intangible services has been integrated with digital technologies, namely smart PSS [5]. Specifically, manufacturing businesses are becoming more interested in providing services related to real-time product monitoring [6]. In this sense, IoT platforms, namely digital environments serving as an interface between the IoT devices (e.g., the products) and the users [7], along with data analysis methods, are promising instruments to enable the provision of services based on product real-time monitoring. The increasing interest of researchers confirms such a statement for the proposal of IoT platforms for service delivery in the manufacturing context [8,9].
Furthermore, providing services such as maintenance, repair, and remanufacturing allows providers to limit the environmental effects of their products, improve their offering attractiveness and increase customer satisfaction [10,11]. It is also a means to contribute to the fulfillment of the goals related to environmental, economic, and social sustainability, more commonly known as Triple Bottom Line (TBL) [12]. Structuring such an offering is not trivial, and companies must design PSS considering the target requirements related to expected PSS performance [13].
In relation to this, the literature on PSS design and engineering, and especially on smart PSS, has suggested different methods and tools in support of this purpose [14,15,16]. However, they continue to be primarily concerned with identifying the value propositions to meet the needs of the customers, ignoring the types of data that are required and may be gathered from the operational stage to make right decisions when allowing the new service offering [17]. To fill this gap, new tools and approaches specifically addressing the design and engineering of smart PSSs are required. These solutions should focus on taking into account the data and information required to deliver PSSs while also addressing the requirements of the sustainable dimension [18]. In particular, this paper aims at answering the following research question:
How can manufacturing companies be guided in the design and engineering of smart PSS while also considering the sustainable dimension of the PSS offering?
This paper focuses on this and aims to extend the SErvice Engineering Methodology (SEEM) developed by [19] to address the design and engineering of smart PSS, concentrating on the data and information to be used and on the sustainability implications of the newly designed PSS. Thus, this paper proposes the SErvice Engineering Methodology for Smart PSS (SEEM-Smart), which should support manufacturing companies in developing smart PSS offerings. A case study in a SME working in the professional appliances industry shows the application of the SEEM-Smart in a real-world context and discusses the results achieved both in terms of data-driven offering definition and implications for the sustainability-related aspects of the offering.
This paper is structured as follows: Section 2 provides a literature background to position this paper. Section 3 presents the methodology used to conduct the case study and focuses on the description of the SErvice Engineering Methodology for Smart PSS (SEEM-Smart) with all its phases. Section 4 presents the case study. Section 5 discusses the results of the SEEM-Smart application in the case study considering business and sustainability related benefits as well as barriers emerged during the process. Finally, Section 6 provides the conclusions and addresses future developments of the study.

2. Literature Background

Multiple definitions of smart Product-Service Systems (PSS) have been proposed by researchers over the years. While it is well established among researchers and practitioners that PSS consist of “tangible products and intangible services designed and combined so that they jointly are capable of fulfilling specific customer needs” [20], over time, researchers have tried to add various nuances to this definition focusing, from time to time, on the economic [21], value [22], and environmental [23] aspects of the PSS offering, in line with the aims of the TBL. In addition, more recently, researchers have extended the definition of PSS including the new, digital, perspective, defining a smart PSS as a “digital-enabled holistic solution, developed and supplied within an ecosystem, which provides economic and sustainable value to a main customer and complementary stakeholders, by integrating into a unique offer connected products together with data-driven services delivered all along the solution lifecycle, supported by physical and digital infrastructures” [24].
Thus, companies might focus on specific aspects while structuring the PSS offering, pursuing various aims and targets which should match with the specific needs and characteristics of customers [25] since the offering of PSS also comes with additional risks for the PSS provider [26]. The composition of a PSS offering based on the selection and association of products and services may be ineffective, especially if they were conceived as standalone entities. This, in connection with a non-optimal organization regarding the service delivery structure, could turn into lower economic returns for the supplier company, leading to a phenomenon known as service paradox [27,28]. Not meeting the customers’ expectations in relation to a service to be delivered (e.g., maintenance delivered later than agreed) might result in the payment of penalties, higher costs associated with service and resource management or, worse, the loss of a customer. Recent research [29,30,31] demonstrated that the adoption of digital technologies in support of PSS operations might help companies to overcome problems in PSS delivery, guaranteeing satisfactory results for all the stakeholders involved. Moreover, researchers are also investigating the truthfulness of the beneficial effects that digitalization has on the sustainability-related aspects of a PSS offering [32,33,34].
Over the years, many researchers have tried to overcome the problem related to the service paradox by proposing methodologies able to improve the product and service integration starting from the PSS design and engineering perspective. Marques et al. [35] focus on reducing the PSS time-to-market, reducing the time required for the design. Tran et al. [36] focus on the functional integration of PSS components, also providing implementation guidelines. Jiang et al. [37] focus on the product design at first and then evaluate the feasibility of adding services considering the service characteristics. They focus on maximizing design flexibility, sustainability, and efficiency. Pezzotta et al. [13] propose a methodology that looks at the whole PSS lifecycle relying on information and data generated during the PSS lifecycle to minimize design-related wastes during the design phase. In particular, this last methodology is built upon the SErvice Engineering Methodology (SEEM) discussed in [19]. More recently, other methodologies have been proposed, specifically focused on data integration in the PSS design, proposing various support methods to evaluate PSS design scenarios. Machchhar et al. [17] provide a comprehensive view on the usefulness of collecting data from various sources and typologies to address different challenges of PSS design. For instance, in the same paper, the authors identify a lack in terms of data collection and data utilization to properly support PSS design and value generation. Other authors have exploited simulation [38] as a supporting method to quantitatively evaluate PSS business model concepts and support the design process phase at the strategic level [39,40]. In particular, Won et al. and Oh et al. [39,40] utilize the System Dynamics simulation paradigm to model the complex relationships within the actors involved in PSS and evaluate the economic performance of PSS business models (e.g., costs and revenues). Gnoni et al. [41] investigate the impacts of a PSS solution on the three main dimensions of the TBL, specifically to show the potentiality of PSS as a feasible business model for the shift to a Circular Economy. The simulation environment enables us to model as-is scenarios and then analyze the impact of decisions, throughout what-if scenarios, in the long term [42]. This is very useful for managers who want to implement a PSS solution and need a supporting tool to take informed decisions, but it requires robust indexes, parameters and pattern behaviors which, once again, are challenging to collect and be useful for the PSS design phase. Thus, what emerges from this literature background is that, today, no methodologies are available to support the provider with directions to identify the data and information that could be used to deliver smart PSS and, more specifically, service-related decisions based on data, while also considering the sustainability dimension. This paper aims to close this gap by proposing a new methodology and by discussing a case study based on the application of the Service Engineering Methodology for Smart PSS (SEEM-Smart), describing its purpose and the phases composing it.

3. Methodology

3.1. Case Study

The research approach adopted to test the robustness of SEEM-Smart was based on the case study approach [43,44]. Specifically, four researchers were involved in the analysis, supporting the company during the various phases of the SEEM-Smart application and the parallel development of the new service. In particular, a single case study approach allowed us to devote the necessary attention to the single perspectives and problems related to each company department involved in the study. In addition, during the case study, the applicability, the coherence and the robustness of different phases of the SEEM-Smart methodology were analyzed by the researchers and compared with the existing literature on PSS and Smart Servitization. From the feedback collected during the application, the methodology was adjusted and improved to fit with the industry requirements [45].
The case study covered a 9-month period, where the researchers had the opportunity to observe and study the original service portfolio of the company, understand the customers and company needs, and support the company in the re-engineering of their internal processes while defining the new data and digital tools required for offering the new service.
Data collection was conducted in the field, with multiple interviews run with targeted respondents, specifically dedicated to product design, service and customer management, and direct observations in the related working areas. The analysis of the data collected from interviews and the organization of multiple workshops involving all the figures interviewed allowed us to define common goals and evaluate the feasibility of the solution identified while monitoring its development, adapting it to the new emerging information.
An agile approach was pursued to develop the service, and milestones were defined to control the project advancement while verifying the satisfaction of periodically established development goals. At the end of the case study, qualitative feedback on the methodology structure and on the methods used was collected.

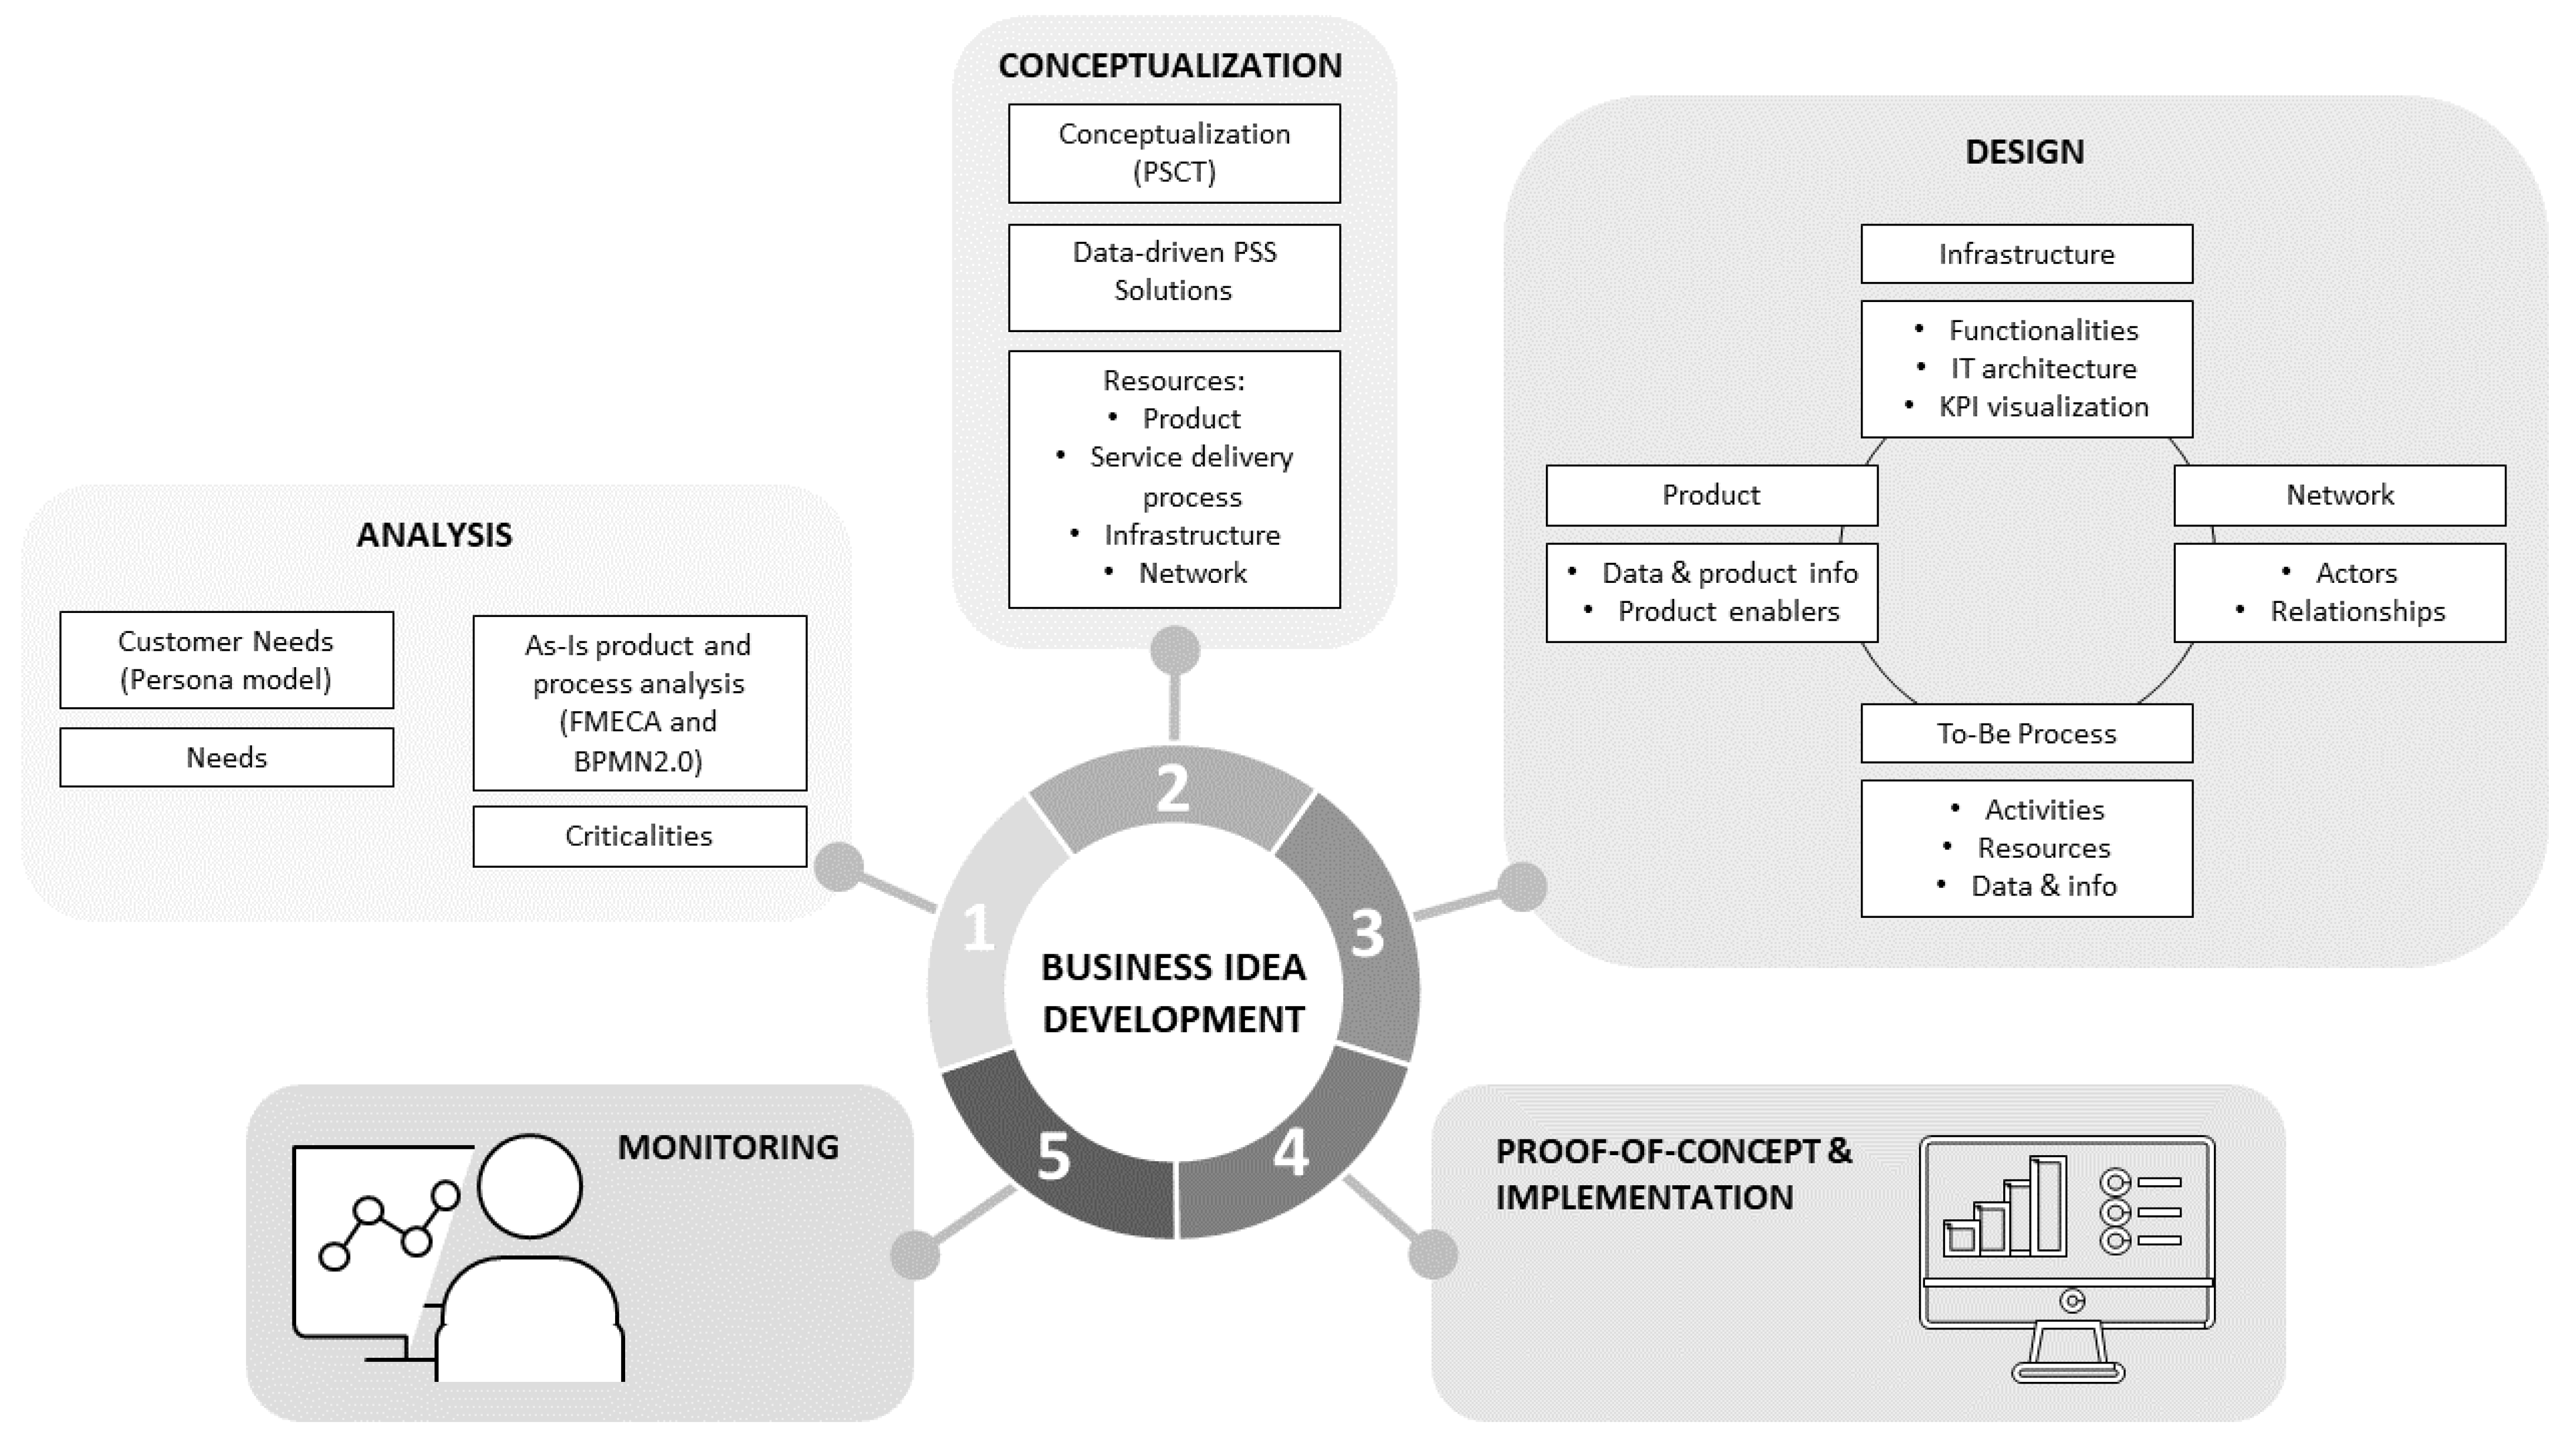
3.2. SErvice Engineering Methodology for Smart PSS (SEEM-Smart)

As discussed in Section 2, different PSS design and engineering methodologies are available in the literature, but most of them focus on generating added value mainly for customers without considering the provider’s perspective. In contrast, the SErvice Engineering Methodology (SEEM) does not simply focus on consumer needs but aims to find a balance between the value that customers perceive and the efficiency of internal processes [19,46]. The SEEM methodology consists of four phases that are supported by different methods and has its main drawback in the fact that it does not specifically focus on smart PSS. Thus, an extended version, with a data-driven nature, is proposed in this study. The updated methodology integrates the phases from the original SEEM with a data-driven perspective, allowing us to consider the requirements of the new data-driven nature of the PSS offering. The SEEM-Smart shown in Figure 1 is divided into five phases:
  • Analysis of the customer needs and the as-is product-service solutions and process. Like the original SEEM, the PSS (re)engineering process begins with an analysis of the customer’s characteristics, behaviors, and needs in order to comply with the scope of satisfying customer requests. This is followed by a critical examination of the company’s actual service offerings, by taking a close look at the associated asset for which the service is being provided, and the delivery process. In particular, the Personal Model (PM) is suggested for collecting information about customers and defining their needs [47]. In the case of services related to asset management, the Failure Mode, Effects, and Criticality Analysis (FMECA) model [48] can be used since it makes it possible to identify the critical components of an asset and, consequently, potential improvement areas. The method proposed to describe the internal and external perspective of the service delivery process is the BPMN2.0 [49], a business process modeling notation providing a representation of business processes that is simple for all business users to understand, creating a consistent link between the design and execution of business processes.
  • Conceptualization of the PSS solution and related resources. The company should be driven by client needs to develop several PSS solutions and choose the one(s) that offer value for both the customer and the provider. The primary result of this phase is the smart PSS solution with its details in terms of improved product, service delivery process, infrastructure, and network. In this phase, solutions are generated and evaluated also considering a sustainable perspective. Starting from the identified needs, the Product Service Concept Tree (PSCT) [50] is suggested as the starting point for generating different solutions. This method aims to define potential PSS solutions that could be offered to meet customers’ demands. It is based on design thinking and functional design concepts. It also allows the identification of the related provider’s resources needed for this purpose. Following the identification of the PSS solutions and the required resources, and to conclude the first phase, each solution is evaluated according to implementation difficulty and expected benefits parameters in the scope of identifying the most suitable one for the company that will be engineered. The TBL sustainability dimensions must be included in the evaluation of the solutions, meaning that the environmental footprint, the economic impact and the influence on the company’s employee wellbeing should be considered when looking for the best trade-off.
  • Design of PSS-related components. This phase includes the (re)design of the service offering by looking at the main elements involved in the service provision (i.e., the related products, the enabling infrastructure, the network, and the process) and the flow of data. This phase could involve the redesign of the products in order to enable the source of data directly from the field, for instance integrating product enablers (such as sensors) for collecting asset performance data. The new infrastructure supporting the new service offering is designed by specifying its functionalities, IT architecture, KPIs and their visualization, and the network of actors. Lastly, the to-be process is engineered considering both the external processes (i.e., the processes involving the customers) and the internal processes affected by the new data and information flow generated by the new service offering. This because both the external processes and internal processes may be affected and improved by the smart PSS solution. For example, if the solution is related to asset monitoring, the asset performance data retrieved directly on the field could be useful to organize and improve the maintenance provision process also taking into consideration sustainability goals. At the same time, these data could be analyzed internally by the designers to find new configurations of product components that lower the environmental impacts, impacting the product design process.
  • Creation and validation of the PSS proof of concept and the related infrastructure. Finally, the fourth phase involves creating a proof of concept of the smart PSS offer (e.g., maintenance enabled by remote monitoring), defining the needed infrastructure and the final provision process. This phase also deals with validating the proof of concept and its performance assessment. This is possible through the use of simulation systems, which enable the dynamic and quantitative analysis of various delivery processes as well as the comparison and selection of various scenarios based on actual performance metrics. All potential scenarios are examined after the prototype has been reviewed through simulation, and all specific decisions regarding the solution to be provided are then made. Then, the solution is prepared for delivery to the market once it has been validated and the necessary adjustments have been made.
  • Monitoring of the results. Like in the original SEEM, the last phase of the methodology deals with the analysis of the results. In order to constantly have a solution offering that is effective, efficient, and in accordance with client requirements, the solution produced and deployed in the market must be monitored from a KPI viewpoint. The analyses carried out in this phase will serve as the basis for a new customer needs study as well as serving as the catalyst for a new design process. A first list of KPIs is proposed at this step and will be finalized when all the PSS components are implemented.

4. Alpha Case Study

Alpha, an imaginary name used for privacy purposes, is an Italian SME that manufactures professional dishwashers for the professional appliances market. The business, which has a firmly established presence in more than 50 countries worldwide, has always been heavily product-oriented and distributes its products to end users (such as bars, restaurants, and canteens) through distributors. It does not have direct contact with final users, but it relies on a widespread network of distributors that provide after-sales assistance to the end users. Specifically, the distributors are responsible for sale and installation of the products and their maintenance, but, up to now, only corrective maintenance service is offered to final customers. Alpha recognizes the added value of an integrated PSS offering to leverage its business in line with the servitization process. Although the service offering is still very limited, Alpha supports its distributors in the after-sales phase for troubleshooting, the identification of the correct spare parts codes, and the sending of technical documentation. In addition, it takes care of the management of component returns for spare parts and/or warranty. However, Alpha does not have a structure process to provide these services to its distributors, reducing the efficiency of its service support. In addition, with the recent spreading of digitalization, Alpha has started to perceive the need to integrate its products with technologies to face market competition in the field and improve its service activity.
The main criticalities of the market are summarized as follows:
  • Alpha typically does not communicate with end users and is not even aware of the installed base.
  • Although end users believe the product to be essential, they are not likely to invest in advanced services and technologies.
  • Since distributors are multi-brand, they typically have a high workload, constrained timelines for interventions, limited product knowledge (particularly with products that have lot of electronics installed). They also have limited time (or willingness) to follow training.
  • The distributors contact company Alpha requesting rapid assistance in cases of problems during diagnostics and resolution, or in the case of products covered by warranty, increasing the workload of the company service support.
Starting from these criticalities, Alpha planned to begin its journey toward servitization by utilizing digitalization and the improved connectivity available. Despite this, being almost entirely new to this kind of business offering, the company faced the absence of guidelines for engineering the smart PSS. In the past, Alpha has noted the importance of reusing data collected during its products’ usage phase but was unable to understand which kind of data were valuable for the service and how to build a business model on that. As an answer, Alpha was guided in the process of developing a new data-driven service through the exploitation of the SEEM-Smart methodology. The following sections provide a full overview of the methodology’s first four steps. The final step is not considered in this case study, but will be addressed in future developments.

4.1. Phase 1: Analysis

The SEEM-Smart methodology’s starting point is the analysis of the customers, which includes the definition of their needs. For this purpose, the customer identified is the distributor. The end user was not considered because of the absence of direct contact and, consequently, a lack of data. The Personal Model of the distributor was established by interviewing Alpha’s Marketing, Sales and Service Managers (Figure 2). The distributors are mainly characterized by micro-small dimensions (up to 10 employees) and they must cope with a heavy workload and constrained intervention timeframes. They usually have limited knowledge of the product since they are multi-brand and do not always follow training, but they are keen on using technology to facilitate work. As a result, the following needs have been defined: (i) improve service interventions; (ii) know in advance the delivery times of products/spare parts to inform end-users; (iii) have good product understanding for supporting end-users during the pre-sale phase.
The analysis of the product and as-is service delivery process (i.e., technical assistance process) comes next. For this purpose, a FMECA analysis was performed through interviews with the Service Manager and the Product Designer. In order to properly assess the criticality of a failure of the entity under analysis, the FMECA methodology entails determining the modes, causes, and effects of failures for the components of a product. The performed analysis makes use of a “standard model” dishwasher that is representative of numerous models. This decision was mostly supported by the models’ structural, technological, and functional similarities, despite their differences. The FMECA analysis followed this process:
  • Using a hierarchical-functional criterion, the product’s functional breakdown was performed, allowing the definition of four levels (group, system, equipment, sub-equipment).
  • The criticality drivers were defined to calculate the Risk Priority Number (RPN) that is the product of three drivers: the Probability (P) of occurrence of the failure, the Severity (S), and the Detectability (D) of the failure. Two severity levels were established, one relating to the impact of the failure on the machine’s operation (denoted as Sa), and the other to the fault’s repairability or the part’s substitutability (Sb). The driver with the highest score will then be taken into account when calculating the RPN for each mode of failure. Each driver has four levels, ranging from 1 (low) to 4 (extremely high). Figure 3 reports the constructed matrix summarizing the criticality drivers.
  • Finally, the analysis of modes, causes and effects of failures and the calculation of criticality indexes (RPN) were completed.
Then, the RPN indices obtained for the different failure modes (see an excerpt in Figure 4) were analyzed to identify the most critical modes and causes and, consequently, find the most critical components. The FMECA analysis reveals that the dishwasher’s electronics, rinse circuits, and opening systems are the most crucial parts. In addition, a deeper examination showed that 8 out of 55 failure modes discovered (or 14%) account for 50% of the criticality linked with the product (Figure 5).
The FMECA results allowed for the identification of improvement actions at the level of sensors installed (or installable) on the product. The above-mentioned failure modes with higher criticality were given extra attention, especially with regard to detectability (that is, the factor that mostly benefits from the introduction of new sensors on the machines). As a result, the analysis focused on identifying components and sensors that contribute to the measurement of variables reflecting the machine’s health status. The investigation revealed the need for sensors to monitor resistor power absorption, detect water leaks and door closing status, and measure water temperature and level.
As suggested by the SEEM-Smart, the method proposed to describe the service delivery process is BPMN2.0. Through interviews and direct observation of the daily activities inside the company service department, it was possible to represent the entire Alpha technical assistance process. Figure 6 reports the processes that Alpha’s service has to deal with. The obtained BPMN 2.0 identified other Alpha internal actors involved in the process, for instance the sales office and the technical office. This shows the necessity to balance the external customer needs and internal process efficiency, as outlined by the SEEM methodology for PSS design.
Several critical issues emerged from the analysis of the as-is situation. The main criticalities appeared to be related to the lack of a structured support system for distributors who frequently need to contact Alpha’s technical assistance for solving machine maintenance issues. It was decided to divide problems related to the lack of an internal system managing information flows between different company departments (internal criticalities) from problems involving the service and the customer (external criticalities). In light of the findings of the analysis of Alpha’s technical assistance process, the flow of information between both the internal and external actors involved is not supported by a single and structured system leading to waste of time and inefficiency in providing assistance to customers. Specifically, technical support and installers communicate only via telephone or e-mail. The interventions are recorded by Alpha’s service employees, but the procedure is carried out manually by the service itself, without any kind of automation, and the distributors do not have access to the intervention’s repository.

4.2. Phase 2: Conceptualization

Starting from the customer needs identified in the previous phase and with the process criticalities in mind, a Product-Service Concept tree (PSCT) was exploited to identify possible PSS solutions. The PSCT is divided into four levels:
  • Level 1 consists of the Needs (N) of the customers as identified in the Personal Model.
  • Level 2 consists of the Wishes (W), which refers to how customers want to meet their needs.
  • Level 3 contains the Solutions (S), i.e., all the PSS solutions (product, services or a combination of them) that the business may identify to meet the wishes and needs of the customer.
  • Level 4 contains the Resources (R), people, software and/or products to bring the solution into practice.
Figure 7 shows the PSCT produced during a 3-h brainstorming session with the Marketing and Sales Manager, the Service Manager, and the Product Designer of the company Alpha for finding the PSS solutions. The acronyms used in the PSCT graph are explained in Table 1.
The guided brainstorming brought the generation of different solutions to fulfil customer requests. An internal and qualitative cost and benefit analysis of the identified PSS solutions was carried out in order to choose the most relevant alternatives from the list. The participants were invited to evaluate in terms of costs and perceived benefits each PSS alternative and related required resources, by assigning a weight from 1 to 4. For the costs, 1 represents a low cost while 4 a high one. Similarly, a weight of 1 represents a low foreseen benefit, while a value of 4 represents a high one. Once we multiplied the weights of cost and benefit for each solution, these values were used for prioritizing the alternatives and evaluating them considering additional perspectives. Specifically, while evaluating the scores achieved by each solution, Alpha’s personnel also discussed the sustainability aspects of each one, investigating whether or not the solution under consideration would impact positively or not the environmental footprint of the offering, the economics behind its delivery, and the impact on the workload of the technician. For these aspects, the discussion was led by the experience of the participants, since in many cases it was not possible to use quantitative data in support of the selection. As a result, the company decided to spend effort on supporting distributors while providing maintenance and, thus, it chose to apply the following solutions:
  • Remote monitoring of dishwasher health through IoT, allowing for geolocation of the product and the delivery of alerts when one of its components is deteriorating, suggesting the need for intervention.
  • Distributor data management, enabling the distributor to manually collect all the data related to the not-connected machines and supporting the problem diagnosis.
  • Simple and fast access to dishwasher-related technical data.
  • Ticketing management for assistance.
  • Preventive maintenance.
Analyzing the resources reported in the PSCT linked to these solutions, Alpha opted for developing a cloud-based platform as its infrastructure to enable the delivery of the smart PSS solutions identified.

4.3. Phase 3: Design

The design phase of the SEEM-Smart methodology deals with the definition of the data required to enable the delivery of the chosen PSS solutions and the information supporting the service provision decision making. Since the selected solutions involve remote monitoring of products through IoT and preventive maintenance, understanding the most critical components and the data needed to monitor their health status becomes significant. This was addressed by the FMECA analysis which showed the need for sensors to detect door closing status and water leaks, and measure water temperature, water level, and resistors power absorption.
Thus, starting from these results, the product not only should have sensors but should be equipped with a device enabling data collection and transmission, such as a Product Monitoring Box, i.e., a device that would receive as input all the quantities detected by the sensors installed on the machine and enable their collection and transmission. Such a system could be installed on different models, even on existing models, and be already planned in the design phase for new productions. These data should be collected and transmitted to the infrastructure, which in our case is the above-mentioned platform, where they can be easily visualized, analyzed, and, thus, utilized for preventive maintenance purposes.
The cloud-based platform is the selected infrastructure to enable smart services since it allows the storage and sharing of a vast amount of data to be reutilized in the decision-making process of planning the maintenance interventions by distributors, with the potential to be utilized for preventive maintenance. Moreover, the distributors would gain a 24/7 support service that could exploited everywhere during the intervention activities, which has the potential of reducing not only the errors in the diagnosis analysis, but also time. Furthermore, considering the sustainability perspective and the TBL aims, the development of such a platform would allow the tackling of several dimensions, enabling a better definition of the interventions. For instance, this would directly impact the consumption of spare parts with economic and environmental implications, as well as human-related consequences (improved management of the human workload, enhanced instruments to execute the work and provide support to customers). The platform must be structured to allow not only the integration of a remote monitoring system of the machine health status, but also a system for manually inserting and collecting data, so to have a comprehensive data storage supporting Alpha’s technical assistance and distributor interventions. More specifically, the data required by the platform and their origin are as follows:
  • Data related to the operations of the machines (parameters that are more useful for the later analysis of the machine status), which come directly from the connected machines.
  • Data related to interventions, which are entered manually by the distributor from the request of intervention (serial numbers, cause of failure, spare parts, etc.).
  • Data related to the fleet of installed machines (serial numbers, location, end-user information) entered automatically in the case of connected machines or manually by the distributor at the moment of the installation so that the distributor can see the whole list of equipment.
In any case, data visualization and analysis are expected to occur primarily within the platform that receives data transmitted from the device. Such a platform could be accessed by multiple users, but primarily by Alpha’s distributors and Alpha’s assistance and technical office through a mobile app and/or a PC. In future developments, its access could also be extended to the end customers through a dedicated and easy-to-manage mobile app reporting customer-oriented KPIs.
Figure 8 provides an insight of the infrastructure needed for the new service provision, the involved users, and the share of information between them.
Once the PSS solutions and the data and information required to provide them are established, the associated external and internal processes must be (re)-designed. The new platform becomes an information gathering tool and consequent internal decision support for Alpha and its distributors. The to-be process is reported in Figure 9. Table 2 lists the main problems identified along the processes and how the platform can help in resolving them.
The external and internal process analysis refined the definition of the functionalities for the implementation of the new platform that will enable the company to propose new business solutions. In a final brainstorming session, taking into account the main critical issues that emerged from the information flow and the possibilities offered by Industry 4.0 technologies, the main functionalities that the platform must perform, as enabler of a PSS offering, were identified and are summarized in Table 3. According to the offers they can enable, the functionalities were classified into first and second level categories. The first level functionalities enabled the direct support of the distributor in the definition of the service solutions (e.g., remote monitoring and preventive maintenance), while the second level functionalities enabled the optimization of the Alpha’s service and technical office activities.
Only the service employees of the company, the distributors and the technical office were considered as direct users, but in future developments the end customers of Alpha could also access the platform, as mentioned before.

4.4. Phase 4: Creation of the PSS Proof of Concept and Implementation

To provide a proof of concept of the data-driven service offered, a dashboard of the IoT platform, based on the requirements previously outlined, was constructed and is reported in Figure 10. The example provided sees the distributor as the current user of the platform, thus the dashboard presents all the main related requirements: a section dedicated to the installed machines, where it is possible to visualize all the machine activated by the user (machine ID, installation date and location) and the associated alarms; a section dedicated to the monitoring of the machine’s parameters, enabling the remote consultation of the health status of the machines; a section dedicated to the insertion of the interventions made on the machines and the rendering requests of the component/machine, allowing the repository of all the distributor’s actions and the possibility of tracking the status of the requests; a section providing all the documentation related to machines and components available; and, finally, a section for messaging purposes between company Alpha and the distributors. On the other side of the platform, Alpha checks the input data and opens/closes the intervention requests, assigns the priority and the internal components responsible to accomplish the different tasks, and is able to obtain statistics on the historical data, useful for both the service and technical office, as widely stated.
The dashboard shown in Figure 10 is only a part of the whole platform under development. Such development will adopt an agile approach, with periodical review meetings aimed at verifying the development status, correcting problems, and adapting functions to newly emerging needs.
The SEEM-Smart ends up with the validation of the proof of concept and the monitoring of the results after the delivery of the business solutions to the market. So far, these steps have not been object of the case study, because the platform is still under development. They will be addressed in future developments of the study. Despite this, an indication of the main significant indexes that are needed to assess the performance of the smart PSS offerings is described in the following section.

4.5. Phase 5: Monitoring of the Results

The last phase of the SEEM-Smart methodology deals with the analysis of the results obtained from the developed business solution. As previously stated, this phase has not been addressed by the case study because Company Alpha has not yet integrated the enabling infrastructure (i.e., the platform) into its service process. Therefore, the authors have neither quantitative nor qualitative information about the performance of the business solution that the company found with the support of the SEEM-Smart. However, since the smart solutions were driven by the needs and wishes of customers, it follows that, by monitoring these drivers, Alpha could constantly have solution offerings which are effective, efficient, and aligned with client requirements. To recall, the Alpha customers (i.e., the distributors) want to improve their service interventions on Alpha dishwashers by reducing the intervention time, having a clear knowledge of the product and a better planning of the interventions and by receiving assistance.
The platform is a helpful tool for monitoring purposes, acting as a database for information about machines, customers, and interventions. Thus, it is feasible to display the most pertinent indicators for analyzing the outcomes and evaluating performance by taking a look at the distributors’ needs and the platform requirements. For example, a first list of KPIs may include the following: (i) number of installed machines for each distributor with location and customer data, which is helpful for both the distributor to clearly understand the size of its business and, as a result, for Alpha to better understand its customers; (ii) number of interventions on installed machines, the time of each intervention, and the occurrence frequency of the same issues, which is useful for the distributor to know the effectiveness of its maintenance interventions and find sustainable solutions and for Alpha to know the main issues occurring on their machines; and (iii) number of Alpha assistance requests, the related time of resolution and their closing status, which are important for the internal performance assessment of Alpha service assistance with the introduction of the digitalized infrastructure. It is important to recall that the given indicators are a first proposal for the quantitative monitoring of the outcomes of this case study and that they would be refined during the detailed design of the IoT platform.
The monitoring of the result constitutes the last phase of the Smart-SEEM, however an iterative approach is suggested in order to constantly find new service business solutions able to meet new customer needs and internal criticalities.

5. Discussion

From a theoretical point of view, this work, which proposes the Service Engineering Methodology for Smart PSS (SEEM-Smart), aims to fill a gap in literature, namely the lack of methods and tools to design and engineer smart PSS while balancing external and internal performance and specifically addressing the selection of data and information needed in the operational stage. Indeed, the specification of the data and information required to deliver the chosen solution is a key focus of the proposed methodology.
To demonstrate its applicability in industrial contexts and to test its robustness, a case study in the professional appliances industry is proposed to show the application of the first four steps of the methodology in a real context. The milestones defined to control the advancement of the methodology application were fully satisfied and each phase ended up with positive feedback by the company Alpha employees involved in the case study.
The development of a PSS offering enabled by a new platform contributes to the servitization journey of Alpha, whose aim is to increase its service offering to improve the relationship with the distributors (i.e., the customers for this service) in the scope of facilitating their job, which consists of selling, installing, and providing maintenance to the final customers. The enhanced relationship with the distributors, thanks to a better communication and support, is just one of the added values produced by the smart PSS solutions identified. They also make it possible to increase product knowledge through the collection and monitoring of data, which is a crucial feature that generates benefits for the distributors, the business, and, in subsequent steps, also the end-users. In addition, the ability to schedule preventive maintenance interventions helps not only to prevent failures and machine downtime for the end users, but also to increase the useful life of a product and optimize the consumption of spare parts, thereby satisfying the environmental requirements which are now even more important aspects for the service delivery.
The availability of the platform is strategic for Alpha, since it represents a means to collect data and information related to the behavior of the products installed at the final customer premises, as well as a means to understand what kind of problems happen during the normal operation of the products.
The possibility to collect data allows Alpha to perform frequency analysis, understand the most common problems that distributors have to deal with and, based on that, define improvement actions both from the design aspect (i.e., re-design of components too prone to fail) and the service side. As support during troubleshooting is one of the things that distributors ask more frequently of Alpha, the availability of such a platform could contribute to speed up this phase, allowing distributors to solve their problems in a shorter time and increasing the satisfaction of the end users. As explained earlier, distributors are used to dealing with different brands of products, and do not have detailed training. For this reason, having such a platform to guide troubleshooting would reduce the time required to identify the origin of problems and allow them to perform services in a better way.
The possibility to analyze historic data and extract knowledge can contribute to meeting the TBL goals related to the sustainability of the PSS offering. In fact, by analyzing the failure frequency of the components, it is possible for Alpha to forecast the spare part consumption and plan their availability. In addition, looking at the problem from a temporal perspective, it would be possible to suggest periodic checks aimed at verifying the health status of the components, preventing unexpected failures, prolonging their useful life, and optimizing the consumption of spare parts, with a beneficial effect both from economic and environmental perspectives.
By analyzing the typology of failure that distributors most frequently deal with, it would be possible to provide them with additional learning materials or organize specific training sessions to cover knowledge gaps, pursuing higher social and economic sustainability and coping with the strict time that they devote to training.
Thus, the integration of digital means into the PSS offering would allow companies to offer better services to customers, exploiting the advantages of remote monitoring and communication, reducing the need to travel, and improving the support provided to customers.
Despite this, it is necessary to highlight that this transformation is not trivial and requires changes in Alpha’s organizational settings that can represent barriers for a successful implementation. Specifically, it requires the integration of additional competences for Alpha and its distributors, which need to hire or train employees to be able to deal with the data collected, developing analysis instruments, and having the knowledge to interpret the data processed, transforming the outcome of the analysis into useful knowledge. Moreover, technological requirements should be considered. Sensors and an internet connection should be provided to products, and an internal infrastructure able to handle, process, and visualize the data collected in a user-friendly manner should be put in place. Additionally, improvements from the process perspective must be considered. Internal and external processes should be re-engineered to include a proper use of the new data and information for service offering. Moreover, new roles and tools should be identified to favor data exchange and decision-making processes.
Alpha should structure itself by defining an implementation path coherent with the aims and the possibilities originally available in the company, as well as define targets and milestones useful to monitor the implementation process and the effectiveness of the services offered.

6. Conclusions

Nowadays, manufacturing companies are increasingly shifting their business from product-oriented to data-driven PSS business models, thanks to the support offered by the digital technologies of the Industry 4.0. Digital technologies are enablers for the development of data-driven services which, offered in combination with the connected products (i.e., smart PSS), have the potential of increasing companies’ revenue and improve environmental sustainability. The scientific literature reveals a lack of methods and tools to design and engineer these smart PSSs. More specifically, the existing methods and tools do not balance the external and internal performance of the PSS solution, and they do not address the selection of data gathered from the operational stage.
Thus, this paper discusses an application of the Service Engineering Methodology for Smart PSS (SEEM-Smart), a five-step methodology to design smart PSS, addressing customer needs, internal process efficiency and focusing on the data and information needed to deliver the PSS solution. In particular, a case study in the professional appliances industry has been discussed. The case study demonstrated that the SEEM-Smart is a methodology which SMEs can exploit in their digital servitization process. The methodology not only supports the identification of data and information to collect and structure the implementation of the smart PSS, but also evaluates how the new solution impacts the company processes and what are the requirements for the solutions instantiation considering not only economical but also sustainable aspects. Thus, the smart PSS solution could become not only a means for creating added value (externally) to the customer, but also (internally) to the company itself. In the case study, the platform selected as a data-driven solution to implement allows the provision of support for both the distributors for their maintenance activities, and the company service and technical office employees. Moreover, the methodology has the potential of supporting manufacturing companies to accomplish sustainability requests, integrating the sustainable driver in the selection of data-driven solutions.
Additional enhancements to the SEEM-Smart are required, and they should focus on the first step’s selection of the PSS solutions. Finally, a thorough deployment in more industries and businesses is necessary to keep investigating potential upgrades for the suggested methodology.

Author Contributions

Conceptualization, V.A., G.R., F.P. and G.P.; methodology, V.A., F.P. and G.P.; validation, V.A., R.S., F.P. and G.P.; formal analysis, V.A., G.R. and F.P.; investigation, V.A., R.S., F.P. and G.P.; resources, V.A., F.P. and G.P.; data curation, V.A., G.R., F.P. and G.P.; writing—original draft preparation, V.A. and R.S.; writing—review and editing, V.A., R.S., G.R., F.P. and G.P.; visualization, V.A. and R.S.; supervision, F.P.; project administration, F.P. and G.P. All authors have read and agreed to the published version of the manuscript.

Funding

This project has been funded by MADE Competence Center Industria 4.0.

Institutional Review Board Statement

Not applicable.

Informed Consent Statement

Not applicable.

Data Availability Statement

Not applicable.

Conflicts of Interest

The authors declare no conflict of interest.

References

  1. Watanabe, K.; Okuma, T.; Takenaka, T. Evolutionary Design Framework for Smart PSS: Service Engineering Approach. Adv. Eng. Inform. 2020, 45, 101119. [Google Scholar] [CrossRef]
  2. Chen, Y.; Visnjic, I.; Parida, V.; Zhang, Z. On the Road to Digital Servitization—The (Dis)Continuous Interplay between Business Model and Digital Technology. Int. J. Oper. Prod. Manag. 2021, 41, 694–722. [Google Scholar] [CrossRef]
  3. Langley, D.J. Digital Product-Service Systems: The Role of Data in the Transition to Servitization Business Models. Sustainability 2022, 14, 1303. [Google Scholar] [CrossRef]
  4. Baines, T.; Ziaee Bigdeli, A.; Bustinza, O.F.; Shi, V.G.; Baldwin, J.; Ridgway, K. Servitization: Revisiting the State-of-the-Art and Research Priorities. Int. J. Oper. Prod. Manag. 2017, 37, 256–278. [Google Scholar] [CrossRef]
  5. Zheng, P.; Wang, Z.; Chen, C.-H.; Pheng Khoo, L. A Survey of Smart Product-Service Systems: Key Aspects, Challenges and Future Perspectives. Adv. Eng. Inform. 2019, 42, 100973. [Google Scholar] [CrossRef]
  6. Syafrudin, M.; Alfian, G.; Fitriyani, N.; Rhee, J. Performance Analysis of IoT-Based Sensor, Big Data Processing, and Machine Learning Model for Real-Time Monitoring System in Automotive Manufacturing. Sensors 2018, 18, 2946. [Google Scholar] [CrossRef] [Green Version]
  7. Asemani, M.; Abdollahei, F.; Jabbari, F. Understanding IoT Platforms: Towards a Comprehensive Definition and Main Characteristic Description. In Proceedings of the 2019 5th International Conference on Web Research (ICWR), Shanghai, China, 4–6 May 2019; IEEE: Tehran, Iran, 2019; pp. 172–177. [Google Scholar]
  8. Pauli, T.; Fielt, E.; Matzner, M. Digital Industrial Platforms. Bus. Inf. Syst. Eng. 2021, 63, 181–190. [Google Scholar] [CrossRef]
  9. Leccisi, M.; Leccese, F.; Moretti, F.; Blaso, L.; Brutti, A.; Gozo, N. An IoT Application for Industry 4.0: A New and Efficient Public Lighting Management Model. In Proceedings of the 2020 IEEE International Workshop on Metrology for Industry 4.0 IoT, Virtual, 3–5 June 2020; pp. 669–673. [Google Scholar]
  10. Franciosi, C.; Voisin, A.; Miranda, S.; Riemma, S.; Iung, B. Measuring Maintenance Impacts on Sustainability of Manufacturing Industries: From a Systematic Literature Review to a Framework Proposal. J. Clean. Prod. 2020, 260, 121065. [Google Scholar] [CrossRef]
  11. Chang, Y.; Ming, X.; Zhang, X.; Zhou, T.; Liao, X.; Cao, S. Servitization and Sustainable Value Creation Strategy for China’s Manufacturing Industry: A Multiple Case Study in the Belt and Road Initiative. Sustainability 2021, 13, 11334. [Google Scholar] [CrossRef]
  12. Sénéchal, O. Research Directions for Integrating the Triple Bottom Line in Maintenance Dashboards. J. Clean. Prod. 2017, 142, 331–342. [Google Scholar] [CrossRef]
  13. Pezzotta, G.; Sassanelli, C.; Pirola, F.; Sala, R.; Rossi, M.; Fotia, S.; Koutoupes, A.; Terzi, S.; Mourtzis, D. The Product Service System Lean Design Methodology (PSSLDM). J. Manuf. Technol. Manag. 2018, 29, 1270–1295. [Google Scholar] [CrossRef] [Green Version]
  14. Rapaccini, M.; Adrodegari, F. Conceptualizing Customer Value in Data-Driven Services and Smart PSS. Comput. Ind. 2022, 137, 103607. [Google Scholar] [CrossRef]
  15. Bu, L.; Chen, C.-H.; Ng, K.K.H.; Zheng, P.; Dong, G.; Liu, H. A User-Centric Design Approach for Smart Product-Service Systems Using Virtual Reality: A Case Study. J. Clean. Prod. 2021, 280, 124413. [Google Scholar] [CrossRef]
  16. Ebel, M.; Jaspert, D.; Poeppelbuss, J. Smart Already at Design Time—Pattern-Based Smart Service Innovation in Manufacturing. Comput. Ind. 2022, 138, 103625. [Google Scholar] [CrossRef]
  17. Machchhar, R.J.; Toller, C.N.K.; Bertoni, A.; Bertoni, M. Data-Driven Value Creation in Smart Product-Service System Design: State-of-the-Art and Research Directions. Comput. Ind. 2022, 137, 103606. [Google Scholar] [CrossRef]
  18. Lugnet, J.; Ericson, Å.; Larsson, T. Design of Product–Service Systems: Toward an Updated Discourse. Systems 2020, 8, 45. [Google Scholar] [CrossRef]
  19. Pezzotta, G.; Pirola, F.; Rondini, A.; Pinto, R.; Ouertani, M.-Z. Towards a Methodology to Engineer Industrial Product-Service System—Evidence from Power and Automation Industry. CIRP J. Manuf. Sci. Technol. 2016, 15, 19–32. [Google Scholar] [CrossRef]
  20. Brandstotter, M.; Haberl, M.; Knoth, R.; Kopacek, B. IT on Demand—Towards an Environmental Conscious Service System for Vienna (AT). In Proceedings of the 2003 EcoDesign 3rd International Symposium on Environmentally Conscious Design and Inverse Manufacturing, Tokyo, Japan, 8–11 December 2003; IEEE: Piscataway, NJ, USA, 2003; pp. 799–802. [Google Scholar]
  21. Manzini, E.; Vezzoli, C. A Strategic Design Approach to Develop Sustainable Product Service Systems: Examples Taken from the ‘Environmentally Friendly Innovation’ Italian Prize. J. Clean. Prod. 2003, 11, 851–857. [Google Scholar] [CrossRef]
  22. Baines, T.S.; Lightfoot, H.W.; Evans, S.; Neely, A.; Greenough, R.; Peppard, J.; Roy, R.; Shehab, E.; Braganza, A.; Tiwari, A.; et al. State-of-the-Art in Product-Service Systems. Proc. Inst. Mech. Eng. Part B J. Eng. Manuf. 2007, 221, 1543–1552. [Google Scholar] [CrossRef] [Green Version]
  23. Mont, O. Clarifying the Concept of Product-Service System. J. Clean. Prod. 2002, 10, 237–245. [Google Scholar] [CrossRef]
  24. Boucher, X.; Pezzotta, G.; Pirola, F.; Wiesner, S. Digital Technologies to Support Lifecycle Management of Smart Product-Service Solutions. Comput. Ind. 2022, 141, 103691. [Google Scholar] [CrossRef]
  25. Rondini, A.; Tornese, F.; Gnoni, M.G.; Pezzotta, G.; Pinto, R. Hybrid Simulation Modelling as a Supporting Tool for Sustainable Product Service Systems: A Critical Analysis. Int. J. Prod. Res. 2017, 55, 6932–6945. [Google Scholar] [CrossRef]
  26. Kuo, T.C. Simulation of Purchase or Rental Decision-Making Based on Product Service System. Int. J. Adv. Manuf. Technol. 2011, 52, 1239–1249. [Google Scholar] [CrossRef]
  27. Gebauer, H.; Fleisch, E.; Friedli, T. Overcoming the Service Paradox in Manufacturing Companies. Eur. Manag. J. 2005, 23, 14–26. [Google Scholar] [CrossRef]
  28. Yan, K.; Cheng, T.C.E.; Li, G.; Wei, Z. Overcoming the Service Paradox by Leveraging Organizational Design and Cultural Factors: A Combined Configuration and Contingency Approach. IEEE Trans. Eng. Manag. 2019, 68, 498–512. [Google Scholar] [CrossRef]
  29. Ardolino, M.; Rapaccini, M.; Saccani, N.; Gaiardelli, P.; Crespi, G.; Ruggeri, C. The Role of Digital Technologies for the Service Transformation of Industrial Companies. Int. J. Prod. Res. 2017, 56, 2116–2132. [Google Scholar] [CrossRef]
  30. Barravecchia, F.; Franceschini, F.; Mastrogiacomo, L.; Zaki, M. Research on Product-Service Systems: Topic Landscape and Future Trends. J. Manuf. Technol. Manag. 2021, 32, 208–238. [Google Scholar] [CrossRef]
  31. Pirola, F.; Boucher, X.; Wiesner, S.; Pezzotta, G. Digital Technologies in Product-Service Systems: A Literature Review and a Research Agenda. Comput. Ind. 2020, 123, 103301. [Google Scholar] [CrossRef]
  32. Chen, X.; Despeisse, M.; Johansson, B. Environmental Sustainability of Digitalization in Manufacturing: A Review. Sustainability 2020, 12, 10298. [Google Scholar] [CrossRef]
  33. Lichtenthaler, U. Digitainability: The Combined Effects of the Megatrends Digitalization and Sustainability. J. Innov. Manag. 2021, 9, 64–80. [Google Scholar] [CrossRef]
  34. Opazo-Basáez, M.; Vendrell-Herrero, F.; Bustinza, O.F. Uncovering Productivity Gains of Digital and Green Servitization: Implications from the Automotive Industry. Sustainability 2018, 10, 1524. [Google Scholar] [CrossRef] [Green Version]
  35. Marques, P.; Cunha, P.F.; Valente, F.; Leitão, A. A Methodology for Product-Service Systems Development. In Procedia CIRP; Elsevier: Amsterdam, The Netherlands, 2013; Volume 7, pp. 371–376. [Google Scholar]
  36. Tran, T.A.; Park, J.Y. Development of Integrated Design Methodology for Various Types of Product—Service Systems. J. Comput. Des. Eng. 2014, 1, 37–47. [Google Scholar] [CrossRef] [Green Version]
  37. Jiang, S.; Feng, D.; Lu, C.; Li, J.; Chai, H. Research on the Construction of the Spiral Evolutionary Design Methodology for a Product Service System Based on Existing Products. Proc. Inst. Mech. Eng. Part B J. Eng. Manuf. 2020, 234, 825–839. [Google Scholar] [CrossRef]
  38. Fani, V.; Pirola, F.; Bindi, B.; Bandinelli, R.; Pezzotta, G. Design Product-Service Systems by Using a Hybrid Approach: The Fashion Renting Business Model. Sustainability 2022, 14, 5207. [Google Scholar] [CrossRef]
  39. Won, J.H.; Kim, Y.S.; Lee, J.H.; Hong, Y.S. Association of Product-Service Systems Design Concepts with Business Models and Their Evaluation Method. In Proceedings of the 2014 International Conference on Engineering, Technology and Innovation: Engineering Responsible Innovation in Products and Services, ICE 2014, Bergamo, Italy, 23–25 June 2014. [Google Scholar]
  40. Oh, S.; Hong, Y.S.; Lee, J.; Kim, Y.S. An Evaluation Method for Business Models in Product-Service Systems Design. In Proceedings of the Design Society, ICED21, Gothenburg, Sweden, 16–20 August 2021. [Google Scholar]
  41. Gnoni, M.G.; Mossa, G.; Mummolo, G.; Tornese, F.; Verriello, R. Supporting Circular Economy through Use-Based Business Models: The Washing Machines Case. Procedia CIRP 2017, 64, 49–54. [Google Scholar] [CrossRef]
  42. Erguido, A.; Márquez, A.C.; Castellano, E.; Parlikad, A.K.; Izquierdo, J. Asset Management Framework and Tools for Facing Challenges in the Adoption of Product-Service Systems. IEEE Trans. Eng. Manag. 2019, 69, 2693–2706. [Google Scholar] [CrossRef] [Green Version]
  43. Scapens, R.W. Researching Management Accounting Practice: The Role of Case Study Methods. Br. Account. Rev. 1990, 22, 259–281. [Google Scholar] [CrossRef]
  44. Yin, R.K. Case Study Research: Design and Methods; Applied Social Research Methods; SAGE Publications: Thousand Oaks, CA, USA, 2009; ISBN 978-1-4129-6099-1. [Google Scholar]
  45. Teegavarapu, S.; Summers, J.D.; Mocko, G.M. Case Study Method for Design Research: A Justification. In Proceedings of the Volume 4: 20th International Conference on Design Theory and Methodology; Second International Conference on Micro- and Nanosystems, Milan, Italy, 27–30 July 2015; ASMEDC: Brooklyn, NY, USA, 2008; pp. 495–503. [Google Scholar]
  46. Pirola, F.; Pezzotta, G.; Amlashi, D.M.; Cavalieri, S. Design and Engineering of Product-Service Systems (PSS): TheSEEM Methodology and Modeling Toolkit. In Domain-Specific Conceptual Modeling; Springer: Cham, Switzerland, 2022; pp. 385–407. [Google Scholar]
  47. Pruitt, J.S.; Adlin, T. 1—THE NEXT FRONTIER FOR USER-CENTERED DESIGN: Making User Representations More Usable. In The Persona Lifecycle; Pruitt, J.S., Adlin, T., Eds.; Interactive Technologies; Morgan Kaufmann: San Francisco, CA, USA, 2006; pp. 2–45. ISBN 978-0-12-566251-2. [Google Scholar]
  48. Chen, Y.; Ye, C.; Liu, B.; Kang, R. Status of FMECA Research and Engineering Application. In Proceedings of the IEEE 2012 Prognostics and System Health Management Conference, PHM-2012, Beijing, China, 23–25 May 2012; IEEE: Piscataway, NJ, USA, 2012; pp. 1–9. [Google Scholar]
  49. Aagesen, G.; Krogstie, J. BPMN 2.0 for Modeling Business Processes. In Handbook on Business Process Management 1; Springer: Berlin/Heidelberg, Germany, 2015; pp. 219–250. [Google Scholar]
  50. Pezzotta, G.; Pirola, F.; Sala, R.; Margarito, A.; Pina, P. Identify New PSS Concepts: The Product Service Concept Tree Tool. In Enterprise Interoperability; John Wiley & Sons, Inc.: New York, NY, USA, 2018; pp. 367–372. [Google Scholar]
Figure 1. Service Engineering Methodology for Smart PSS (SEEM-Smart).
Sustainability 15 00064 g001
Figure 2. Personal Model of the distributor.
Sustainability 15 00064 g002
Figure 3. Criticality matrix.
Sustainability 15 00064 g003
Figure 4. Excerpt of the FMECA analysis of the dishwasher.
Sustainability 15 00064 g004
Figure 5. Most critical components from the FMECA analysis for the dishwasher.
Sustainability 15 00064 g005
Figure 6. Extract of BPMN 2.0 of the as-is Alpha’s technical assistance process related to the handling of calls from distributors.
Sustainability 15 00064 g006
Figure 7. Product-Service Concept tree visualization.
Sustainability 15 00064 g007
Figure 8. Scheme of the platform’s function and process.
Sustainability 15 00064 g008
Figure 9. Extract of BPMN 2.0 of the to-be Alpha’s technical assistance process.
Sustainability 15 00064 g009
Figure 10. Proof of concept of the new platform. The figure shows what the distributors are likely to find in the platform, once they log in with their private account.
Sustainability 15 00064 g010
Table 1. Definitions for acronyms used in the PSCT.
PSCT LevelAcronymDescription
NeedN1Enhance service interventions
WishesW1Better planning of interventions
W2Clear knowledge of the product
W3Reduction of intervention time
W4Transparent and accessible service support
SolutionsS1Establishment of a preventive maintenance contract to offer to end users
S2Providing warnings when preventive maintenance is necessary
S3Remote monitoring system, which allows to geolocalize the interventions and categorize them according to the severity of the warnings
S4Distributors data management with a guided diagnostic procedure (e.g., checklist for troubleshooting)
S5List of authorized installers
S6Easy retrieval of instructions/manuals/technical information of the product that can direct interventions
S7Online system for spare parts and products purchase and tracking
S8Ticketing management for assistance (exploitable also for internal analysis of needs)
ResourcesR1Platform for data collection and analysis
R2Company website providing the list of approved dealers and visual instructions
R3Simple and integrated e-commerce platform with products and spare parts
R4Internal ticketing system
R5IoT sensor to collect data to remotely monitor critical components
Table 2. Analysis of actual process criticalities and definition of the improvement actions through the platform.
TypeCriticality DescriptionImprovement
InternalManual internal priority call managementThe platform will provide the customer a priority and a severity index for the failure
InternalAbsence of a single way to contact the service, but it can be reached via phone or through the switchboardThe platform will be the primary channel for accessing the service
InternalThe service department manually fills an excel file with customer and intervention detailsCustomers will complete the necessary information on the platform, saving the company service time
ExternalLack of assistance with fault analysis both for the distributor and the internal service departmentThe platform will have a guided checklist based on the FMECA analysis
ExternalTechnical information on machines not easy to retrieve from the website or manualsThe platform will include a document management system to assist distributors in obtaining the necessary information
ExternalThe distributors do not have information about the return statusThe platform will enable the distributor to track the status of the orders for both spare parts and items returned
Table 3. Desired functionalities of the platform.
FunctionalitiesLevel
First level
(a)
Consultation of the list of its installed machines, even those not connected.
(b)
Consultation of machine parameterization (e.g., temperature), because dealers often take universal machines and then install them with different parameters according to the customer.
(c)
Data analysis of the machine performance (continuous, in the case of connected machines).
(d)
Repository of interventions made, including spare parts (serial, issue, part number), and once entered make a notification (to start the component warranty).
(e)
Warranty management, once a spare part is entered or a new machine is installed, trigger the warranty start notification.
(f)
Ability to manage vendor parts (example, see parts in stock), with optional ordering link.
(g)
Receive scheduled/controlled maintenance notifications (from connected machine data analysis or instructions/suggestions).
(h)
Support in problems diagnosis (check list to identify the problem).
(i)
Support in repair (check lists or videos, guides, or other materials on interventions to solve the problem).
(j)
Support in parts management, more specifically in identifying the part number of the part to be replaced.
(k)
Fast retrieval of documentation (manuals, etc.).
(l)
Have a space for comments/messaging.
Support the distributor in the definition of new service solutions
Second level
(i)
Support in handling requests, manage data of callers/emailers (installer and/or end customer).
(ii)
Analysis of the issues and machine fleet, with a view to reporting.
(iii)
Manage returns (components and machine).
(iv)
Data analysis of the machine performance (continuous, in the case of connected machines) with a view to product improvement.
  • Optimization of the Alpha’s service process
  • Optimization of the product (e.g., more sustainable)
Disclaimer/Publisher’s Note: The statements, opinions and data contained in all publications are solely those of the individual author(s) and contributor(s) and not of MDPI and/or the editor(s). MDPI and/or the editor(s) disclaim responsibility for any injury to people or property resulting from any ideas, methods, instructions or products referred to in the content.

