Article

Experimental Investigation of Water-Retaining and Unsaturated Infiltration Characteristics of Loess Soils Imbued with Microplastics

1
School of Civil Engineering and Transportation, Hohai University, Nanjing 210098, China
2
Key Laboratory of Geomechanics and Embankment Engineering, Hohai University, Nanjing 210098, China
*
Author to whom correspondence should be addressed.
Sustainability 2023, 15(1), 62; https://doi.org/10.3390/su15010062
Submission received: 22 October 2022 / Revised: 30 November 2022 / Accepted: 13 December 2022 / Published: 21 December 2022
(This article belongs to the Topic Microplastics Pollution)

Abstract

:
Microplastics are abundant in agricultural soils and have significant impacts on rainfall infiltration and soil water-retaining capacity. To explore the effect of microplastics on agricultural soil permeability by simulating the rainfall irrigation process, a one-dimensional vertical soil column rainfall infiltration test device was used to study the unsaturated infiltration characteristics of loess soil imbued with microplastics under rainfall conditions. The following conclusions could be obtained: the microplastic content (q), the microplastic particle size (p), and the soil density (γ) have effects on rainfall infiltration; the soil water-retaining capacity would be weakened owing to the existence of microplastics; and intermittent rainfall is preferred in agricultural irrigation. Finally, the permeability coefficient (k) and average flow rate (V) of the unsaturated soil are deduced together, and the relationship between the permeability coefficient (k) and the matrix suction (ψ) of the unsaturated loess soil containing microplastics is calculated by an example, proving good consistency between the experimental results and theoretical calculations. Microplastics represent negative effects on rainfall infiltration and soil water retention, so it is recommended to dispose of them.

1. Introduction

As a new type of pollutant found globally, microplastics are distributed from ocean to land, even at the North and South Poles [1]. Studies have shown that microplastics can change soil properties and impact plant growth [2]. Several studies have suggested that more microplastics exist on land than in the ocean [3,4] and that microplastics are imported from land to the ocean [5,6,7]. The sources of microplastics in agricultural soil are diverse and include the employment of plastic film and mulch, crop planting and fertilizing, irrigation water, the utilization of sludge, and atmospheric deposition [8,9,10]. The agricultural soil moisture cycle generally refers to the migration and transformation of rainwater, irrigation water, and steam water in unsaturated soil regions above groundwater. Microplastics are characterized by their small size, strong hydrophobicity, and relatively stable properties. Their enrichment in soil participates in the water cycle of agricultural soil and affects the water-retaining and unsaturated infiltration of agricultural soil, which directly affects the usage of water resources and plant growth, especially in areas affected by soil erosion [11,12,13]. As the soil type with the largest distribution area on the Loess Plateau, loess soil areas are experiencing the most serious soil erosion in China, and the change in their water-retaining ability and water permeability is of great importance for crop yields. Water resources are very significant in these areas, and it is of great necessity to make full use of rain.
Currently, research on microplastics has focused on microplastic traceability [14,15,16,17], microplastic distribution [18,19,20], microplastic transportation mechanisms [21,22,23,24,25], microplastic enrichment principles [14,17,26,27], and microplastic management methods [28,29,30,31,32]. There are few studies on the effects of microplastics on soil water-retaining ability and water permeability, and most have focused on measuring the coefficient of permeability by the hydrostatic head method, which reflects the change in soil water permeability in the presence or absence of microplastics [11]. However, the coefficient of permeability obtained by the hydrostatic head method represents the permeability coefficient of saturated soil; agricultural soil is normally in an unsaturated state, and the hydrostatic head method cannot reflect the changing water permeability and water-retaining ability of agricultural soil during the infiltration process [33,34]. Meanwhile, rainfall infiltration of soil is an unsaturated process, and the factors affecting rainfall infiltration embrace two aspects. One is rainfall conditions, such as rainfall type, intensity, and duration. The other is soil properties, such as soil type, infiltration characteristics, and initial moisture content [35,36]. With regard to the abundance of microplastics, studies on rainfall infiltration and the unsaturated permeability coefficient curves of soils containing microplastics are still lacking.
This study takes loess soils as the research object to explore the water-retaining and unsaturated infiltration characteristics of soil imbued with microplastics under rainfall conditions. To simulate the rainfall irrigation process, experiments based on the wetting front advancing method employ a one-dimensional vertical soil column rainfall infiltration test device to study the influence of the microplastic content (q), microplastic particle size (p), soil bulk density (γ), and intermittent rainfall ratio (i) on loess soil rainfall infiltration by analyzing the infiltration rate (λ), cumulative infiltration amount (Q), wetting peak depth (H), and average conductivity (C). The change law of volumetric moisture content (θ) at monitoring points could reflect soil water-retaining ability. Combined with the effective fitting of the power function of the wet peak bulk density advancing curve, the permeability coefficient (k) and average flow rate (V) of the unsaturated soil are deduced together and the relationship between the permeability coefficient (k) and the matrix suction (ψ) of the unsaturated loess soil with microplastics is calculated by an example.

2. Materials and Test Methods

2.1. Materials

Loess soils are weakly developed soils and easily damaged. Loess soils are typical soils of the Loess Plateau. Particle size distribution analyses carried out on the studied sample reveal the following composition: 75.15% sand (particle size range 0.02~2 mm), 19.32% silt (particle size range 0.002~0.02 mm), and 5.53% clay (particle size range less than 0.002 mm) according to the international classification system of soil texture. The grain-size distribution curve is in A1 of the Appendix A. The maximum dry density and the minimum dry density of selected loess soil in the Shanbei area were 1.8 g/cm3 and 1.5 g/cm3 as measured by experiments. White spherical polystyrene plastics with good sorting and stability were used as microplastics for testing. The density of the spherical polystyrene plastics was 1.06 g/cm3, with a particle size deviation of less than 10%.
The one-dimensional vertical rainfall infiltration device consists of 4 parts, as shown in Figure 1a: a soil column, rainfall system (a peristaltic pump and a rainmaker), rainfall control system (a marsh flask), and data-acquisition equipment (EC-5 soil moisture sensors and a MIK-R9600 paperless recorder). A 140 mm inner diameter, 150 mm external diameter, 295 mm high plexiglass column was used as a container for the soil samples. A drainage port was set at the lower end of the one-dimensional vertical soil column to facilitate drainage. A peristaltic pump was used to regulate the amount of water entering the rainmaker to control rainfall intensity. A rainmaker was employed to create even rainfall. Four EC-5 soil moisture sensors were inserted into the soil column to monitor the volumetric water content θ or conductivity of the soil over time. The soil moisture sensors were numbered #4, #3, #2, and #1 from the top to the bottom of the soil column. The generation of surface runoff occurred in the later period of rainfall. The tensiometers were employed to measure the soil matric suction (ψ). All data were recorded by the MIK-R9600 paperless recorder automatically. The apparatus structure diagram of the rainfall infiltration test device is shown in Figure 1b.

2.2. Test Scheme and Experiment Procedure

The study designed 13 sets of experiments with different microplastic content (q), microplastic particle size (p), soil bulk density (γ), and intermittent rainfall ratio (i) and the test scheme is shown below (Table 1). The rainfall intensity was set to 20 mm/h, which referred to the real rainfall situation in the local area, the same as the rain interval ratio (i). The i values were set to 1:2, 1:1, and 2:1, with 30 min for rain and 60 min for rest, 30 min for rain and 30 min for rest, and 60 min for rain and 30 min for rest, respectively.
The study assessed the influence of the 4 parameters above by analyzing the infiltration rate (λ), cumulative infiltration amount (Q), wetting peak height (H), and the change law of volumetric moisture content (θ) at monitoring points. The procedure includes 4 parts:
(1)
Prepare the device and fill the column with loess.
(2)
Ensure the rain interval ratio and adjust the rainfall system and the rainfall control system.
(3)
Strat the experiment until soil enters the saturated infiltration stage.
(4)
Collect data and undertake analysis.

2.3. Device Preparation

The density flotation method was used to wash the soil sample many times before the experiments to remove microplastics that had already been present in the soil sample began, and then the sample was dried. Invasive substances, such as litter and plant rhizomes in the soil sample, were removed to avoid affecting. The washed soil particles were stored in a cool and dry place for later use. The structure and porosity of loess were not disturbed during experiments. Spherical microplastics of different particle sizes were prepared in advance for standby application.
The samples were divided into 6 parts after weighing the soil mass required for each test. The soil column was filled and compacted in layers. Each layer of soil sample was shaved to ensure uniform sample loading and consistent compaction over the entire height to ensure soil homogeneity. Before loading the sample, a filter was attached to the water outlet at the bottom of the soil column to prevent the soil sample from flowing out of the water outlet and damaging the soil sample. Each time a soil sample layer was loaded, a soil moisture sensor and tensiometer were inserted in a timely fashion, especially the tensiometer. If the tensiometer was left in the air for too long, vaporization occurred. All apparatuses were inserted slowly to prevent apparatus damage and soil disturbance during the process. The second layer was filled only when the data on the MIK-R9600 data paperless recorder were normal. In a similar fashion, the sample loading process was implemented until the soil reached the specified height.
During the test, the wetting peak height (H) was measured by a 50 cm steel ruler, which was measured every 5 min in the early stage, every 10 min in the middle stage, and every 20 min or 30 min in the later stage. In the later stage, when the accumulated water height reached the height required by the experiments, a Marsh flask was used to control the accumulated water height. The accumulated water height remained at 3 cm, which was used to simulate a state where the accumulated water height remained unchanged after the generation of surface runoff in the later period of rainfall. During the test, EC-5 moisture sensors and the MIK-R9600 paperless recorder collected data at a frequency of 1 data point per minute. The test environment temperature was relatively stable and remained at 26~27 °C.

3. Results and Discussions

3.1. Effect of Microplastic Contents q on Moisture Transportation

A parameter infiltration rate (λ) (unit: mm/min) is defined, which indicates the amount of water infiltrated per unit area of the soil surface per unit time. The cumulative infiltration amount (Q) (unit: mm) is the cumulative infiltration amount per unit area of the soil column from the beginning of rainfall to a certain time. The average conductivity (C) of soil is the variation in the wetting peak depth (Δh) in a certain period of time (Δt). An analysis of the test results from No. 1 to No. 5 are shown below.
The time–history curve of infiltration rate λ (Figure 2a) reflects the slope change in the cumulative infiltration amount (Q) time–history curve (Figure 2b), and the time–history curve of average conductivity (C) (Figure 2d) reflects the slope change in the wetting peak depth (H) time–history curve (Figure 2c) under conditions of different microplastic contents (q). The minimum infiltration rate (λmin) with a q value of 0.05% is larger than that of the blank experimental control group, while λmin with a q of 0.10%, 0.25%, and 0.50% is smaller than that of the blank experimental control group. Compared with the blank experiment control group, when q is 0.05%, the Q value is the largest, the time required for rainwater infiltration into the soil column bottom is the shortest, and the λ value continues to decline and fluctuates greatly. When q values are 0.10%, 0.25%, and 0.50%, the Q values gradually decrease with increasing q and all are smaller than the Q value of the blank experimental control group. With the increase in the content, the time required for rainwater infiltration into the bottom of the soil column gradually increased, and it was longer than that of the blank control group. Analyzing the minimum infiltration rate (λmin) (Figure 2a) and the time for rainwater infiltration into the bottom of the soil column (Figure 2b,c) compared with the blank experimental control group, it could be speculated that microplastics with q values of 0.05% promote rainwater infiltration, while microplastics with q values of 0.10%, 0.25%, and 0.50% hinder rainwater infiltration, and the content change does not affect the minimum infiltration ability. With increasing q values, the effect of blocking rainwater infiltration is stronger.
The soil sample with q of 0.05% did not represent stable infiltration, and the rainfall infiltration process showed no pressure infiltration or pressure infiltration. The rainfall infiltration shows three stages: no pressure infiltration, pressure infiltration, and saturated infiltration with regard to the q values of 0%, 0.1%, 0.25%, and 0.5%. According to Figure 2a,b and Table 1, in the no-pressure infiltration stage, the initial infiltration rates (λin) are constant and equal to the rainfall intensity. The water begins to accumulate on the soil column surface, and the surface soil enters a transient saturation state. The soil moisture content is low, and the matrix suction is large. The time–history curves represent slanted straight lines, and the average conductivity (C) is large, which means that rainwater is quickly absorbed and continuously transmitted to the interior of the soil. The no-pressure infiltration stage ends at T1 with the existence of the accumulation point as a symbol. In the pressure infiltration stage, the λ value gradually decays to a stable value with rainfall duration; that is, the infiltration rate (λst) is stable, and the water height on the soil column surface changes stepwise to a stable state. The soil mass on the surface transfers to a fully saturated state. The curves in Figure 2b show an upward convex shape. The increase in magnitude in wetting peak depth (H) also decreases gradually at the same time, and the C values begin to decrease rapidly with rainfall duration. The pressure stage ends at T2 with the existence of the saturated point as a symbol. In the saturated infiltration stage, the time–history curve of cumulative infiltration is a straight line, and its slope λ tends to be constant, which is the saturated infiltration rate (λsa) and is equal to the permeability coefficient of stable soil infiltration (λst = λsa = λmin). The soil column undergoes saturated infiltration, and the C value tends to be stable. According to Table 2, microplastics with a q of 0.05% promote rainfall infiltration, and the water accumulation time is much longer than that of the other test samples. For other microplastic content samples, the more q values there were, the earlier the water accumulation point and saturation point appeared.
The existence of polystyrene microplastics in soils could fill the soil particle skeletons to bond and block water, and polystyrene microplastics themselves have strong hydrophobicity. Current research [37,38,39,40] shows that soil particles are often regarded as completely hydrophilic solids. The contact angle of soil increases and soil particles represent hydrophobic properties owing to the addition of hydrophobic materials. Meanwhile, microplastics would fill pores of soil particles and decrease the soil permeability coefficient, representing blocking effects. The two effects are contradictory and would play a dominant role in different situations with the change in soil compactness. When p is constant and q is relatively small, the strong hydrophobicity of microplastics plays a dominant role. Microplastics promote water infiltration. With q increasing, microplastics compact soil particles, representing blocking effects overall. The blocking effects enhance as q increases.
To explore the soil water-retaining capacity, the volume moisture content measured as θ by EC-5 moisture sensors with different q values are analyzed below.
As shown in Figure 3, there is little difference in the time required for water to reach sensors #3 and #4. The time taken for water to reach sensors #1 and #2 is the shortest when q is 0.05%, while the time for water to transfer to sensors #1 and #2 gradually increases with increasing q values compared with other microplastic contents (q). The θmax values with different q values are all less than that of the blank experiment control group. With q values increasing, the peak soil moisture content (θmax) slightly decreases. Microplastics weaken the water-retaining capacity of loess soil due to the hydrophobic properties of microplastics.

3.2. Effect of Microplastic Particle Size p on Moisture Transportation

In this study, the microplastic content (q) is 0.25% and the soil bulk density (γ) is 1.57 g/cm3. By analyzing the test results from No. 4, No. 6, and No. 7, the results are shown below.
Similar to the analysis above, microplastics with a p of 3 μm were able to promote rainfall infiltration compared with the blank experimental control group. By supplementing rainwater infiltration tests (A2 of the Appendix A) with a p of 3 μm and a q of 0.00%, 0.05%, 0.10%, 0.25%, and 0.50%, no water may accumulate on the soil column surface for q values of 0.05%, 0.10%, and 0.25%, and the water accumulates on the surface for a q of 0.50%, indicating that with the decrease in p values, the q that promotes water infiltration increases, and the hydrophobic effect is obviously enhanced. Microplastics hinder water infiltration with p values of 5 μm and 8 μm. The microplastic amount with a p of 8 μm is less than that with a p of 5 μm, and the soil with a p of 8 μm is looser. The saturated infiltration rate is larger with a p of 8 μm. Therefore, microplastics with a p of 8 μm promote rainfall infiltration compared with microplastics with a p of 5 μm.
The soil sample with a p of 3 µm represents the no-pressure infiltration stage, while the rainfall infiltration shows no-pressure infiltration, pressure infiltration, and saturated infiltration with p values of 5 μm and 8 μm. According to Figure 4, the time–history curves of the cumulative infiltration amount (Q) with p values of 5 μm and 8 μm have intersections in the pressure infiltration stage. This means that the smaller the particle size of microplastics, the more conducive they are to rainwater infiltration in the pressure infiltration stage, while the larger the particle size of microplastics, the more favorable the rainwater infiltration in the saturated infiltration stage. As shown in Figure 4, significant differences appear in the saturated infiltration stage for curves with p values of 5 μm and 8 μm, indicating that the saturated infiltration stage of rainfall infiltration was severely affected by microplastic particle sizes.
Current research [39] shows that there exist three types of soil particles: large, medium, and small. The soil permeability coefficient is greatly affected by large pores compared with medium and small pores. When q is constant and p is small, microplastics fill few large pores of soil particles and present hydrophobic properties to promote water infiltration. Otherwise, with p increasing, more and more large pores are filled by microplastics, reducing the soil permeability coefficient. The existence of microplastics represents blocking effects. The blocking effects enhance as p increases. By controlling the mass of microplastics as constant, if p decreases, the amount of microplastics that compact soil particles should increase and blocking effects should increase. This explains the microplastic content range that promotes infiltration increases as p decreases.
To explore the soil water-retaining capacity, the volume moisture content measured θ by EC-5 moisture sensors with different p values are analyzed below.
As shown in Figure 5, the θmax values with different p values are all less than that of the blank experiment control group. There are few differences in θmax with different p values. This indicates that the existence of microplastics reduces soil water-retaining capacity. The effects on soil water-retaining capacity change slightly as p increases.

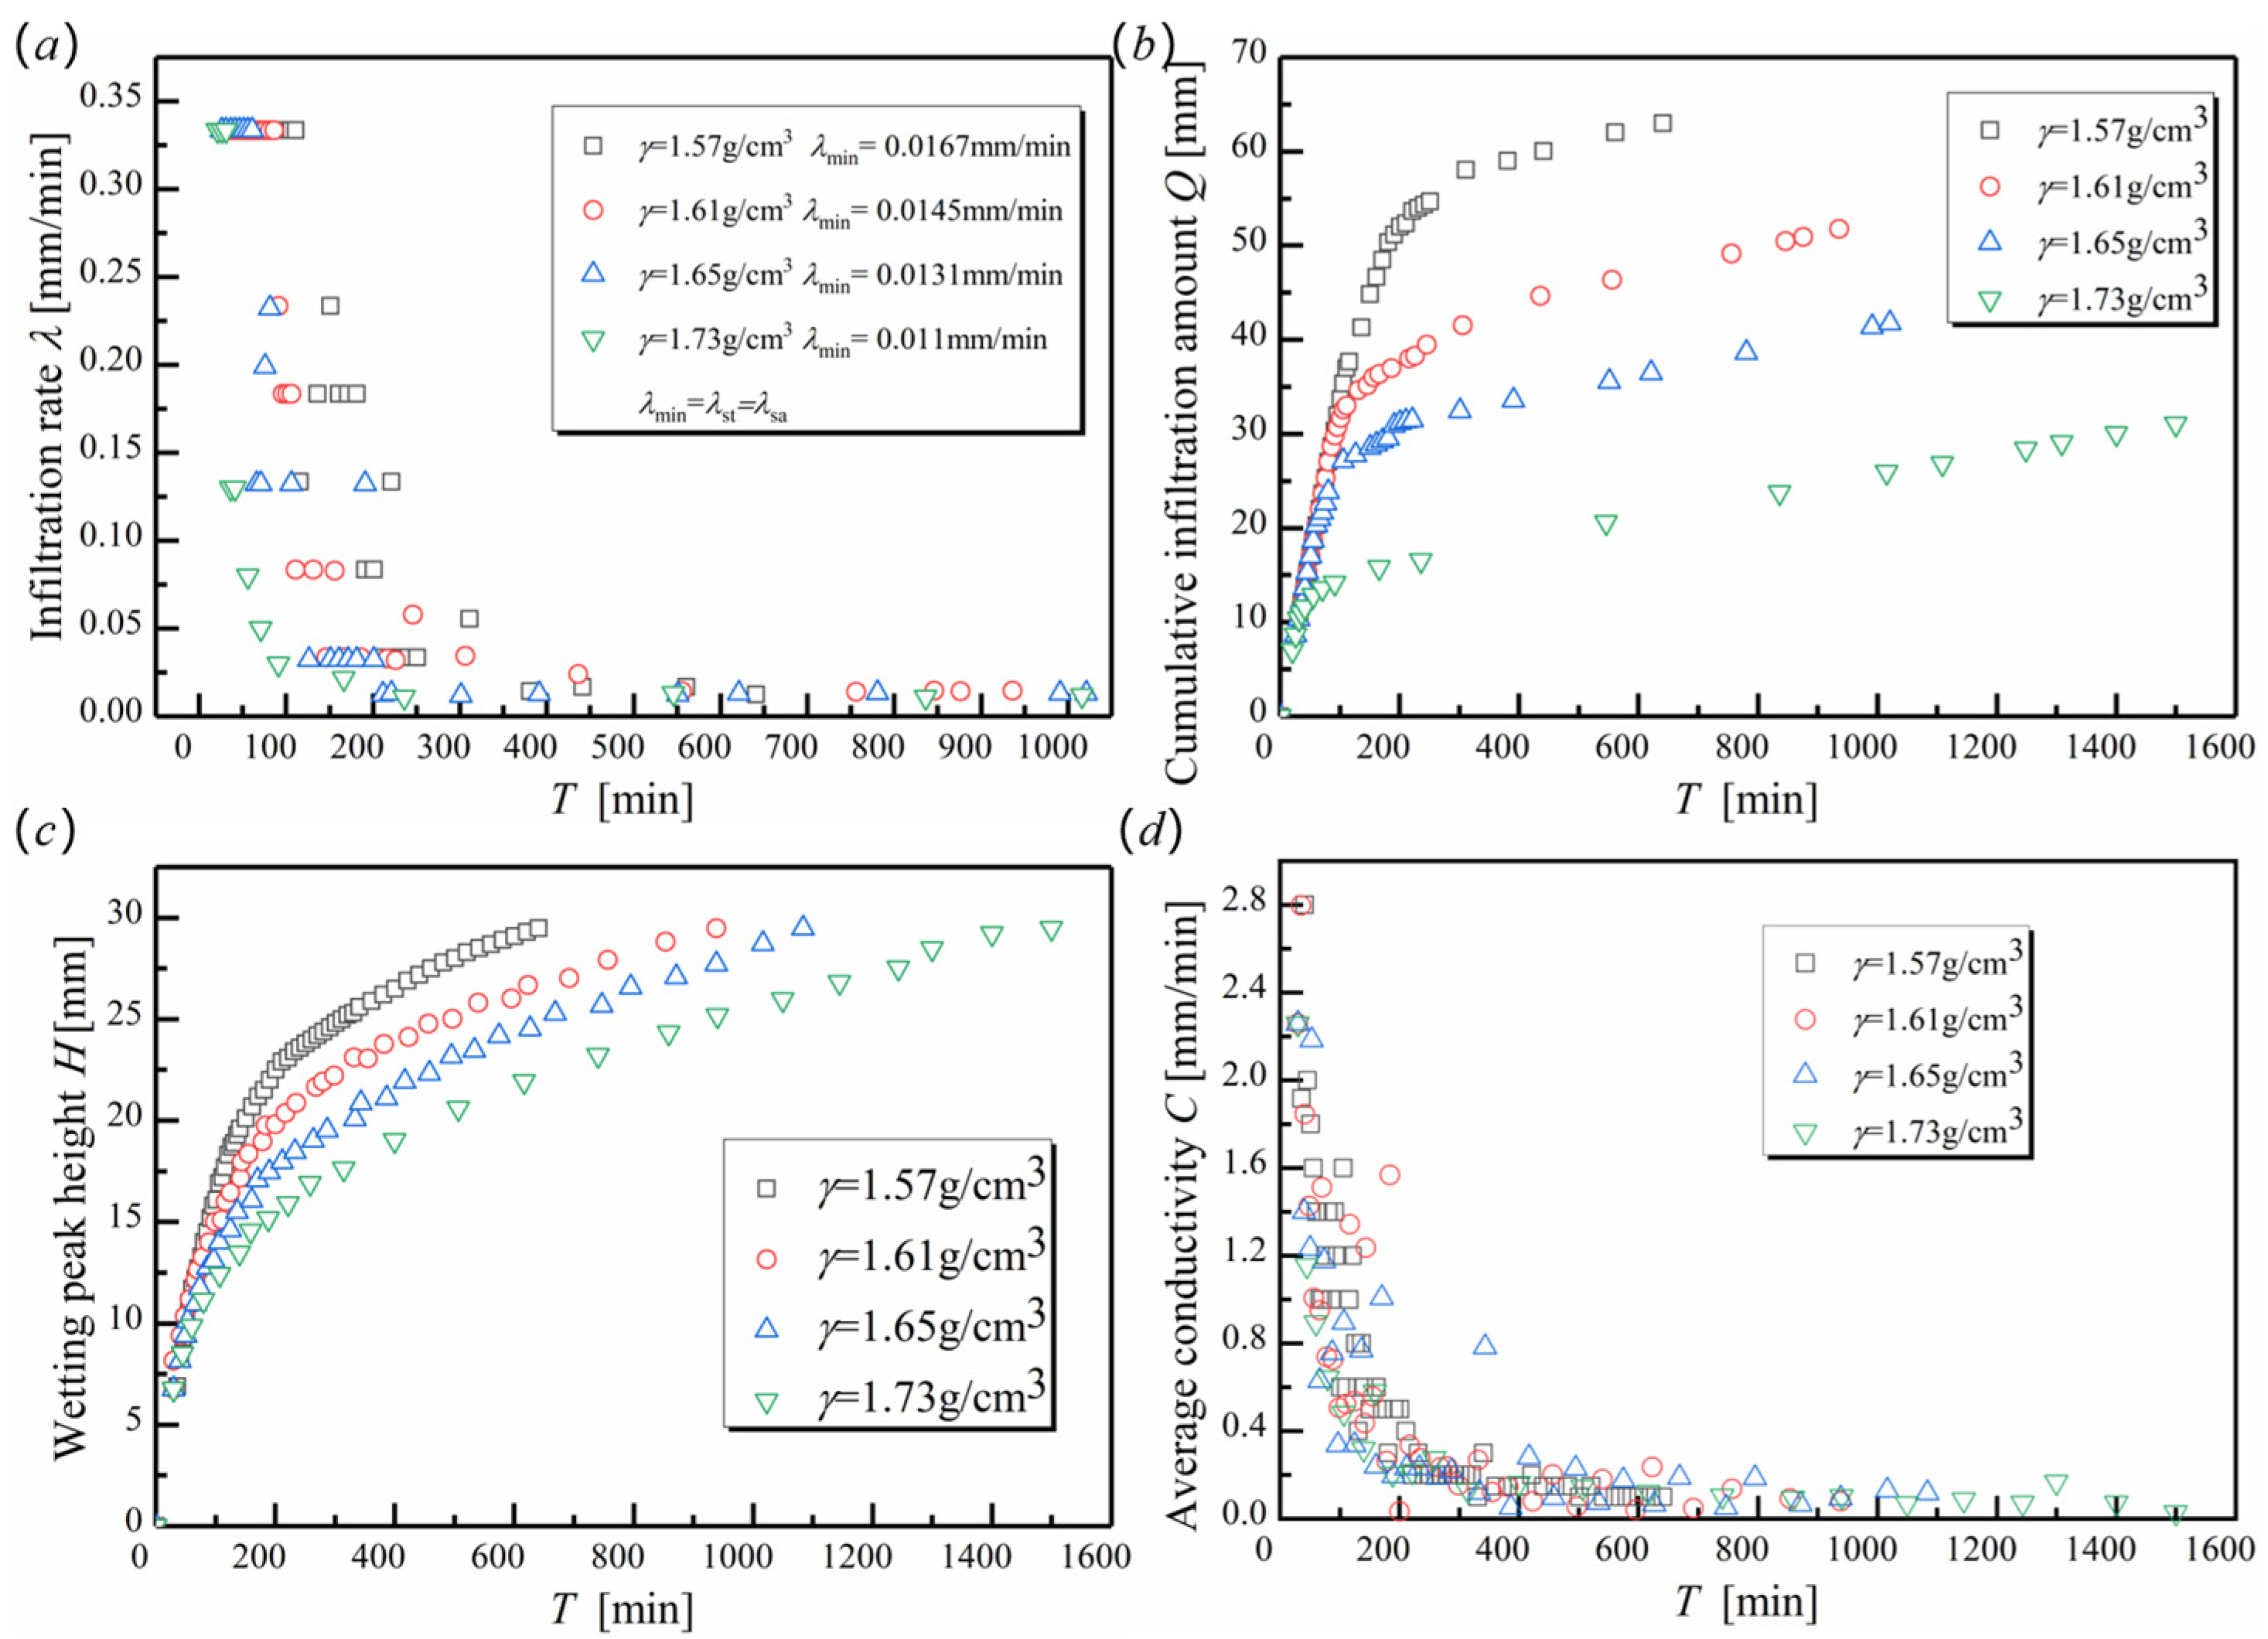
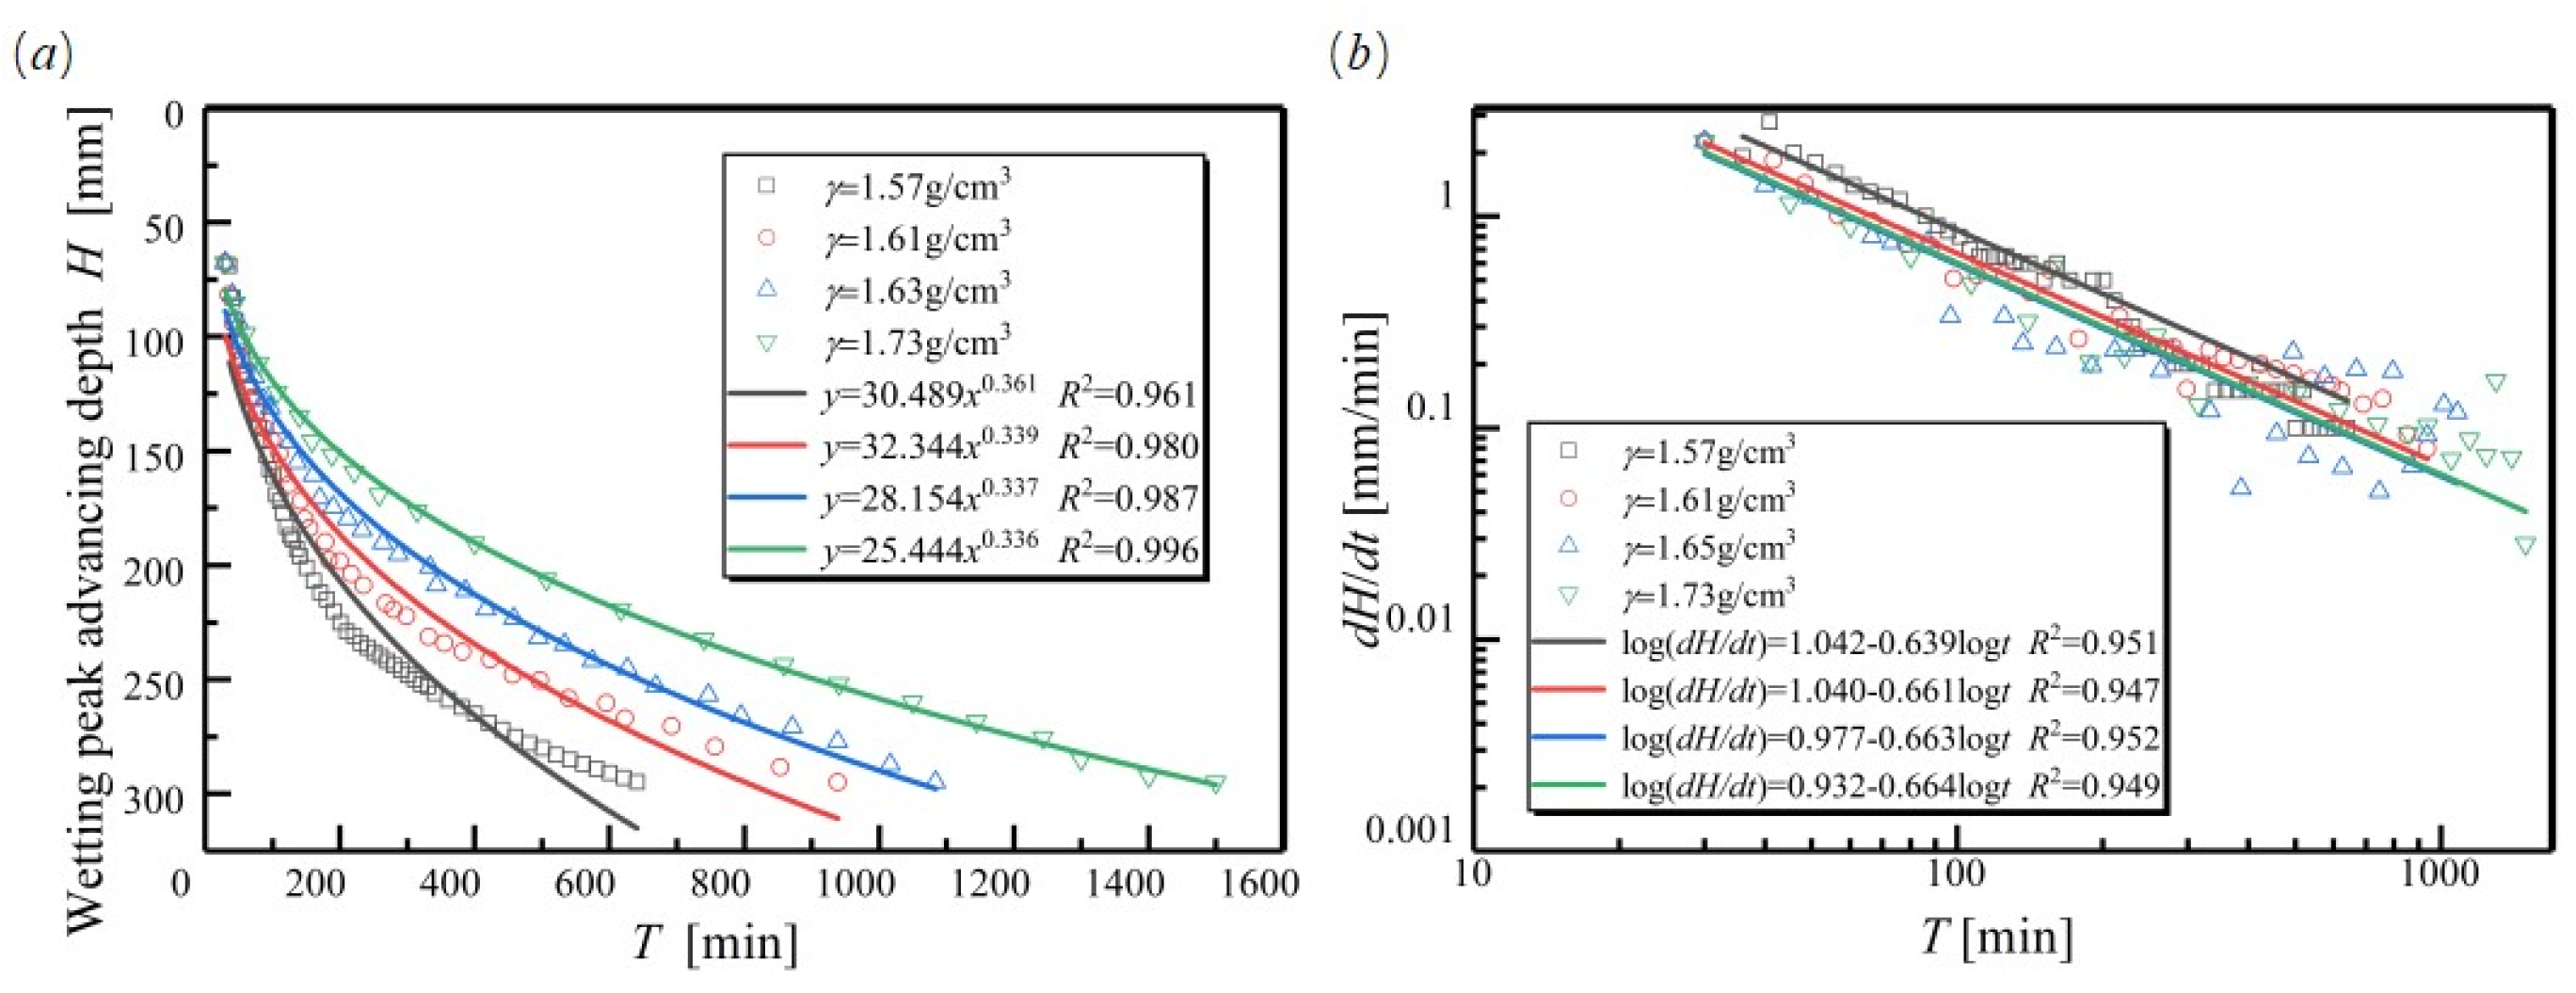
3.3. Effect of Soil Bulk Density γ on Moisture Transportation

In this study, the microplastic content (q) is 0.25% and the microplastic particle size (p) is 5 μm. By analyzing the test results from No. 4, No. 8, No. 9, and No. 10, the results are shown below.
As shown in Figure 6, with increasing γ, the stable infiltration rate (λst) gradually decreases. This phenomenon is because the soil particles become more compact, the soil particle pores are smaller, and the soil infiltration rate (λ) is lower if the γ values increase. With the increase in γ, the cumulative infiltration amount (Q) gradually decreases. The rainfall infiltration shows three stages: no-pressure infiltration, pressure infiltration, and saturated infiltration. Meanwhile, with the increase in γ, the duration of the no-pressure stage gradually decreases, and the duration of the pressure stage also gradually shortens. The rainfall infiltration quickly transitions to the saturated infiltration stage. With the increase in γ, the time for rainwater to reach the soil column bottom gradually increases, and the saturated infiltration rate (λsa) gradually decreases. This is because as γ increases, the soil is denser, the porosity is smaller, and the amount of water passing through is less. It should also be noted that there is a good linear relationship between λsa and γ (A3 of the Appendix A).
To explore the soil water-retaining capacity, the volume moisture content measured as θ by EC-5 moisture sensors with different γ values are analyzed below.
As shown in Figure 7, at the beginning, the rising time of θ at #1 and #2 is roughly the same, but with the increase in soil depth and γ, the rising time of θ is slightly delayed, and the time difference between the increase in θ at #3 and #4 also gradually increases. The θmax values with different γ values are all less than that of the blank experiment control group. The soil peak moisture content (θmax) with a relatively large bulk density (γ) would decrease slightly. The existence of microplastics would weaken the soil water-retaining capacity.
The time–history curve of wetting peak height (H) with different soil bulk densities (γ) could be fitted by a power function, which shows significant scale symmetry:
H = a t b
Taking Equation (1) by the derivative of both sides with respect to time, the formula of wetting peak advancing velocity can be obtained:
d H d t = a b t b 1
To explore the physical meanings of parameters a and b, we take the derivative of Equation (2) with respect to time and take the logarithm of both sides of this equation:
log ( d H d t ) = log ( a b ) + ( b 1 ) log t
where dH/dt is the advancing speed of the wetting peak; log(ab) is related to the initial advancing speed of the wetting peak; and b − 1 is the slope of Equation (3) and is related to the acceleration of the wetting peak advance. Combined with Equation (1), the time–history curves of the wetting peak advancing depth H and the wetting peak advancing speed dH/dt are shown in Figure 8.
It could be speculated that there is a linear relationship between the wetting peak advancing speed and time, which could be used to calculate the unsaturated soil permeability coefficient proposed with microplastics in Section 4.2.

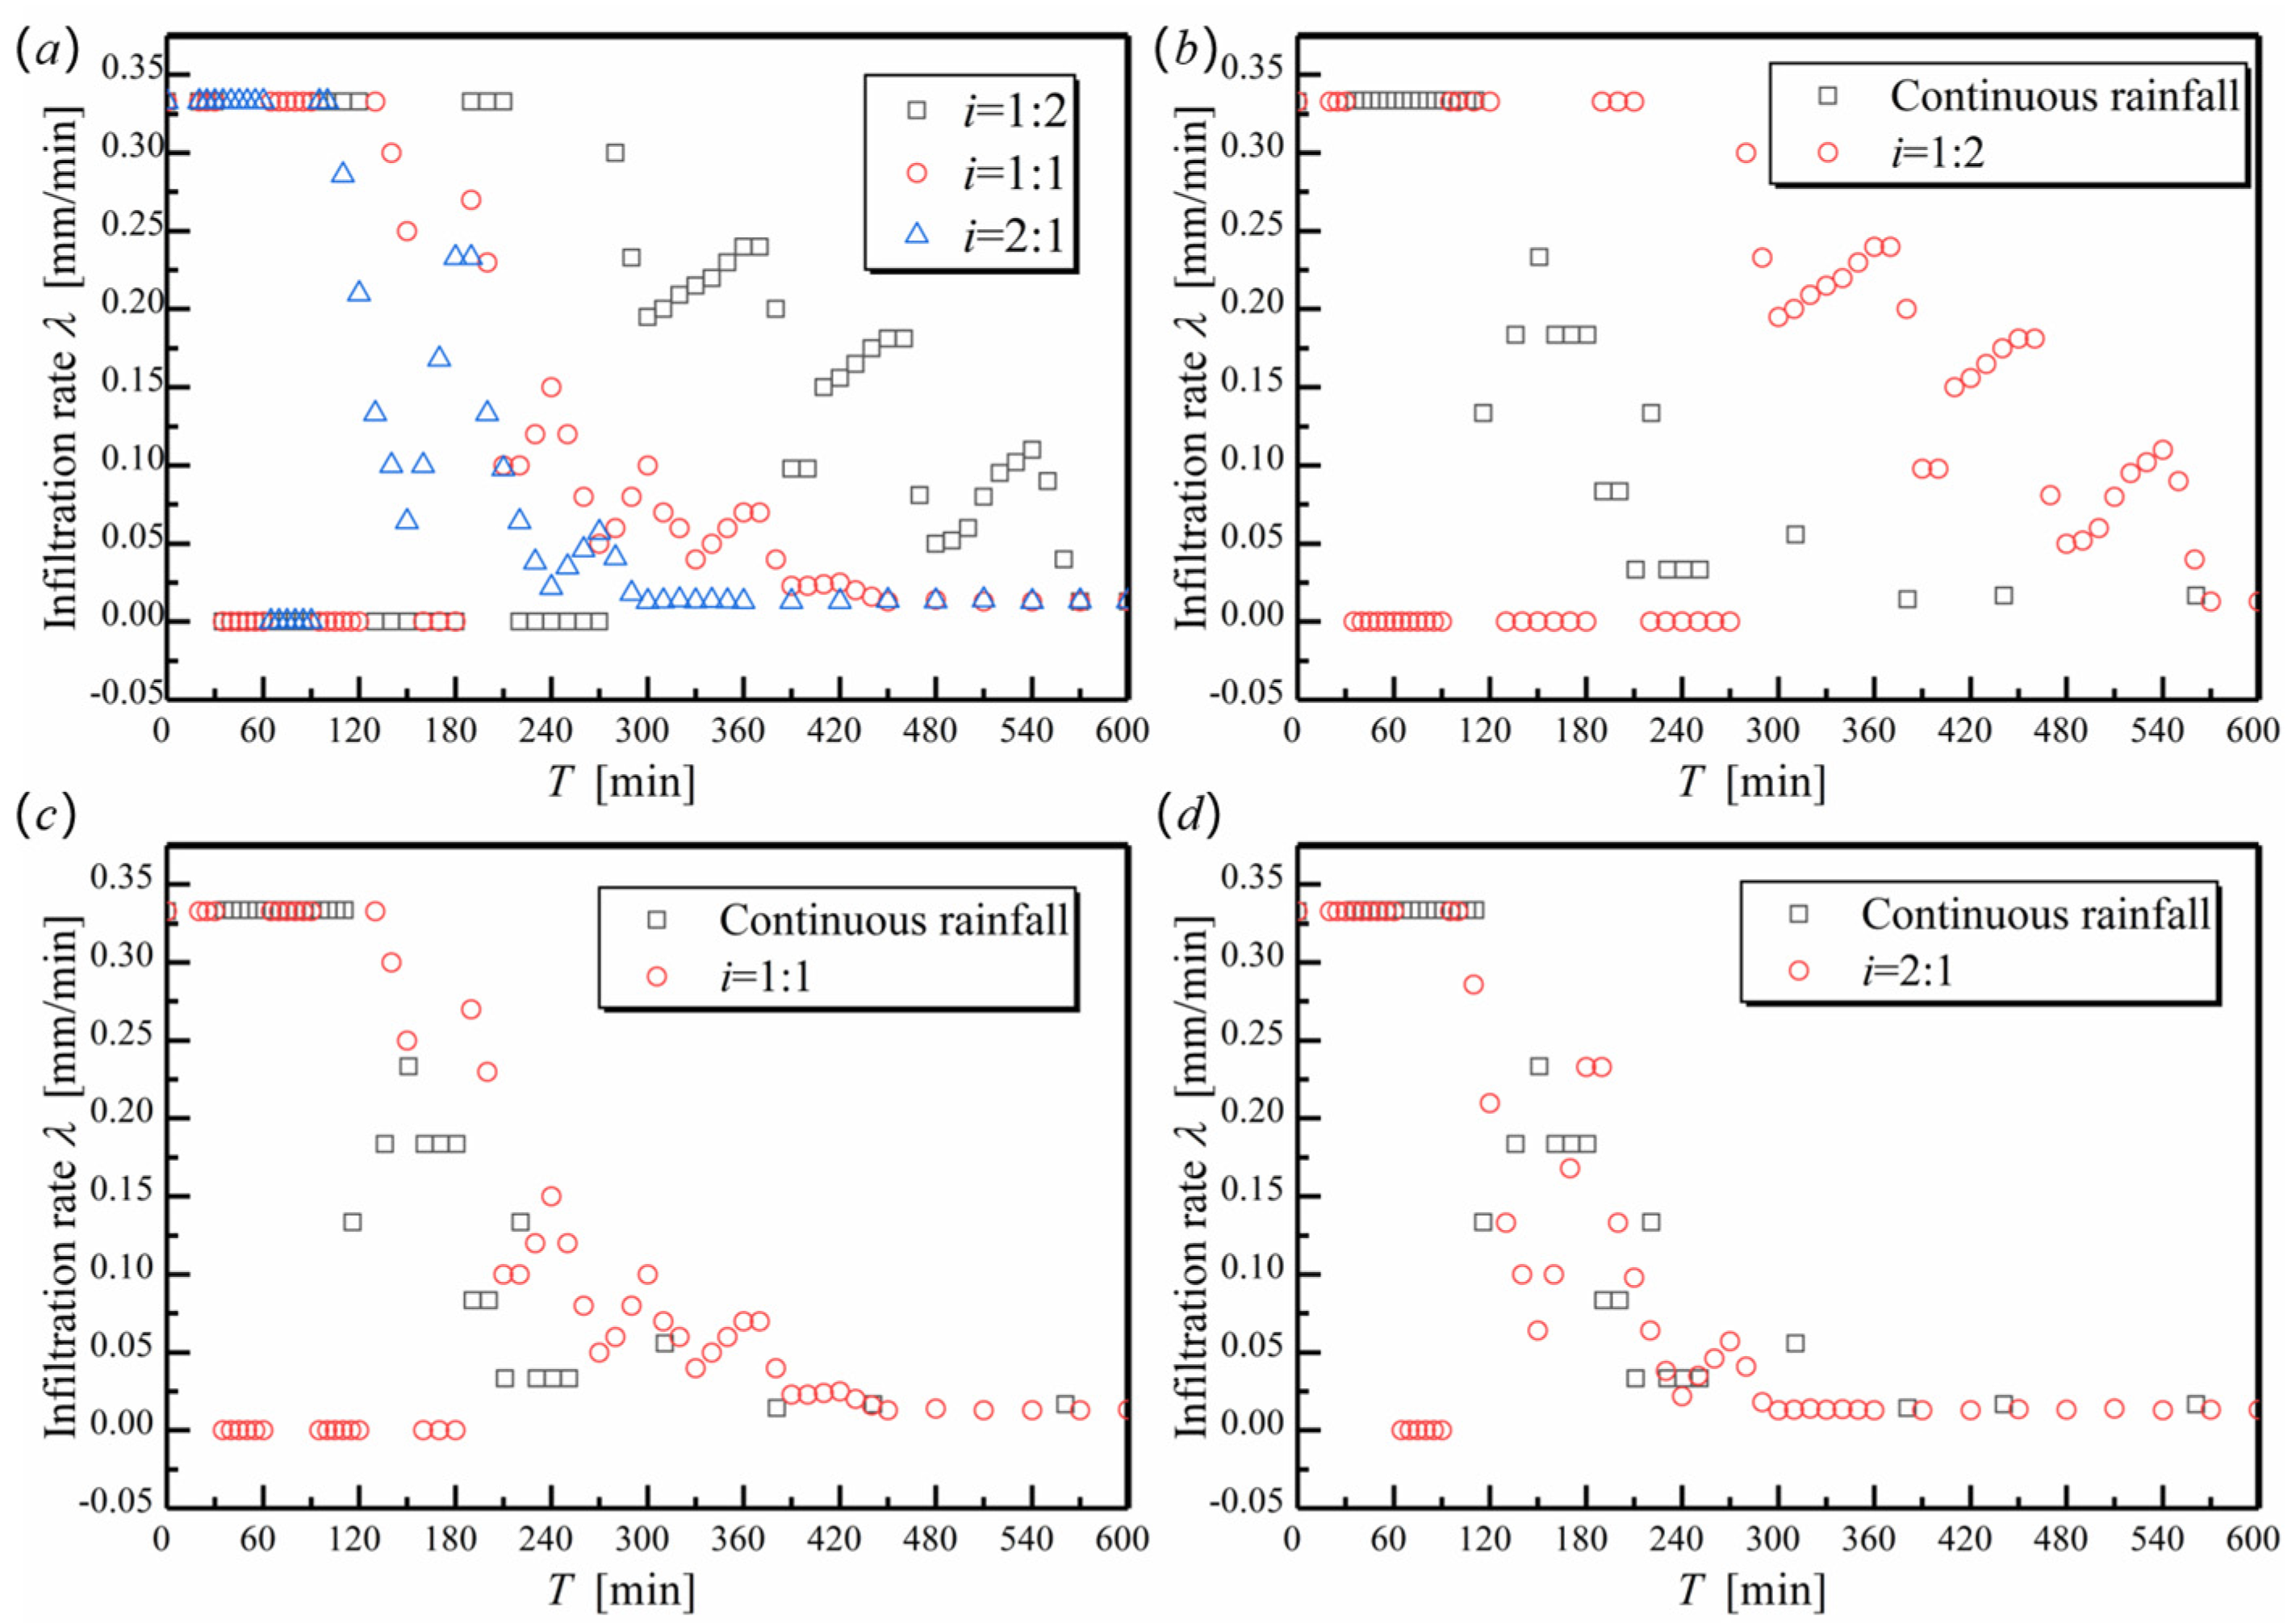
3.4. Effect of Rain Interval Ratio i on Moisture Transportation

This study investigates the soil infiltration rate (λ) when the microplastic content (q) is 0.25%, the soil bulk density (γ) is 1.57 g/cm3 and the microplastic particle size (p) is 5 μm. By analyzing the test results from No. 11 to No. 13, the results are shown below.
The rainfall infiltration rate (λ) is barely unchanged for more than 600 min of rainfall duration, and the rainfall infiltration is stable under the circumstances of three different rain interval ratios (i). Therefore, the time–history curves only represent rainfall duration within 600 min. As shown in Figure 9, the rainfall infiltration process overall does not show no-pressure infiltration, pressure infiltration, or saturated infiltration. With time, the rainwater infiltration rate (λ) gradually decreases to approximately 0.013 mm/min regardless of the difference in i values. However, at the same time, the time–history curves of λ from high to low rain interval ratios (i) are 1:2, 1:1, and 2:1 in turn. It could be speculated that the rain interval ratio (i) has little influence on the saturated infiltration stage of the soil. It is easier for rainwater to infiltrate into the soil inside, and there is no significant loss of rainwater through surface runoff when i is equal to 1:2.
In the pressure infiltration stage, a water film begins to appear on the soil surface until ponding occurs and λ begins to decrease. Nonetheless, during the break time of rain, the water film and stagnant water disappear, and θ decreases. There appears to be a small rebound in λ. With changes in the rainfall cycle, the rate of decrease in λ and increase in rebound gradually decrease, while the magnitude of decrease and increase in rebound gradually decrease. It is shown that the time of λ changes in the time–history curve of λ is consistent with the alternating time between rainfall continuation and rainfall pause, and there is no hysteresis phenomenon, indicating that the infiltration rate responds rapidly to the transition of rainfall types. Below are the comparison figures of the time–history curves of infiltration rate (λ) of loess soil containing microplastics during rainwater infiltration under continuous rainfall conditions and intermittent rainfall conditions.
As shown in Figure 9, when rainfall conditions change from continuous rainfall to intermittent rainfall, the decline rate of λ in the early stage of rainfall changes from fast to slow, and λ under intermittent rainfall conditions is higher than that under continuous rainfall conditions at the same time. This shows that the rainwater infiltration speed is faster when rainfall changes to intermittent rainfall, and the Q value is larger in the middle and early stages. Owing to intermittent rainfall, rainwater needs to be redistributed, and the rainfall duration is long. There are few differences in λ when entering the saturated infiltration stage for continuous and intermittent rain, indicating that rain conditions have little effect on the saturated infiltration stage and that the rain interval ratio has a strong impact on the pressure infiltration stage owing to the rebound phenomenon above. For the soil column tests with rainfall durations longer than the rainfall intermittent time, the time–history curves are almost coincident, indicating that with the increase in rainfall duration, λ gradually became insensitive to the transition of rainfall type. Intermittent rainfall conditions are conducive to soil rainwater infiltration and do not generate excessive runoff on the surface. In agricultural irrigation, under the circumstances of the same irrigation water volume, the intermittent irrigation method is preferred, which is conducive to maximizing the use of water, and the infiltration time is long. Rainwater is beneficial to the absorption and utilization of plant rhizomes in the process of water redistribution in multiple rainfall cycles.

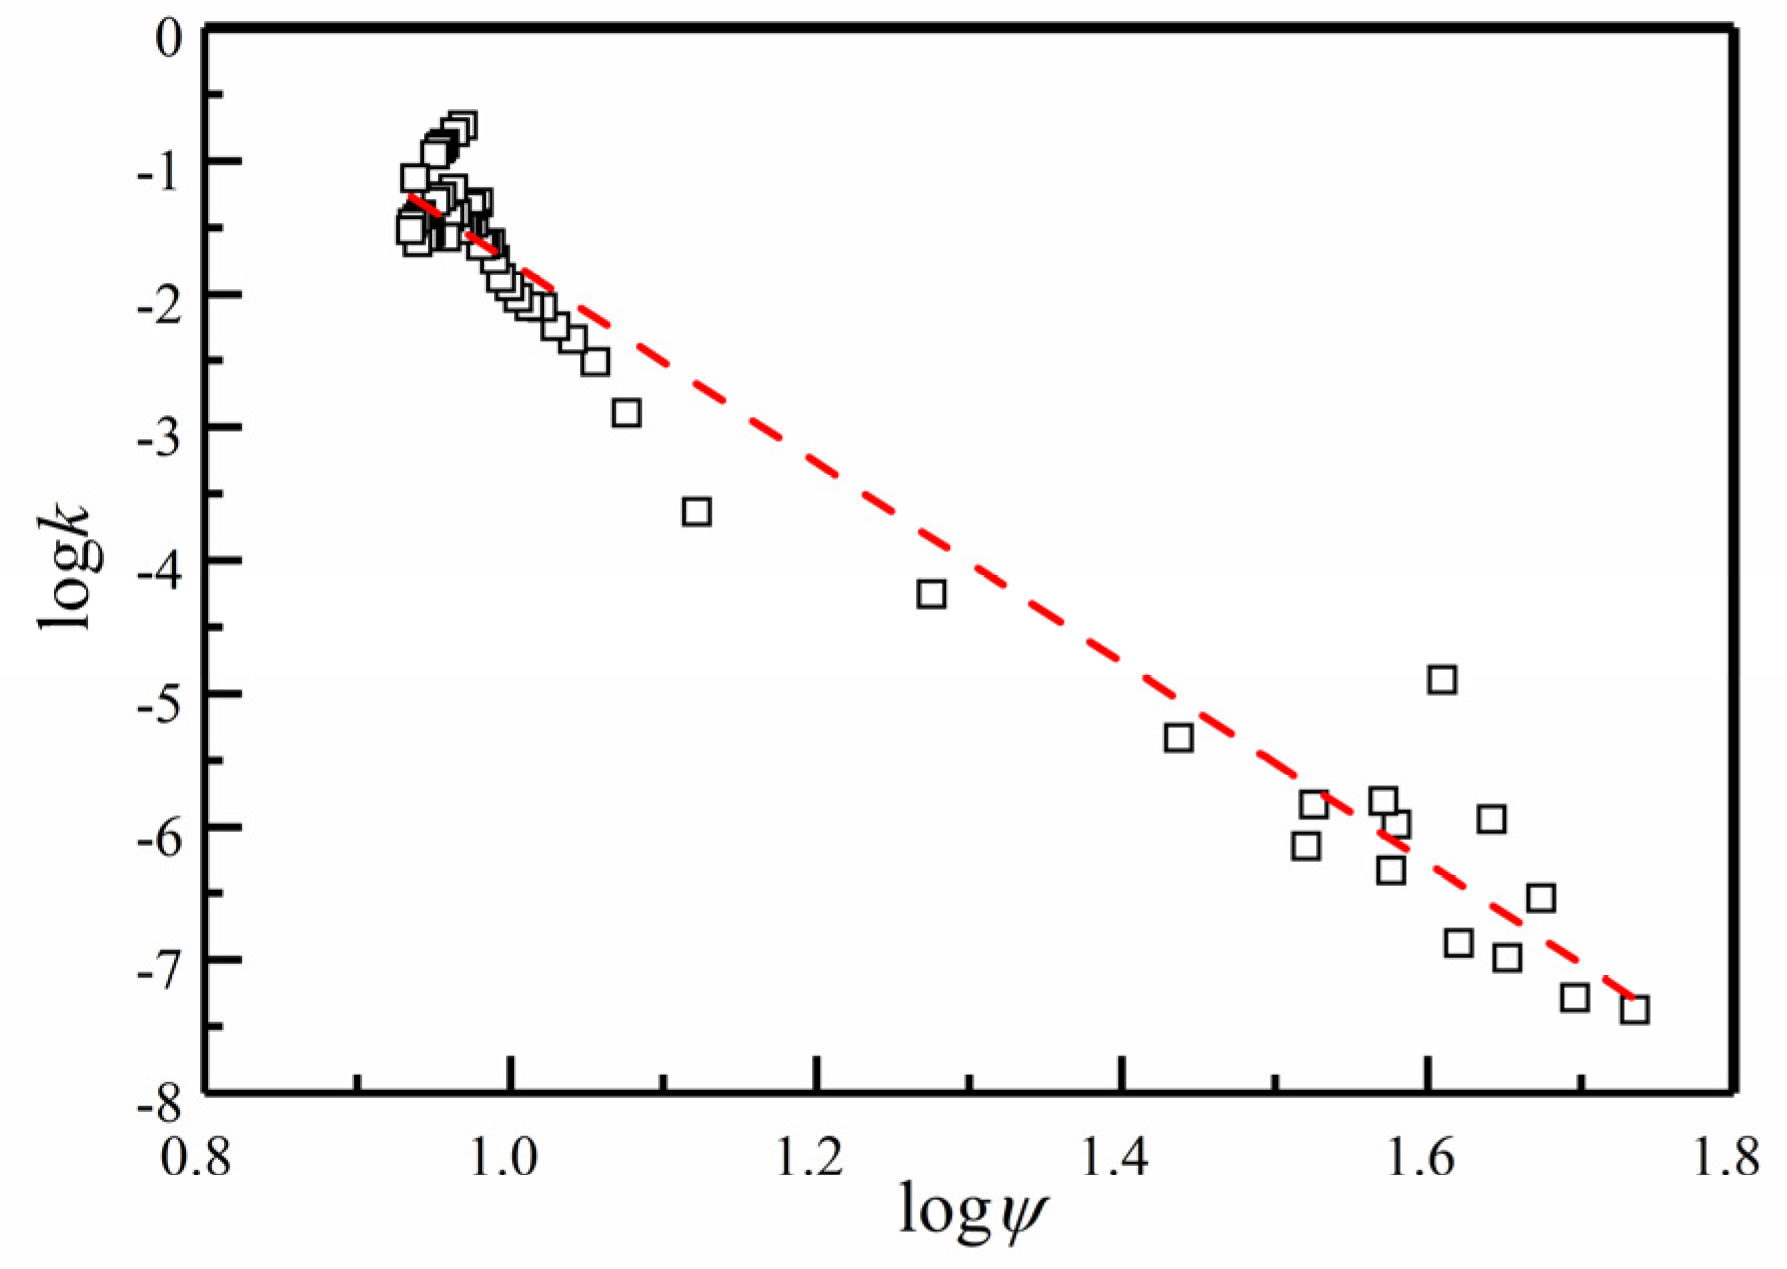
4. Coefficient of Permeability

4.1. Formula Derivation

The coefficient of permeability (θ) is an index that comprehensively reflects soil permeability and is the basis for seepage analysis and rainfall infiltration analysis, which has guiding significance for the seepage analysis of a project and for farmland irrigation. Below is the formula derivation process.
Assuming that the entire space of a soil flow area is filled with water flow, to make the flow in the soil flow model reflect the actual flow of the soil, the flow velocity of the water (Vw, unit: L/T) flow on any tiny area ΔA should be equal to the actual flow through the area ΔQ divided by ΔA, that is:
V w = Δ Q / Δ A
Due to the volumetric water content of unsaturated soils at various cross-sectional locations and differences in the shape, width and direction of pores, the flow velocity here is also an average flow velocity that varies with location and time.
Assuming that the volumetric water content contour line and the matrix suction contour curve advance smoothly in a relatively short period of time, this requires that the volumetric water content distribution function θ(h, t) of different sections change the same with time, which can be converted into the following expression:
θ ( h , t + Δ t ) = θ ( h Δ h , t )
where Δh is the wetting peak infiltration depth during Δt.
As shown in Figure 10, within a short distance of the soil column between A and B, the development schematic diagram of the wetting peak when the rainfall duration is t1 and t2, respectively. The distance traveled by the wetting peak is Δh, so during the rainfall duration Δt = t2t1 (shorter time, generally less than five minutes), the water flow through section A of the soil column is:
Q A = Δ Q A D + Q D
where QA is the water flow through section A, QD is the water flow through section D, and ΔQA−D is the amount of water stored in vertical section AD of the soil column during time Δt. When the wetting peak does not reach the cross section, QA and QD are equal to 0. As the test stops until the water infiltrates to the bottom of the soil column, QD is 0. It can be seen from the previous analysis that θ can be integrated to obtain the total water content in a vertical section of the soil column, so the above formula can be written as:
Q A = Δ Q A D = h A h D ( θ ( h , t 2 ) θ ( h , t 1 ) ) A d h = h A h D θ ( h , t 2 ) A d h h A h D θ ( h , t 1 ) A d h
where θ (h, t2) and θ (h, t1) are the distribution functions of the soil volumetric moisture content θ at times t2 and t1, respectively; A is the cross-sectional area of the vertical soil column; and hA and hD are the distances between section A and section D from the soil column surface. Assuming that the vertical soil column is within a small time period Δt = t2t1, the height difference of the wetting peak in the vertical direction is Δh. The equations below can be obtained from the previous assumptions:
Q A = Δ Q A D = h A h D θ ( h ,   t 2 ) A d h h A h D θ ( h , t 1 ) A d h = h A h D θ ( h Δ h , t 1 ) A d h h A h D θ ( h , t 1 ) A d h = h A Δ h h A θ ( h , t 1 ) A d h h D Δ h h D θ ( h , t 1 ) A d h
Based on the assumption that the distribution function of soil volumetric moisture content θ is a smooth function, the equations can be simplified as:
h A Δ h h A θ ( h , t 1 ) A d h [ θ ( h A , t 2 ) + θ ( h A , t 1 ) ] A Δ h 2
h D Δ h h D θ ( h , t 1 ) A d h [ θ ( h D , t 2 ) + θ ( h D , t 1 ) ] A Δ h 2 θ 0 A h
where θ0 is the initial volumetric moisture content of the vertical soil columns.
Inserting Equations (9) and (10) into Equations (4) and (8), the water flow QA and average flow rate of water flowing through section A VA are:
Q A = [ θ ( h A , t 2 ) + θ ( h A , t 1 ) 2 θ 0 ] A ( h B h A ) 2
V A = { 0.5 [ θ ( h A , t 2 ) + θ ( h A , t 1 ) 2 θ 0 ] A } Δ h t 2 t 1              = { 0.5 [ θ ( h A , t 2 ) + θ ( h A , t 1 ) 2 θ 0 ] A } ( h B h A ) t 2 t 1              = { 0.5 [ θ ( h A , t 2 ) + θ ( h A , t 1 ) 2 θ 0 ] A } ( h 2 h 1 ) t 2 t 1
where (h2h1)/(t2t1) is the wetting peak advancing speed. In a short time t, let t = (t2 + t1)/2 be the wetting peak advancing speed formula derived earlier, and by substituting the previously obtained wetting peak advancing speed formula into it, Equation (13) can be obtained:
V A = { 0.5 [ ( h A , t 2 ) + θ ( h A , t 1 ) 2 θ 0 ] A } ( h 2 h 1 ) t 2 t 1 = { 0.5 [ θ ( h A , t 2 ) + θ ( h A , t 1 ) 2 θ 0 ] A } a b ( t 2 + t 1 2 ) b 1
At (t2 + t1)/2 time, the hydraulic gradient between sections A and B is approximately equal to the tangent of the angle α in Figure 10 and can be obtained by the following formula:
i = φ ( h A , t 1 ) φ ( h A , t 2 ) γ w ( h B h A ) 1 = φ ( h A , t 1 ) φ ( h A , t 2 ) γ w ( h 2 h 1 ) 1
Assuming that the permeability coefficient of unsaturated soil remains unchanged in a small time period Δt = t2 − t1 according to Darcy’s law, the following can be obtained:
Q A = k i A Δ t
k = Q A i A Δ t = 0.5 { [ θ ( h A , t 2 ) + θ ( h A , t 1 ) 2 θ 0 ] A Δ h } γ w Δ h [ φ ( h A , t 1 ) φ ( h A , t 2 ) γ w Δ h ] A Δ t               = 0.5 [ θ ( h A , t 2 ) + θ ( h A , t 1 ) 2 θ 0 ] Δ h γ w [ φ ( h A , t 1 ) φ ( h A , t 2 ) γ w Δ h ] a b ( t 2 + t 1 2 ) b 1

4.2. Calculation Example

In this paper, the section of the #2 moisture sensor of the test soil column with a microplastic content q of 0.25%, a microplastic particle size p of 5 μm, a uniform rainfall intensity of 20 mm/h, and a soil bulk density γ of 1.57 g/cm3 is selected to solve the problem of the permeability coefficient of unsaturated remodeled loess soils with microplastics.
From the study above, the wetting peak infiltration rate of loess soil with microplastics varies greatly in the early stage of rainfall and tends to be stable with increasing rainfall duration. The power exponent is used for fitting, and the fitting effect is better. Below is the fitting function with the same meaning as Equation (4):
v = a b t b 1 = 11.01 t 0.639   R 2 = 0.987
The volumetric moisture content functions θ(h, t) and φ(h, t) of the section where the #2 moisture sensor of the loess soil column is located are measured by the moisture sensor and the tensiometer, respectively. Taking θ(h, t), φ(h, t), v = 11.01t−0.639, θ0 = 0.07, γw = 10 KN/m3, and Δt = t2t1 = 5 min into Equation (16), the permeability coefficient of unsaturated remolded loess soil with microplastics under different matrix suction values can be obtained, as shown in Figure 11.
As shown in Figure 11, when the soil tends to be saturated, the matrix suction force ψ is small, and the permeability coefficient (k) is approximately equal to 0.0338 mm/min, which is in close proximity with the saturated permeability coefficient (λ) of 0.037 mm/min in Section 3.1. Therefore, the experimental results in this paper are consistent and reasonable with the theoretical calculation. Meanwhile, the distribution of the logarithm (lgk) and the matrix suction (lgφ) shows a linear distribution law, which can be fitted by a linear equation. The fitting curve under the double logarithmic coordinate is shown in Figure 11. The fitting equation is:
l g k = 5.77 7.53 l g φ ( R 2 = 0.987 )
Therefore, according to the calculation method of the unsaturated soil permeability coefficient proposed with microplastics in this paper, combined with laboratory infiltration tests and soil–water characteristic curve tests, the permeability coefficient of unsaturated soil bodies can be obtained, which can be used for engineering seepage analysis and guidance for farmland soil irrigation.

5. Conclusions

Based on the wetting front advancing method, this paper employs a one-dimensional vertical soil column rainfall infiltration test device. By analyzing the experimental phenomena and data, the following conclusions are drawn:
(1) When the values of q and p are relatively small, microplastics reflect hydrophobic properties. With the increase in q, p, and γ, microplastics represent blocking effects owing to a significant increase in soil compactness. The rainfall infiltration process normally shows no-pressure infiltration, pressure infiltration, and saturated infiltration. When microplastics have the main effect of hydrophobic, saturated infiltration, even pressure infiltration would not appear. When microplastics have the main effect of blocking, saturated infiltration begins sooner.
(2) The soil water-retaining capacity would be weakened due to the existence of microplastics.
(3) Compared with continuous rainfall, intermittent rainfall is preferred in agricultural irrigation, which would not cause a large amount of surface runoff loss and is conducive to the maximum utilization of water.
(4) Based on the assumption that the volumetric moisture content contour and the matrix suction contour curve advance smoothly in a relatively short period of time, combined with the effective fitting of the power function of the wet peak bulk density advancing curve, the permeability coefficient (k) and average flow rate (V) of unsaturated soils are jointly derived. The relationship between the permeability coefficient (k) and matrix suction (ψ) of unsaturated loess soil containing microplastics was calculated by an example.

Author Contributions

Conceptualization, J.G. and Y.W.; methodology, L.C.; validation, J.G., Y.W. and S.Y.; formal analysis, J.G.; investigation, J.G.; resources, Y.W.; data curation, J.G.; writing—original draft preparation, J.G.; writing—review and editing, Y.T.; visualization, L.H.; supervision, Y.T.; project administration, Y.W.; funding acquisition, L.C. All authors have read and agreed to the published version of the manuscript.

Funding

This research was funded by the National Key Research and Development Program (No. 2019YFC1510802), the National Natural Science Foundation of China (Grant No. U2243244), the major science and technology project of the Ministry of Water Resources (SKR-2022072) and Open Project Funded by the Engineering And Technical Research Center for Dike Safety and Disease Control of the Ministry of Water Resources (Grant No. DFZX202004).

Institutional Review Board Statement

Not applicable.

Informed Consent Statement

Not applicable.

Data Availability Statement

The data used to support the findings of this study are available from the corresponding author upon request.

Acknowledgments

Thanks to all the reviewers and editors for the publication of this paper.

Conflicts of Interest

The authors declare no conflict of interest.

Appendix A

A1: Grain-size distribution curve.
Figure A1. Grain-size distribution curve.
Sustainability 15 00062 g0a1
A2: The rainwater infiltration tests with a p of 3 μm and a q of 0.00%, 0.05%, 0.10%, 0.25%, and 0.50% are supplemented and the results are shown below.
Figure A2. Time–history curve of under different microplastic q: (a) infiltration rate λ; (b) cumulative infiltration amount Q; (c) wetting peak depth H; (d) average conductivity C.
Sustainability 15 00062 g0a2
A3: Fitting curve of λsa and γ.
Figure A3. Fitting curve of λsa and γ.
Sustainability 15 00062 g0a3

References

  1. Peeken, I.; Primpke, S.; Beyer, B.; Gütermann, J.; Katlein, G.; Krumpen, T.; Bergmann, M.; Hehemann, L.; Gerdts, G. Arctic sea ice is an important temporal sink and means of transport for microplastic. Nat. Commun. 2018, 9, 1505. [Google Scholar] [CrossRef] [PubMed] [Green Version]
  2. Li, J.; Song, Y.; Cai, Y. Focus topics on microplastics in soil: Analytical methods, occurrence, transport, and ecological risks. Environ. Pollut. 2019, 257, 113570. [Google Scholar] [CrossRef] [PubMed]
  3. Nizzetto, L.; Futter, M.; Langaas, S. Are Agricultural Soils Dumps for Microplastics of Urban Origin? Environ. Sci. Technol. 2016, 50, 10777–10779. [Google Scholar] [CrossRef] [Green Version]
  4. Machado, S.A.; Lau, W.C.; Till, J.; Kloas, W.; Lehmann, A. Impacts of microplastics on the soil biophysical environment. Environ. Sci. Technol. 2018, 52, 9656–9665. [Google Scholar] [CrossRef] [PubMed] [Green Version]
  5. Horton, A.A.; Walton, A.; Spurgeon, D.J.; Lahive, E.; Svendsen, C. Microplastics in freshwater and terrestrial environments: Evaluating the current understanding to identify the knowledge gaps and future research priorities. Sci. Total Environ. 2017, 586, 127–141. [Google Scholar] [CrossRef] [PubMed] [Green Version]
  6. Zhao, J.M.; Ran, W.; Teng, J.; Liu, Y.L.; Liu, H.; Yin, X.N.; Cao, R.W.; Wang, Q. Microplastic pollution in sediments from the Bohai sea and the Yellow sea, China. Sci. Total Environ. 2018, 640–641, 637–645. [Google Scholar] [CrossRef] [PubMed]
  7. Peng, G.Y.; Bellerby, R.; Zhang, F.; Sun, X.R.; Li, D.J. The ocean’s ultimate trashcan: Hadal trenches as major depositories for plastic pollution. Water Res. 2020, 168, 115121.1–115121.8. [Google Scholar] [CrossRef]
  8. Ramos, L.; Berenstein, G.; Hughes, E.A.; Zalts, A.; Montserrat, J.M. Polyethylene film incorporation into the horticultural soil of small periurban production units in Argentina. Sci. Total Environ. 2015, 523, 74–81. [Google Scholar] [CrossRef]
  9. Bläsing, M.; Amelung, W. Plastics in soil: Analytical methods and possible sources. Sci. Total Environ. 2018, 612, 422–435. [Google Scholar] [CrossRef]
  10. He, D.F.; Luo, Y.M.; Lu, S.B.; Liu, M.T.; Song, Y.; Lei, L.L. Microplastics in soils: Analytical methods, pollution characteristics and ecological risks. TrAC Trends Anal. Chem. 2018, 109, 163–172. [Google Scholar] [CrossRef]
  11. Li, L.Z.; Luo, Y.M.; Li, R.J.; Zhou, Q.; Peijnenburg, W.J.G.M.; Yin, N.; Yang, J.; Tu, C.; Zhang, Y.C. Effective uptake of submicrometre plastics by crop plants via a crack-entry mode. Nat. Sustain. 2020, 3, 929–937. [Google Scholar] [CrossRef]
  12. Ng, E.L.; Lwanga, E.H.; Eldridge, S.M.; Johnston, P.; Hu, H.W.; Geissen, V.; Chen, D. An overview of microplastic and nanoplastic pollution in agroecosystems. Sci. Total Environ. 2018, 627, 1377–1388. [Google Scholar] [CrossRef] [PubMed]
  13. Rillig, M.C.; Lehmann, A. Microplastics in terestrial ecosystems. Science 2020, 368, 1430–1431. [Google Scholar] [CrossRef] [PubMed]
  14. Auta, H.S.; Emenike, C.U.; Fauziah, S.H. Distribution and importance of microplastics in the marine environment: A review of the sources, fate, effects, and potential solutions. Environ. Int. 2017, 102, 165–176. [Google Scholar] [CrossRef] [PubMed]
  15. Mahon, A.M.; Connell, B.O.; Healy, M.G.; Connor, I.O.; Nash, R.; Morrison, L. Microplastics in Sewage Sludge: Effects of Treatment. Environ. Sci. Technol. 2017, 51, 810–818. [Google Scholar] [CrossRef] [PubMed] [Green Version]
  16. Zhou, Y.F.; Liu, X.N.; Wang, J. Characterization of microplastics and the association of heavy metals with microplastics in suburban soil of central China. Sci. Total Environ. 2019, 694, 133798.1–133798.10. [Google Scholar] [CrossRef]
  17. Georgia, G.; Arvaniti, O.S.; Stasinakis, A.S. Review on the occurrence and fate of microplastics in sewage treatment plants. J. Hazard. Mater. 2019, 367, 504–512. [Google Scholar]
  18. Galloway, T.S.; Cole, M.; Lewis, C. Interactions of microplastic debris throughout the marine ecosystem. Nat. Ecol. Evol. 2017, 1, 116. [Google Scholar] [CrossRef]
  19. Akdoan, Z.; Guven, B. Microplastics in the environment: A critical review of current understanding and identification of future research needs. Environ. Pollut. 2019, 254, 113011. [Google Scholar] [CrossRef]
  20. Kane, I.A.; Clare, M.A. Dispersion, accumulation and the ultimate fate of microplastics in deep-marine environments: A review and future directions. Front. Earth Sci. 2019, 7, 1–27. [Google Scholar] [CrossRef] [Green Version]
  21. Chrysikopoulos, C.V.; Syngouna, V.I. Effect of gravity on colloid transport through water-saturated columns packed with glass beads: Modeling and experiments. Environ. Sci. Technol. 2014, 48, 6805–6813. [Google Scholar] [CrossRef] [PubMed]
  22. Syngouna, V.I.; Chrysikopoulos, C.V. Cotransport of clay colloids and viruses through water-saturated vertically oriented columns packed with glass beads: Gravity effects. Sci. Total Environ. 2016, 545, 210–218. [Google Scholar] [CrossRef] [PubMed]
  23. Beckwith, V.K.; Fuentes, M.M.P.B. Microplastic at nesting grounds used by the northern Gulf of Mexico loggerhead recovery unit. Mar. Pollut. Bull. 2018, 131, 32–37. [Google Scholar] [CrossRef] [PubMed]
  24. Tong, M.; He, L.; Rong, H.; Li, M.; Kim, H. Transport behaviors of plastic particles in saturated quartz sand without and with biochar/Fe3O4-biochar amendment. Water Res. 2020, 169, 115284. [Google Scholar] [CrossRef]
  25. Alimi, O.S.; Farner, J.M.; Tufenkji, N. Exposure of nanoplastics to freeze-thaw leads to aggregation and reduced transport in model groundwater environments. Water Res. 2021, 189, 116533. [Google Scholar] [CrossRef]
  26. Bakir, A.; Rowland, S.J.; Thompson, R.C. Transport of persistent organic pollutants by microplastics in estuarine conditions. Estuar. Coast. Shelf Sci. 2014, 140, 14–21. [Google Scholar] [CrossRef] [Green Version]
  27. Gong, J.; Xie, P. Research progress in sources, analytical methods, eco-environmental effects, and control measures of microplastics. Chemosphere 2020, 254, 126790. [Google Scholar] [CrossRef]
  28. Wu, M.; Tang, W.; Wu, S.; Liu, H.; Yang, C. Fate and effects of microplastics in wastewater treatment processes. Sci. Total Environ. 2020, 757, 143902. [Google Scholar] [CrossRef]
  29. Edo, C.; González-Pleiter, M.; Leganés, F.; Fernández-Piñas, F.; Rosal, R. Fate of microplastics in wastewater treatment plants and their environmental dispersion with effluent and sludge. Environ. Pollut. 2020, 259, 113837. [Google Scholar] [CrossRef]
  30. Scircle, A.; Cizdziel, J.V.; Tisinger, L.; Anumol, T.; Robey, D. Occurrence of Microplastic Pollution at Oyster Reefs and Other Coastal Sites in the Mississippi Sound, USA: Impacts of Freshwater Inflows from Flooding. Toxics 2020, 8, 35. [Google Scholar] [CrossRef]
  31. Wolff, S.; Weber, F.; Kerpen, J.; Winklhofer, M.; Engelhart, M.; Backman, L. Elimination of Microplastics by Downstream Sand Filters in Wastewater Treatment. Water 2021, 13, 33. [Google Scholar] [CrossRef]
  32. Lapointe, M.; Farner, J.M.; Hernandez, L.M.; Tufenkji, N. Understanding and Improving Microplastic Removal during Water Treatment: Impact of Coagulation and Flocculation. Environ. Sci. Technol. 2020, 54, 8719–8727. [Google Scholar] [CrossRef] [PubMed]
  33. Wang, X.Z.; Wang, X.; Hu, M.J.; Zhu, C.Q.; Meng, Q.S.; Wang, R. Study of permeability of calcareous silty layer of foundation at an artificial reclamation island. Rock Soil Mech. 2017, 38, 3127–3135. [Google Scholar]
  34. Wang, X.Z.; Wang, X.; Chen, J.W.; Wang, R.; Hu, M.J.; Meng, Q.S. Experimental study on permeability characteristics of calcareous soil. Bull. Eng. Geol. Environ. 2018, 77, 1753–1762. [Google Scholar] [CrossRef]
  35. Lin, S.J.; Jian, W.B.; Dou, H.Q.; Chen, R.M.; Chen, R.M.; Nie, W. Rainfall Infiltration Mechanisms of Soil Columns Under Conductivity. J. Eng. Geol. 2022, 30, 394–406. [Google Scholar]
  36. Wei, L.; Yang, M.Y.; Li, Z.; Shao, J.L.; Li, L.Q.; Chen, P.; Li, S.; Zhao, R.B. Experimental Investigation of Relationship between Infiltration Rate and Soil Moisture under Rainfall Conditions. Water 2022, 14, 1347. [Google Scholar] [CrossRef]
  37. Yang, S.; Gong, A.M.; Wu, J.H.; Lu, T.H. Effect of contact angle on matric suction of unsaturated soil. Rock Soil Mech. 2015, 36, 674–678. [Google Scholar]
  38. Yang, S.; Wu, J.H. Evaporation characteristics of liquid drops on silt soil surface and the influences on soil-water characteristic curve. Rock Soil Mech. 2020, S, 1–9. [Google Scholar]
  39. You, Y.; Xiao, H.L.; Tan, Y. Experimental research on permeability of hydrophobic material modified clay. J. China Three Gorges Univ. 2022, 44, 14–19. [Google Scholar]
  40. Keatts, M.I.; Daniels, J.L.; Langley, W.G.; Pando, M.A.; Ogunro, V.O. Apparent contact angle and water entry head measurements for organo-silane modified sand and coal fly ash. J. Geotech. Geoenviron. Eng. 2018, 144, 04018030. [Google Scholar] [CrossRef]
Figure 1. Experimental apparatus: (a) photograph; (b) schematic.
Sustainability 15 00062 g001
Figure 2. Time–history curve under different microplastic q: (a) infiltration rate λ; (b) cumulative infiltration amount Q; (c) wetting peak depth H; (d) average conductivity C.
Sustainability 15 00062 g002
Figure 3. Time–history curve of volumetric moisture content θ at monitoring points with different microplastic contents q: (a) q = 0.00%; (b) q = 0.05%; (c) q = 0.10%; (d) q = 0.25%; (e) q = 0.50%.
Sustainability 15 00062 g003
Figure 4. Time–history curve of under different microplastic particle sizes p: (a) infiltration rate λ; (b) cumulative infiltration amount Q; (c) wetting peak height H; (d) average conductivity C.
Sustainability 15 00062 g004
Figure 5. Time–history curve of volumetric moisture content θ at monitoring points with different microplastic contents p: (a) p = 3 μm; (b) p = 5 μm; (c) p = 8 μm.
Sustainability 15 00062 g005
Figure 6. Time–history curve under different soil bulk density γ: (a) infiltration rate λ; (b) cumulative infiltration amount Q; (c) wetting peak height H; (d) average conductivity C.
Sustainability 15 00062 g006
Figure 7. Time–history curve of volumetric moisture content θ at monitoring points with different soil bulk density γ: (a) γ = 1.57 g/cm3; (b) γ = 1.61 g/cm3; (c) γ = 1.65 g/cm3; (d) γ = 1.73 g/cm3.
Sustainability 15 00062 g007
Figure 8. Fitting curve: (a) time-history curve of the wetting peak advancing depth H; (b) time-history curve of the wetting peak advancing speed dH/dt.
Sustainability 15 00062 g008
Figure 9. (a) Time-history curve of infiltration rate λ with different rain interval ratio i; comparative analysis of time-history curves of infiltration rate λ with different rain interval ratio I: (b) i = 1:2; (c) i = 1:1; (d) i = 2:1.
Sustainability 15 00062 g009
Figure 10. Moisture content profile and matrix suction profile at any two times during rainwater infiltration.
Sustainability 15 00062 g010
Figure 11. Permeability curve.
Sustainability 15 00062 g011
Table 1. Test scheme.
NoRain Interval Ratio Soil Bulk DensityMicroplastic ContentMicroplastic Particle Size
iγ (g/cm3)q (%)p (μm)
1\1.570.005
2\1.570.055
3\1.570.105
4\1.570.255
5\1.570.505
6\1.570.253
7\1.570.258
8\1.610.255
9\1.650.255
10\1.730.255
111:21.570.255
121:11.570.255
132:11.570.255
Table 2. Time of water accumulation points and saturation points.
Microplastic Content q/%Accumulation Points T1/minSaturation Points
T2/min
Time Difference
(T2T1)/min
0.00150305155
0.05192————
0.10140290150
0.25136280144
0.5091220129
Disclaimer/Publisher’s Note: The statements, opinions and data contained in all publications are solely those of the individual author(s) and contributor(s) and not of MDPI and/or the editor(s). MDPI and/or the editor(s) disclaim responsibility for any injury to people or property resulting from any ideas, methods, instructions or products referred to in the content.

