Article

Evaluation of the Performance of the Electrocoagulation Process for the Removal of Water Hardness

by
Juan Taumaturgo Medina-Collana
1,*,
Gladis Enith Reyna-Mendoza
1,
Jorge Alberto Montaño-Pisfil
1,
Jimmy Aurelio Rosales-Huamani
2,
Elmar Javier Franco-Gonzales
2 and
Xavier Córdova García
3
1
Faculty of Chemical Engineering, National University of Callao, Juan Pablo II 306 Avenue, Bellavista 07011, Peru
2
Multidisciplinary Sensing, Universal Accessibility and Machine Learning Group, Faculty of Geological, Mining and Metallurgical Engineering of the National University of Engineering, Lima 15333, Peru
3
Faculty of Geological Engineering, National University of San Marcos, Av. Republic of Venezuela, Lima 15081, Peru
*
Author to whom correspondence should be addressed.
Sustainability 2023, 15(1), 590; https://doi.org/10.3390/su15010590
Submission received: 21 October 2022 / Revised: 25 November 2022 / Accepted: 23 December 2022 / Published: 29 December 2022

Abstract

:
One of the biggest problems of water with high concentrations of calcium is its susceptibility to causing scaling in industrial equipment (boilers, heat exchangers, pipes, reverse osmosis membranes, storage tanks, etc.). The purpose of this study was to evaluate a recently built filter press (EC) type electrocoagulation reactor and investigate the efficiency of water hardness removal. The electrocoagulation (EC) reactor has been evaluated in batch mode using electrodes of aluminum (Al) and connected to a direct current power supply in a monopolar way. To evaluate the performance of the reactor, a synthetic solution with a concentration similar to that of brackish water was used. A factorial design was applied to investigate the influence of the electrical potential applied to the electrocoagulation cell at the levels of 3, 5, 7, and 9 V, and initial calcium hardness of 540.2 and 914.60 mg/L CaCO3 at room temperature in 60 treatment minutes. The results revealed that the electrical potential applied to the electrocoagulation cell was the most significant factor in hardness removal, within the experimental ranges studied. The results showed that electrocoagulation at an electric potential applied at 9 volts and an initial concentration of 7400 mg/L allowed a higher hardness removal efficiency (25.83%). the pH of the solution increased throughout the process. The energy consumption ranged between 4.43 and 42 kW.h/m3 depending on the conditions of the factors. It has been shown that during the treatment process a layer of dense and compact calcium carbonate precipitate is formed on the surface of the cathode.

1. Introduction

Water hardness is generally caused by the presence of cations such as Ca2+, Mg2+. They are not only harmful to human health, but also to industrial production processes. The world health Organization recommended preserving the concentrations of Ca2+ and Mg2+ ions lower than 75 mg/L and 50 mg/L in the drinking water respectively [1]. Although the calcium content in the tap water does not have any serious impact on the health problem, but it still is responsible for the scaling of the household appliances and reduction of cleaning performance of the detergents and soaps [2]. Calcium ions can reach concentrations beyond the solubility limit, by evaporation of water, which gives rise to the formation of scale [3].Scaling on the surface of heat exchanger reduces boiler power output by 10–20%, and decreases thermal efficiency by 10% [4]. the researchers introduced various softening technologies including evaporation, chemical precipitation, chemical reduction, flocculation, solvent extraction filtration, ion exchange, and adsorption [5]. Reverse osmosis (RO) and nanofiltration membranes (NF) are the commonly known and preferred methods for desalination and softening of water [6]. The presence of calcium Ca2+ ions in the feed solution to membrane separation processes can cause the deposition of CaCO3 and CaSO4·2H2O, which are the most common constituents of scale. Fouling tends to impede permeate flow, increase pressure drop and cause irreversible plugging of pores and physical damage to the membrane [7].
The electrocoagulation process is characterized by being an unconventional method technique that has essential advantages over other methods [8]. Electrocoagulation (EC) has been tested on different types of water, such brackish water [9]. for the pretreatment of different types of water, seawater [10] and groundwater [11]. Electrocoagulation (EC) is an emerging electrochemical process that involves applying an electric current to sacrificial electrodes inside a reactor [12]. Uses electrical current to dissolve sacrificial metal electrodes such as iron (Fe) or aluminum (Al) to produce coagulants or destabilization agents [13]. The EC process involves the dissolution of charged cations (Mg2+, Zn2+, Al3+, Fe3+) originated from the sacrificial anode, forming monomeric and polymeric hydroxyl complex species simultaneously, which can strongly absorb certain pollutants from contaminated water. The aluminum hydroxide floc had relatively larger size and less density, which was easy to float and separate [14]. The main reactions that occur in the aluminum electrodes are: At the anode The electro dissolution of the anode leads to the release of Al3+ cations according to the reaction mechanism (Equation (1))
A l ( s ) A l ( a q ) 3 + + 3 e
If the anode potential is high enough, secondary reactions can occur at the anode, such as direct oxidation of organic compounds and H2O or Cl1− present in the wastewater [15].
2 H 2 O ( l ) O 2 ( g ) + 4 H ( a c ) 1 + + 4 e
2 C l ( a c ) 1   C l 2 ( g ) + 2 e
At the cathode:
The water reduction reaction occurs, which results in the generation of hydrogen bubbles on its surface (Equation (4)):
2 H 2 O ( l ) H 2 ( g ) + 2 O H ( a q ) 2 e
The Al ions generated at the anode are soluble and will subsequently react with the hydroxide ions generated at the cathode. The aluminum hydroxides are created as shown in Equation (3) below [16], During the oxidation process, the aluminum anode dissolves and generates Al3+ cations, which are further reacted and transformed into various monomeric and polymeric ionic forms such as A l ( O H ) 2 1 + , A l ( O H ) 2 + , A l ( O H ) 4 1 , A l 2 ( O H ) 2 4 +     a n d   A l 3 ( O H ) 4 5 + ,   A l 6 ( O H ) 15 3 + and also low soluble amorphous species such as Al(OH)3 and Al2O3, which depend on the initial pH of the solution [17]. In addition, EC is an environmentally friendly process compared to the chemical coagulation (CC), which is commonly used for water treatment using different types of coagulants or flocculants as iron and aluminum sales [18]. Literature has also reported that electrocoagulation can remove many ions from water, such as sulfate (SO42) [19]; nitrate(NO3) [20]; fluoride(F) [21]; cyanide(CN) and lead (II) [22]; lead(II), Chromium (VI) and cadmium (II) [23] and other emerging pollutants [24] in particular from pharmaceutical wastewate [25] and distillery effluents [26]. Qodah et al. [27] mentioned, the main disadvantages of the EC process are the high consumption of anode, passivation of the electrode at the cathode that results in a reduction of the current and the efficiency of the contaminant removal process and a higher consumption of electrical energy. Numerous research studies have demonstrated that EC works cohesively with other treatment modalities, including ozone (O3) assisted EC [28]; EC-nanofiltration and membrane filtration [29]; EC/Adsorption [30]; photo–EC [31]; aerated-EC [32]; US-EC [33]; and photocatalysis-EC [34] for the elimination of contaminants from industrial effluent and wastewater. Kane et al. [35] studied the photocatalytic degradation process in the flumequine effluent, reporting maximum degradation more than 90% after 2.5 h under optimal conditions (an initial concentration of 5 mg/L, three lamp light intensities, and a flow rate of 29 L/h). An EC problem is the passivation of the sacrificial aluminum electrodes (anode) due to the precipitation of aluminum oxides; This passivation increases the potential of the cell and, therefore, an increase in energy consumption and process costs [36]. Moreover the high concentration of hydroxide ion in the vicinity of the cathode makes the insoluble salts of calcium and magnesium attach to the cathode surface, which induces the passivation of the cathode, which affects hydrogen production and electron transfer [6,37]. The most common reactor is a conventional reactor made up of a magnetic stirrer to mix the solution and stationary electrodes [38]. Despite the fact that numerous studies have been carried out for the elimination of hardness by electrocoagulation, studies on highly concentrated solutions and the evaluation of new electrocoagulation devices that reduce the levels of passivation of the electrodes and energy consumption are still lacking. It has been proposed to study the application of a new electrocoagulation device with improvements in the mixing of chemical species within the electrocoagulation cell to reduce the levels of passivation of the electrodes and energy consumption. The objective of this study was to investigate the performance of the electrocoagulation cell on the percentage removal of hardness (calcium) from a model solution of similar concentration of brackish water. The effect of the initial concentration and the electrical potential with respect to the percentage of removal of atehardness and the specific energy consumption were studied.

2. Materials and Methods

2.1. Chemicals and Reagents

All chemicals were reagent grade, sodium chloride (99-9), calcium chloride (CaCl2 2H2O) of 99%, and hydrochloric acid (37%). All solutions were prepared with ultrapure water with a conductance of 18.2 MΩ cm−1. Table 1 shows the concentrations (3300, 7400 mg/L) and water hardness (540.2 and 914.60 mg/L), as calcium carbonate. To the first solution 2500 mg/L sodium chloride with 800 mg/L calcium chloride was added and the second solution 6000 mg/L sodium chloride with 1400 mg/L calcium chloride to simulate brackish water. Chemical compounds (salts) of high purity were provided by the Merck company.

2.2. Analytical Method

The conductivity was measured using an ADWA AD 330 conductivity meter and pH with ADWA, instruments made in, Hungary and Romania. When measuring the hardness, the sample was filtered with filter paper (Whatmann 0.25 µm) to eliminate the interference of the calcites suspended in the sample. Calcium hardness was measured using 0.01M concentration ethylenediaminetetraacetic acid (EDTA), based on the method and procedure [39].

2.3. Design of Experiment

The design of experiments (DOE) through the factorial design has been used in the essays. To investigate the percentage of calcium hardness removal and specific energy consumption, the effect of factors such as the initial calcium concentration and the potential applied to the electrocoagulation cell has been studied. For the electric potential, it has been assigned to four levels and the calcium concentration to two study levels. For the electrical potential, it has been assigned to four levels and the calcium concentration to two levels of study. Table 2 shows the factors and levels under study, 8 tests were carried out with their corresponding replica, having a total of 16 experiments. The two factors, applied electrical potential and initial solution concentration, were denoted X1 and X2, respectively. The statistical software Minitab 17 was used to carry out the experimental design and analysis of variance (ANOVA). The experiments have randomized and Table 3 demonstrates the applied design matrix.
To select the factors in the proposed factorial design, previous studies have revealed that the voltage supply to the electrocoagulation cell determines the amount of Al 3+ ion released from the respective electrodes (anode) and the amount of resulting coagulant. In addition, the electrical potential not only determines the coagulant dosing rate, but also the bubble production rate and size, floc growth, and energy consumption, which can influence the treatment efficiency of the electrocoagulation process [40]. brackish groundwater has higher salinity than freshwater (>0.5 g/L) [41]. Strathmann [42] defined water with a salinity of 1500 to 15,000 (ppm) as brackish water.

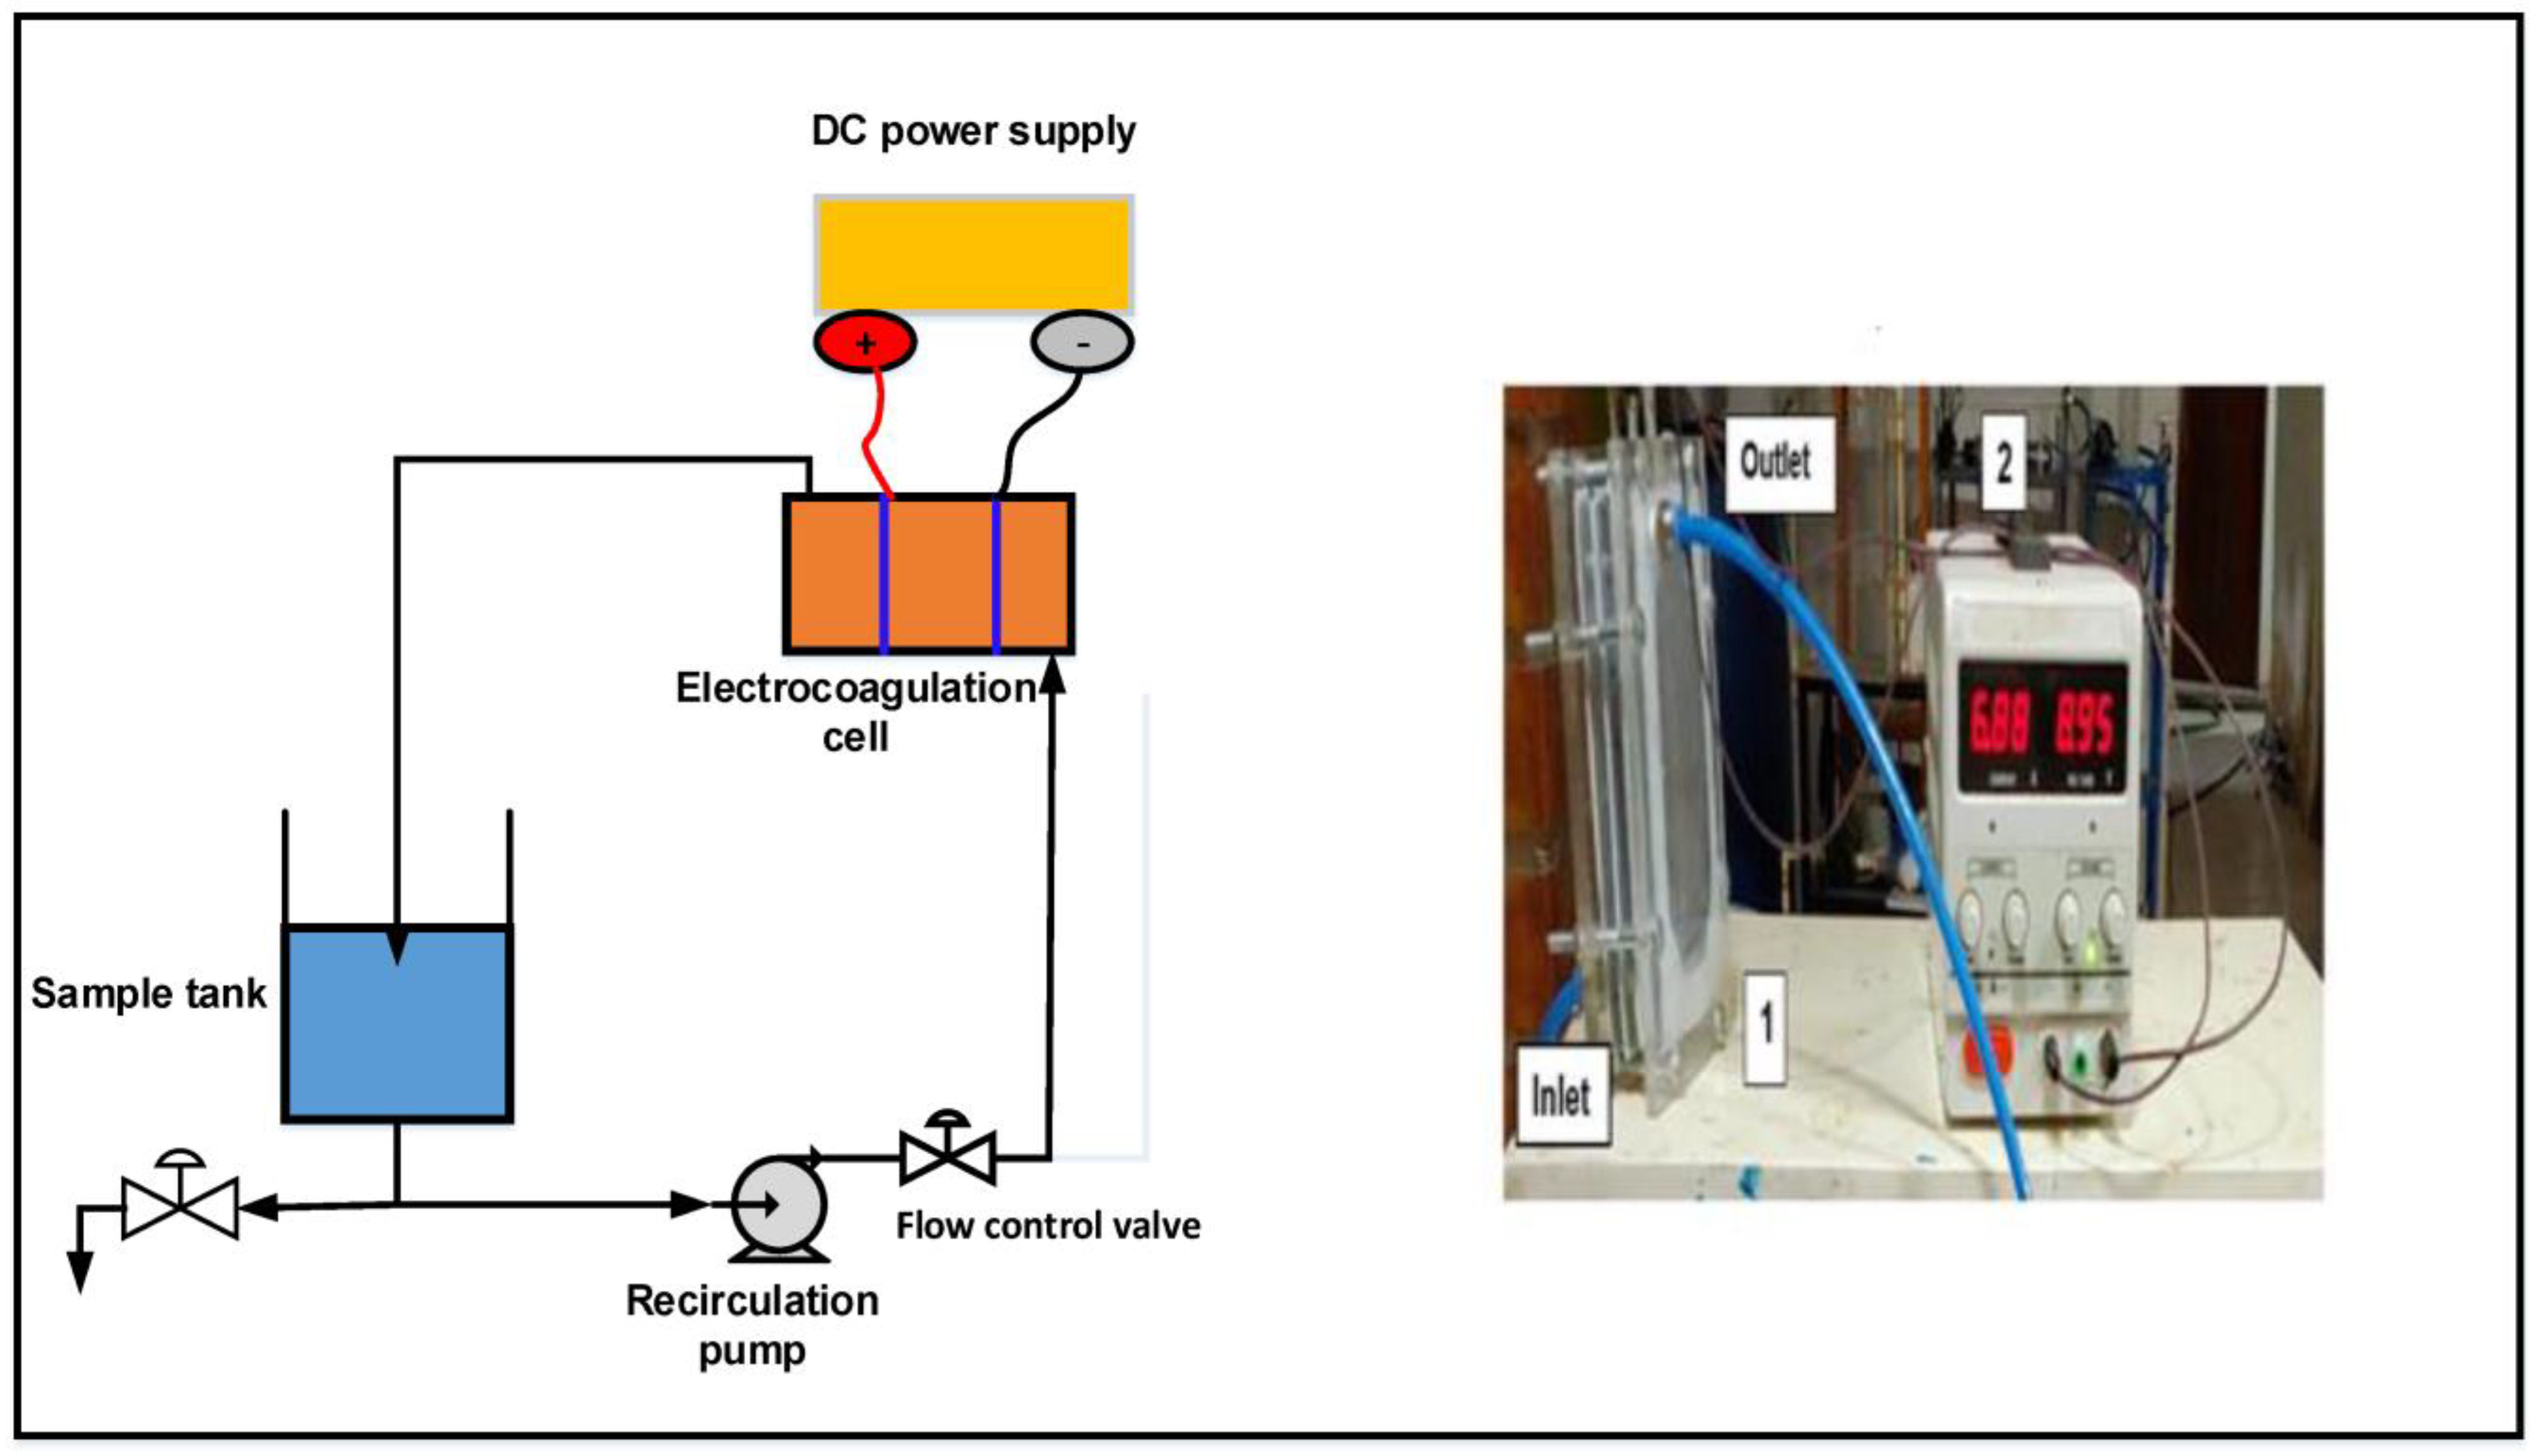
2.4. Lab-Scale Batch Electrocoagulation Reactor

The diagram of the reactor and its components is shown in Figure 1. The EC reactor is composed of aluminum plate electrodes placed vertically in parallel. The electrolyte enters from the bottom in the ascending way while the exit is located in the upper part of the cell. The reactor contains two anodes and a cathode with dimensions (10 cm × 6 cm × 0.3 cm, height, width and thickness) in contact with the electrolytic solution. A tank of acrylic material with dimensions of 30 cm × 10.5 cm (height × diameter) is used as a container for the electrolytic solution. The reactor contains three frames of acrylic material, inside a high purity aluminum plate (99.7%). The frames are separated with polypropylene that allows the cell to be hermetically sealed to prevent liquid spillage, as shown in Figure 1 (1). This EC unit was attached to a hydraulic system consisting of a small centrifugal pump with a capacity of 0–2 L min−1. The total volume of synthetic water was circulated through the electrolytic cell by a peristaltic pump at a constant flow rate. The anode and cathode were connected to the positive and negative outputs of a direct current source of 0–30 V and 0–10 A ((Model: DC power supply-China) in a monopolar (2). The intensity of electric current was recorded at the beginning every 2 min and then every 5 min of the test. All experiments were performed at room temperature of 20 °C. At the end of each experiment, the water was sedimented and filtered for analysis of hardness, conductivity and pH. After being tested, the surface of the electrodes rubbed with thin paper, diluted hydrochloric acid and washed with distilled water to eliminate the oxide layers, then dried and weighed.

2.5. Data Analysis

2.5.1. Calculation of Removal Percentage (%)

The efficiency of removal of hardness (calcium) was calculated using Equation (5) [43]
( R ) = ( C 0 C t C 0 ) ×   100 %
where, removal efficiency (R) C0 (mg/L) and Ct (mg/L) are the initial and final calcium hardness concentration, respectively.

2.5.2. Calculation of Electrode Consumption during the EC Process

The ions generated within the electrocoagulation cell are related to the flow of electrical current and the electrocoagulation time by Faraday’s law, was calculated from Equation (6).
m t h e o = M I t z F
where mtheo is the amount of anode material dissolved (g), I is the current intensity(A), t is the electrolysis time (s), M is the molecular weight of aluminium de ion (26.98 g mol−1), z is the number of electrons transferred in the reaction (3 for aluminium) and F is the Faraday’s constant (96,486 C mol−1). When the intensity is a function of time Faraday’s law, is shown in Equation (7) [24].
m t h e o = M 0 t I d t z F

2.5.3. Electric Energy Consumption (SEC)

The amount of energy consumed per unit mass of matter removed is called the specific energy consumption [26]. The energy consumption per unit mass of calcium carbonate required to reduce the hardness of the solution was estimated using Equation (8).
SEC ( k W h m 3 ) = E c e l l 0 t I d t V s
where SEC is the specific energy consumption (kWh/m3), E c e l l the applied cell potential (V), I is the applied current (A), t is the treatment process time (h), vs. is the volume of the solution (m3).

3. Results and Discussion

3.1. Results of the Studied Variables

Table 3 Reports on the calcium hardness removal performance, specific energy consumption and electrode consumption in the electrocoagulation cell. Calcium removal ranged between 6.10% and 25.83%.

3.2. Analysis of ANOVA

The analyses of variance (ANOVA) for responses are presented in Table 4 and Table 5. Table 4 shows ANOVA for calcium hardness removal response on selected operating parameters. The applied potential and the initial calcium concentration are significant factors with values of p < 0.05. Table 5 shows ANOVA for the energy specific response on the selected operating parameters. The standard deviation has been evaluated with respect to the mean percentage of hardness removal and energy consumption, the results of which are shown in Table 6.
From Figure 2, it is shown that the factors perform best (providing the highest percent hardness removal response) at their highest test levels (7400 ppm and 9 V). The application of the electrical potential between 7 and 9 volts has the strongest effect on the removal, because it presents a greater slope of growth. This implies that increasing solution concentration and electrical potential can be an efficient way to remove hardness.

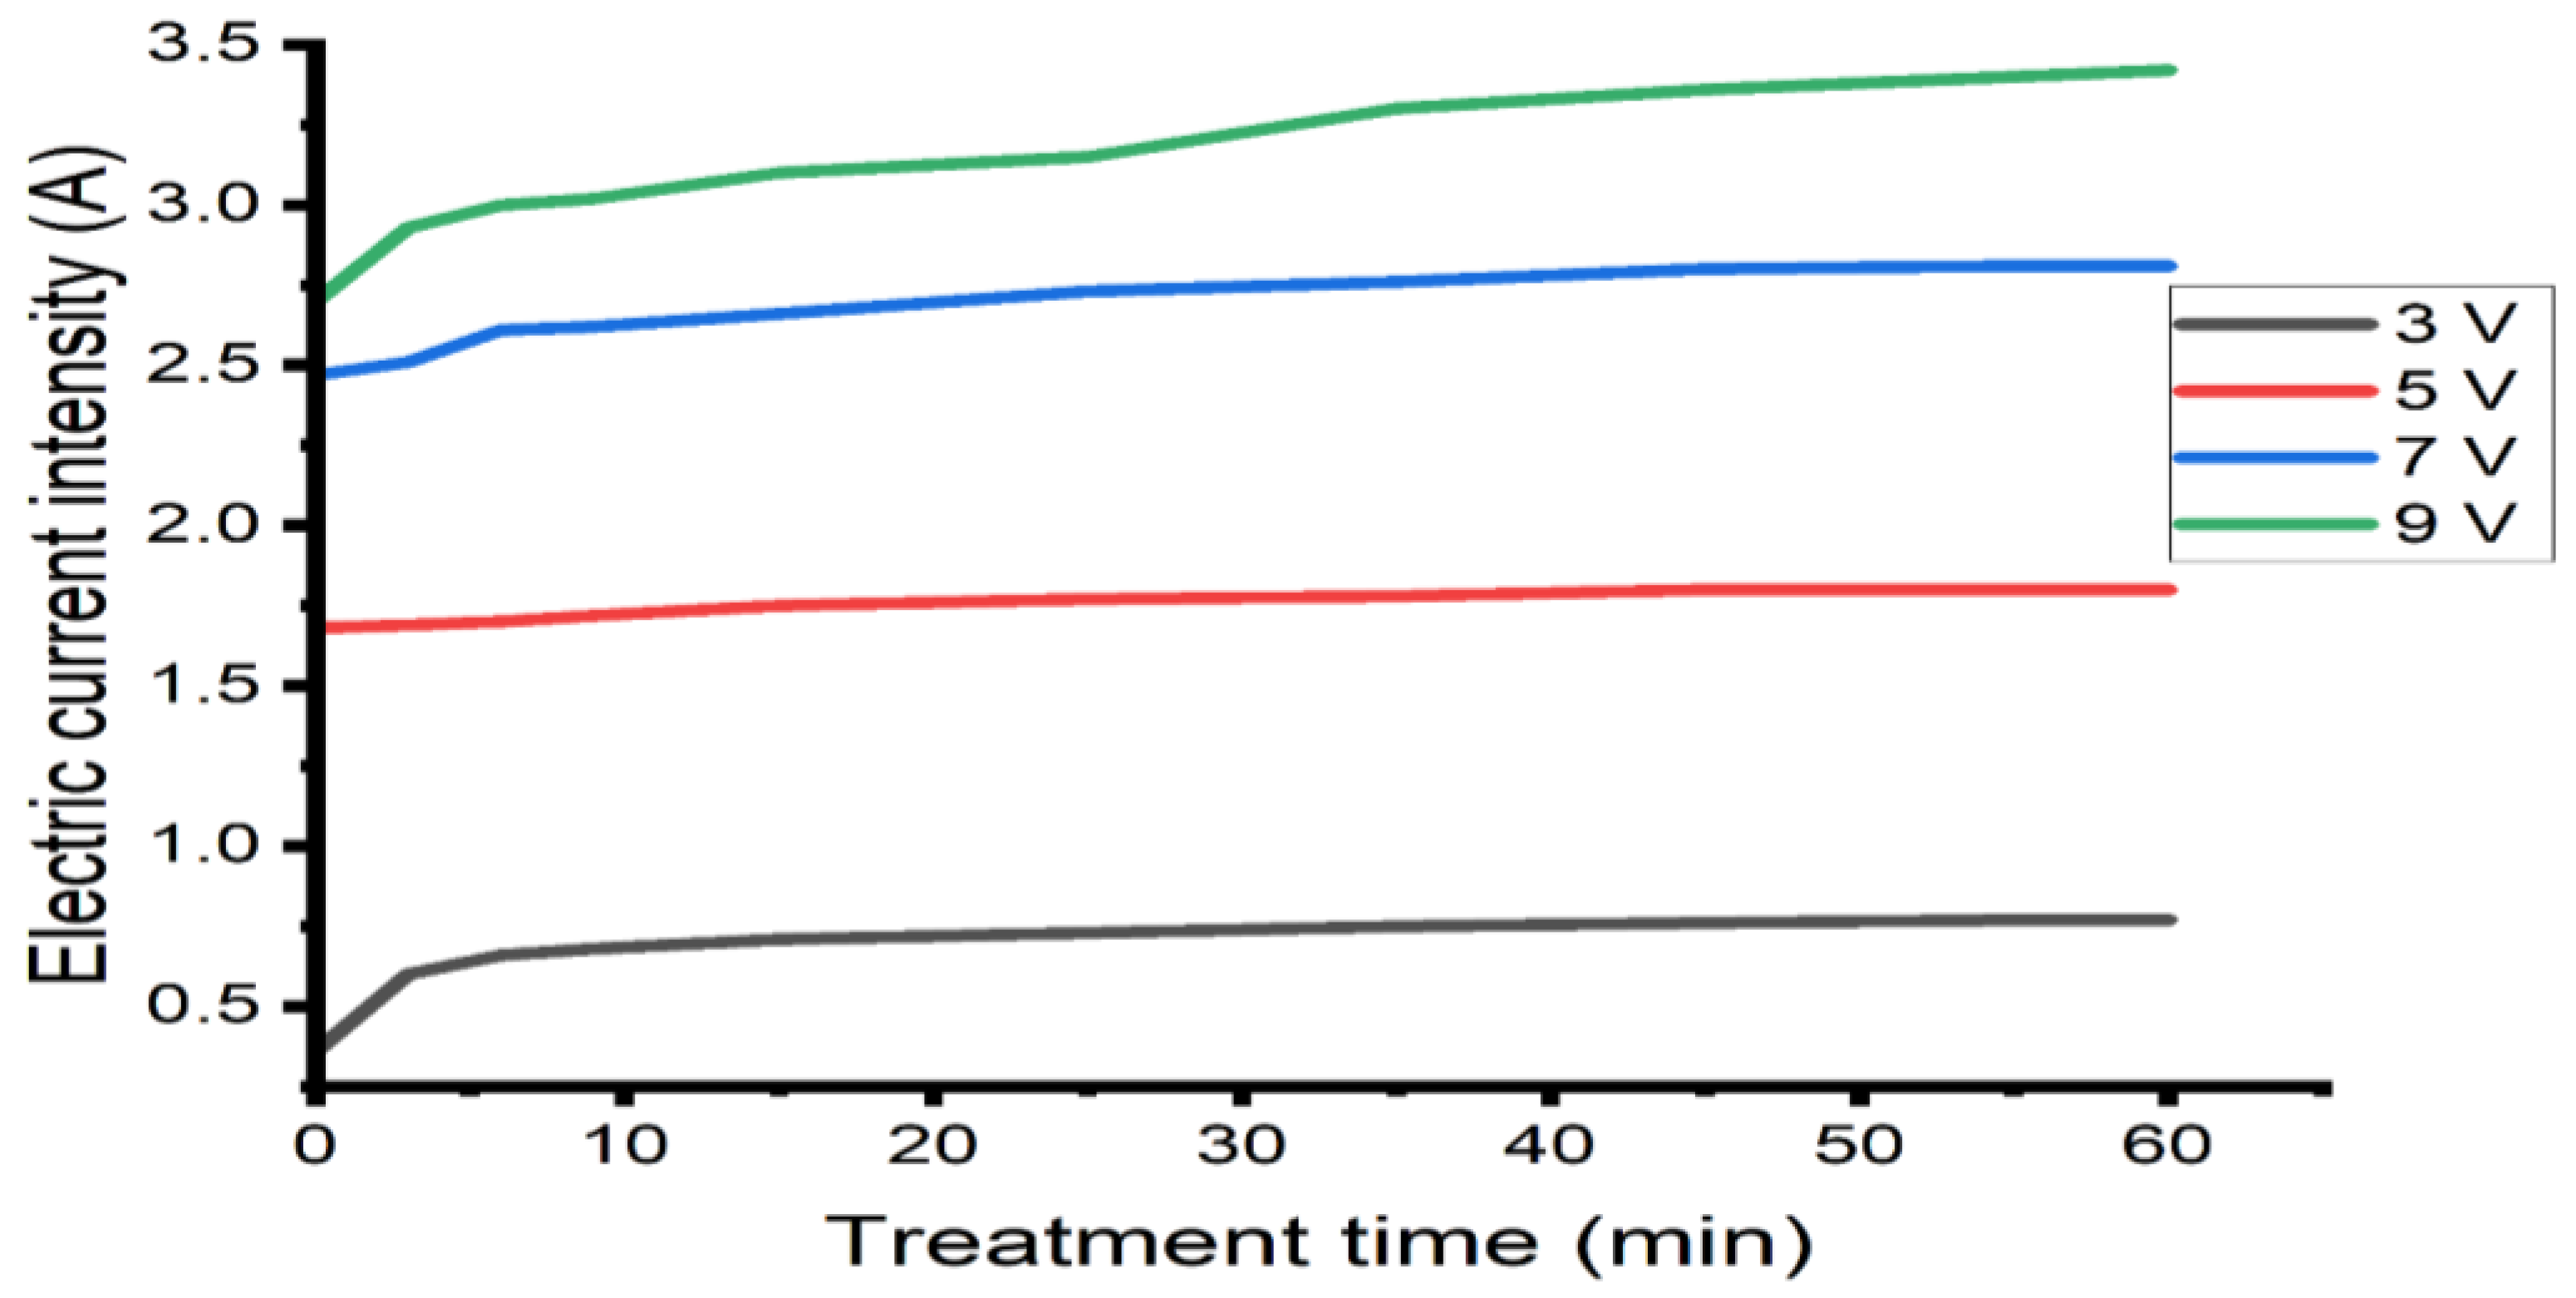
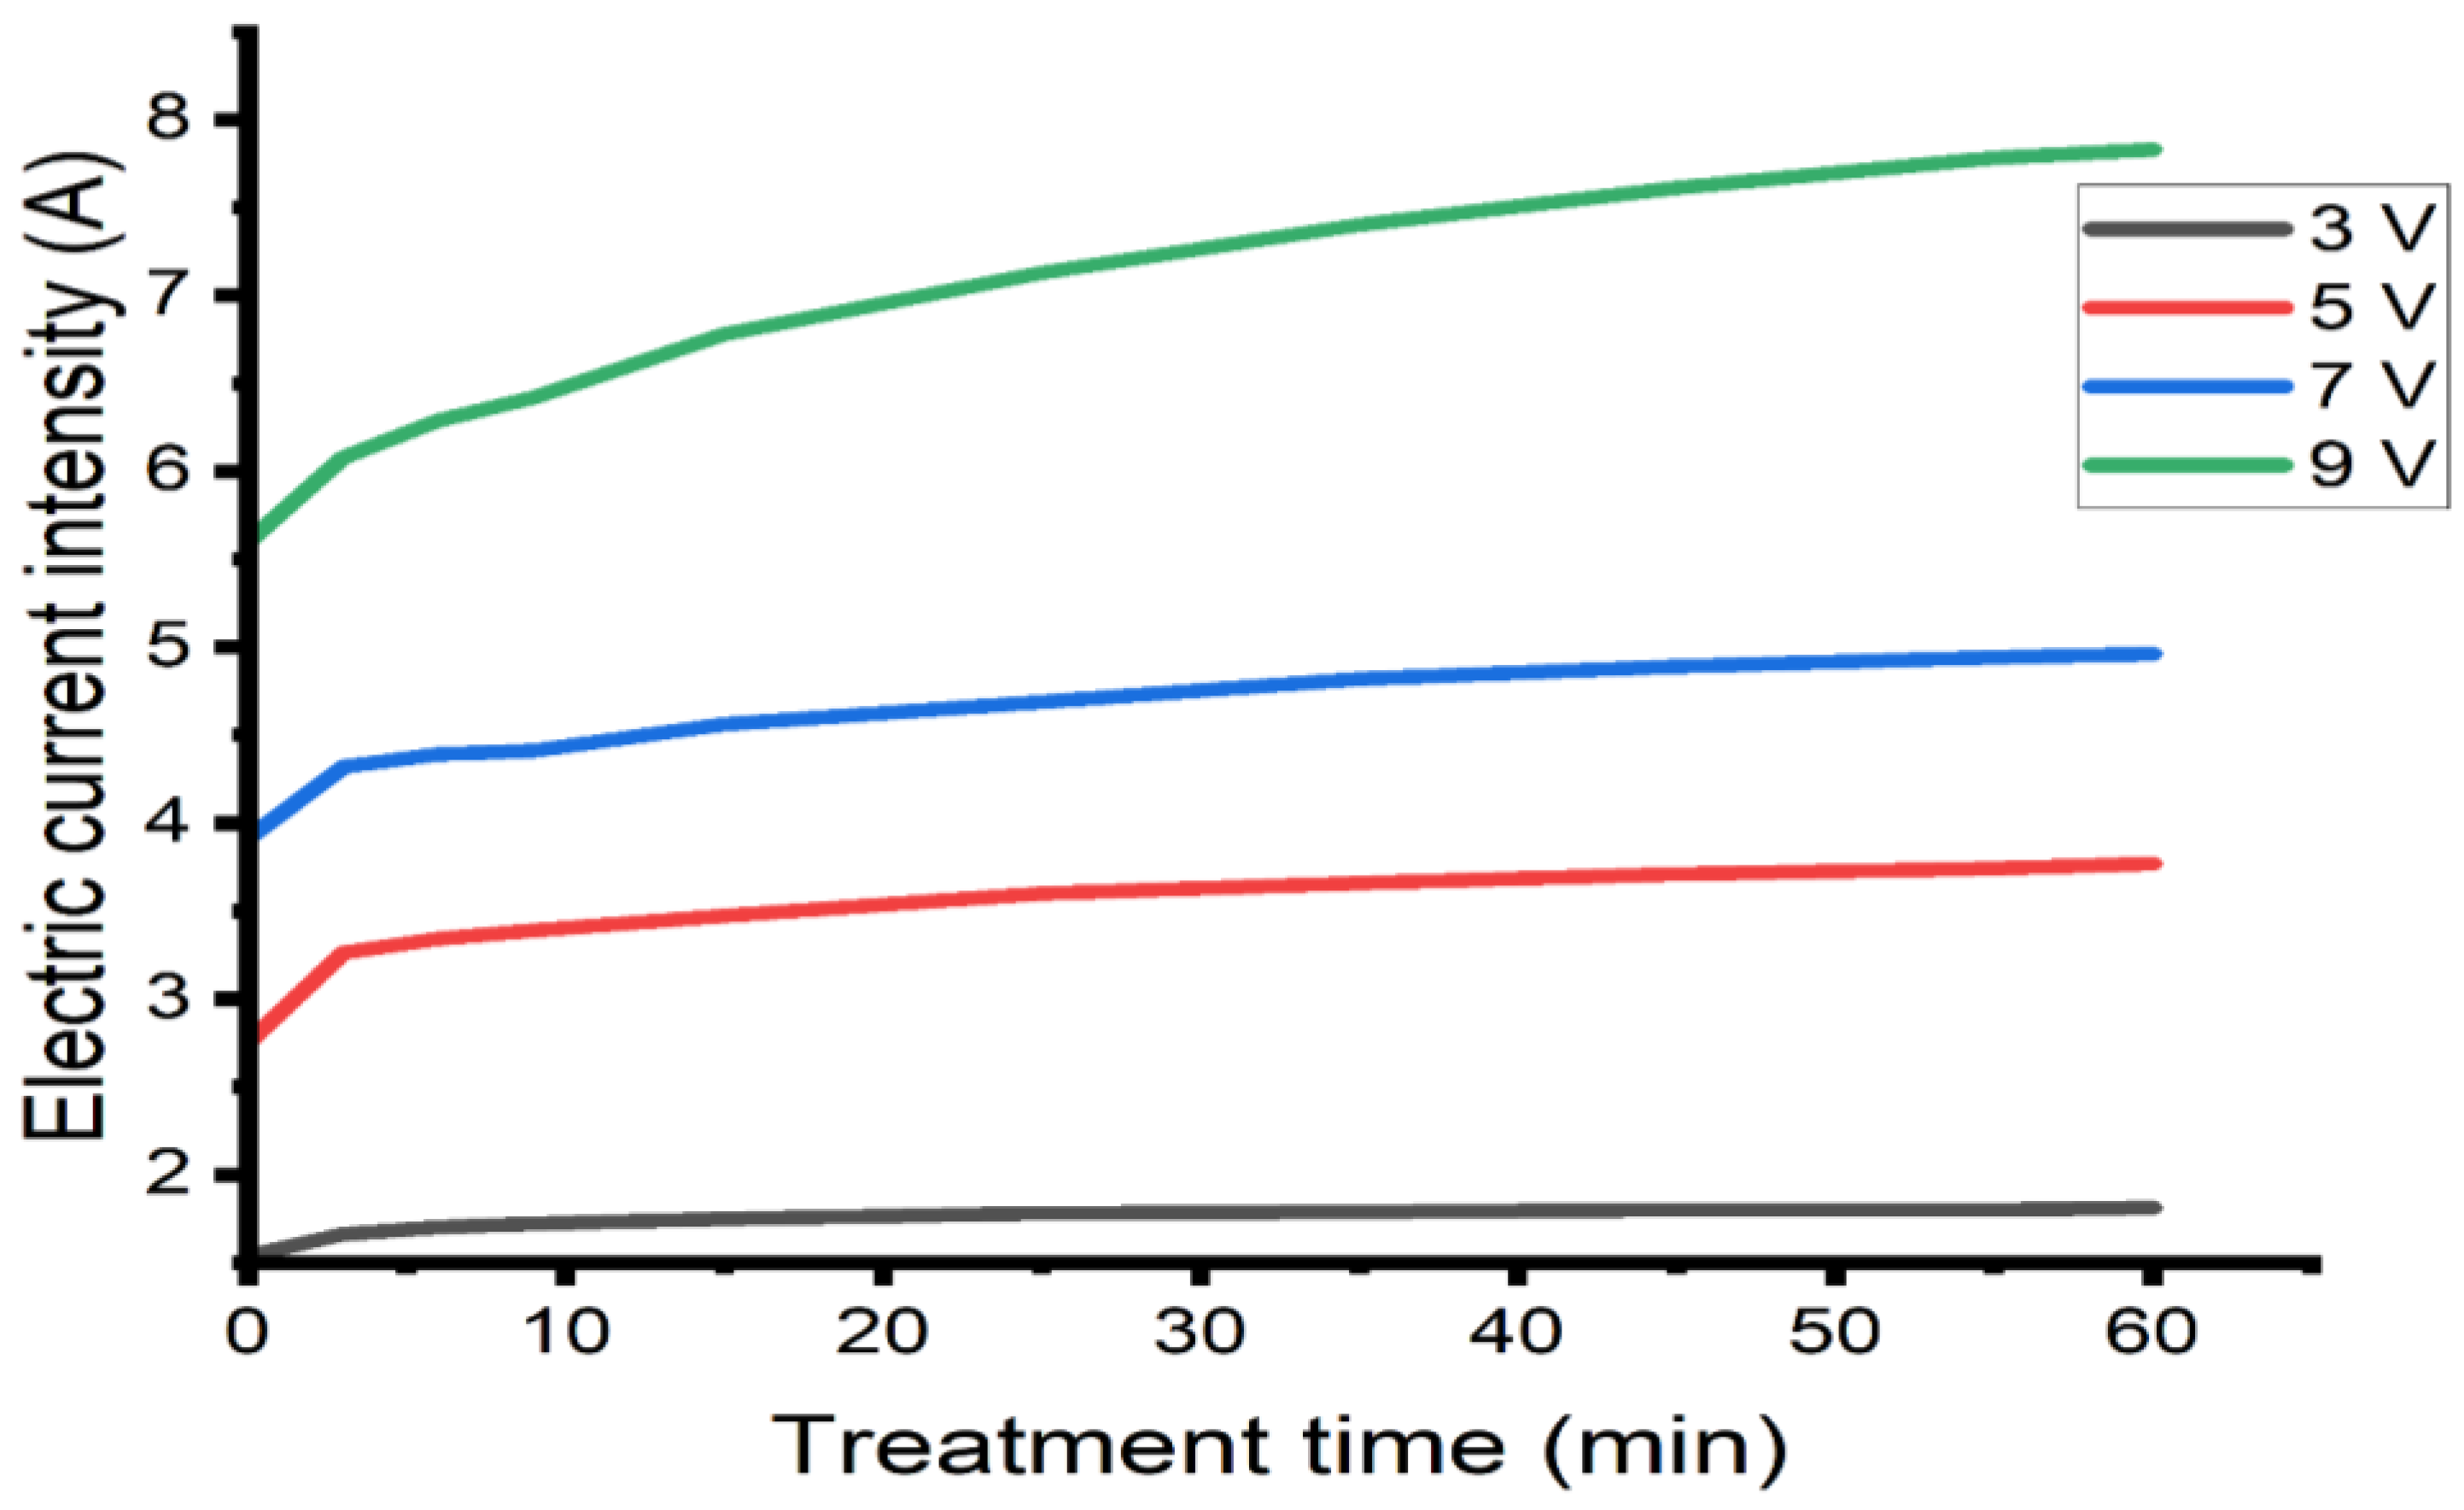
3.3. Electric Current Analysis

Figure 3 shows the evolution of the electrical current as a function of time for an initial concentration of 3300 mg/L. The results indicated that the current intensity increases as the electrical potential applied to the electrocoagulation cell increases, likewise it is observed for 3.5 and 7 V the electrical current remains constant during the 60 min of treatment. The same trend was observed in the experiments with the initial salt concentration of 7400 g/L (See Figure 4). The application of an electrical potential of 9 V significantly affects the increase in electrical current, reaching an intensity of 7.8 A.

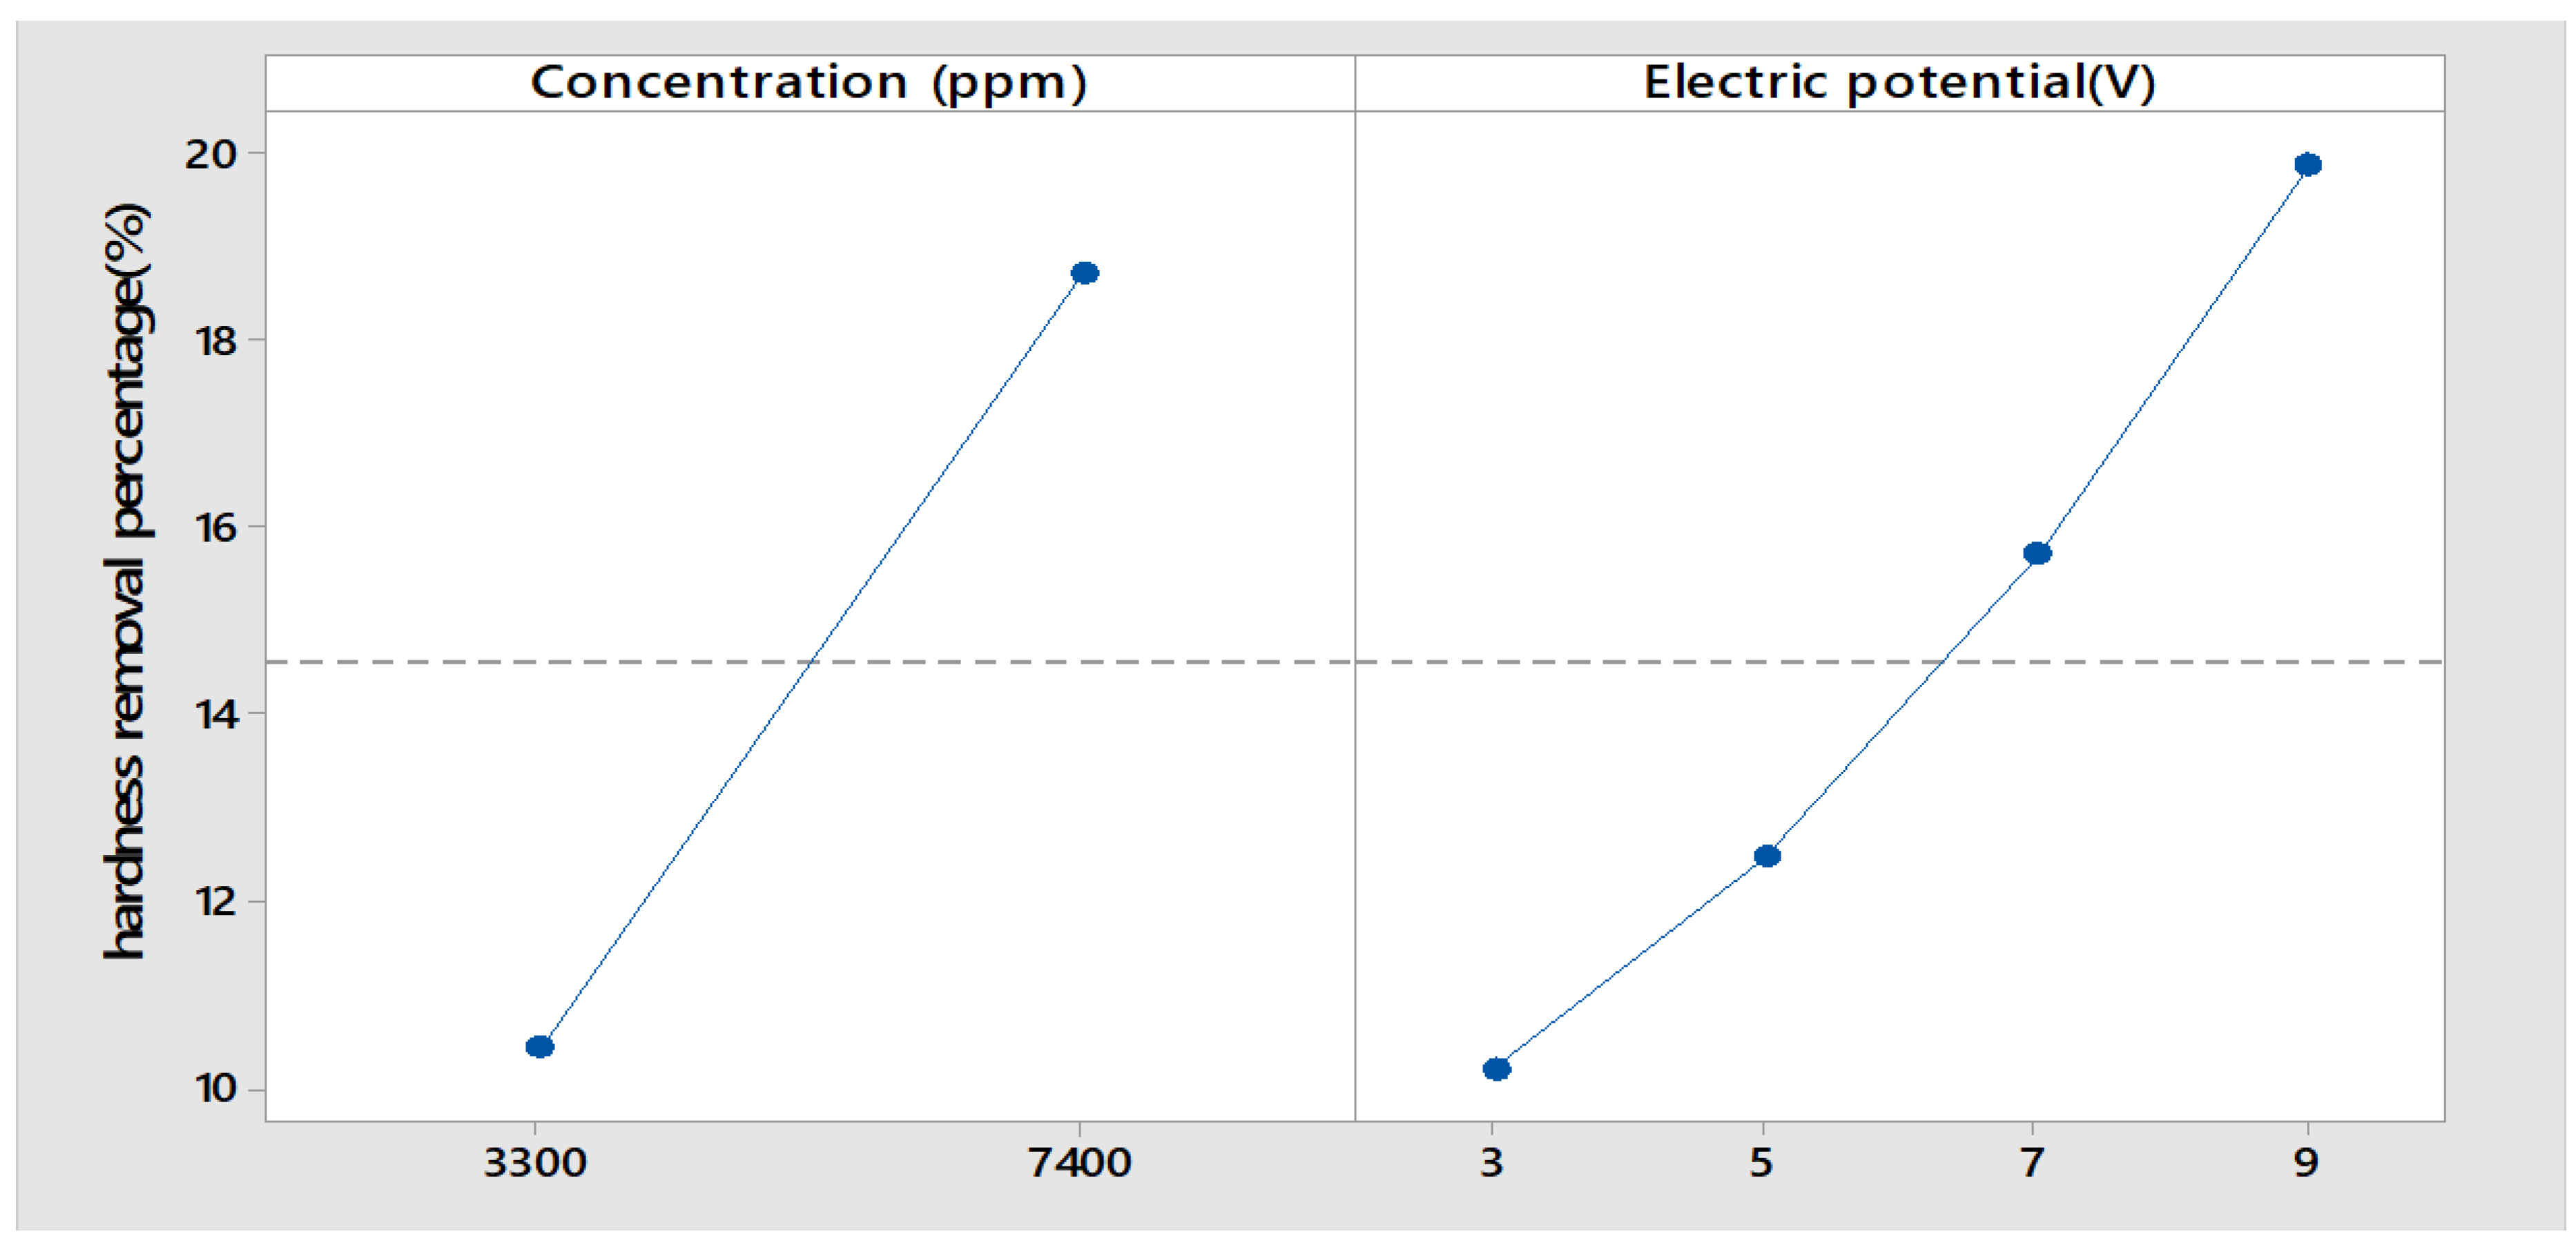
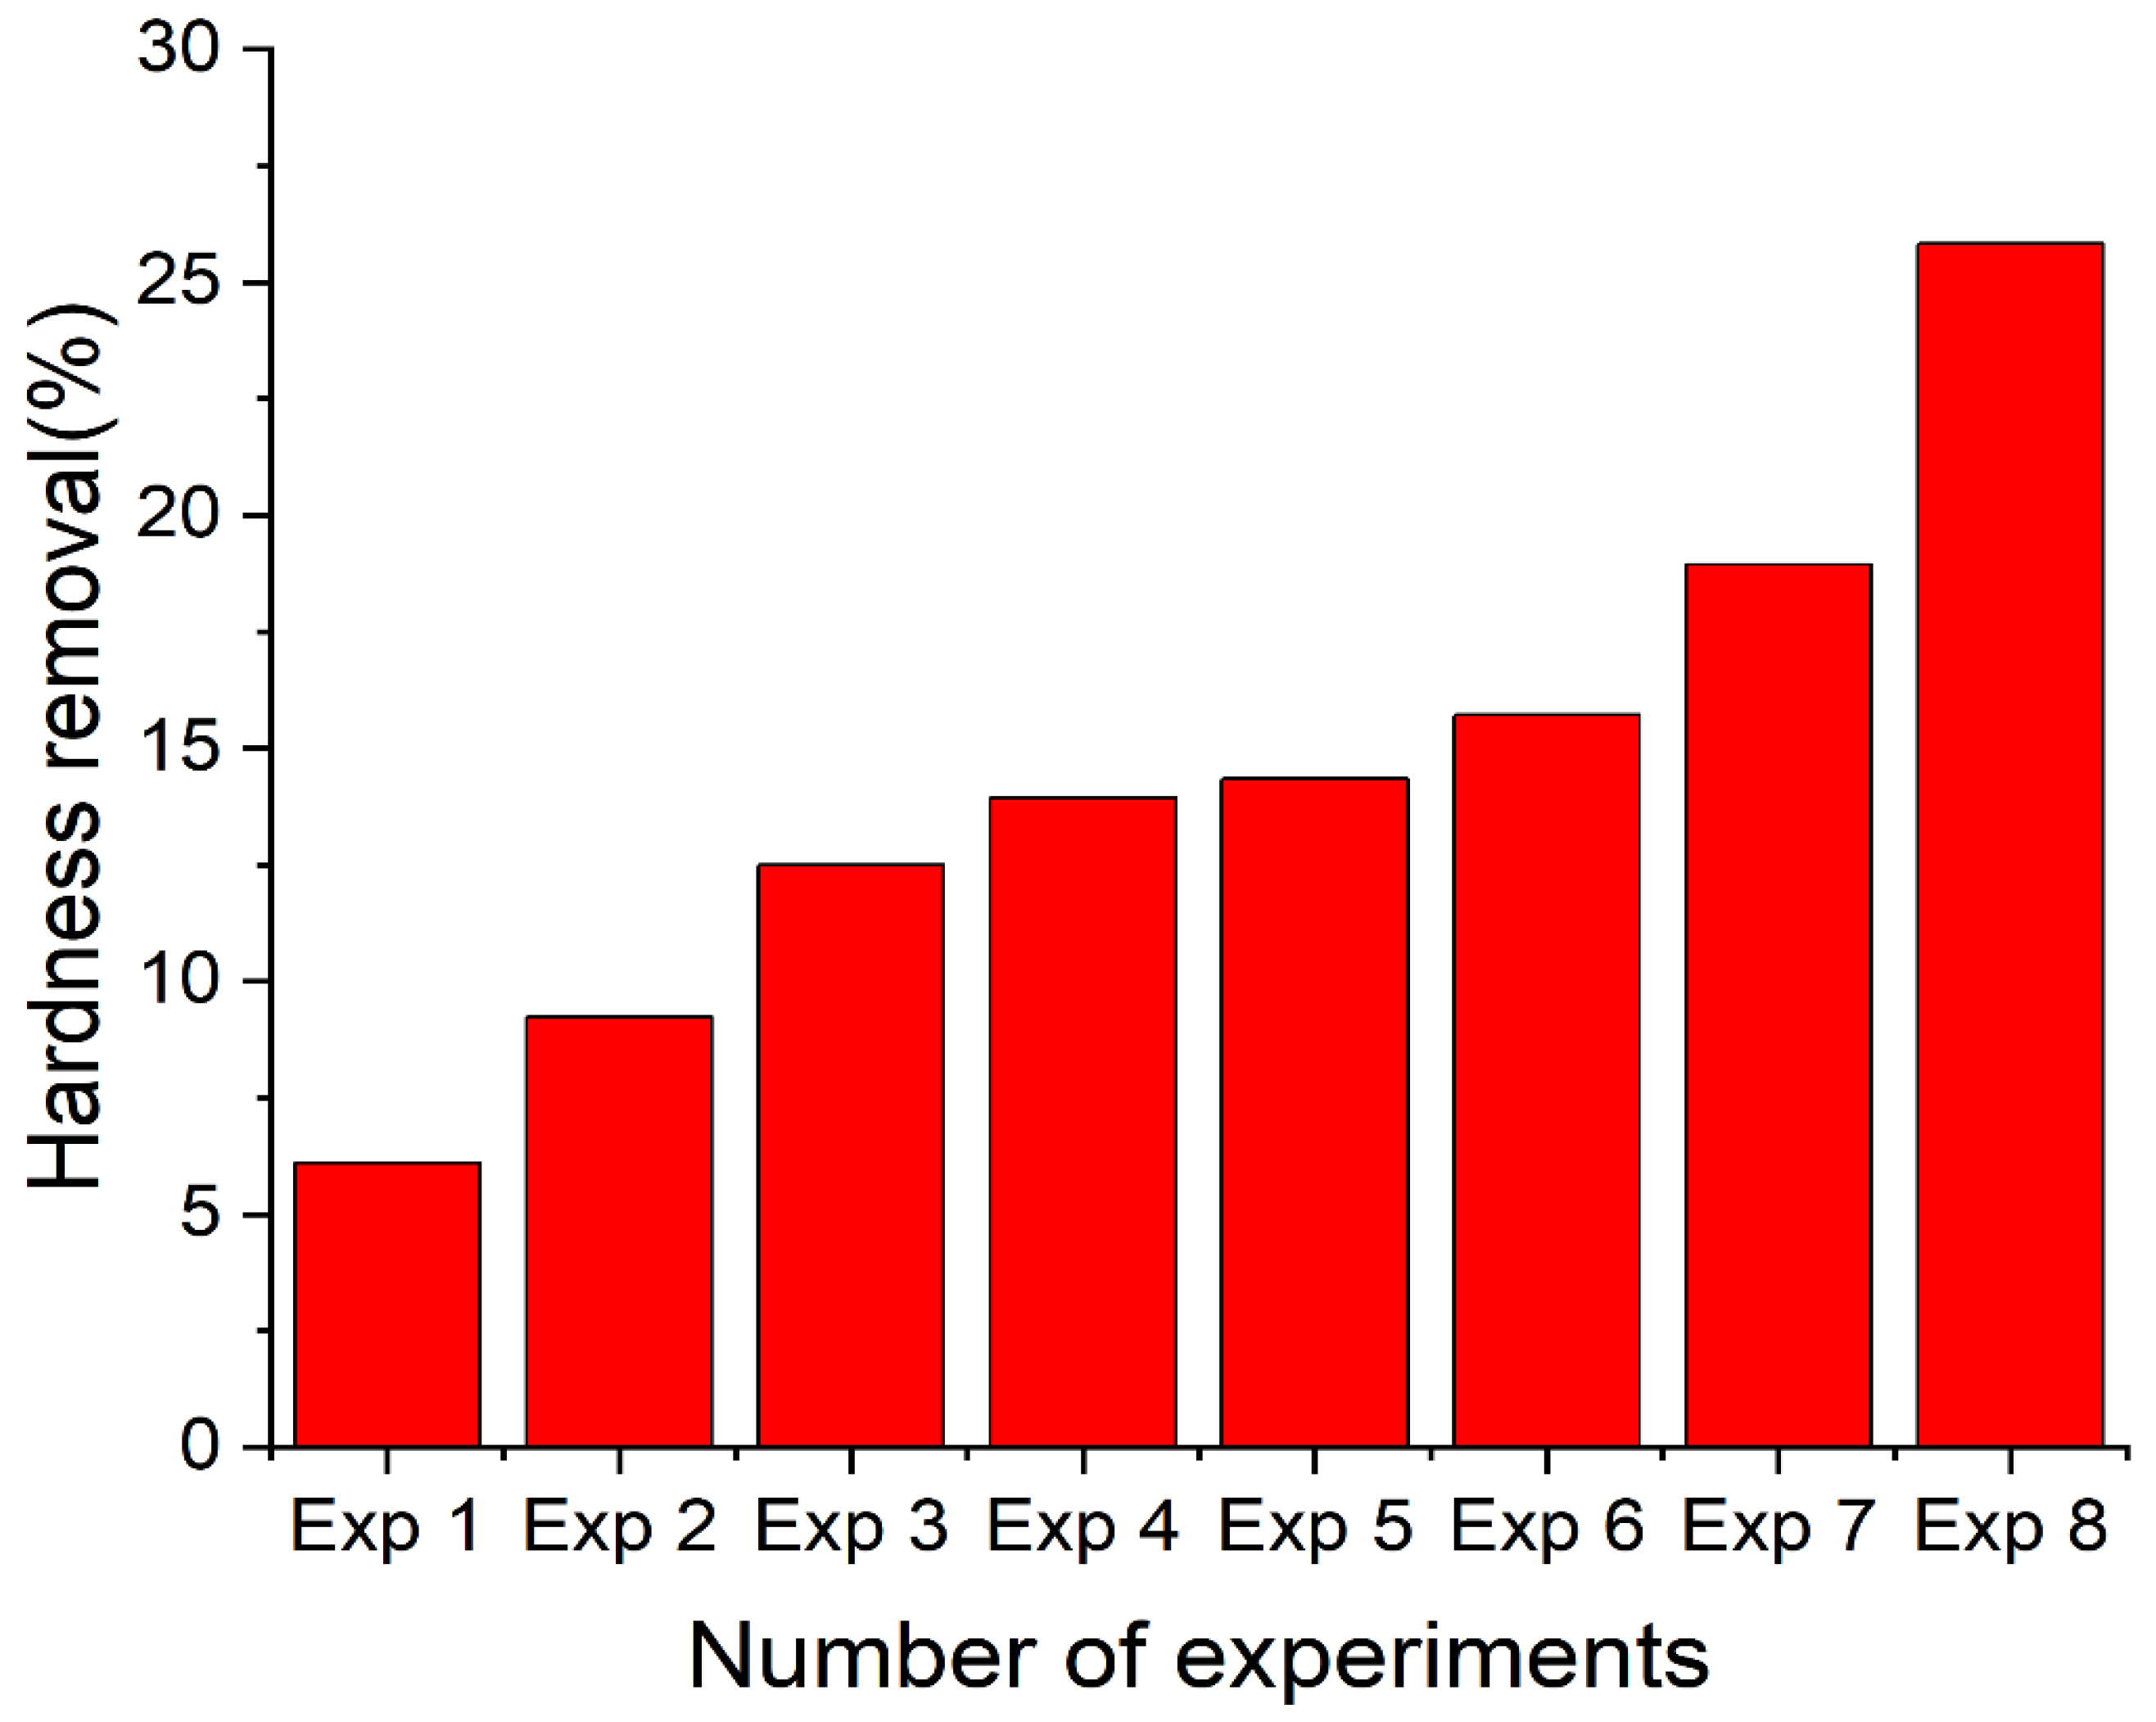
3.4. Removal of Hardness

Due to the increase in pH in the vicinity of the cathode as a result of the electrochemical dissociation of water, according to Equation (4), calcium carbonate accumulates in the cathode during the electrocoagulation process, which increases the consumption of electrical energy and reduces the efficiency of hardness removal. The formation of the precipitate is described in reactions 9 and 10 according to [44]
H C O 3 1 + O H 1 C O 3 2 + H 2 O
C O 3 2 + C a 2 + C a C O 3 ( s )
Figure 5 shows the percentage of calcium hardness removal as a function of the electrical potential applied to the electrocoagulation cell. As the electrical potential increases, the percentage of removal increases linearly for 3, 5 and 7 V for both solutions. However, when the potential is 9 V, an increase in the slope of the hardness removal efficiency is shown.
As the electrical potential increases, the amount of oxidized aluminum increases and, consequently, the hydroxide flocs increase with a high adsorption rate and this leads to an increase in hardness removal efficiency. The results of this study are consistent with the reported results of the evaluation work of seawater hardness reduction via electrocoagulation [45]. The reported removal efficiency varies between 8%, 10% and 13% in 60 min of treatment as indicated in Table 7. It is observed that the removal efficiency did not change significantly with the increase in current density. (5.6, 11.2 y 22.8 mA/cm2) Table 7 also shows the results of our work on the efficiency of calcium hardness removal for different electrical potentials (5, 7 and 9 V) applied during 60 min of treatment. The removal efficiency of calcium hardness from brackish water varied between 8% and 25% (Table 7).
This low hardness removal efficiency could be explained by the permanent formation of a calcium carbonate layer on the cathode. However, fouling remains a possible limitation of the electrocoagulation process that can be detected by an increase in electrical current and electrical energy consumption [45]. Figure 6 shows the percentage of calcium hardness removal for the tests carried out according to 2. It is observed that the maximum removal efficiency is 25.83% in the experiment (Exp 8), and has been achieved with an initial concentration of 7400 mg/L and an electrical potential difference of 9 V in 60 min of treatment. By increasing the electrical potential applied to the electrocoagulation cell, the amount of oxidized aluminum increases and consequently, the hydroxide flocs formed increase and this leads to an increase in the efficiency of hardness removal.

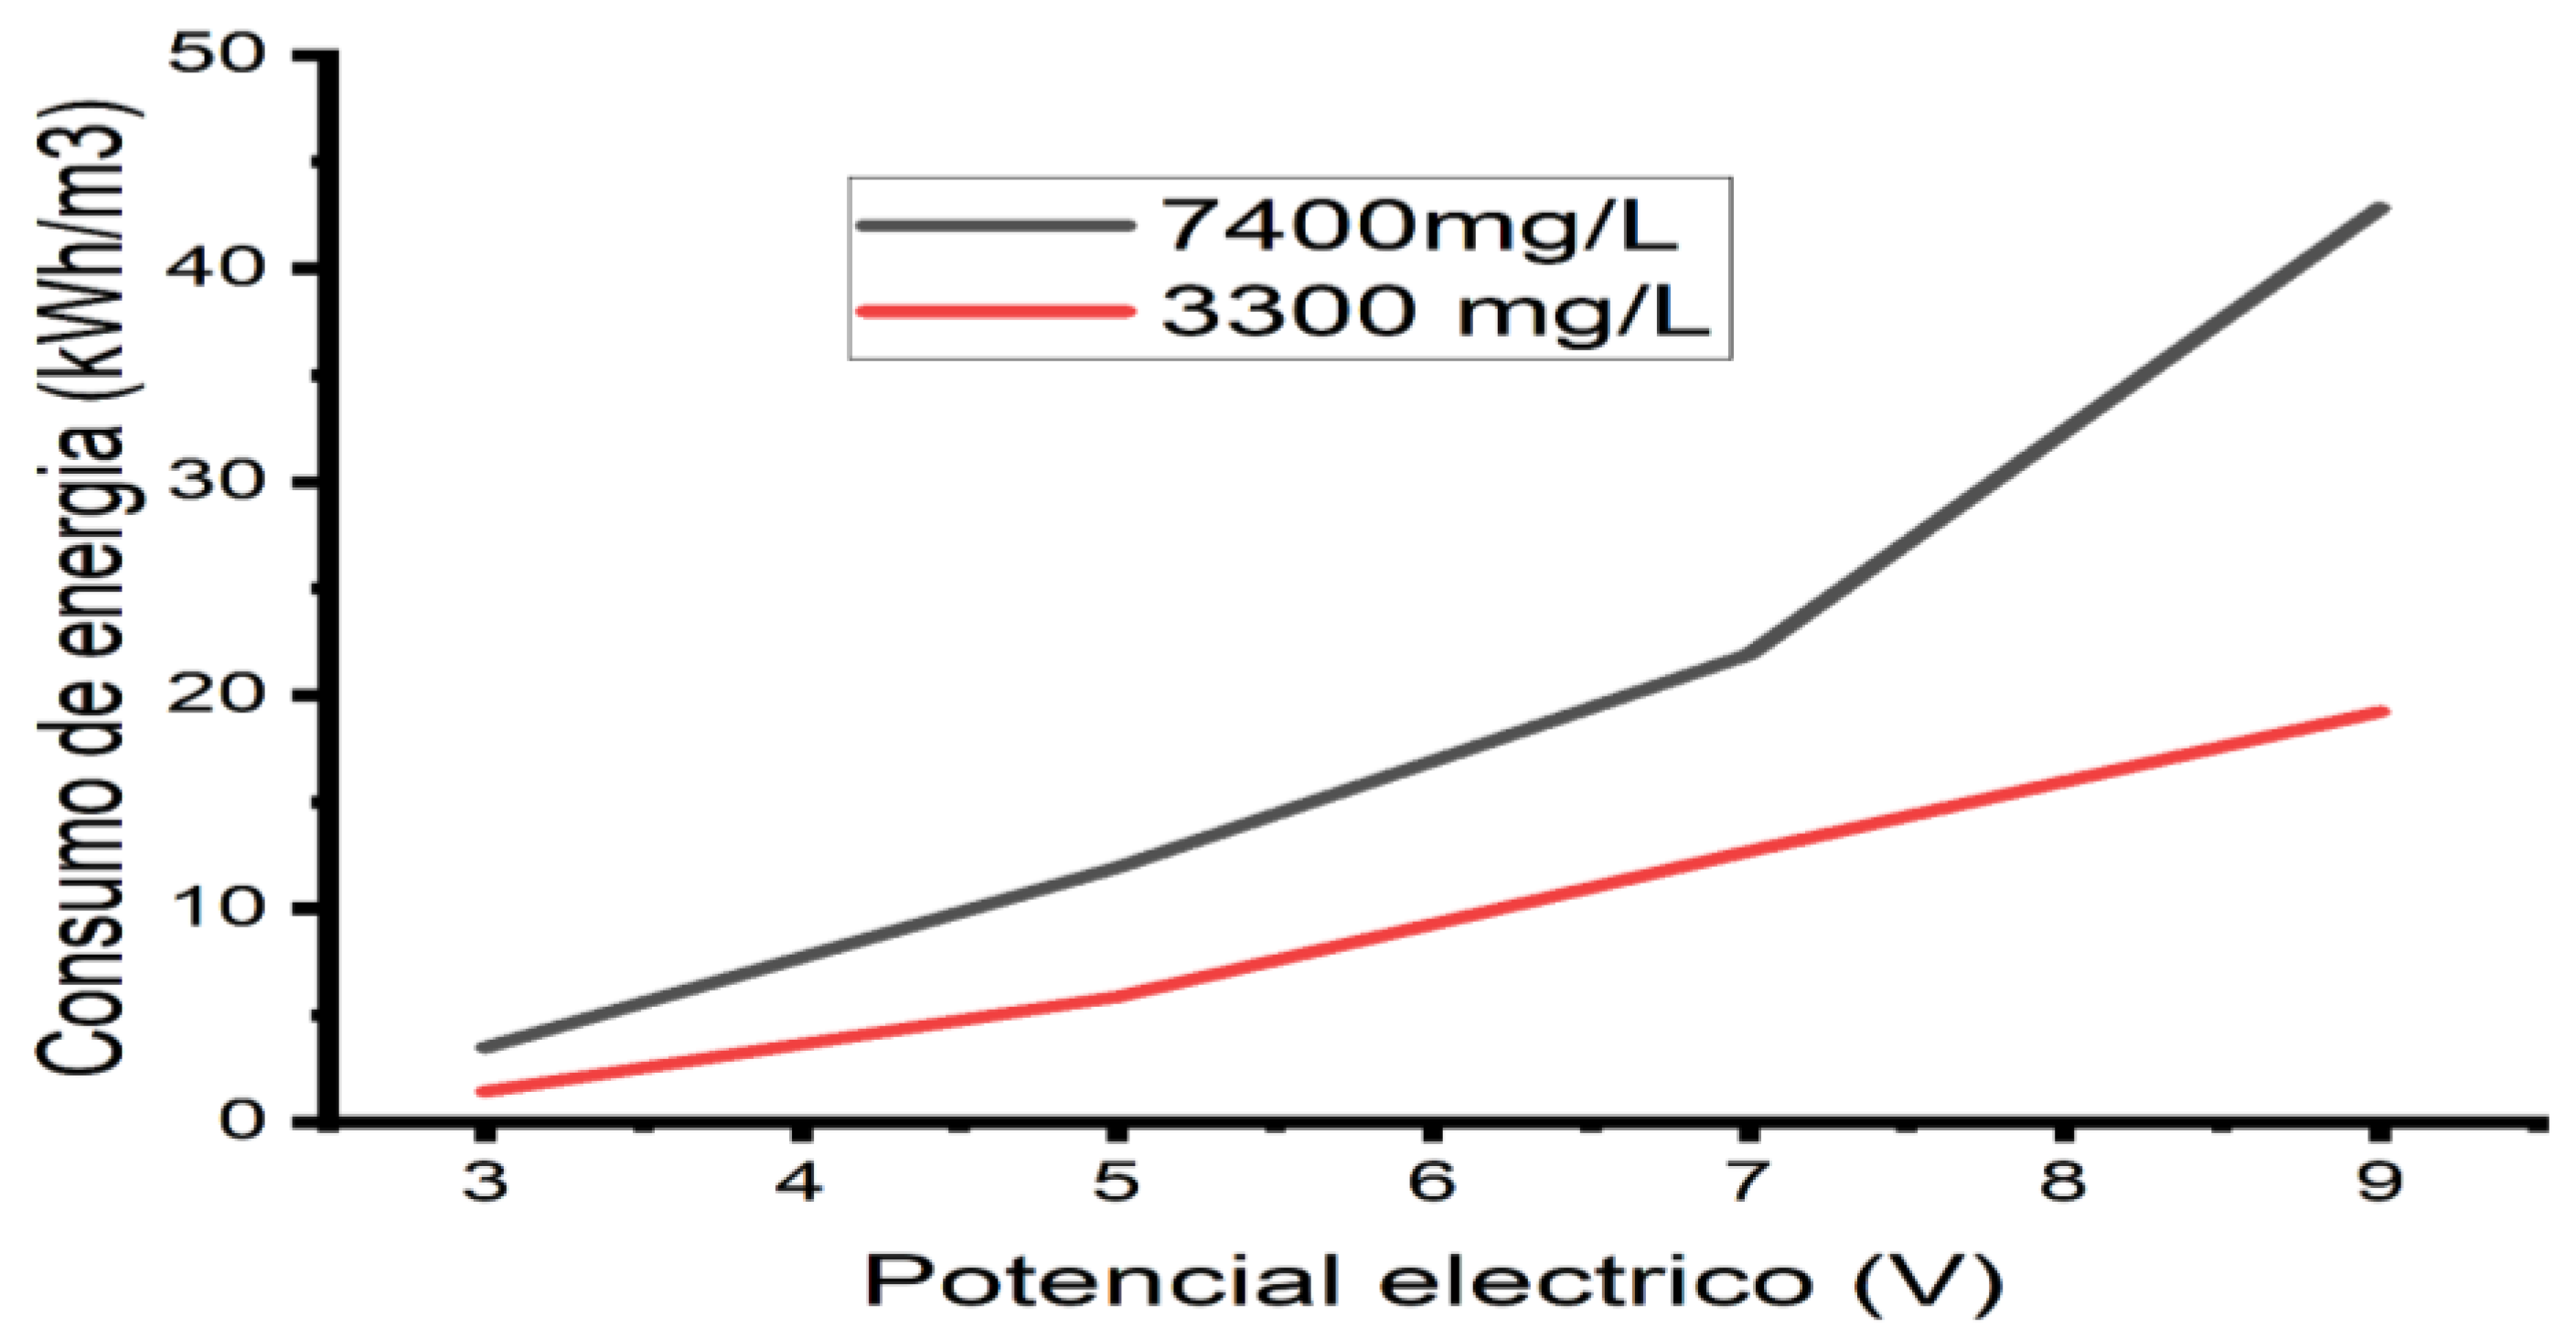
3.5. Enenergy Consumption Analysis

Power consumption was calculated using Equation (10). Figure 7 shows the electrical energy consumption for the two variables studied, when the concentration of the model solution is 3300 mg/L, the energy consumption ranged between 0.5 and 18 kW. h.m−3, while it ranged between 3, 5 and 46 kW. h.m−3 for the 7400 mg/L with the application of an electrical potential of 3, 5, 7, and 9 V. The results indicated that the increase in the electrical potential applied to the electrocoagulation cell significantly affects the energy consumption, as clearly shown in Figure 7. In previous studies, it was observed that the energy consumption increases markedly when a higher electrical potential is applied to the electrocoagulation cell [46]. The energy consumption increases with the intensity of electric current, and the applied potential due to the increase of polarization in the electrodes. Many researchers have reported in the literature for some aqueous solutions, the energy consumption increases proportionally with the electrical conductivity. The high consumption of electrical energy is partly due to the conversion into heat energy, which produces an increase in the temperature of the aqueous solution (Figure 8).

3.6. pH Analysis

Figure 9 shows the initial pH of the synthetic solutions (7.65 and 7.6) and the pH of the solutions reached in 60 min of previously filtered treatment. It is observed, experiment eight (Exp 8) reaches the pH (8.36) and the best removal (25.83%) of calcium hardness as indicated in Table 3.

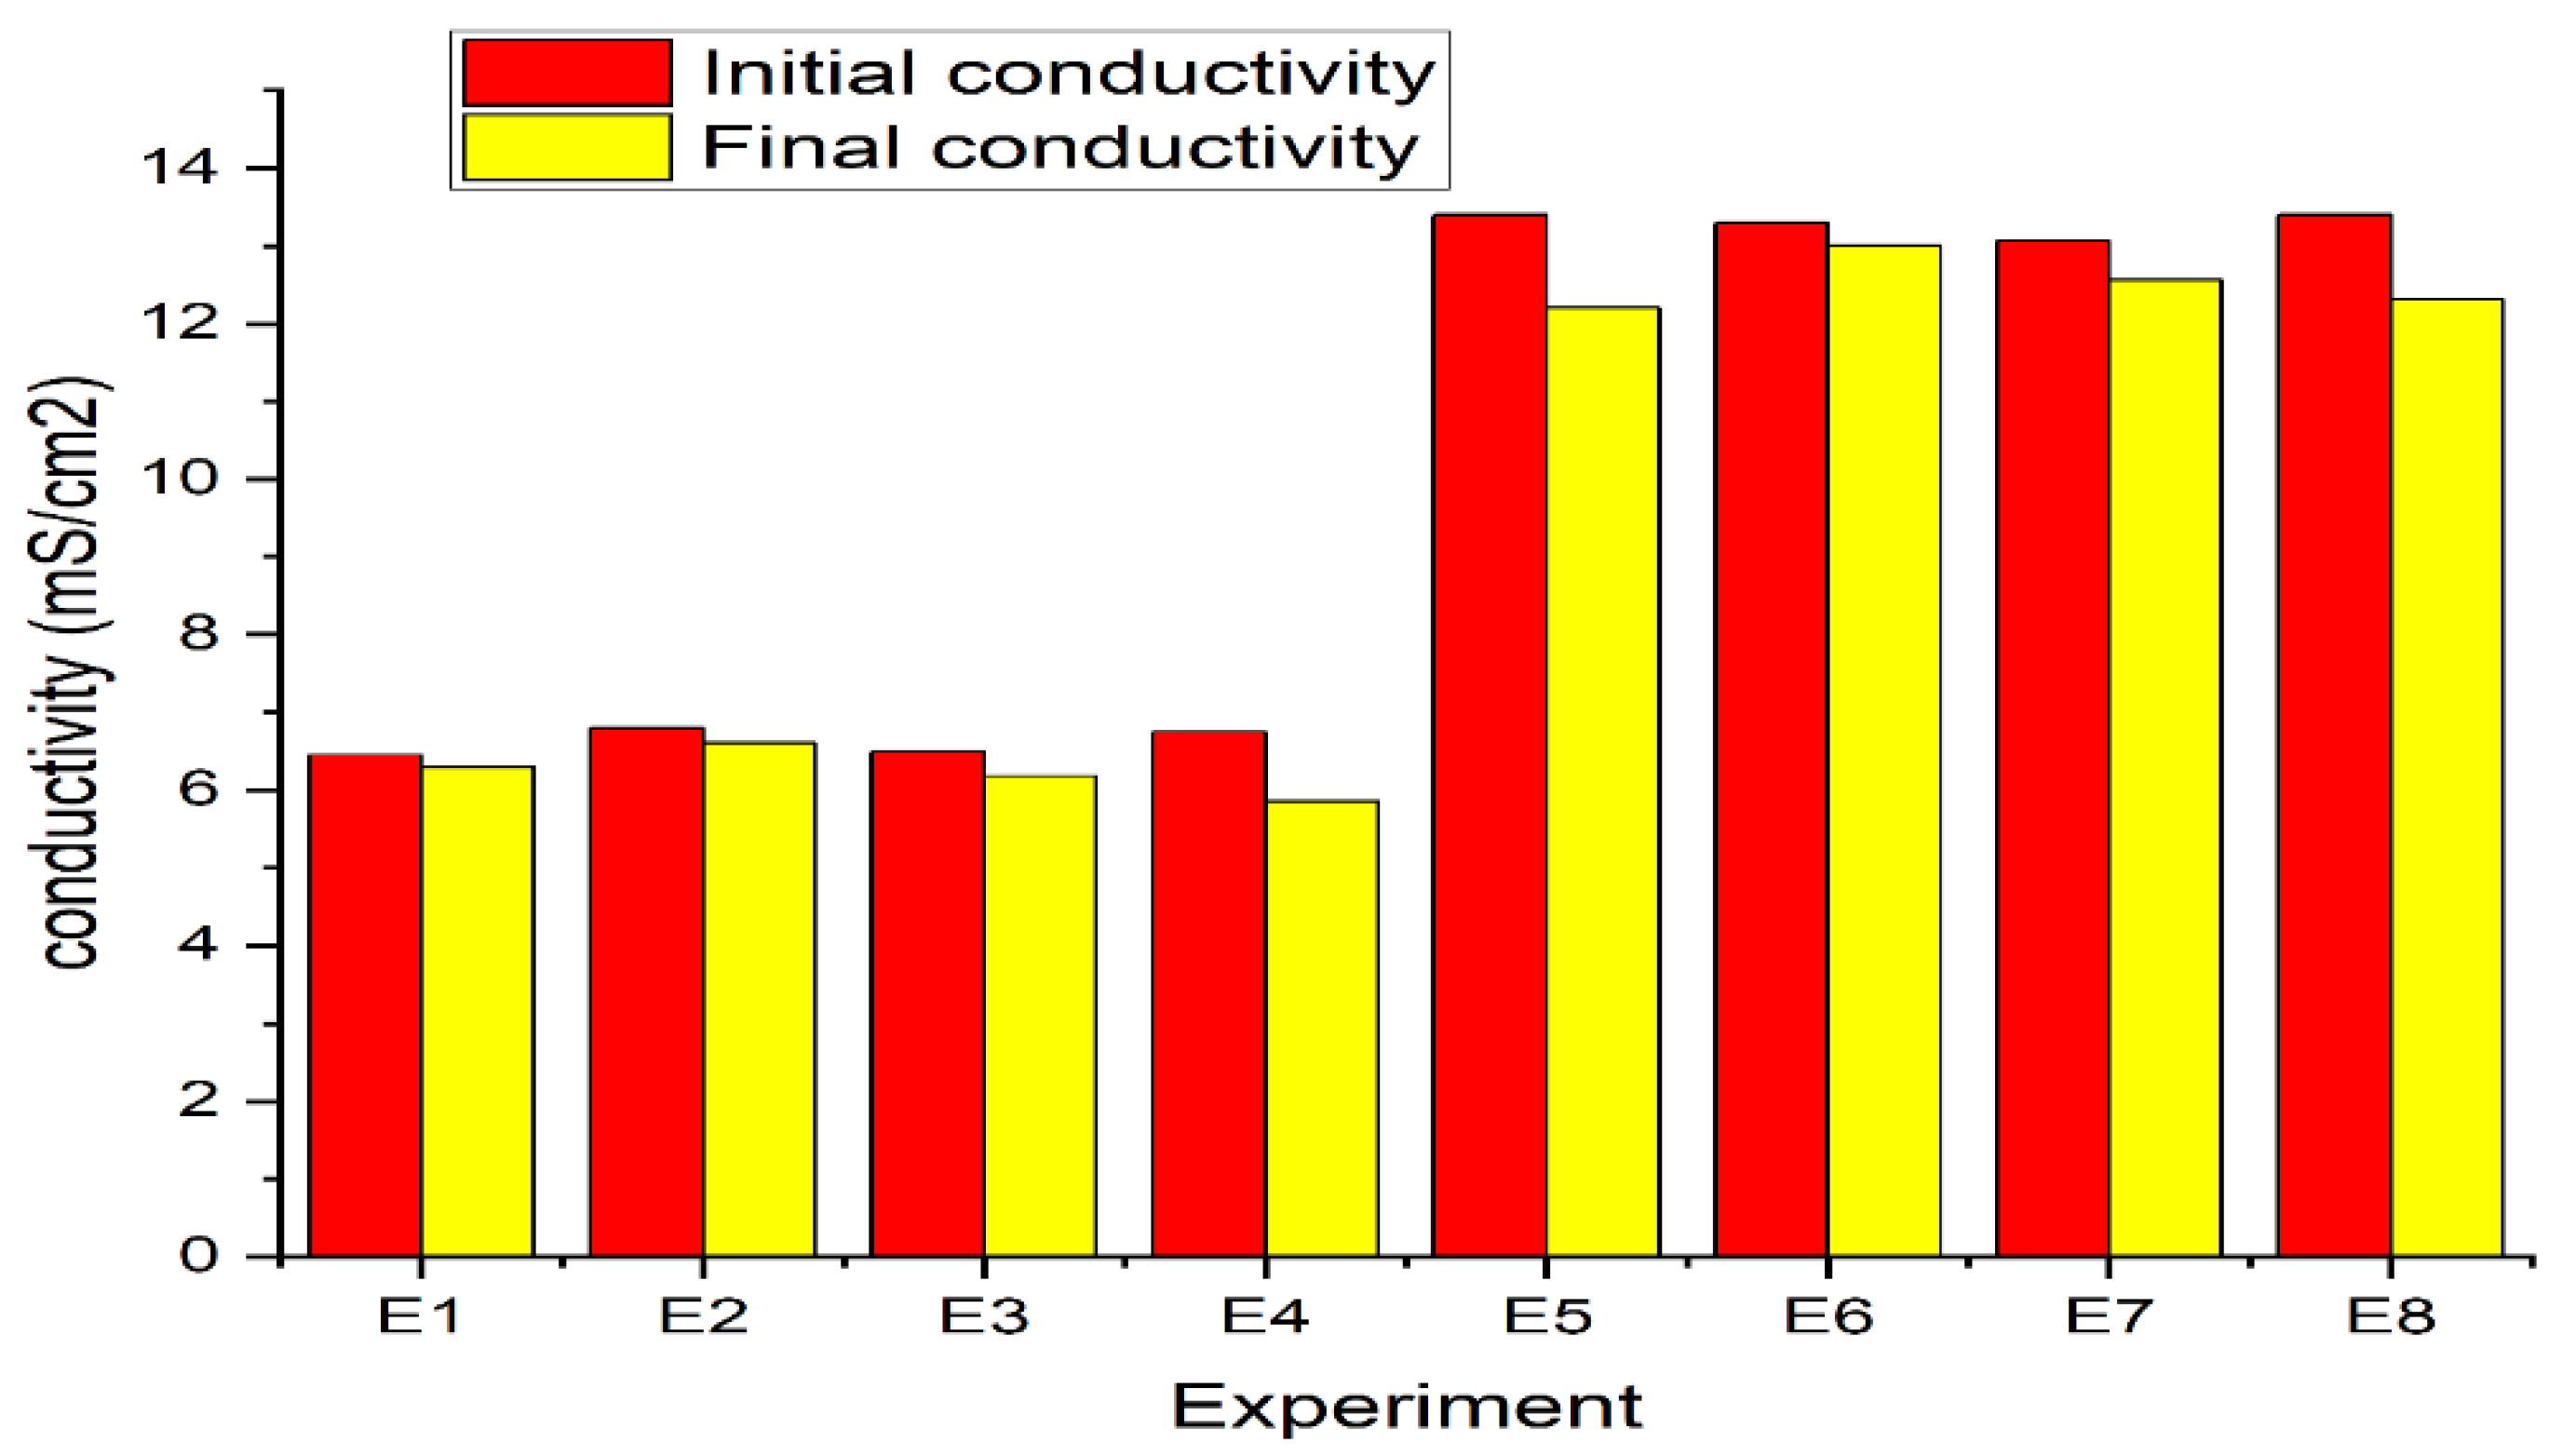
3.7. Electrical Conductivity Analysis

Figure 10 shows the changes in electrical conductivity for the experiments carried out. It is observed that the electrical conductivity of the water samples shows a slight decrease after 60 min of treatment. These differences are greater when an electrical potential of 7 and 9 volts is applied, as shown in the experiments (E7 and E8). In experiment E8, the electrical conductivity decreases from 13.4 mS/cm to 12.3 mS/cm with a conductivity reduction efficiency of 8.2%. The slight decrease in salinity is explained by the precipitation of calcium carbonate (CaCO3) and adsorption on aluminum hydroxide. These results are consistent with research reported by [45].

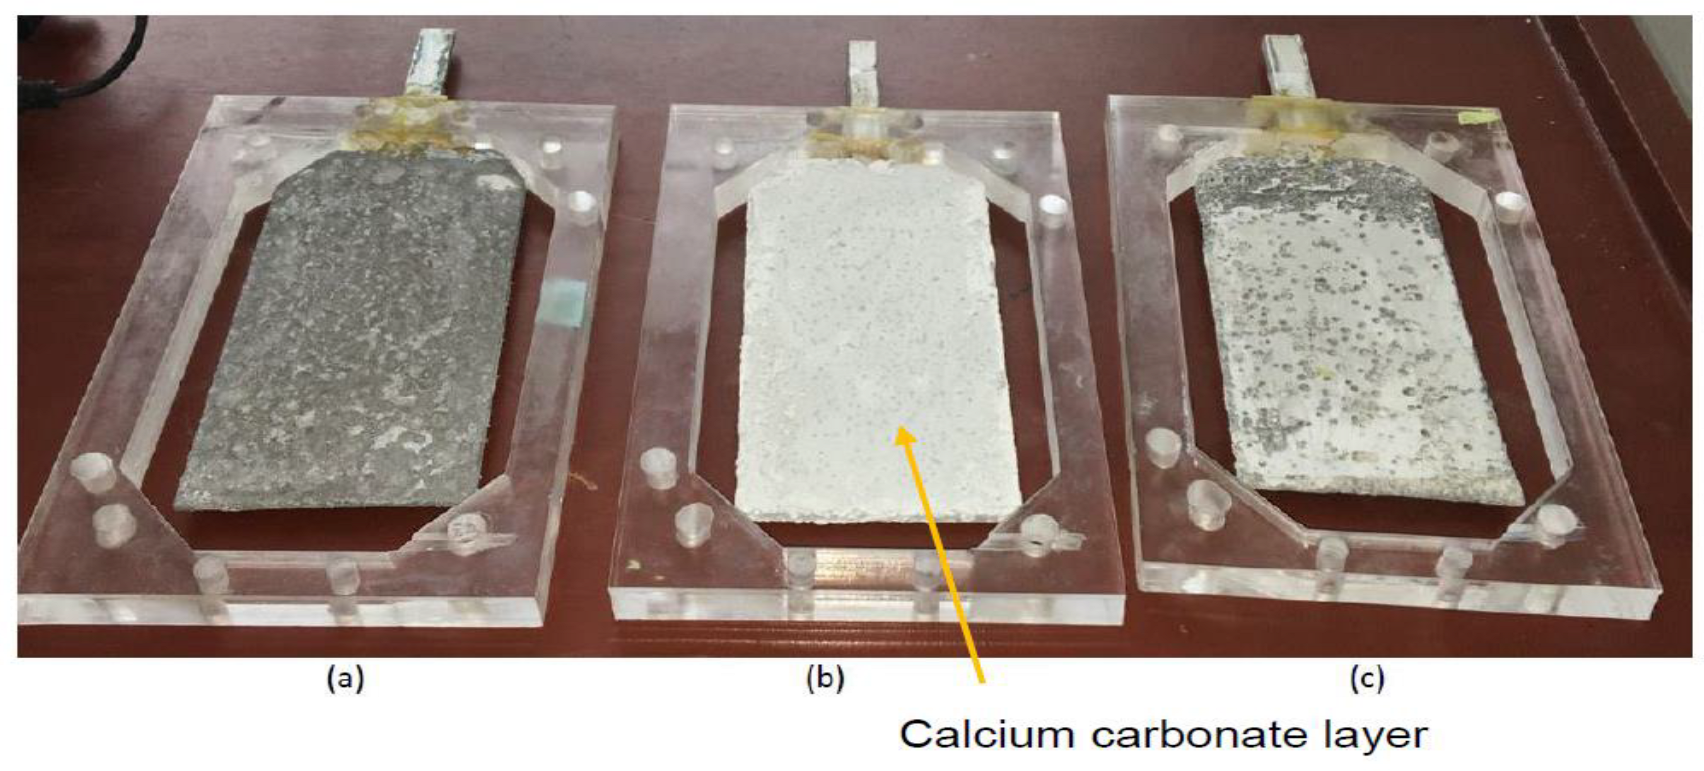
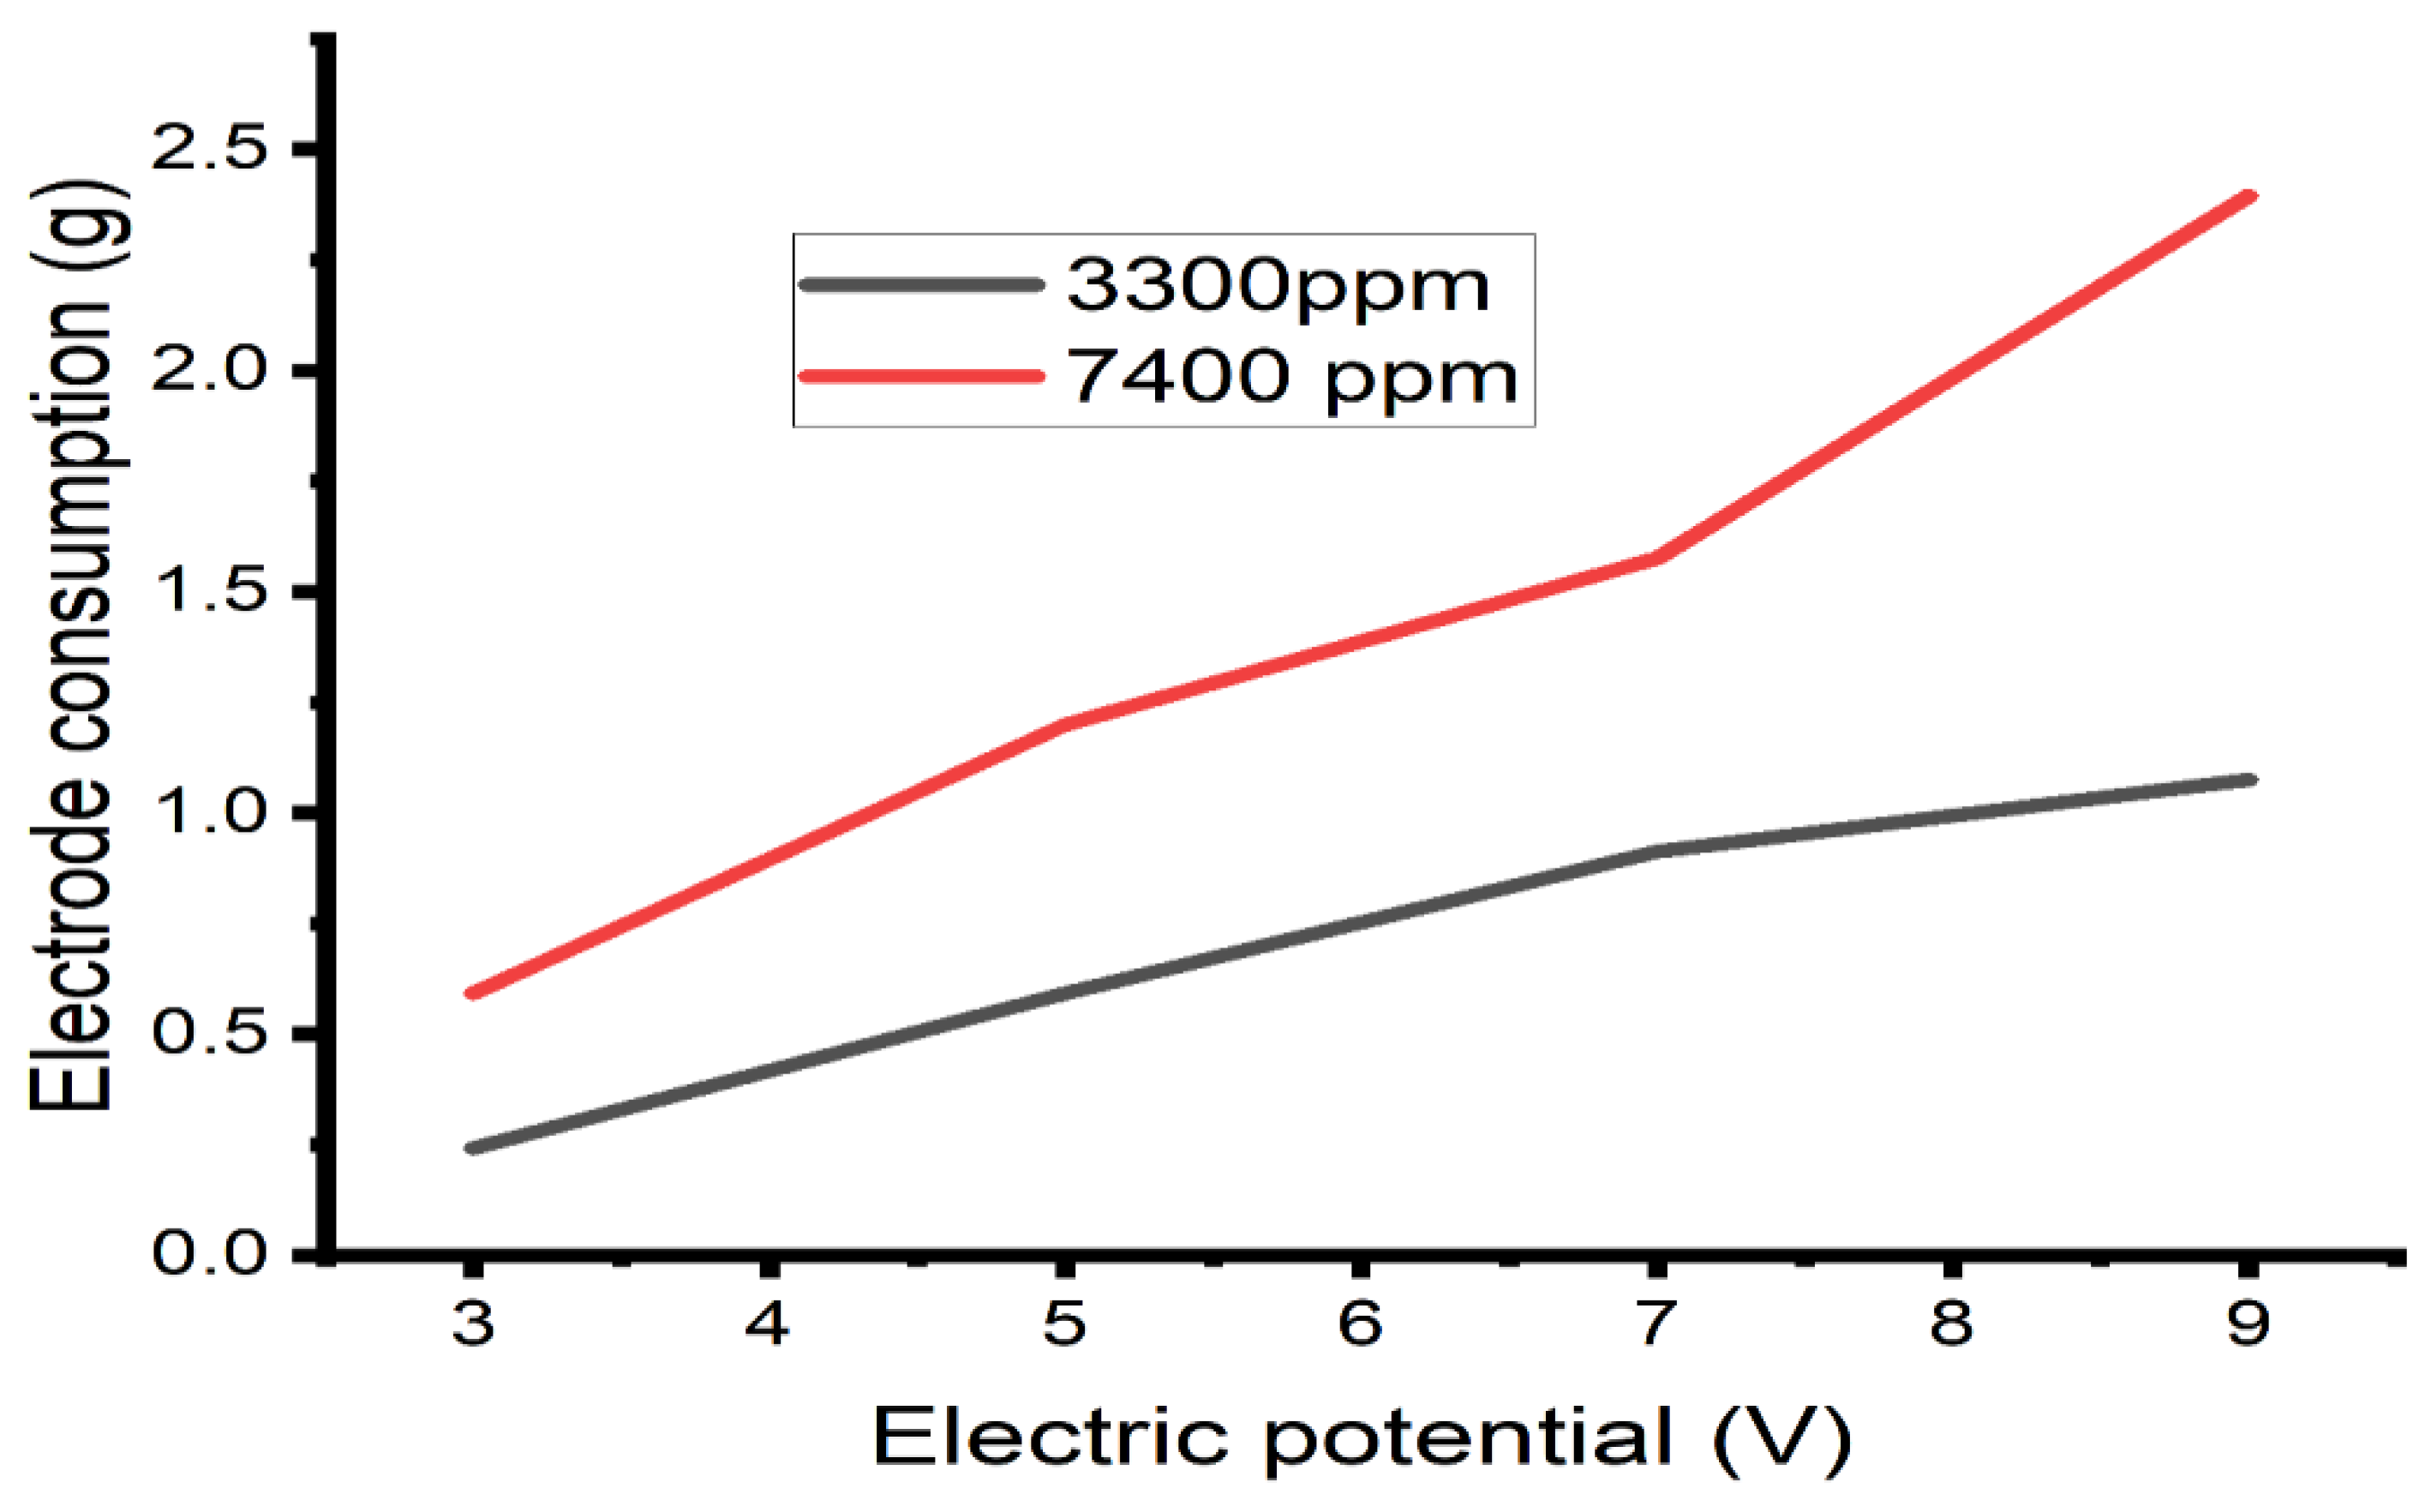
3.8. Consumption of Electrodes

The theoretical consumption of the electrode was calculated using Equation (6). Figure 11 shows the consumption of the electrode as a function of the electrical potential applied for the two concentrations studied. It is observed that the consumption of the electrode increases as the potential and concentration increase. of the electrolyte. Generally, TCE are directly related to electrolysis time and current density [47,48]. Also, a high electric current leads to a decrease in the weight of the electrodes and an increase in the amount of mass released from the anode to the solution [49].

4. Conclusions

In the present study, a new batch-operated electrocoagulation reactor was evaluated in reducing the calcium hardness of a model solution with a concentration similar to that of brackish groundwater, using aluminum (Al) electrodes. In addition, the effect of electrical potential (3, 5, 7 and 9 V) applied to the electrocoagulation cell and initial concentration of (3300 and 7400 mg/L) was studied with respect to the efficiency of reduction of calcium hardness and the specific energy consumption. All applied potentials led to a significantly low percent calcium hardness removal (6–25% over a 60 min treatment time). The most favorable values for the removal of water hardness are at an electrical potential of 9 volts and a concentration of 7400 mg/L, reaching a removal of 25% and a specific energy consumption of 42 kWh/m3, respectively.
The increase of the electrical potential applied to the electrocoagulation cell was significant with respect to the electrical energy consumption. Likewise, the increase in the concentration of the model solution increased the electric current intensity, as shown in Figure 3, Figure 4 and Figure 7.
During the operation, the electrodes were passivated and a calcium carbonate deposition was found on the cathode, as shown in the Figure 8. This result recommends for future work to reverse the electrical current in the electrodes on a regular basis to avoid passivation to a great extent.

Author Contributions

Conceptualization, J.A.R.-H.; Methodology, X.C.G.; Software, J.A.M.-P.; Formal analysis, G.E.R.-M.; Investigation, J.T.M.-C.; Visualization, E.J.F.-G. All authors have read and agreed to the published version of the manuscript.

Funding

This research was funded by National University of Callao in Lima Peru.

Institutional Review Board Statement

Not applicable.

Informed Consent Statement

Not applicable.

Data Availability Statement

Not applicable.

Conflicts of Interest

The authors declare no conflict of interest.

References

  1. Rabeh, T.; Ali, K.; Bedair, S.; Sadik, M.A.; Ismail, A. Exploration and evaluation of potential groundwater aquifers and subsurface structures at Beni Suef area in southern Egypt. J. Afr. Earth Sci. 2018, 151, 9–17. [Google Scholar] [CrossRef]
  2. Sepehr, M.N.; Yetilmezsoy, K.; Marofi, S.; Zarrabi, M.; Ghaffari, H.R.; Fingas, M.; Foroughi, M. Synthesis of nanosheet layered double hydroxides at lower pH: Optimization of hardness and sulfate removal from drinking water samples. J. Taiwan Inst. Chem. Eng. 2014, 45, 2786–2800. [Google Scholar] [CrossRef]
  3. Koo, C.H.; Mohammad, A.W.; Suja, F. Recycling of oleochemical wastewater for boiler feed water using reverse osmosis membranes—A case study. Desalination 2011, 271, 178–186. [Google Scholar] [CrossRef]
  4. Zarga, Y.; Ben Boubaker, H.; Ghaffour, N.; Elfil, H. Study of calcium carbonate and sulfate co-precipitation. Chem. Eng. Sci. 2013, 96, 33–41. [Google Scholar] [CrossRef]
  5. Szymanek, K.; Charmas, R.; Piasecki, W. A study on the mechanism of Ca2+ adsorption on TiO2 and Fe2O3 with the usage of calcium ion-selective electrode. Chemosphere 2019, 242, 125162. [Google Scholar] [CrossRef]
  6. Zhu, B.; Hu, X.; Shin, J.-W.; Moon, I.-S.; Muraki, Y.; Morris, G.; Gray, S.; Duke, M. A method for defect repair of MFI-type zeolite membranes by multivalent ion infiltration. Microporous Mesoporous Mater. 2016, 237, 140–150. [Google Scholar] [CrossRef]
  7. Tzotzi, C.; Pahiadaki, T.; Yiantsios, S.; Karabelas, A.; Andritsos, N. A study of CaCO3 scale formation and inhibition in RO and NF membrane processes. J. Membr. Sci. 2007, 296, 171–184. [Google Scholar] [CrossRef]
  8. Goren, A.; Kobya, M.; Oncel, M. Arsenite removal from groundwater by aerated electrocoagulation reactor with Al ball electrodes: Human health risk assessment. Chemosphere 2020, 251, 126363. [Google Scholar] [CrossRef]
  9. Ergun, E.; Tor, A.; Cengeloglu, Y.; Kocak, I. Electrodialytic removal of fluoride from water: Effects of process parameters and accompanying anions. Sep. Purif. Technol. 2008, 64, 147–153. [Google Scholar] [CrossRef]
  10. Yi, S.; Ma, Y.; Wang, X.; Jia, Y. Green chemistry: Pretreatment of seawater by a one-step electrochemical method. Desalination 2009, 239, 247–256. [Google Scholar] [CrossRef]
  11. Subramani, A.; Cryer, E.; Liu, L.; Lehman, S.; Ning, R.Y.; Jacangelo, J.G. Impact of intermediate concentrate softening on feed water recovery of reverse osmosis process during treatment of mining contaminated groundwater. Sep. Purif. Technol. 2012, 88, 138–145. [Google Scholar] [CrossRef]
  12. Nidheesh, P.; Scaria, J.; Babu, D.S.; Kumar, M.S. An overview on combined electrocoagulation-degradation processes for the effective treatment of water and wastewater. Chemosphere 2020, 263, 127907. [Google Scholar] [CrossRef] [PubMed]
  13. Martínez-Huitle, C.A.; Brillas, E. Decontamination of wastewaters containing synthetic organic dyes by electrochemical methods: A general review. Appl. Catal. B Environ. 2009, 87, 105–145. [Google Scholar] [CrossRef]
  14. Lu, J.; Li, Y.; Yin, M.; Ma, X.; Lin, S. Removing heavy metal ions with continuous aluminum electrocoagulation: A study on back mixing and utilization rate of electro-generated Al ions. Chem. Eng. J. 2015, 267, 86–92. [Google Scholar] [CrossRef]
  15. Adhoum, N.; Monser, L.; Bellakhal, N.; Belgaied, J.-E. Treatment of electroplating wastewater containing Cu2+, Zn2+ and Cr(VI) by electrocoagulation. J. Hazard. Mater. 2004, 112, 207–213. [Google Scholar] [CrossRef]
  16. Al-Raad, A.A.; Hanafiah, M.M.; Naje, A.S.; Ajeel, M.A.; Basheer, A.O.; Aljayashi, T.A.; Toriman, M.E. Treatment of Saline Water Using Electrocoagulation with Combined Electrical Connection of Electrodes. Processes 2019, 7, 242. [Google Scholar] [CrossRef] [Green Version]
  17. Łuba, M.; Mikołajczyk, T.; Pierożyński, B.; Smoczyński, L.; Wojtacha, P.; Kuczyński, M. Electrochemical Degradation of Industrial Dyes in Wastewater through the Dissolution of Aluminum Sacrificial Anode of Cu/Al Macro-Corrosion Galvanic Cell. Molecules 2020, 25, 4108. [Google Scholar] [CrossRef]
  18. Xia, X.; Lan, S.; Li, X.; Xie, Y.; Liang, Y.; Yan, P.; Chen, Z.; Xing, Y. Characterization and coagulation-flocculation performance of a composite flocculant in high-turbidity drinking water treatment. Chemosphere 2018, 206, 701–708. [Google Scholar] [CrossRef]
  19. Mamelkina, M.A.; Tuunila, R.; Sillänpää, M.; Häkkinen, A. Systematic study on sulfate removal from mining waters by electrocoagulation. Sep. Purif. Technol. 2019, 216, 43–50. [Google Scholar] [CrossRef]
  20. Amarine, M.; Lekhlif, B.; Mliji, E.M.; Echaabi, J. Nitrate removal from groundwater in Casablanca region (Morocco) by electrocoagulation. Groundw. Sustain. Dev. 2020, 11, 100452. [Google Scholar] [CrossRef]
  21. Tounsi, H.; Chaabane, T.; Omine, K.; Sivasankar, V.; Sano, H.; Hecini, M.; Darchen, A. Electrocoagulation in the dual application on the simultaneous removal of fluoride and nitrate anions through respective adsorption/reduction processes and modelling of continuous process. J. Water Process. Eng. 2022, 46, 102584. [Google Scholar] [CrossRef]
  22. Chegeni, M.K.; Shahedi, A.; Darban, A.K.; Jamshidi-Zanjani, A.; Homaee, M. Simultaneous removal of lead and cyanide from the synthetic solution and effluents of gold processing plants using electrochemical method. J. Water Process Eng. 2021, 43, 102284. [Google Scholar] [CrossRef]
  23. Thakur, L.S.; Baghel, R.; Sharma, A.; Sharma, S.; Verma, S.; Parmar, H.; Varma, A.K.; Mondal, P. Simultaneous removal of lead, chromium and cadmium from synthetic water by electrocoagulation: Optimization through response surface methodology. Mater. Today Proc. 2022. [Google Scholar] [CrossRef]
  24. Nidheesh, P.; Khan, F.M.; Kadier, A.; Akansha, J.; Bote, M.E.; Mousazadeh, M. Removal of nutrients and other emerging inorganic contaminants from water and wastewater by electrocoagulation process. Chemosphere 2022, 307, 135756. [Google Scholar] [CrossRef]
  25. Alam, R.; Sheob, M.; Saeed, B.; Khan, S.U.; Shirinkar, M.; Frontistis, Z.; Basheer, F.; Farooqi, I.H. Use of Electrocoagulation for Treatment of Pharmaceutical Compounds in Water/Wastewater: A Review Exploring Exploring Opportunities and Challenges. Water 2021, 13, 2105. [Google Scholar] [CrossRef]
  26. Prajapati, A.K. Sono-assisted electrocoagulation treatment of rice grain based distillery biodigester effluent: Performance and cost analysis. Process. Saf. Environ. Prot. 2021, 150, 314–322. [Google Scholar] [CrossRef]
  27. Al-Qodah, Z.; Tawalbeh, M.; Al-Shannag, M.; Al-Anber, Z.; Bani-Melhem, K. Combined electrocoagulation processes as a novel approach for enhanced pollutants removal: A state-of-the-art review. Sci. Total. Environ. 2020, 744, 140806. [Google Scholar] [CrossRef]
  28. Das, P.P.; Anweshan, A.; Mondal, P.; Sinha, A.; Biswas, P.; Sarkar, S.; Purkait, M.K. Integrated ozonation assisted electrocoagulation process for the removal of cyanide from steel industry wastewater. Chemosphere 2021, 263, 128370. [Google Scholar] [CrossRef]
  29. Gönder, Z.B.; Balcıoğlu, G.; Vergili, I.; Kaya, Y. An integrated electrocoagulation–nanofiltration process for carwash wastewater reuse. Chemosphere 2020, 253, 126713. [Google Scholar] [CrossRef]
  30. Graça, N.S.; Rodrigues, E. The Combined Implementation of Electrocoagulation and Adsorption Processes for the Treatment of Wastewaters. Clean Technol. 2022, 4, 1020–1053. [Google Scholar] [CrossRef]
  31. Moradi, M.; Moussavi, G. Enhanced treatment of tannery wastewater using the electrocoagulation process combined with UVC/VUV photoreactor: Parametric and mechanistic evaluation. Chem. Eng. J. 2018, 358, 1038–1046. [Google Scholar] [CrossRef]
  32. Akansha, J.; Nidheesh, P.; Gopinath, A.; Anupama, K.; Kumar, M.S. Treatment of dairy industry wastewater by combined aerated electrocoagulation and phytoremediation process. Chemosphere 2020, 253, 126652. [Google Scholar] [CrossRef] [PubMed]
  33. Emerick, T.; Vieira, J.L.; Silveira, M.H.L.; João, J.J. Ultrasound-assisted electrocoagulation process applied to the treatment and reuse of swine slaughterhouse wastewater. J. Environ. Chem. Eng. 2020, 8, 104308. [Google Scholar] [CrossRef]
  34. Sharfan, N.; Shobri, A.; Anindria, F.A.; Mauricio, R.; Tafsili, M.A.B.; Slamet, S. Treatment of Batik Industry Waste with a Combination of Electrocoagulation and Photocatalysis. Int. J. Technol. 2018, 9, 936. [Google Scholar] [CrossRef] [Green Version]
  35. Kane, A.; Assadi, A.A.; El Jery, A.; Badawi, A.K.; Kenfoud, H.; Baaloudj, O.; Assadi, A.A. Advanced Photocatalytic Treatment of Wastewater Using Immobilized Titanium Dioxide as a Photocatalyst in a Pilot-Scale Reactor: Process Intensification. Materials 2022, 15, 4547. [Google Scholar] [CrossRef] [PubMed]
  36. Villalobos-Lara, A.D.; Álvarez, F.; Gamiño-Arroyo, Z.; Navarro, R.; Peralta-Hernández, J.M.; Fuentes, R.; Pérez, T. Electrocoagulation treatment of industrial tannery wastewater employing a modified rotating cylinder electrode reactor. Chemosphere 2021, 264, 128491. [Google Scholar] [CrossRef]
  37. Ingelsson, M.; Yasri, N.; Roberts, E.P.L. Electrode passivation, faradaic efficiency, and performance enhancement strategies in electrocoagulation—A review. Water Res. 2020, 187, 116433. [Google Scholar] [CrossRef]
  38. Al-Raad, A.A.; Hanafiah, M.M. Removal of inorganic pollutants using electrocoagulation technology: A review of emerging applications and mechanisms. J. Environ. Manag. 2021, 300, 113696. [Google Scholar] [CrossRef]
  39. Yappert, M.C.; DuPre, D.B. Complexometric Titrations: Competition of Complexing Agents in the Determination of Water Hardness with EDTA. J. Chem. Educ. 1997, 74. [Google Scholar] [CrossRef]
  40. Holt, P.K.; Barton, G.; Wark, M.; Mitchell, C.A. A quantitative comparison between chemical dosing and electrocoagulation. Colloids Surf. A Physicochem. Eng. Asp. 2002, 211, 233–248. [Google Scholar] [CrossRef]
  41. Matos, P.; Moecke, E.H.; Sant’Anna, E.S. The use of desalination concentrate as a potential substrate for microalgae cultivation in Brazil. Algal Res. 2017, 24, 505–508. [Google Scholar] [CrossRef]
  42. Strathmann, H. Electromembrane Processes: Basic Aspects and Applications; Elsevier: Amsterdam, The Netherlands, 2010. [Google Scholar]
  43. AlJaberi, F.Y. Desalination of groundwater by electrocoagulation using a novel design of electrodes. Chem. Eng. Process. Process. Intensif. 2022, 174, 108864. [Google Scholar] [CrossRef]
  44. Zhi, S.; Zhang, S. A novel combined electrochemical system for hardness removal. Desalination 2014, 349, 68–72. [Google Scholar] [CrossRef]
  45. Hakizimana, J.; Gourich, B.; Vial, C.; Drogui, P.; Oumani, A.; Naja, J.; Hilali, L. Assessment of hardness, microorganism and organic matter removal from seawater by electrocoagulation as a pretreatment of desalination by reverse osmosis. Desalination 2016, 393, 90–101. [Google Scholar] [CrossRef]
  46. El Shahawy, A.; Ahmed, I.A.; Nasr, M.; Ragab, A.H.; Al-Mhyawi, S.R.; Elamin, K.M.A. Organic Pollutants Removal from Olive Mill Wastewater Using Electrocoagulation Process via Central Composite Design (CCD). Water 2021, 13, 3522. [Google Scholar] [CrossRef]
  47. Den, W.; Wang, C.-J. Removal of silica from brackish water by electrocoagulation pretreatment to prevent fouling of reverse osmosis membranes. Sep. Purif. Technol. 2008, 59, 318–325. [Google Scholar] [CrossRef]
  48. Qi, P.; Luo, R.; Pichler, T.; Zeng, J.; Wang, Y.; Fan, Y.; Sui, K. Development of a magnetic core-shell Fe3O4@TA@UiO-66 microsphere for removal of arsenic(III) and antimony(III) from aqueous solution. J. Hazard. Mater. 2019, 378, 120721. [Google Scholar] [CrossRef]
  49. El-Ashtoukhy, E.-S.; Amin, N.; Fouad, Y.; Hamad, H. Intensification of a new electrocoagulation system characterized by minimum energy consumption and maximum removal efficiency of heavy metals from simulated wastewater. Chem. Eng. Process. Process. Intensif. 2020, 154, 108026. [Google Scholar] [CrossRef]
Figure 1. Schematic diagram of the experimental setup used for the electrocoagulation study.
Sustainability 15 00590 g001
Figure 2. Mean percentage of calcium hardness removal.
Sustainability 15 00590 g002
Figure 3. Evolution of the electric current as a function of time for 3300 mg/L.
Sustainability 15 00590 g003
Figure 4. Evolution of the electric current as a function of time for 7400 mg/L.
Sustainability 15 00590 g004
Figure 5. Evolution of hardness as a function of electrical potential.
Sustainability 15 00590 g005
Figure 6. Hardness removal percentage and number of experiments.
Sustainability 15 00590 g006
Figure 7. Effect of the applied electric potential on the specific energy consumption.
Sustainability 15 00590 g007
Figure 8. Photograph of three aluminum electrodes (experiment, E8) (b). cathode; (a) and (c) anode after experiment.
Sustainability 15 00590 g008
Figure 9. pH evolution and number of experiments.
Sustainability 15 00590 g009
Figure 10. Evolution of electrical conductivity and number of experiments.
Sustainability 15 00590 g010
Figure 11. Evolution of electrode consumption as a function of electric potential.
Sustainability 15 00590 g011
Table 1. Physicochemical properties of simulated water samples.
Simulated Solution TDS mg/LEC (mS/cm2)pHCalcium Hardness mg/L CaCO3
NaCl y CaCl2.2H2O 33007.137.65540.2
NaCl y CaCl2.2H2O 740014.287.6914.60
Table 2. Research range of independent variables.
FactorUnitsNotationLevels
Concentration (NaCl y CaCl2) mg/L X1 3300 7400
Electric potential V X23579
Table 3. Factorial design response.
Run ConcentrationElectric Potentialhardness Removal PercentageSpecific Energy Consumption (kWh/m3)Theoretical Electrode Consumption
1330036.10%1.440.2419
2330059%5.890.5925
33300712.50%12.690.9126
43300913.94%19.231.0753
57400314.35%3.510.5922
67400515.72%11.921.1994
77400718.94%21.921.5763
87400925.83%42.842.3952
Table 4. Analyses of variance (ANOVA) for percent hardness removal.
Source of DataDegree of Freedom (DF)Sum of SquaresContributionSC Ajust.MC Ajust.F-Valuep-Value
Model4245.21797.27%245.21761.30426.770.011
Linear2240.43395.38%240.433120.21752.500.005
Concentration (ppm)1136.62054.20%136.620136.62059.660.005
Electric potential (V)1103.81341.18%103.813103.81345.330.007
Square11.8240.72%1.8241.8240.800.438
Electric potential (V)*electric potential (V)11.8240.72%1.8241.8240.800.438
Interaction of 2 factors12.9591.17%2.9592.9591.290.338
Concentration (ppm)*electric potential (V)12.9591.17%2.9592.9591.290.338
Error36.8702.73%6.8702.290
Total7252.087100.00%245.21761.30426.770.011
Table 5. Analyses of variance (ANOVA) for energy consumption.
Source of DataDegree of
Freedom (DF)
Sum of
Squares.
ContributionSC Ajust.MC Ajust.F-Value p-Value
Model 41236.2598.54%1236.25309.06250.760.004
Linear21094.6287.25%1094.62547.30889.890.002
Concentration (ppm)1209.5116.70%209.51209.51034.410.010
electric potential (V)1885.1070.55%885.10885.105145.380.001
Square126.652.12%26.6526.6454.380.128
electric potential (V)*electric potential (V)126.652.12%26.6526.6454.380.128
Interacción de 2 factores1114.999.17%114.99114.98918.890.022
Concentration (ppm)*electric potential (V)1114.999.17%114.99114.98918.890.022
Error318.271.46%18.276.088
Total71254.51100.00%
Table 6. Standard deviation of hardness removal percentage and energy consumption.
ResponseN StatisticalMinimum StatisticalMaximum
Statistical
MediaStandard ErrorDeviation
Standard
1Hardness removal percentage86.1025.8314.57752.121686.00103
2Energy consumption (kWh/m3)81.4442.8414.93004.7330813.38717
Table 7. Hardness removal efficiency.
Current Density (mA/cm2)Hardness Removal Efficiency [45]Electric
Potential (V)
Hardness Removal
Efficiency
5.68%515.72%
11.210718.94%
22.413925.83%
Disclaimer/Publisher’s Note: The statements, opinions and data contained in all publications are solely those of the individual author(s) and contributor(s) and not of MDPI and/or the editor(s). MDPI and/or the editor(s) disclaim responsibility for any injury to people or property resulting from any ideas, methods, instructions or products referred to in the content.

