1. Introduction
Extreme weather and climate events such as precipitation extremes are expected to intensify over most of the globe because of the altered water cycle under a warmer background climate [
1,
2,
3]. Eastern China, a populous monsoon region, frequently and severely suffers from precipitation extremes [
4,
5,
6]. Large quantities of freshwater and land-sourced substance injections resulting from extreme precipitation events have great potential to alter the hydrological and biogeochemical dynamics of estuaries and the semi-closed bay ecosystems to which they connect [
7,
8,
9]. However, those changes vary among individual systems, and it is difficult to generalize how a semi-closed bay ecosystem responds to extreme climate events.
Laizhou Bay, a typical semi-enclosed marginal sea with a relatively long water exchange period [
10,
11], is one of the three major bays in the Bohai Sea. It is a shallow, bowl-shaped bay formed by the accumulation of riverine suspended matter [
12], and its average water depth is less than 10 m, with a maximum of approximately 18 m [
12,
13]. This bay has been subject to long-term contamination and eutrophication due to terrestrial runoff input from more than a dozen rivers, including two large rivers: the Yellow and Xiaoqing Rivers [
14,
15,
16]. However, in contrast to an excessive nitrogen concentration, the current primary biological production in the bay is likely phosphorus-limited [
14]. Thus, natural disturbance events such as extreme precipitation-induced flooding can exert substantial impacts in these shallow systems through the resuspension of organic-rich, nutrient-laden sediments and pulsed delivery of freshwater and associated nutrients. However, information is scarce and difficult to acquire for extreme event impacts on physical, chemical, or biological regimes [
17].
In August 2018, heavy rainstorms hit Shouguang City under the dual influence of the typhoons Rumbia and Yagi. These extreme precipitation events caused reservoirs to reach capacity, and excess water release led to the worst flooding since 1974 in the Mi River Basin [
18]. Excessive flooding provides an instance when large amounts of particulate and dissolved organic matter from the surrounding catchment are transported seaward, creating an opportunity to understand how extreme precipitation plus storm-induced flooding affect key environmental indicators in coastal embayments such as Laizhou Bay. A clear understanding of the ecological response to high freshwater flow can serve as a tool to guide the management of fishery and aquaculture resources.
Episodic weather events have a short-lived and unpredictable nature, and repeated oceanographic observations conducted by the Yantai Marine Environmental Monitoring Centre Station of the State Oceanic Administration made it possible to capture the impact of rare extreme precipitation plus storm-induced flooding events in Laizhou Bay. Here, we hypothesize that extreme storm-induced flooding can cause exceptional biogeochemical conditions in the bay compared with those in non-flooding years. Thus, comparative analyses were conducted in which the environmental parameters were measured both during the extreme storm-induced flooding that occurred in August 2018 and when the rainfall and riverine flow were relatively low in August 2017. In addition, satellite data were used to monitor total suspended sediment (TSS) concentration and chlorophyll a (Chl-a) changes.
2. Materials and Methods
2.1. Sampling and Analysis
Two sampling campaigns were conducted: one in August 2017 (17–25 August) and another in August 2018 (25–29 August). The latter sampling occurred immediately after the flood. A total of twenty-eight sites that uniformly cover the entire bay are shown in
Figure 1. Water salinity, pH, turbidity, and dissolved oxygen (DO) were measured in situ with a portable multi-parameter water quality sonde (YSI, 6600) at a depth of 0.5 m. For total nitrogen (TN), total phosphorus (TP), and chemical oxygen demand (COD) analyses, 100-milliliter seawater samples were collected using 5 L Niskin bottles at 0.5 m below the water surface. The concentrations of TN, TP, and COD were analyzed in the laboratory following the Specification for Marine Monitoring (GB 17378.4-2007). The determination methods used were as follows: TN was measured by ultraviolet spectrophotometry after the digestion of all forms of nitrogen in the samples with potassium peroxydisulfate in alkaline medium, TP was measured by the molybdenum blue method after digestion with peroxydisulfate, and COD was determined using the potassium dichromate method.
Considering the limited survey data from the monitoring points, the spatial distribution of the unmonitored areas was generated using the inverse distance weighted (IDW) interpolation method.
In addition, daily flow velocity and water quality data (turbidity, DO, COD, pH, TN, and TP) were compiled from datasets generated by a long-term automatic monitoring program at the Yangkou Hydrological Station at the sea entrance of the Xiaoqing River, organized by the Department of Environmental Protection of Shandong Province. The analytical protocols for turbidity, DO, COD, pH, TN, and TP in Laizhou Bay were consistent with the monitoring campaign mentioned above.
2.2. Satellite Datasets
The ocean observation satellite Geostationary Ocean Color Imager (GOCI) can obtain eight successive snapshots every day with high temporal frequency (between 00:15 and 07:45 GMT at 1-h intervals) and a spatial resolution of 500 m. The distinct advantage in time resolution makes GOCI more suitable for monitoring variations in the marine environment, especially under adverse weather conditions. Therefore, to identify TSS and Chl-a responses following heavy precipitation events, two one-day GOCI level-1B datasets (
http://kosc.kiost.ac.kr/eng/, accessed on 13 January 2021) under cloud-free conditions acquired on 11 August 2018 (pre-flood) and 25 August 2018 (post-flood) were selected in this study.
All GOCI data were processed to obtain TSS and Chl-a concentration data using software modules of the GOCI Data Process System (GDPS) provided by the Korea Ocean Satellite Center (KOSC). The concentration of Chl-a is calculated using the blue-green band ratio algorithm, which can mitigate the influence of colored dissolved organic matter [
19,
20] and has proved to have good performance in the Bohai Sea [
21]. The Case-2 algorithm proposed by Min et al. (2013) was used for the retrieval of TSS levels in this study because of its applicability in high-turbidity environments [
22], and the coefficients in the empirical formula were also corrected based on in situ TSS and retrieved remote sensing reflectance [
23,
24]. Daily multiple-snapshot averaged TSS and Chl-a were calculated to smooth the tidal signal.
In addition, daily rainfall data from the Tropical Rainfall Measuring Mission (TRMM) (
https://disc2.gesdisc.eosdis.nasa.gov/, accessed on 3 February 2021) at a 0.25° × 0.25° grid resolution were also used to display the rainfall distribution characteristics in Shouguang City (yellow colored zone in
Figure 1). Sentinel-2A multi-spectral instrument (MSI) data at a 10-m resolution acquired on 25 August 2018, which were downloaded from the European Space Agency (
https://sentinel.esa.int/, accessed on 3 February 2021), were used to monitor the extent of the flood plume shown by the RGB images.
3. Results and Discussion
3.1. Rainfall Distribution Characterization
A torrential rainfall brought by Typhoon Rumbia fell in Shouguang on 18–19 August 2018 (
Figure 2a), with a record-breaking amount of 346.1 mm in 24 h (Sohu News,
https://www.sohu.com/a/251784013_649223, accessed on 18 February 2021). Along with the sporadic heavy rainfall that occurred in June–July in the same area (
Figure 2b,c), the total precipitation in the summer of 2018 in Shouguang was 586.8 mm, amounting to 150% of the climatological rainfall since 2000 (
Figure 2d). The three upstream reservoirs had insufficient capacity for this excessive water and released a substantial amount in a short time span, resulting in a flood in the Mi River Basin [
25,
26]. Even five days after flooding, as shown by the Sentinel 2A true color image (
Figure 3), a turbid flood plume covered a large spatial area of offshore water around the Mi River. In addition, there was another turbid water plume spread offshore from the Yu River, which may have been due to sediment resuspension or washing of the muddy beach.
3.2. The Pulse of Terrestrial Runoff in the Mouth of the Xiaoqing River
The Xiaoqing River has the second largest freshwater input to Laizhou Bay, after the Yellow River. It passes through heavily urbanized and industrialized areas of Shandong Province and finally runs into Laizhou Bay from Yangkou Town in Shouguang City [
27,
28]. Although its total runoff is only 4.6% of that of the Yellow River, the Xiaoqing River is the most important source of runoff pollution [
29,
30]. The recordings obtained at the Yangkou Hydrological Station at the sea entrance of the Xiaoqing River were used to assess the terrestrial runoff pulses in the front water zone of the coastal bay river system.
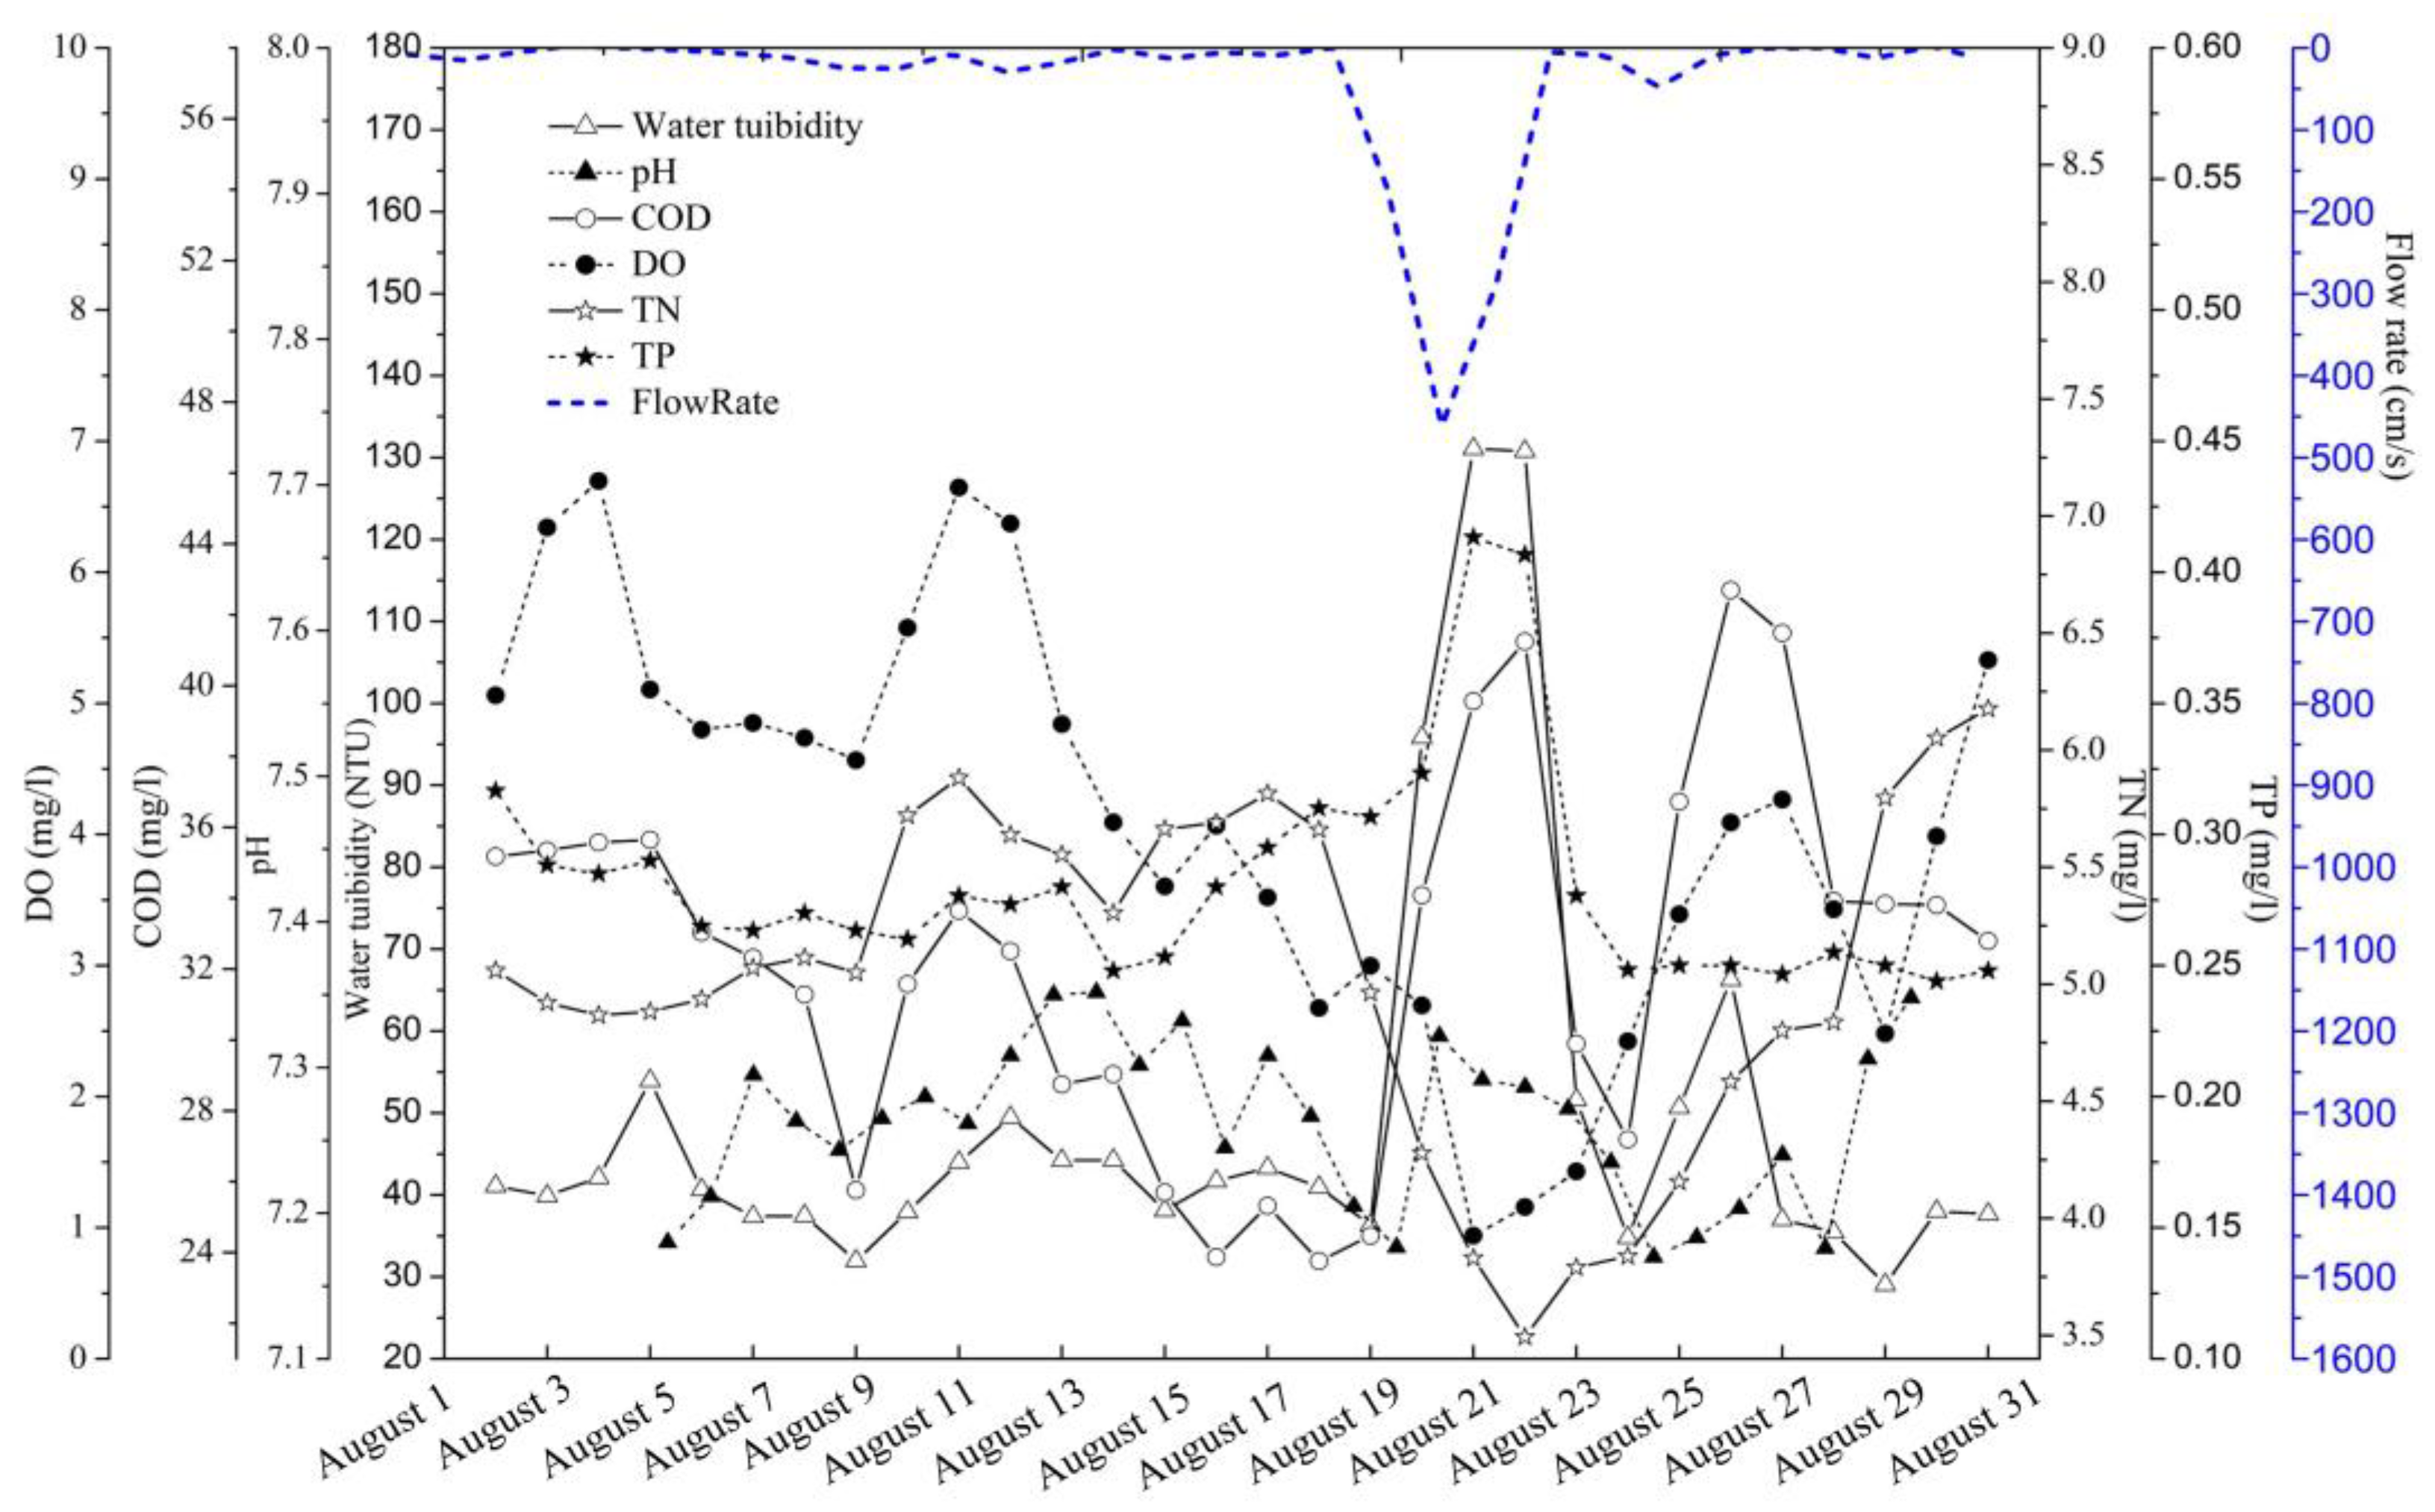
After Typhoon Rumbia passed, the Xiaoqing River flow rate increased sharply from 0.47 cm/s on 19 August to 461.58 cm/s on 21 August (
Figure 4). Accompanied by high streamflow, the estimated volumes of water turbidity, COD, and TP varied consistently, and they increased 3.61-fold from 36.35 NTU to 131.08 NTU, 1.69-fold from 24.47 mg/L to 41.25 mg/L, and 1.32-fold from 0.31 mg/L to 0.41 mg/L, respectively; they returned to normal values on 23 August. These sharp increases demonstrated that the typhoon-induced storm transported large amounts of suspended matter, organic pollutants, and phosphate loads via overland flushing or resuspension of subsurface runoff [
31]. The storm caused the water bodies of the Xiaoqing River to become hypoxic, and the DO decreased (from 3.00 mg/L to 0.94 mg/L), which was similar to other reports [
32,
33]. This effect may be attributed to either suspended matter-induced oxygen depletion or the introduction of oxygen-depleted, low-salinity water [
32,
34]. However, the abnormal reduction in the TN input probably reflects a dilution effect due to surface runoff [
35]. Unlike the above physical/chemical variables, pH showed no consistent abnormalities but maintained its own variations.
To summarize, the extreme discharge event caused a surge of freshwater influx at the mouth of the Xiaoqing River. Concurrently, it delivered a large amount of water enriched with sediment, low oxygen, phosphorus, and organic matter to the front water zone of Laizhou Bay. In the following sections, we examine the combined effects of typhoon-related heavy precipitation and resultant flooding on biogeochemical properties in Laizhou Bay.
3.3. Changes in the Physicochemical Factors after Storm-Induced Flooding
3.3.1. Physicochemical Conditions in August 2017
The salinity, pH, DO, COD, TN, and TP concentration maps generated using the IDW method are presented in
Figure 5. In August 2017, the tested physical variables (including salinity, pH, and DO) generally followed a gradient distribution from the southwestern inshore areas to the northeastern inshore areas (
Figure 5a–c). Low values were observed in the nearshore areas near the southwest of the bay, where the Xiaoqing River enters. In the northeast of the bay, where no major rivers or effluent discharges entered [
36], the values were high. These observations indicate that terrestrial runoff from the Xiaoqing River was the determining factor controlling the spatial pattern of physical variables because of its large runoff volume and high contaminant concentration [
30].
Higher levels of TN together with TP and COD, which are used as chemical indicators to evaluate water quality, were measured in the inner bay, and their levels gradually decreased from the inner areas to the river mouth (
Figure 6a–c). The inner shore of Laizhou Bay has large amounts of effluent discharge from several polluted tributaries and streams such as the Xiaoqing and Wei Rivers (
Figure 1). The disposal of industrial waste and the discharge of domestic sewage markedly contributed to the mass loading of nitrogen, active phosphate, and other organic substances [
16,
37,
38].
The spatial characteristics of physicochemical factors observed in August 2017 were similar to those in previous studies [
39,
40,
41]; thus, the 2017 data could be used as a reference for abiotic spatial patterns during the normal season.
3.3.2. Physicochemical Changes after the Flooding Event
The tremendous quantity of freshwater delivered into Laizhou Bay after extreme flooding expanded the low-salinity water (<25 psu,
Figure 5d) area northeastward. The low-salinity zone was not confined to inshore waters near the Xiaoqing River but covered nearly the entire southwestern inshore area, ranging from the Xiaoqing River to the Jiaolai River (
Figure 5d). Dominated by nutrient-rich freshwater inputs, the spatial patterns of TN and TP reshaped concurrently and mirrored the inflow patterns of low-salinity water (
Figure 6d,e). Here, the low-salinity water zone is defined as freshwater mixing water plume (the region within the black line in
Figure 6d). Within the plume, a salinity reduction of greater than 9 psu occurred. The mean TN and TP concentrations of the plume were 1.27 ± 0.32 mg/L and 0.041 ± 0.017 mg/L, respectively, which were more than 2.08 and 1.95 times greater than those in August 2017 (
Table 1). A relatively high COD was centered at the mouth of the Xiaoqing River and spread in a fan-like pattern. This indicates that the typhoon-related heavy precipitation carried large amounts of organic pollution into Laizhou Bay. Compared to the intense response of COD, the pH slightly decreased at the mouth of Xiaoqing River. It is remarkable, however, that the pH decreased over the entire bay, indicating the addition of acid material by both acid precipitation and flooding freshwater input.
Unlike the salinity, TN, TP, and COD values, the spatial change in DO showed no consistent abnormalities after flooding. Compared to August 2017, a high-DO zone was not observed in the freshwater mixing water plume but moved to the inshore area centered on the Jiaolai River. However, when focusing on ΔDO (
Figure 6h and
Figure 7), in the freshwater mixing water bodies, the DO was slightly increased, with values ranging from 0.01 to 1.18, which possibly resulted from the entrainment of oxygen from the air into the upper water layer due to freshwater and seawater interactions [
42].
According to our comparative analyses, the August 2018 flood generated a large plume of low-salinity water, carrying large amounts of nutrients (TN and TP) and organic pollution into the bay. These variables showed similar changes in physicochemical factors measured at the Yangkou Hydrological Station, but TN and DO both showed an opposite pattern. This inconsistency suggests that the replaced river input caused by episodic flooding temporally dominated the typical spatial pattern of physicochemical factors.
3.3.3. Satellite-Obtained Changes in TSS after Storm-Induced Flooding
The GOCI-derived TSS levels are shown in
Figure 7. Before flooding, relatively high TSS concentrations were generally found in the Yellow River estuary and southern nearshore regions of Laizhou Bay (
Figure 7a), which is consistent with reported in situ observations and satellite-derived results in wet seasons [
43,
44,
45]. The Yellow River sediment discharge and sediment resuspension in the southern estuary are the key drivers for TSS deposition, where the ocean floor is covered with silty, clay-like sand, as noted in previous studies [
44,
46].
Following storm-induced flooding, the TSS concentration significantly increased by 23.79 g/m
3 on average in the nearshore zones following the injection of the Mi River plume. These high TSS loads likely originated from the considerable amounts of eroded soils and sediments delivered by the combination of heavy rainfall and the resultant flooding. In addition, bottom sediment resuspension could also serve as a TSS resource. However, the area of high-turbidity water matched the flood plume portrayed by the Sentinel 2A image (
Figure 3), indicating that suspended solids delivered by freshwater played a greater role in shaping the TSS temporary spatial structure than a resuspension process.
In contrast to the high TSS increase in the nearshore zones, the TSS level was reduced by 8.65 g/m
3 on average inside the bay (
Figure 7c), which might be attributed to the intensive rainfall produced by Typhoon Yagi. The rainfall increased the fresh water supply and diluted the nearshore water. Our results suggest that the occurrence of extreme flooding causes the flooding plume-affected zone to become more turbid. However, for other water bodies in Laizhou Bay, the preceding rainstorm can be a stressor that is sufficiently high for the transition from a turbid to a relatively clear state.
3.3.4. Satellite-Obtained Changes in Chl-a after Storm-Induced Flooding
Figure 8 illustrates the daily averaged surface Chl-a concentrations both before (
Figure 8a) and after (
Figure 8b) the flood. Before flooding, a high concentration of Chl-a was observed in the southwestern bay and extended to central Laizhou Bay, which was similar to the climatological Chl-a concentration in August [
47].
After storm-induced flooding, a marked increase in Chl-a was observed in offshore freshwater mixing water, and the chlorophyll concentration increased by 0.63 mg/m
3 on average. As phosphorus is considered a limiting nutrient in Laizhou Bay [
14], the delivery of biologically available phosphorus, which was suggested to be the dominant P form of the stormwater runoff event [
48,
49], may stimulate an increase in phytoplankton biomass. However, the concentration of Chl-a unexpectedly decreased by 0.57 mg/m
3 on average in the southern nearshore zone despite the higher availability of nutrients, possibly due to increased flushing or reduced light penetration [
50].
To summarize, Laizhou Bay is one highly eutrophic water body where, under ‘normal’ summer conditions, the distribution of biogeochemical properties was dominated by the freshwater discharge. High nutrient, TSS, and Chl-a concentrations were generally observed in the inner shore of Laizhou Bay, where there are large amounts of effluent discharge, especially in the freshwater-dominated upper estuary from the Xiaoqing River.
The 2018 Shouguang flood caused a surge of freshwater influx and induced a rapid export of excess nutrients and TSS into nearshore regions, resulting in temporary eutrophication. As indicated by the extended shape of low-salinity water, the short-lived flood appeared spatially to impact nearly a third of the entire bay. Large inputs of TP into Laizhou Bay were responsible for a drastic increase in phytoplankton biomass. The Chl-a increase observed in Laizhou Bay, a typical shallow, highly eutrophic embayment, was comparable to the reported oligotrophic system [
33,
51,
52]. Pulsed natural disturbances are probably an important control of nutrient and material fluxes in this bay. However, due to the lack of continuous large-area observations, we were not able to track the impacts of such climate extremes on a time scale.
4. Conclusions
Opportunistic in situ cruise observations plus satellite datasets were fortuitously available to reveal the key biogeochemical responses of a shallow, highly turbid, semi-enclosed bay to extreme precipitation and storm-induced flooding events. Our results revealed that the event brought a large amount of nutrient-rich, highly turbid freshwater into Laizhou Bay, thus increasing the water turbidity and promoting phytoplankton growth in the offshore freshwater mixing water plume. Episodic flooding temporarily replaced the Xiaoqing River, which otherwise dominates the spatial pattern of water biogeochemistry in Laizhou Bay, and caused significant northeastward expansions of salinity, TN, and TP levels.
Our results provide a good view of the significant biophysical responses of the coastal sea to episodic weather events, such as flooding, which are meaningful to develop effective coastal management strategies. However, routine monitoring lacks the temporal resolution to track the impacts of such climate extremes. Thus, high-intensity sampling coupled with joint physical–biogeochemical models are crucial for understanding how these events impact complex systems such as Laizhou Bay.
Author Contributions
Conceptualization, L.M.; data curation, L.M., D.J., F.Q. and X.W.; formal analysis, L.M.; investigation, L.M. and X.G.; methodology, L.M., X.G., F.Q. and X.G., project administration, Q.X. and L.J.; resources, D.J.; software, L.M.; supervision, Q.X. and X.G.; validation, Q.X.; visualization, Q.X.; writing—original draft preparation, L.M.; writing—review and editing, Q.X. and X.G. All authors have read and agreed to the published version of the manuscript.
Funding
This research was funded by the Shandong Provincial Natural Science Foundation, China (grant number ZR2020QD092), and the National Natural Science Foundation of China (grant numbers 42076188 and 31870468).
Institutional Review Board Statement
Not applicable.
Informed Consent Statement
Not applicable.
Data Availability Statement
The data presented in this study are available on request from the corresponding author.
Acknowledgments
The authors give thanks to the Yantai Marine Environmental Monitoring Central Station, State Oceanic Administration (SOA), for providing the biogeochemical datasets.
Conflicts of Interest
The authors declare no conflict of interest.
References
- Tandon, N.F.; Zhang, X.; Sobel, A.H. Understanding the Dynamics of Future Changes in Extreme Precipitation Intensity. Geophys. Res. Lett. 2018, 45, 2870–2878. [Google Scholar]
- Ingram, W. Extreme precipitation: Increases all round. Nat. Clim. Change 2016, 6, 443–444. [Google Scholar] [CrossRef]
- Ummenhofer, C.C.; Meehl, G.A. Extreme weather and climate events with ecological relevance: A review. Philos. Trans. R. Soc. B Biol. Sci. 2017, 372, 20160135. [Google Scholar] [CrossRef] [PubMed] [Green Version]
- Ma, S.; Zhou, T.; Dai, A.; Han, Z. Observed Changes in the Distributions of Daily Precipitation Frequency and Amount over China from 1960 to 2013. J. Clim. 2015, 28, 6960–6978. [Google Scholar] [CrossRef]
- He, L.; Hao, X.; Li, H.; Han, T. How do extreme summer precipitation events over Eastern China subregions change? Geophys. Res. Lett. 2021, 48, e2020GL091849. [Google Scholar] [CrossRef]
- Zhao, Y.; Chen, D.; Li, J.; Chen, D.; Chang, Y.; Li, J.; Qin, R. Enhancement of the summer extreme precipitation over North China by interactions between moisture convergence and topographic settings. Clim. Dynam. 2020, 54, 2713–2730. [Google Scholar] [CrossRef] [Green Version]
- Aleshina, M.A.; Semenov, V.A.; Chernokulsky, A.V. A link between surface air temperature and extreme precipitation over Russia from station and reanalysis data. Environ. Res. Lett. 2021, 16, 105004. [Google Scholar] [CrossRef]
- Tan, X.; Wu, X.; Liu, B. Global changes in the spatial extents of precipitation extremes. Environ. Res. Lett. 2021, 16, 54017. [Google Scholar] [CrossRef]
- Wetz, M.S.; Yoskowitz, D.W. An ‘extreme future’ for estuaries? Effects of extreme climatic events on estuarine water quality and ecology. Mar. Pollut. Bull. 2013, 69, 7–18. [Google Scholar]
- Wang, X.; Li, H.; Jiao, J.J.; Barry, D.A.; Li, L.; Luo, X.; Wang, C.; Wan, L.; Wang, X.; Jiang, X.; et al. Submarine fresh groundwater discharge into Laizhou Bay comparable to the Yellow River flux. Sci. Rep. 2015, 5, 8814. [Google Scholar]
- Li, X.; Chi, W.; Tian, H.; Zhang, Y.; Zhu, Z. Probabilistic ecological risk assessment of heavy metals in western Laizhou Bay, Shandong Province, China. PLoS ONE 2019, 14, e213011. [Google Scholar] [CrossRef] [PubMed] [Green Version]
- Zhuang, W.; Gao, X. Integrated assessment of heavy metal pollution in the surface sediments of the Laizhou Bay and the coastal waters of the Zhangzi Island, China: Comparison among typical marine sediment quality indices. PLoS ONE 2014, 9, e94145. [Google Scholar] [CrossRef] [PubMed]
- You, Z.J.; Chen, C. Coastal Dynamics and Sediment Resuspension in Laizhou Bay. In Sediment Dynamics of Chinese Muddy Coasts and Estuaries: Physics, Biology, and Their Interactions; Wang, X.H., Ed.; Academic Press: Oxford, UK, 2019; pp. 123–142. [Google Scholar]
- Zhang, J.; Zhang, M.; Zhang, S.; Xu, Q.; Liu, X.; Zhang, Z. Nutrient distribution and structure affect the behavior and speciation of arsenic in coastal waters: A case study in southwestern coast of the Laizhou Bay, China. Mar. Pollut. Bull. 2019, 146, 377–386. [Google Scholar] [CrossRef] [PubMed]
- Zhuang, W.; Gao, X.; Zhang, Y.; Xing, Q.; Tosi, L.; Qin, S. Geochemical characteristics of phosphorus in surface sediments of two major Chinese mariculture areas: The Laizhou Bay and the coastal waters of the Zhangzi Island. Mar. Pollut. Bull. 2014, 83, 343–351. [Google Scholar] [CrossRef]
- Yu, S.; Pang, Y.; Wang, Y.; Li, J.; Qin, S. Spatial variation of microbial communities in sediments along the environmental gradients from Xiaoqing River to Laizhou Bay. Mar. Pollut. Bull. 2017, 120, 90–98. [Google Scholar] [CrossRef]
- Kelly, S.; Doyle, B.; de Eyto, E.; Dillane, M.; McGinnity, P.; Poole, R.; White, M.; Jennings, E. Impacts of a record-breaking storm on physical and biogeochemical regimes along a catchment-to-coast continuum. PLoS ONE 2020, 15, e235963. [Google Scholar] [CrossRef]
- Jiang, B.; Meng, L.; Xing, Q. Monitoring of Flood Disaster Footprints based on Remote Sensing: Shouguang Floods of 2018, Southern Laizhou Bay. Environ. Impact Assess. 2019, 41, 83–87. (In Chinese) [Google Scholar]
- Moon, J.; Park, Y.; Ryu, J.; Choi, J.; Ahn, J.; Min, J.; Son, Y.; Lee, S.; Han, H.; Ahn, Y. Initial validation of GOCI water products against in situ data collected around Korean peninsula for 2010–2011. Ocean. Sci. J. 2012, 47, 261–277. [Google Scholar] [CrossRef]
- Yang, Q.; Du, L.B.; Liu, X.Y.; Hu, L.B.; Chen, S.G.; Liu, Y.; Wang, Z.Y.; Wang, Z.J.; Zhou, Y. Evaluation of ocean color products from Korean Geostationary Ocean Color Imager (GOCI) in Jiaozhou Bay and Qingdao coastal area. In Proceedings of the SPIE Asia-Pacific Remote Sensing, Beijing, China, 18 December 2014. [Google Scholar] [CrossRef]
- Zhang, X.; Zheng, X. Comparison of inversion of Chlorophyll concentration in the Bohai Bay based on GOCI Data. Mar. Pollut. Bull. 2017, 19, 62–74. [Google Scholar]
- Min, J.E.; Choi, J.K.; Park, Y.J.; Ryu, J.H. Retrieval of suspended sediment concentration in the coastal waters of yellow sea from Geostationary Ocean Color Imager (GOCI). In Proceedings of the International Symposium of Remote Sensing, Beijing, China, 22–26 April 2013; pp. 809–812. [Google Scholar]
- Huang, X.; Zhu, J.; Han, B.; Jamet, C.; Tian, Z.; Zhao, Y.; Li, J.; Li, T. Evaluation of Four Atmospheric Correction Algorithms for GOCI Images over the Yellow Sea. Remote Sens. 2019, 11, 1631. [Google Scholar] [CrossRef] [Green Version]
- Lin, H.; Yu, Q.; Wang, Y.; Gao, S. Identification, extraction and interpretation of multi-period variations of coastal suspended sediment concentration based on unevenly spaced observations. Mar. Geol. 2022, 445, 106732. [Google Scholar] [CrossRef]
- Han, X.; Wang, J. Using Social Media to Mine and Analyze Public Sentiment during a Disaster: A Case Study of the 2018 Shouguang City Flood in China. ISPRS Int. J. Geo-Inf. 2019, 8, 185. [Google Scholar] [CrossRef] [Green Version]
- Geng, S.; Zhou, Q.; Li, M.; Song, D.; Wen, Y. Spatial–temporal differences in disaster perception and response among new media users and the influence factors: A case study of the Shouguang Flood in Shandong province. Nat. Hazards 2021, 2241–2262. [Google Scholar] [CrossRef]
- Zhen, X.; Liu, L.; Wang, X.; Zhong, G.; Tang, J. Fates and ecological effects of current-use pesticides (CUPs) in a typical river-estuarine system of Laizhou Bay, North China. Environ. Pollut. 2019, 252, 573–579. [Google Scholar] [CrossRef]
- Luo, X.; Lin, S.; Yang, J.; Shen, J.; Fan, Y.; Zhang, L. Benthic habitat quality assessment based on biological indices in Xiaoqing River estuary and its adjacent sea of Laizhou Bay, China. J. Ocean. Univ. China 2017, 16, 537–546. [Google Scholar] [CrossRef]
- Heydebreck, F.; Tang, J.; Xie, Z.; Ebinghaus, R. Alternative and Legacy Perfluoroalkyl Substances: Differences between European and Chinese River/Estuary Systems. Environ. Sci. Technol. 2015, 49, 8386–8395. [Google Scholar] [CrossRef]
- Jiang, T.; Skyllberg, U.; Björn, E.; Green, N.W.; Tang, J.; Wang, D.; Gao, J.; Li, C. Characteristics of dissolved organic matter (DOM) and relationship with dissolved mercury in Xiaoqing River-Laizhou Bay estuary, Bohai Sea, China. Environ. Pollut. 2017, 223, 19–30. [Google Scholar] [CrossRef] [Green Version]
- Chen, N.; Wu, Y.; Chen, Z.; Hong, H. Phosphorus export during storm events from a human perturbed watershed, southeast China: Implications for coastal ecology. Estuar. Coast. Shelf Sci. 2015, 166, 178–188. [Google Scholar] [CrossRef]
- Voynova, Y.G.; Brix, H.; Petersen, W.; Weigelt-Krenz, S.; Scharfe, M. Extreme flood impact on estuarine and coastal biogeochemistry: The 2013 Elbe flood. Biogeosciences 2017, 14, 541–557. [Google Scholar] [CrossRef] [Green Version]
- Herbeck, L.S.; Unger, D.; Krumme, U.; Liu, S.M.; Jennerjahn, T.C. Typhoon-induced precipitation impact on nutrient and suspended matter dynamics of a tropical estuary affected by human activities in Hainan, China. Estuar. Coast. Shelf Sci. 2011, 93, 375–388. [Google Scholar] [CrossRef]
- Li, X.; Huang, T.; Ma, W.; Sun, X.; Zhang, H. Effects of rainfall patterns on water quality in a stratified reservoir subject to eutrophication: Implications for management. Sci. Total Environ. 2015, 521–522, 27–36. [Google Scholar] [CrossRef] [PubMed]
- Hunter, H.M.; Walton, R.S. Land-use effects on fluxes of suspended sediment, nitrogen and phosphorus from a river catchment of the Great Barrier Reef, Australia. J. Hydrol. 2008, 356, 131–146. [Google Scholar] [CrossRef]
- Chi, W.; Zhang, X.; Zhang, W.; Bao, X.; Liu, Y.; Xiong, C.; Liu, J.; Zhang, Y. Impact of tidally induced residual circulations on chemical oxygen demand (COD) distribution in Laizhou Bay, China. Mar. Pollut. Bull. 2020, 151, 110811. [Google Scholar] [CrossRef]
- Jiang, H.; Liu, D.; Song, X.; Ma, Y.; Wang, Y.; Liu, A.; Cheng, L.; He, J.; Sun, S. Response of phytoplankton assemblages to nitrogen reduction in the Laizhou Bay, China. Mar. Pollut. Bull. 2018, 136, 524–532. [Google Scholar] [CrossRef] [PubMed]
- Tian, X.; Xu, Y.; Song, X.; Gong, X.; Liu, Y.; Zhou, Q.; Wang, Z.; Xia, C. Temporal and spatial distribution of semicarbazide in western Laizhou Bay. Mar. Pollut. Bull. 2016, 112, 393–398. [Google Scholar] [CrossRef] [PubMed]
- Guo, F.; Wang, B.; Xin, M.; Zhang, W.; Li, C.; Xie, L.; Sun, X. Nutrient Distributions in the Laizhou Bay in Spring and Summer of 2015. Adv. Mar. Sci. 2017, 35, 258–266. [Google Scholar]
- Gao, H.; Wu, D.; Bai, J.; Shi, J.; Li, Z.; Jiang, W. Distributions of Environmental Parameters in Laizhou Bay in Summer, 2000. J. Ocean. U. China 2003, 33, 185–191. [Google Scholar]
- Song, D.; Gao, Z.; Zhang, H.; Xu, F.; Zheng, X.; Ai, J.; Hu, X.; Huang, G.; Zhang, H. GIS-based health assessment of the marine ecosystem in Laizhou Bay, China. Mar. Pollut. Bull. 2017, 125, 242–249. [Google Scholar] [CrossRef]
- Gao, X.; Song, J. Dissolved oxygen and O2 flux across the water–air interface of the Changjiang Estuary in May 2003. J. Mar. Syst. 2008, 74, 343–350. [Google Scholar] [CrossRef]
- Liu, Y.; Huang, H.; Yang, X. The transportation and deposition of suspended sediment and its dynamic mechanism analysis based on Landsat images in the Laizhou Bay. Acta. Oceanol. Sin. 2013, 35, 43–53. (In Chinese) [Google Scholar]
- Qiu, Z.; Xiao, C.; Perrie, W.; Sun, D.; Wang, S.; Shen, H.; Yang, D.; He, Y. Using Landsat 8 data to estimate suspended particulate matter in the Yellow River estuary. J. Geophys. Res. Oceans 2017, 122, 276–290. [Google Scholar] [CrossRef]
- Ji, J.; Wang, Y.; Wang, X.; Wang, Y.; Teng, Y. A numerical study of the transport process of Yellow River sediment in summer. Mar. Sci. 2016, 40, 118–127. (In Chinese) [Google Scholar]
- Li, P.; Ke, Y.; Bai, J.; Zhang, S.; Chen, M.; Zhou, D. Spatiotemporal dynamics of suspended particulate matter in the Yellow River Estuary, China during the past two decades based on time-series Landsat and Sentinel-2 data. Mar. Pollut. Bull. 2019, 149, 110518. [Google Scholar] [CrossRef] [PubMed]
- Zhang, H.; Qiu, Z.; Sun, D.; Wang, S.; He, Y. Seasonal and Interannual Variability of Satellite-Derived Chlorophyll-a (2000–2012) in the Bohai Sea, China. Remote Sens. 2017, 9, 582. [Google Scholar] [CrossRef] [Green Version]
- Zhang, M.; Krom, M.D.; Lin, J.; Cheng, P.; Chen, N. Effects of a Storm on the Transformation and Export of Phosphorus Through a Subtropical River-Turbid Estuary Continuum Revealed by Continuous Observation. J. Geophys. Res. Biogeosci. 2022, 127, e2022JG006786. [Google Scholar] [CrossRef]
- Yang, Y.Y.; Toor, G.S. Stormwater runoff driven phosphorus transport in an urban residential catchment: Implications for protecting water quality in urban watersheds. Sci. Rep. 2018, 8, 11681. [Google Scholar] [CrossRef] [Green Version]
- Geyer, N.; Huettel, M.; Wetz, M. Biogeochemistry of a River-Dominated Estuary Influenced by Drought and Storms. Estuar. Coast. 2018, 41, 2009–2023. [Google Scholar] [CrossRef]
- Sadro, S.; Melack, J.M. The Effect of an Extreme Rain Event on the Biogeochemistry and Ecosystem Metabolism of an Oligotrophic High-Elevation Lake. Arct. Antarct. Alp. Res. 2012, 44, 222–231. [Google Scholar] [CrossRef]
- Cooney, E.M.; McKinney, P.; Sterner, R.; Small, G.E.; Minor, E.C. Tale of Two Storms: Impact of Extreme Rain Events on the Biogeochemistry of Lake Superior. J. Geophys. Res. Biogeosci. 2018, 123, 1719–1731. [Google Scholar] [CrossRef]
| Disclaimer/Publisher’s Note: The statements, opinions and data contained in all publications are solely those of the individual author(s) and contributor(s) and not of MDPI and/or the editor(s). MDPI and/or the editor(s) disclaim responsibility for any injury to people or property resulting from any ideas, methods, instructions or products referred to in the content. |
© 2022 by the authors. Licensee MDPI, Basel, Switzerland. This article is an open access article distributed under the terms and conditions of the Creative Commons Attribution (CC BY) license (https://creativecommons.org/licenses/by/4.0/).

 ,
, 


