Article

Low Cost and Sustainable Test Methods to Study Vulnerabilities of Large-Scale Systems against EMP

1
School of Electronic Engineering, Xidian University, Xi’an 710071, China
2
Northwest Institute of Nuclear Technology, Xi’an 710024, China
*
Author to whom correspondence should be addressed.
Sustainability 2023, 15(1), 320; https://doi.org/10.3390/su15010320
Submission received: 19 November 2022 / Revised: 15 December 2022 / Accepted: 20 December 2022 / Published: 25 December 2022

Abstract

:
Intense electromagnetic pulses are electromagnetic waves with sharp rise time, high field strength and short duration. They have attracted more and more attention in recent years because they can cause destructions or malfunctions of some key national core infrastructures, such as power grids, communication and financial networks, etc. Hence, it is important to harden these facilities to ensure that they can survive in the face of electromagnetic pulse attacks. A direct way to investigate the vulnerabilities of these facilities is placing them in the electromagnetic environments generated by EMP simulators. However, the scale of facilities under test are limited by the working volumes of simulators. With the increase in working volumes and field strength, the price and technical difficulty of simulators are increased. Therefore, low cost and sustainable test methods to investigate vulnerabilities of large-scale systems against EMP are proposed in this study. The study takes advantage of continuous wave immersion (CWI) test and pulse current injection (PCI) test methods, which are low cost and sustainable to predict the pulse responses and assess the nonlinear effect of large-scale facilities under EMP attacks. In a CWI test, the magnitude of the transfer function of large-scale systems or facilities can be measured, and the corresponding phase information of the transfer function can be reconstructed by minimum phase algorithm (MPA) if the systems meet the minimum phase condition. After acquiring the entire information of the transfer function, we can predict the responses of a system under threat-level EMP attacks. However, these responses are obtained under the assumption that the system does not have nonlinear effects. Because the CWI is a low-level test, it cannot simulate the threat-level EMP attacks. In the PCI test proposed here, a bulky pulse current is coupled into the system to stimulate enough current intensity, just as the system was attacked by threat-level EMPs. In this situation, the system would be destroyed, or any other nonlinear effect would occur in the system. After that, the problem is to determine the quantities of the injected current, and a few kinds of norms are introduced in this paper to define the quantities. The method proposed here innovatively takes the experimental results of CWI as reference inputs of PCI tests. In this paper, the accuracy of the response prediction is validated by means of simulations and experiments. Results show that as a low-level test method in the frequency domain, the CWI test method can not only analyze couplings of external electromagnetic energy from frequency domain but also predict responses of the facilities under high amplitude electromagnetic pulses. The nonlinear effect of large-scale facilities can be assessed by applying the PCI test method with the results from CWI prediction. Therefore, if infrastructures or facilities are too large to be tested under EMP simulators, an alternative approach is to carry out the CWI and PCI experiments.

1. Introduction

During the 1960s, the unusual electrical effects caused by nuclear tests in the atmosphere have been noted [1]. Since then, interests have been focused on the electromagnetic pulses with sharp rise time, high field strength and short duration time [2,3,4,5,6,7]. These EMPs usually cover a wide range of several hundred kilometers and cause destructions or malfunctions to some key national core infrastructures, and many protection methods have been proposed in the past [8,9,10,11,12]. When the EMPs arrived at the external surface of a system, voltages and currents would be prevailing at typical locations within a system or installation through external and internal coupling processes. System-level EMP simulators are the most effective means of assessing the effectiveness of these voltages and currents [13]. Some countries have built their various EMP simulators to investigate the vulnerabilities of facilities or infrastructures [14,15]. In 1985 and 2005, China also developed small guided-wave EMP simulators, which were named DM-1200 and MDES-60, respectively [16,17]. However, the test object dimensions should not exceed 60 percent of the working volume dimensions for good simulation fidelity [18]. Hence, some large-scale facilities or systems need to be tested under simulators with large enough working volumes.
However, with the increase in designed working volumes and field strength, the price and technical difficulty of simulators are increased [19,20,21], especially in the field of insulation technology and insulation materials [22,23,24,25,26,27]. For this reason, researchers have developed the CWI test method, based on commercial equipment, and developed corresponding standards [28]. The CWI is a low-level test method which is usually employed in shielding designs, hardness surveillances or hardness assessments. It adopts commercial CW sources and antennas with different frequency ranges to provide sufficient electromagnetic field immersion, and the coupling quantities can be measured [29]. Compared with EMP simulators, the equipment that makes up the CWI system is commercial and transportable, so it is easier to design and the cost is lower. As early as 1972, Carl E. Baum theoretically analyzed and designed the topological structure and impedance loaded in a low field intensity continuous wave hybrid simulator, and field distributions are characterized by the loaded impedance, but it only existed conceptually at that time [30,31]. In 1995, Clayborne D. Taylor built an elliptical illuminator for CWI tests of large-scale systems, which could work in two modes: horizontal polarization and vertical polarization, and it is used for hardness maintenance/hardness surveillance (HM/HS) [32]. In 2012, William D. Prather introduced a transportable CWI test system which was made up of different antennas, attempting to cover a 100 kHz to 1 GHz frequency range, for HM/HS of fixed facilities [33,34]. The main problem with the CWI test method is that it cannot simulate threat-relatable electrical quantities because the radiated electromagnetic field strength is weak (≈1 V/m) [35], and there are almost no nonlinear effects for electrical systems in such weak fields.
The PCI is a test method for assessing conducted susceptibilities of electrical facilities or systems [36]. Such test methods simulate a threat-relatable pulse current by injecting high-power transients to lines that penetrate through electrical facilities. It can demonstrate whether electrical systems are damaged or upset by the residual electromagnetic stresses after attenuation or electromagnetic barrier. In some related standards, the PCI source parameters and waveforms are defined according to different coupling paths [37,38,39], whereas the injected electrical quantities for different objects have not been clearly defined. Some researchers have proposed several modeling methods of inductive couplers used in PCI tests [40,41,42], but the injected electrical quantities related to threat-relatable EMPs are still not mentioned.
In order to investigate vulnerabilities or the nonlinear effect of large-scale facilities or systems, two steps, including CWI and PCI, are proposed here, and the feasibility is validated through simulations and experiments. First, when carrying out a CWI experiment, large scale facilities or systems are illuminated at an appropriate distance so that CW signals traveling from antennas can cover all of them. Transfer functions which relate pulse responses and threat-relatable EMP excitations are derived from CWI test results by the minimum phase algorithm. Then, the amplitudes of pulse currents predicted by transfer functions are as the inputs of PCI tests. In this paper, the predicted pulse responses of different objects against threat-relatable EMPs are considered as the injected quantities of PCI, and a short-wave antenna is studied as a case.
The remainder of this article is organized as follows: In Section 2, the principle of the minimum phase algorithm (MPA) is reviewed and employed to process the CWI test data. Circuit models of systems with different characteristics are built to verify the availability and accuracy of MPA. In Section 3, a 3D model of a cubic shielding enclosure with a circular hole is built to simulate the radiation and coupling process of CWI. Pulse responses in the enclosure are predicted and simulated. In addition, an experimental study on a short-wave antenna by CWI and EMP radiation tests is carried out to confirm that the predicted pulse current on the antenna can be used to estimate that coupled by the EMP radiation. In Section 4, the injected electrical quantities in PCI tests are defined by considering the CWI test results, which make the vulnerabilities assessments of large-scale electrical systems or facilities more reasonable. Finally, Section 5 concludes this article.

2. Principle and Methods

2.1. Review of the Hilbert Transform

The Hilbert Transform is a commonly used technique which can relate the real and imaginary parts of a spectral response. It is an important theory and is widely used in signal analyzing and processing. One useful application in CWI tests is to reconstruct the phase information using magnitude-only data. The Hilbert Transform can be derived from the Fourier Transform of a casual function, as follows [43]:
f ( t ) = f ( t ) u ( t )
where u ( t ) is a step function. The Fourier Transform of (1) can be obtained as:
F ( ω ) = X ( ω ) + j Y ( ω ) = F T ( f ( t ) u ( t ) ) = F T ( f ( t ) ) F T ( u ( t ) ) = 1 2 π [ X ( ω ) + j Y ( ω ) ] [ π δ ( ω ) + 1 j ω ] = [ X ( ω ) 2 + 1 2 π Y ( ω ) 1 ω ] + j [ Y ( ω ) 2 1 2 π X ( ω ) 1 ω ]
where “ ” and F T ( · ) represent the convolution operation and Fourier Transform, respectively. Since the real and imaginary parts at the two sides of Equation (2) are equal, respectively, we will obtain the relations as:
X ( ω ) = 1 π Y ( ω ) 1 ω = 1 π Y ( σ ) ω σ d σ
Y ( ω ) = 1 π X ( ω ) 1 ω = 1 π X ( σ ) ω σ d σ
Equations (3) and (4) indicate that the imaginary parts of the spectrum of a casual function can be derived from the real part by using Hilbert Transform, and vice versa. This property leads to the derivation of the minimum phase algorithm (MPA). In the field of digital signal processing, if the transfer function, including the magnitude and phase, of a system is known, the system response can be obtained by convolution of the input and transfer function. The magnitude of the system transfer function can be easily measured in a CWI test, while the phase is difficult to measure. To solve this problem, the MPA could be employed to reconstruct the phase information from the magnitude-only data, which are measured in a CWI test, because the magnitude and phase of the transfer function of a minimum phase system are not independent. After the phase information is reconstructed, the response of the system can be predicted by convolving the input and the transfer function. The details of reconstructing a complex spectrum by magnitude-only data with MPA are summarized and illustrated in the next section.

2.2. Procedure of MPA to Reconstruct Entire Complex Spectrum [44,45]

As the magnitude of a complex spectrum, | F ( e j ω ) | can be acquired by CWI tests; the problem is to reconstruct the corresponding phase information, and this requires that the system function F ( z ) meets the minimum phase condition.
Suppose F ( z ) is the system function of a minimum phase system. It can be written as:
F ( z ) = | F ( z ) | exp ( j arg [ F ( z ) ] )
Suppose H ( z ) is the logarithm of F ( z ) , then let:
H ( z ) = ln ( F ( z ) )
Substitute (5) into (6), H ( z ) can be written as:
H ( z ) = ln | F ( z ) | + j arg [ F ( z ) ] = H R ( z ) + j H I ( z )
When considering this problem on the unit circle, z can be replaced by e j ω . According to properties of a minimum phase system, H R ( e j ω ) and H I ( e j ω ) are Hilbert Transform pairs [46], and they are not independent.
H R ( e j ω ) = H ( 0 ) + 1 2 π π π H I ( e j ω ) cot ( ω θ 2 ) d θ
H I ( e j ω ) = 1 2 π π π H R ( e j ω ) cot ( ω θ 2 ) d θ
As | F ( e j ω ) | can be measured in a CWI test, H R ( e j ω ) can be derived from (7), and then H I ( e j ω ) can be calculated from (9). Then, the system function F ( e j ω ) with both magnitude and phase information can be obtained.
For a discrete spectrum to be processed on a computer, the procedure of MPA can be implemented in another way, as follows:
(1) According to Equation (6), find the logarithm of the magnitude spectrum | F ( k ) | and extend it in mirror image. This step means the real part of H ( k ) is known, but the imaginary part of H ( k ) is not. However, all of the information about H ( k ) could be obtained by Hilbert Transformation in the next step.
H R ( k ) = ln | F ( k ) | , k = 1 , 2 , N / 2
H R ( N / 2 + j ) = ln | F ( N / 2 j ) | , j = 1 , 2 , N / 2 2
where N = 2m and m is a positive integer.
(2) The function H ( k ) , consisting of H R ( k ) and H I ( k ) , can be obtained by a series of operations on the Inverse Fast Fourier Transform (IFFT) of H R ( k ) . Let h r ( n ) be the IFFT of H R ( k ) , then:
h r ( n ) = I F F T ( H R ( k ) )
Since H R ( k ) and H I ( k ) are Hilbert Transform pairs, then, according to [47], let:
h r ( n ) = { h r ( n )   n = 1 , N / 2 2 h r ( n ) n = 2 , N / 2 1 0 n = N / 2 + 1 , N 2
Then, the function H ( k ) can be obtained by FFT of h r ( n ) :
H ( k ) = F F T ( h r ( n ) )
(3) According to (6), the transfer function of a minimum phase system may be computed as:
f min ( n ) = I F F T ( F ( k ) ) = I F F T ( e H ( k ) )
where f min ( n ) is the IFFT of F ( k ) , and it is a sequence in time domain.

2.3. Circuit Simulations of Systems with Different Characteristics

The CWI test system illuminates electronic equipment under test by different antennas, which usually cover a frequency range from 100 kHz to 1 GHz. The test results are only the magnitude of spectral responses without phase information. In order to predict EMP responses with continuous wave data, the Hilbert Transform will be employed to reconstruct the phase information. This technique requires the systems to meet minimum phase conditions. However, it is difficult to verify whether a practical system is minimum phase or not. Several specific magnitude-only spectral responses with different shapes are illustrated and reconstructed in these papers [48,49] to determine the differences of reconstructions between minimum phase functions and non-minimum phase functions, but the characteristics that physical systems usually show are not considered in these studies.
A real system usually shows a frequency characteristic of low-pass, high-pass, band-pass or band-stop. Circuit models with low-pass, high-pass, band-pass and band-stop characteristic are built in ADS software and simulated to investigate whether these models meet the minimum phase condition. The scheme of predicting these circuit responses using magnitude-only data is shown in Figure 1.

2.3.1. The Circuit Simulation Setup

The ADS is a software which is widely used in circuit design, signal analysis and EM simulation. A low-pass circuit model is firstly built in ADS, including a source, two resistors and a filter, as shown in Figure 2.
A CW source with a frequency from 100 kHz to 1 GHz is used to excite the model and acquire the magnitude data on R2. By employing MPA, illustrated in Section 2.2, the transfer function of the low-pass system shown in Figure 2 is obtained and convoluted by the pulse excitation. Then, the CW source is replaced by a pulse source with the waveform defined by the Bell Lab. A double exponential EMP waveform is excited and the pulse response is calculated by ADS software. By replacing the filter in Figure 2 with high-pass, band-stop and band-pass filter, respectively, different responses are compared and illustrated in Figure 3 and Figure 4.

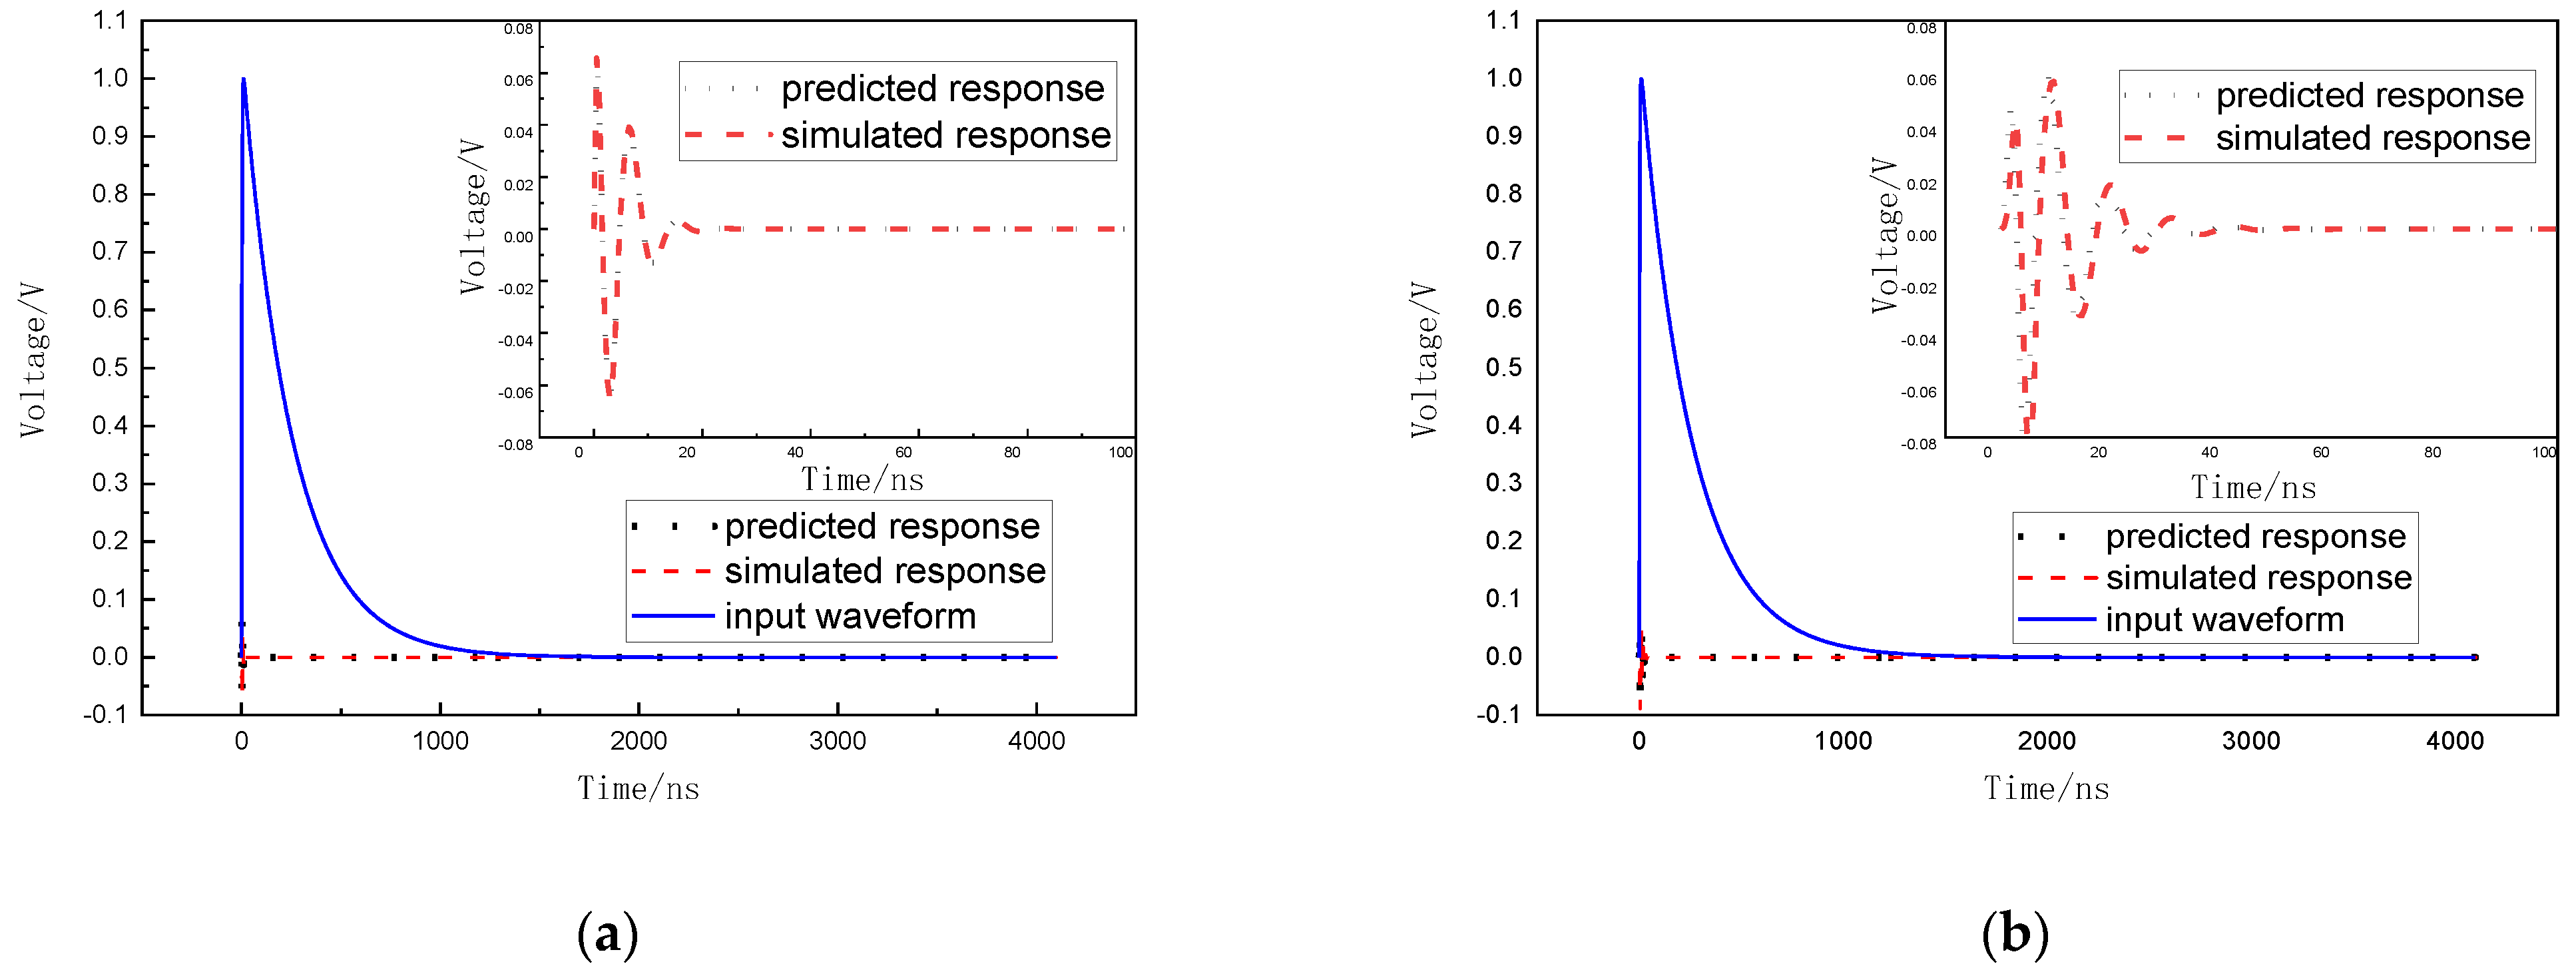
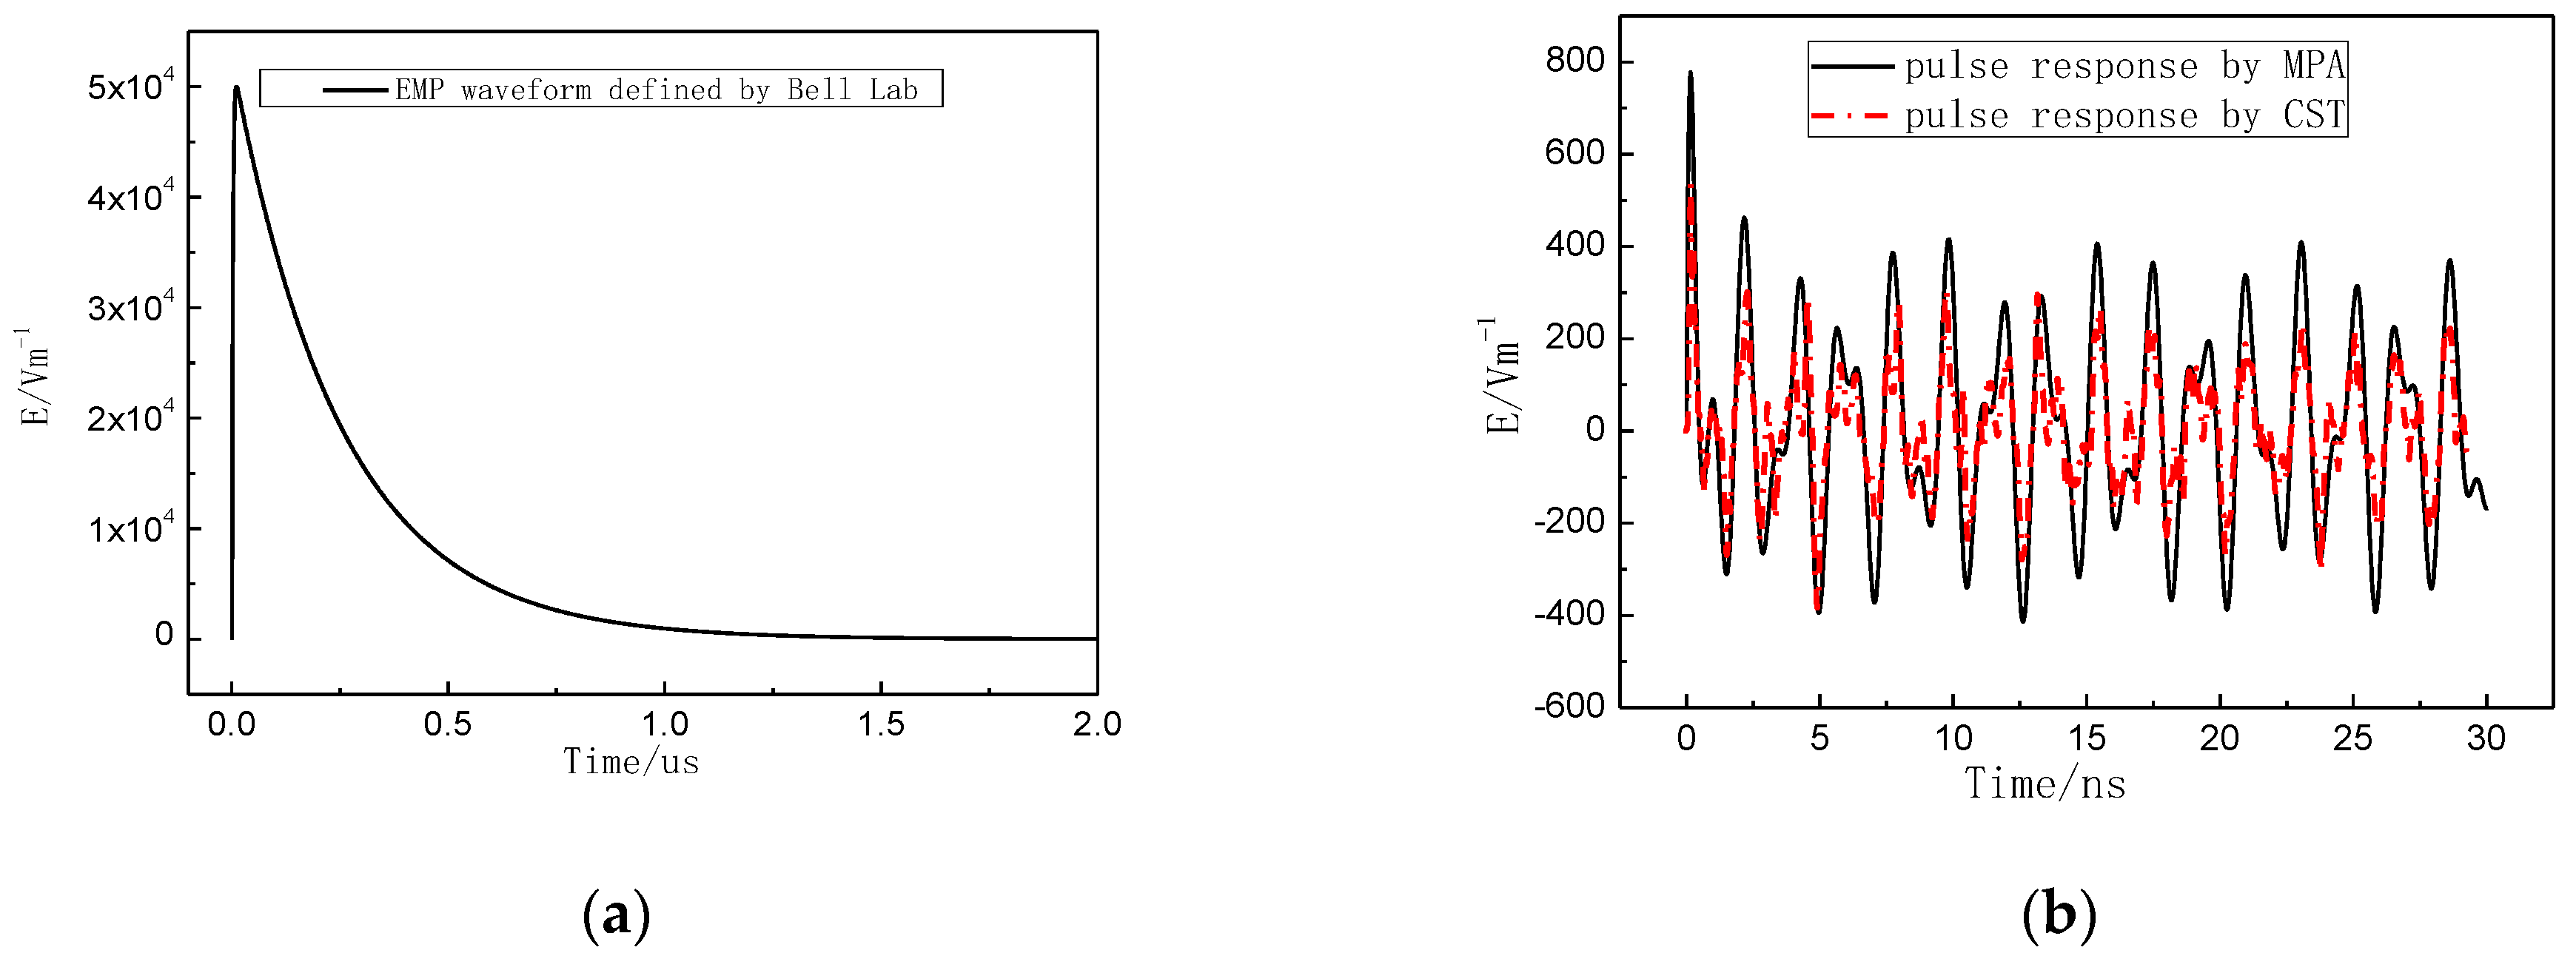
2.3.2. Simulation Results

The results predicted by MPA and calculated by ADS are shown in Figure 3 and Figure 4, respectively, and details in the first 100 nanoseconds are magnified. The responses in Figure 3a,b are similar because, at low frequencies, the characteristics of a low-pass filter and a band-stop filter are similar. Besides that, most of the energy in EMP waveforms is concentrated at low frequencies, so the residual energy of the low pass filter and band-stop filter is more than that of the high pass filter and band-pass filter. This is why the response magnitudes in Figure 3 are higher than those in Figure 4.
The correlation coefficients and root mean square errors (RMSE) of Figure 3a,b and Figure 4a,b are calculated and listed in Table 1. The results show that there is a strong correlation between simulation data and predicted data. The p values of the two curves (predicted and simulated responses) in each picture reveal that at the 0.05 level, the two curves are not significantly different.

3. Study on Systems in CW Electromagnetic Field

The accuracy of MPA on systems with different transfer functions has been verified by simulation studies on circuit models in Section 2, showing that these systems satisfy the minimum phase condition. However, the circuit simulations ignore the actual physical process of electromagnetic wave coupling to the systems. Moreover, the CWI test may be influenced by many factors—for example, the reflections from the surrounding environment, field uniformity and electromagnetic background noises—therefore, it is necessary to study the responses of systems under CW or pulse field illuminations.

3.1. Numerical Analysis of Coupling Fields in a Shielding Enclosure

This study performs a FDTD analysis on a shielding enclosure immersed in CW and a pulse electromagnetic field, as shown in Figure 5 [50]. The length of the shield is set to 40 cm long and the diameter of the hole is 10 cm. A uniform plane wave in the form of CW or EMP propagates to the y-axis and goes through the circular hole. A field monitor is placed at the center of the shield and used to record the coupling field strength.
The coupling fields excited by CW and EMP in the center of this enclosure are analyzed respectively. As the CW source sweeps from 100 kHz to 1 GHz, the magnitude of the transfer function is calculated, as illustrated in Figure 6.
The resonant frequency of a metal cavity can be determined by its edge length using the following formulation:
ω m n p = π μ ε ( m a ) 2 + ( n b ) 2 + ( p l ) 2
where a, b and l are the edge length of a cavity, and m, n and p represent the resonant modes. The resonant frequencies at the center of the shielding cavity are 529 MHz and 917 MHz, which are slightly higher than the results of CST numerical simulations. These results show that the simulation results of CST are consistent with the theoretical results of a resonant cavity. In order to predict the pulse response in the center of the shielding enclosure, the phase information of the transfer function is estimated by employing MPA, and the results are illustrated in Figure 7. The correlation coefficient and RMSE are 0.86977 and 54.13469, respectively, indicating that the two phase informations are almost identical.
After predicting the pulse response by transfer function of the enclosure, a pulse response analyzed by directly using CST is obtained and compared. In this simulation, the standard HEMP waveform of the bell laboratory is still used. The waveform is a double exponential pulse with about a 4 ns rise time and 184 ns FWHM (full-width at the half of the maximum), as shown in Figure 8a.
The CST simulates the process of EMP penetrating into the enclosure and analyzes the coupling response in its center. The results of numerical analysis are summarized in Figure 8b. All these programs show that it is feasible to predict electromagnetic pulse responses in shielding enclosures with the continuous wave experimental data.

3.2. Experimental Study of Coupling Currents on a Short-Wave Antenna

When a CWI test is carried out at an open area, background noises, field uniformity and reflections from the surroundings may influence the accuracy of predicted responses. From the present material, there are few relevant studies to show the differences between the actual measured responses and the predicted responses of an actual system, except one paper in 1993 [51]. The experiment results and setup in [51] are not so clear, and the environment is not introduced. Therefore, it is necessary to learn more about the details of the differences and improve experimental settings. The characteristics of predicted responses induced in a real system, especially in a complex environment, need to be fully explored and observed.
A CWI test system usually consists of power amplifiers, signal sources and antennas with a different frequency band. In order to gain the ability to predict responses through CWI test data and assess the electrical system susceptibility, a transportable CWI test system is built for assessment of large-scale systems. This CWI test system is composed of a continuous wave emission part, an automatic test and a measurement part and onboard mobile part. It can produce 2 MHz~1 GHz continuous electromagnetic fields and can adjust the polarization direction and radiation angle by a motor to meet different experimental objects and requirements. The CW radiation antennas can be raised as high as 20 m to simulate CW sources at different heights, and it is shown in Figure 9.
A case study of predicting pulse currents on a short-wave antenna is carried out at an open area. The ratio of the induced current to the radiation field strength at the short-wave antenna is defined as the amplitude spectrum of the system transfer function, and the formulation is:
T ( f ) = I i n d u c e d ( f ) E c w ( f )
where T ( f ) is the transfer function of the short-wave antenna, I i n d u c e d ( f ) is the induced current on the antenna and E c w ( f ) is the continuous wave radiation field at the location of the antenna. E c w ( f ) is measured by a D-dot sensor, and its characteristic curves in the frequency domain are shown in Figure 10b.
The distance between a short-wave antenna and a CW source antenna is about 10.5 m. A current sensor is used to measure the induced current on the antenna, and the frequency range is 100 kHz–1 GHz. The current sensor transmits the signal to the oscilloscope through the electro-optic conversion module and the optical fiber. The amplitude spectrum of the transfer function between the current and the electric field is obtained by scanning the amplitude of the induced current on the short-wave antenna and the continuous wave electric field at the location of the antenna from 2 MHz to 1 GHz, as shown in Figure 11.
The pulse response test of the antenna is carried out in a bounded wave simulator. An EMP with a 70 kV/m amplitude is generated in the working volume, and it is the same shape as that in the CWI data processing procedure. The induced pulse current on the short-wave antenna represents the response of a system under the radiation of a real electromagnetic pulse and is measured by an active sensor. The setup of the measurement is shown in Figure 12.
For the purpose of estimating the injected quantities of a large-scale electrical system, predicted pulse response from CWI test data and measured response excited by the same EMP are compared in Figure 13. The results in Figure 13 show that the time-domain responses predicted by the transfer function of the system are in good agreement with the current oscillation periods and amplitudes of the test results, and because the system frequency is limited to 1 GHz, high frequency oscillation components of predicted results are obviously less than that of the actual test results. However, the prediction results still can provide some reference values in amplitudes and periods.
As the low field intensity in a CWI test, the nonlinear effect cannot be predicted by the CWI test method. When the pulse response waveform is predicted through CWI test data, the PCI test is needed to relate the nonlinear effect, if it exists, and the predicted pulse response.

4. Injected Electrical Quantities in PCI Test

In this section, several criteria are defined in the time domain, since it may be related to the nonlinear effects in PCI tests, such as circuit jamming and burn out. According to IEC 61000-4-33 [52] and MIL-STD-188-125 [35,53], several scalar numbers which characterize the time-dependent waveform functions of electrical quantities are defined. To choose the appropriate degree and waveform to be injected, these definitions need to be taken into consideration.
(1) The peak current here is defined as the maximum value of the predicted current, which can provide reference information for injected electrical quantities of PCI tests. When injecting a current with the same peak value, it may cause damage by overcurrent to the system under evaluation. The peak value is defined as N = | I ( t ) | max , which is the so-called infinite norm.
(2) N 1 = 0 | I ( t ) | d t is the rectified value of the response. This norm usually relates the total impulse to equipment damage.
(3) The integral of the squared injected current can be used to evaluate the amount of energy coupling to the system over a period, which may result in burnout damage due to thermal effects. It is usually described as N 2 = 0 | I ( t ) | 2 d t .
The PCI tests can provide observations on nonlinear effects, including upset, breakdown and burnout damage, if the injected current is sufficient. By choosing an appropriate injecting source and impedance to the ground, the injected current may be adjusted similar to the predicted current by norm standards.

5. Conclusions

It is hard to assess the susceptibility of large-scale systems against threat-level EMP directly, because there are technical difficulties and a high cost in building EMP simulators that are large enough. To solve this problem, an alternative way to study the vulnerabilities of large-scale systems is proposed, which includes predicting system pulse currents under threat-level EMP attacks and then injecting the currents into the system by PCI tests. However, up to the present, there are no relevant standards and studies concerning this problem. Therefore, this study aimed to verify the accuracy of predicting system response by CWI test and the feasibility of studying nonlinear effects by PCI test.
Accordingly, a series of simulations and experiments has been carried out about different systems. In the circuit simulations, four filter systems with different characteristics are built in ADS software, including a low-pass system, high-pass system, band-pass system and band-stop system. The characteristic curves of these systems are predicted by MPA and simulated to verify accuracy of prediction. These systems can represent the majority of systems in the real word. Another simulation run by CST in this paper considers electromagnetic field coupling in 3D space, and field response in the center of the model is also predicted and simulated. As there are many unexpected noises or reflections in actual tests, a short-wave antenna is studied as a case. The pulse current on the antenna is predicted by CWI test data and measured in an EMP simulator. The PCI test can inject a pulse current, similar to that predicted by the CWI test data, into the system as a test, and nonlinear effects, if any exist, can be observed. Different norms are defined to describe the characteristics of injected quantities, and they are useful in studying the nonlinear effects. With the results analyzed and discussed, three major conclusions are summarized as follows:
(1) The low-pass, high-pass, band-pass and band-stop systems meet the minimum phase condition, and their phase information can be reconstructed by magnitudes through MPA. The system responses excited by the EMP source can be predicted by convoluting the source and system transfer function, and the predicted results are in accordance with results simulated by software.
(2) The feasibility of predicting system pulse response by CWI test data is verified using a short-wave antenna. The oscillation period of the predicted current is slightly different from the measured current for noises and reflections, but the predicted one can still be used as a reference to inject quantities in a PCI test.
(3) Scalar norms can help when studying the nonlinear effects of the system under test. By choosing the appropriate source and impedance in the PCI test, reasonable induced current can be injected into the system, and then the vulnerability of a large-scale system could be studied.
The method proposed in this paper tries to solve the problem of nonlinear effect assessments of large-scale systems or facilities such as ships, airplanes, communication base stations, power stations, etc. However, this method is still raw and needs further improvement. There is still a lot of important work to do in the future.
(1) The accuracy of the response prediction method needs to be improved. The simulations and experiments results reveal that the method is sensitive to noises. Therefore, more rigorous experiment conditions should be set and a suitable filtering method needs to be found. Another way to improve the prediction accuracy is to perform the calibration test in a GTEM cell, and many experiments should be conducted to obtain empirical coefficients.
(2) More validation tests need to be performed. The MPA requires that the system under test meets the minimum phase condition. Although, in this paper, some kinds of systems are verified by simulations or experiments, in reality, we cannot enumerate all of the systems.
(3) Standards concerning this method need to be established. In order to acquire comparable data in experiments conducted by different researchers, lots of details and general rules in experiments, such as the polarization and radiation direction of the CWI test, the calibration of different measurement links, etc., need to be determined.

Author Contributions

Conceptualization, H.L.; Methodology, P.C.; Software, H.L.; Formal analysis, P.C.; Investigation, P.C.; Data curation, F.W.; Writing—original draft, P.C.; Supervision, H.L.; Project administration, W.W. and X.N.; Funding acquisition, W.W. All authors have read and agreed to the published version of the manuscript.

Funding

This research received no external funding.

Institutional Review Board Statement

Not applicable.

Informed Consent Statement

Not applicable.

Data Availability Statement

The data presented in this study are available on request from the corresponding author. The data are not publicly available due to privacy.

Conflicts of Interest

The authors declare no conflict of interest.

References

  1. IEC 61000 1-3; Electromagnetic Compatibility (EMC)—Part 1–3: General—The Effects of High-Altitude EMP (HEMP) on Civil Equipment and Systems. 2002. Available online: https://standards.iteh.ai/catalog/standards/iec/43eb4d78-3507-45be-8300-2429ae5ad543/iec-tr-61000-1-3 (accessed on 18 November 2022).
  2. Baum, C. EMP simulators for various types of nuclear EMP environments: An interim categorization. IEEE Trans. Antennas Propag. 1978, 26, 35–53. [Google Scholar] [CrossRef]
  3. Davis, W. Bounding EMP interaction and coupling. IEEE Trans. Antennas Propag. 1981, 29, 842–846. [Google Scholar] [CrossRef]
  4. Press, J.L.; Schechter, M.; Rastegar, M. EMP threat analysis of a generic electronic unit. In Proceedings of the Eighth International Conference on Electromagnetic Compatibility, Edinburgh, UK, 21–24 September 1992. [Google Scholar]
  5. Robert, G.O.; Alfonso, G.T. EMP Coupling to a Straight Conductor above Ground: Transmission Line Formulation Based on Electromagnetic Reciprocity. IEEE Trans. Electromagn. Compat. 2019, 61, 919–927. [Google Scholar]
  6. Kumar, P.S.; Subbarao, B. Study on Modeling & Simulation Issue Analysis of Electromagnetic Pulse (EMP) Coupling to Cables. In Proceedings of the 15th International Conference on ElectroMagnetic Interference & Compatibility (INCEMIC), Bengaluru, India, 13–16 November 2018. [Google Scholar]
  7. Kukjoo, K.; Kyung-Ryeung, M.; Young-Jun, P. A Pilot Experiment to Develop a Lightweight Non-Nuclear EMP Shelter Applying Civil-Military Cooperation in a Sustainability Policy. Sustainability 2020, 12, 10669. [Google Scholar]
  8. Yang, C.; Liu, P.-G.; Huang, X.-J. A Novel Method of Energy Selective Surface for Adaptive HPM/EMP Protection. IEEE Antennas Wirel. Propag. Lett. 2013, 12, 112–115. [Google Scholar] [CrossRef]
  9. Kim, K.; Min, K.-R.; Park, Y.-J. Study on the Development of a Deployable Tactical EMP Tent for a Sustainable Military Facility. Sustainability 2021, 13, 16. [Google Scholar] [CrossRef]
  10. Kim, K.; Park, Y.-J. Development of Decision-Making Factors to Determine EMP Protection Level: A Case Study of a Brigade-Level EMP Protection Facility. Appl. Sci. 2021, 11, 5227. [Google Scholar] [CrossRef]
  11. Yantao, D.; Bin, C.; Hailin, C. Analysis of EMP Propagation in Protection Engineering. In Proceedings of the 2007 International Symposium on Microwave, Antenna, Propagation and EMC Technologies for Wireless Communications, Hangzhou, China, 16–17 August 2007; pp. 880–883. [Google Scholar]
  12. Martin, L.C. EMP Protection Technology Interchange. In Proceedings of the IEEE International Symposium on Electromagnetic Compatibility, Seattle, WA, USA, 2–4 August 1977. [Google Scholar]
  13. Shahid, A. Electromagnetic Pulse Simulations Using Finite- Difference Time-Domain Method; John Wiley & Sons, Inc.: Hoboken, NJ, USA, 2021; pp. 3–5. [Google Scholar]
  14. Giles, J.C.; Prather, W.D. Worldwide High-Altitude Nuclear Electromagnetic Pulse Simulators. IEEE Trans. Electromagn. Compat. 2013, 55, 475–483. [Google Scholar] [CrossRef]
  15. IEC 61000 4-32; Electromagnetic Compatibility (EMC)—Part 4-32: Testing and Measurement Techniques—HEMP Simulator Compendium. IEC: Geneva, Switzerland, 2016.
  16. Shi, L.-H.; Zhang, X.; Sun, Z.; Ma, R.-P. An Overview of the HEMP Research in China. IEEE Trans. Electromagn. Compat. 2013, 55, 422–430. [Google Scholar] [CrossRef]
  17. Shi, L.H. An overview of the research on high-power electromagnetics in China. In Proceedings of the 2008 European Electromagnetics Conference (EUROEM 2008), Lausanne, Switzerland, 21–25 July 2008. [Google Scholar]
  18. Latham, R.W.; Lee, K.S.H. Electromagnetic interaction between a cylindrical post and a two-parallel-plate simulator—I. Sens. Simul. Notes 1970, 111, 1–30. [Google Scholar]
  19. Gilman, C.; Lam, S.K.; Naff, J.T.; Klatt, M.; Nielsen, K. Design and performance of the FEMP-2000: A fast risetime, 2 MV EMP pulser. In Proceedings of the 12th IEEE International Pulsed Power Conference Digest of Technical Papers, Monterey, CA, USA, 27–30 June 1999; pp. 1437–1440. [Google Scholar]
  20. Bailey, V.; Carboni, V.; Eichenberger, C. A 6-MV Pulser to Drive Horizontally Polarized EMP Simulators. IEEE Trans. Plasma Sci. 2010, 38, 2554–2558. [Google Scholar] [CrossRef]
  21. Zhang, Y.; Dengheng, Z. High Voltage Insulation Technology; China Electric Power Press: Beijing, China, 2007. [Google Scholar]
  22. Saushkin, A.V.; Zharova, N.V.; Kim, A.A.; Ratakhin, N.A.; Feduschak, V.F. A PC 200-1.5 peaking capacitor for an output-power increase in the LTD-100R stage. In Proceedings of the Pulsed Power Conference, Monterey, CA, USA, 13–15 June 2005; pp. 120–123. [Google Scholar]
  23. Franco, S. Polypropylene capacitors for snubber applications. In Proceedings of the Conference Record, Industry Applications Society Conference, IEEE 31st IAS Annual Meeting (IAS), San Diego, CA, USA, 9–14 October 1996; pp. 1337–1342. [Google Scholar]
  24. El-Husseini, M.H.; Venet, P.; Rojat, G.; Al-Majid, A.; Fathallah, M. Improving pulse handling capability of metalized polypropylene films capacitors. In Proceedings of the Conference Record IEEE Industry Applications Conference, 36th IAS Annual Meeting, Chicago, IL, USA, 30 September–4 October 2001; pp. 2481–2486. [Google Scholar]
  25. Khachen, W.; Laghari, J.R.; Sarjeant, W.J. Dielectric breakdown of polypropylene under high frequency fields. In Proceedings of the IEEE International Symposium on Electrical Insulation, Baltimore, MD, USA, 7–10 June 1992; pp. 185–188. [Google Scholar]
  26. Laihonen, S.J.; Gafvert, U.; Schutte, T.; Gedde, U. DC breakdown strength of polypropylene films: Area dependence and statistical behavior. IEEE Trans. Dielect. Electr. Insul. 2007, 14, 275–286. [Google Scholar] [CrossRef]
  27. Zhang, C.; Mori, T.; Mizutani, T.; Ishioka, M. Effects of manufacturing technology on electrical breakdown and morphology of thin films of low density polyethylene blended with polypropylene copolymer. IEEE Trans. Dielectr. Electr. Insul. 2003, 10, 435–443. [Google Scholar] [CrossRef]
  28. IEC 61000 4-23; Electromagnetic Compatibility (EMC)–Part 4-23: Testing and Measurement Techniques—Test Methods for Protective Devices for HEMP and Other Radiated Disturbances. IEC: Geneva, Switzerland, 2000.
  29. IEC 61000 5-9; Electromagnetic Compatibility (EMC)—Part 5-9: Installation and Mitigation Guidelines—System-Level Susceptibility Assessments for HEMP and HPEM. IEC: Geneva, Switzerland, 2009.
  30. Baum, C.E.; Chang, H. Fields at the Center of a Full Circular TORUS and a Vertically Griented TORUS on a Perfectly Conducting Earth; Sensor and Simulation Notes; Notes 160. 1972. Available online: https://www.google.com.hk/url?sa=t&rct=j&q=&esrc=s&source=web&cd=&ved=2ahUKEwjz96rt4ZP8AhV5SmwGHcUuC14QFnoECAoQAQ&url=http%3A%2F%2Fece-research.unm.edu%2Fsumma%2Fnotes%2FSSN%2Fnote160.pdf&usg=AOvVaw3aNI2GSEo8OLjcFXYuRJNn (accessed on 18 November 2022).
  31. Baum, C.E.; Prather, W.D. Topology for Transmitting Low-Level Signals from Ground Level to Antenna Excitation Position in Hybrid EMP Simulators. Sensor and Simulation Notes; Notes 333. 1991. Available online: https://www.google.com.hk/url?sa=t&rct=j&q=&esrc=s&source=web&cd=&ved=2ahUKEwiUmP-Q4pP8AhUfT2wGHYyqAyUQFnoECAgQAQ&url=http%3A%2F%2Fece-research.unm.edu%2Fsumma%2Fnotes%2FSSN%2Fnote333.pdf&usg=AOvVaw24Km-v3nI4Pv1P9vIMMiyi (accessed on 18 November 2022).
  32. Taylor, C.D.; Langdon, S.L.; Gutierrez, S.J. On the Wide-Band CW Illumination of Large Scale Systems: Part I-The Ellipticus Illuminator. IEEE Trans. Electromagn. Compat. 1995, 33, 473–477. [Google Scholar] [CrossRef]
  33. Prather, W.D.; Cafferky, J.; Ortiz, L.; Anderson, J. CW measurements of electromagnetic shields. IEEE Trans. Electromagn. Compat. 2013, 55, 500–507. [Google Scholar] [CrossRef]
  34. Prather, W.D.; Rooney, M.R.; Cafferky, J.; Rynne, T.M.; Ortiz, L.; Anderson, G. Swept CW Testing of Shielded Systems. In Proceedings of the 2012 IEEE International Symposium on Electromagnetic Compatibility (EMC), Pittsburgh, PA, USA, 6–10 August 2012; pp. 657–662. [Google Scholar]
  35. MIL-STD-188-125-2; High-Altitude Electromagnetic Pulse (HEMP) Protection for Ground-Based C4I Facilities Performing Critical, Time-Urgent Missions, Part 2 Transportable Systems. 2005. Available online: http://everyspec.com/MIL-STD/MIL-STD-0100-0299/MIL-STD-188_125-2_24889/ (accessed on 18 November 2022).
  36. Chen, Y.H.; Xie, Y.Z.; Zhang, D.Z.; Zhou, Y.; Ren, D.C.; Gou, M.Y.; Dong, N. 10kV transmission line experimental platformfor HEMP immunity test of electrical equipment in operation. IEEE Trans. Power Deliv. 2020, 36, 1034–1040. [Google Scholar] [CrossRef]
  37. IEC-61000-4-25; Electromagnetic Compatibility (EMC)—Part 4: Testing and Measurement Techniques—HEMP Immunity Test Methods for Equipment and Systems. 2001. Available online: https://standards.iteh.ai/catalog/standards/iec/d4b7a19f-f70e-4257-ab2b-926a2132df8b/iec-61000-4-25-2001-amd2-2019/ (accessed on 18 November 2022).
  38. MIL-STD-461E; Requirement for the Control of Electromagnetic Interference Characteristics of Subsystems and Equipment. 1999. Available online: https://pdf.ic37.com/icpdf_datasheet_5/MIL-STD-202A_datasheet_5735877/ (accessed on 18 November 2022).
  39. IEC-61000-4-4; Electromagnetic Compatibility (EMC)—Part 4: Testing and Measurement Techniques—Section 4: Electrical Fast Transient/Burst Immunity Test. 2002. Available online: https://standards.iteh.ai/catalog/standards/iec/8417a484-3661-424e-8a02-a007602e95ec/iec-61000-4-4-2012/ (accessed on 18 November 2022).
  40. Zhou, Y.; Xie, Y.; Zhang, D.; Jing, Y. Modeling and Performance Evaluation of Inductive Couplers for Pulsed Current Injection. IEEE Trans. Electromagn. Compat. 2021, 63, 710–719. [Google Scholar]
  41. Cui, Z.; Grassi, F.; Pignari, S.A. Circuit modeling of the test setup for pulsed current injection. In Proceedings of the Asia-Pacific International Symposium on Electromagnetic Compatibility (APEMC), Shenzhen, China, 17–21 May 2016. [Google Scholar]
  42. Cui, Z.; Grassi, F.; Pignari, S.A.; Wei, B. Pulsed current injection setup and procedure to reproduce intense transient electro-magnetic disturbances. IEEE Trans. Electromagn. Compat. 2018, 60, 2065–2068. [Google Scholar] [CrossRef]
  43. Xu, S.-S. Signals and Systems-Theory, Methods and Applications; USTC Press: Hefei, China, 2003; pp. 298–301. (In Chinese) [Google Scholar]
  44. Hayes, M.H.; Lim, J.S.; Alan, V. Oppenheim. Signal reconstruction from phase or magnitude. IEEE Trans. Acoust. Speech Signal Process. 1980, 28, 672–680. [Google Scholar] [CrossRef] [Green Version]
  45. Tesche, F.M. On the Use of the Hilbert Transform for Processing Measured CW Data. IEEE Tranactions Electro-Magn. Compat. 1992, 34, 259–266. [Google Scholar] [CrossRef]
  46. Hu, G.-S. Digital Signal Processing-Theory, Algorithm and Implementation; Tsinghua University Press: Beijing, China, 2003; pp. 231–232. (In Chinese) [Google Scholar]
  47. Oppenheim, A.V.; Schafer, R.W. Digital Signal Processing; Prentice-Hall: New York, NY, USA, 1975. [Google Scholar]
  48. Shi, L.H.; Zhou, B.H; Chen, B. Time domain characterization of a system based on the magnitude of its frequency response. Chin. J. Radio Sci. 2002, 15, 467–471. [Google Scholar]
  49. Yan-Zhao, X.; Zan-Ji, W.; Qun-Shu, W. Reconstruction of electromagnetic pulse waveform based on the amplitude spectrum data. High Power Laser Part. Beams 2004, 16, 320–324. [Google Scholar]
  50. Chen, P.; Mao, C.; Wu, G. Shielding effectiveness assessment of enclosure by means of EMP excitation. In Proceedings of the 2016 Asia-Pacific International Symposium on Electromagnetic Compatibility (APEMC), Shenzhen, China, 18–21 May 2016; Volume 1, pp. 273–275. [Google Scholar]
  51. Lawry, D.; Prather, W.; Torres, R. Comparisons of the Low Level CW ELLIPTICUS and High Level Pulse HPD Currents on the EMPTAC Aircraft. In Proceedings of the International Symposium on Electromagnetic Compatibility, Dallas, TX, USA, 9–13 August 1993; IEEE: Manhattan, NY, USA, 1993; pp. 453–454. [Google Scholar]
  52. IEC 61000-4-33; Electromagnetic Compatibility (EMC)–Part 4: Testing and Measurement Techniques Section 33: Measurement Methods for High-Power Transient Parameters. 2005. Available online: https://standards.iteh.ai/catalog/standards/iec/68cb9140-9a42-4aeb-9c25-07ac2f8d1a50/iec-61000-4-33-2005/ (accessed on 18 November 2022).
  53. MIL-STD-188-125-1; High-Altitude Electromagnetic Pulse (HEMP) Protection for Ground-Based C4I Facilities Performing Critical, Time-urgent Missions, Part 1 Fixed Facilities. 2005. Available online: https://www.researchgate.net/publication/43244607_MIL-STD-188-125-1/ (accessed on 18 November 2022).
Figure 1. The process of comparing simulated response and predicted response.
Sustainability 15 00320 g001
Figure 2. Low-pass circuit model in ADS.
Sustainability 15 00320 g002
Figure 3. Comparison of responses acquired by ADS and MPA in the low-pass filter and band-stop filter. (a) Response of the low-pass filter; (b) response of the band-stop filter.
Sustainability 15 00320 g003
Figure 4. Comparison of responses acquired by ADS and MPA in the high-pass filter and the band-pass filter. (a) Response of the high-pass filter; (b) response of the band-pass filter.
Sustainability 15 00320 g004
Figure 5. The shielding enclosure simulated in CST.
Sustainability 15 00320 g005
Figure 6. The magnitude of the transfer function.
Sustainability 15 00320 g006
Figure 7. The comparison of phases calculated by CST and estimated by MPA.
Sustainability 15 00320 g007
Figure 8. Simulation results in the CST software. (a) The waveform of EMP excitation in CST; (b) the comparison of responses.
Sustainability 15 00320 g008
Figure 9. The transportable CWI test system.
Sustainability 15 00320 g009
Figure 10. A D-dot sensor and its characteristic curve. (a) D-dot sensor; (b) characteristic curve of the D-dot sensor.
Sustainability 15 00320 g010
Figure 11. The transfer function measuring of a short-wave antenna. (a) The measurement setup; (b) the measured amplitude of the transfer function.
Sustainability 15 00320 g011
Figure 12. Induced pulse current measurement setup. (a) Test setup of the simulator and the short-wave antenna; (b) EMP waveform of the simulator.
Sustainability 15 00320 g012
Figure 13. Comparing predicted and measured pulse currents on the short-wave antenna.
Sustainability 15 00320 g013
Table 1. Statistical characteristics between prediction and simulation results.
Curves inCorrelation CoefficientsRMSESignificance Levelp Value
Figure 3a0.999190.084770.050.99998
Figure 3b0.999970.084670.051
Figure 4a0.999730.001830.050.99993
Figure 4b0.78260.002560.050.99995
Disclaimer/Publisher’s Note: The statements, opinions and data contained in all publications are solely those of the individual author(s) and contributor(s) and not of MDPI and/or the editor(s). MDPI and/or the editor(s) disclaim responsibility for any injury to people or property resulting from any ideas, methods, instructions or products referred to in the content.

