Article

A Technoeconomic Resilience and Exergy Analysis Approach for the Evaluation of a Vaccine Production Plant in North-East Colombia

by
Ángel Darío González-Delgado
1,*,
Janet B. García-Martínez
2 and
Andrés F. Barajas-Solano
2
1
Nanomaterials and Computer Aided Process Engineering Research Group (NIPAC), Chemical Engineering Department, Universidad de Cartagena, Cartagena de Indias 130015, Colombia
2
Department of Environmental Sciences, Universidad Francisco de Paula Santander, Av. Gran Colombia No. 12E-96, Cúcuta 540003, Colombia
*
Author to whom correspondence should be addressed.
Sustainability 2023, 15(1), 287; https://doi.org/10.3390/su15010287
Submission received: 19 October 2022 / Revised: 11 December 2022 / Accepted: 19 December 2022 / Published: 24 December 2022
(This article belongs to the Topic Energy Economics and Sustainable Development)

Abstract

:
Influenza is an acute infection that can cause diabetes and heart and lung disease disorders. This illness affects more than 9 million people around the world. The best way to control the transmission of the virus is vaccination. Studies, performed in Santander, Colombia, have found the existence of this disease. Despite the above, there are no companies dedicated to producing influenza vaccines in Colombia. For the first time, exergetic analysis and technical-economic resilience are being performed as combined decision-making tools for the evaluation of an influenza vaccine production plant. The results of exergetic analysis showed that the global exergy efficiency of the process was estimated at 93%. The exergy of waste that resulted was 61.70 MJ/h. The most critical stage of the process is milling, representing 83% of the total destroyed exergy. On the other hand, the results of technoeconomic resilience showed that the break-even point capacity of the process is 2503.15 t/y, representing only 24% of the installed capacity of the plant. The analysis of the effect of raw materials cost on profits showed that the process only resists a rise of 4% in the cost of raw materials, and higher values show economic losses. A value of 215,500 USD/t establishes a critical point for the normalized variable operating costs because higher values do not provide a return on investment.

1. Introduction

Vaccines have been used to prevent influenza since the 1940s, and vaccine formulations have been updated with the emergence of new viruses. Currently, trivalent and tetravalent influenza vaccines are being formulated [1]. Influenza is a virus that can affect the respiratory system by direct infection or damage to the immune system [2]. Influenza can also affect other organs such as the heart or the nervous system [3]. This disease has been estimated to infect between 4 and 50 million Europeans annually [4]. This disease is highly contagious, and an outbreak can become an epidemic or pandemic. Vaccination prevented more than 7 million illnesses in the United States in 2018 during the influenza season [5]. Influenza infection increases the risk of cardiovascular accidents and even death. Studies show that influenza vaccination reduces the rate of ischemia-related events. Analysis of several studies reported a 17% reduction in mortality in patients with heart failure [6]. The prevalence of the virus in a small and biodiverse area such as Colombia indicates the need to control the transmission of influenza [7]. A study on 64 children with respiratory infections in the Comunera and Garcia provinces showed that 12% of the children had influenza infections. The vaccine is the most effective means of controlling the spread of the virus [8]. Despite this, in Colombia, there are no companies dedicated to producing influenza vaccines [9].
The exergetic analysis helps to detect points to implement strategies that allow better use of the available resources and improve the thermodynamic efficiency of the processes [10]. It is estimated that each manufacturing pharmaceutical requires 3.34 kWh per gram of vaccine [11]. On the other hand, the technoeconomic resilience allows us to know some critical points of a process and its resistance to changes in the technical and economic environment of the process. An essential aspect to consider in the production of vaccines is to ensure affordable prices that allow global access to the vaccine [12]. For this reason, an exergy analysis of an influenza vaccine production plant is performed in this work. The global exergy efficiency was calculated. Furthermore, the exergy of waste, destroyed exergy, the exergy of utilities, and exergy efficiency were calculated for each stage of the process. This energy consumption is a high operating cost and may cause pollution. Therefore, the vaccine production process must be analyzed in exergetic terms, in this way, improvement points can be found. On the other hand, it is crucial to evaluate the technical and economic flexibility of the processes, as well as to know their economic indicators, because this allows us to make decisions in order to improve them. For this reason, in this work, the technoeconomic resilience analysis of an influenza vaccine production plant was performed to determine its economic flexibility. A study of the break-even point and on-stream efficiency was conducted. The effect of raw material costs on profits was analyzed, and the effect of operating costs on return on investment (ROI). In this work, exergy and techno-economic resilience analyses were combined to evaluate an influenza vaccine production process in a plant located in north-east Colombia.

2. Materials and Methods

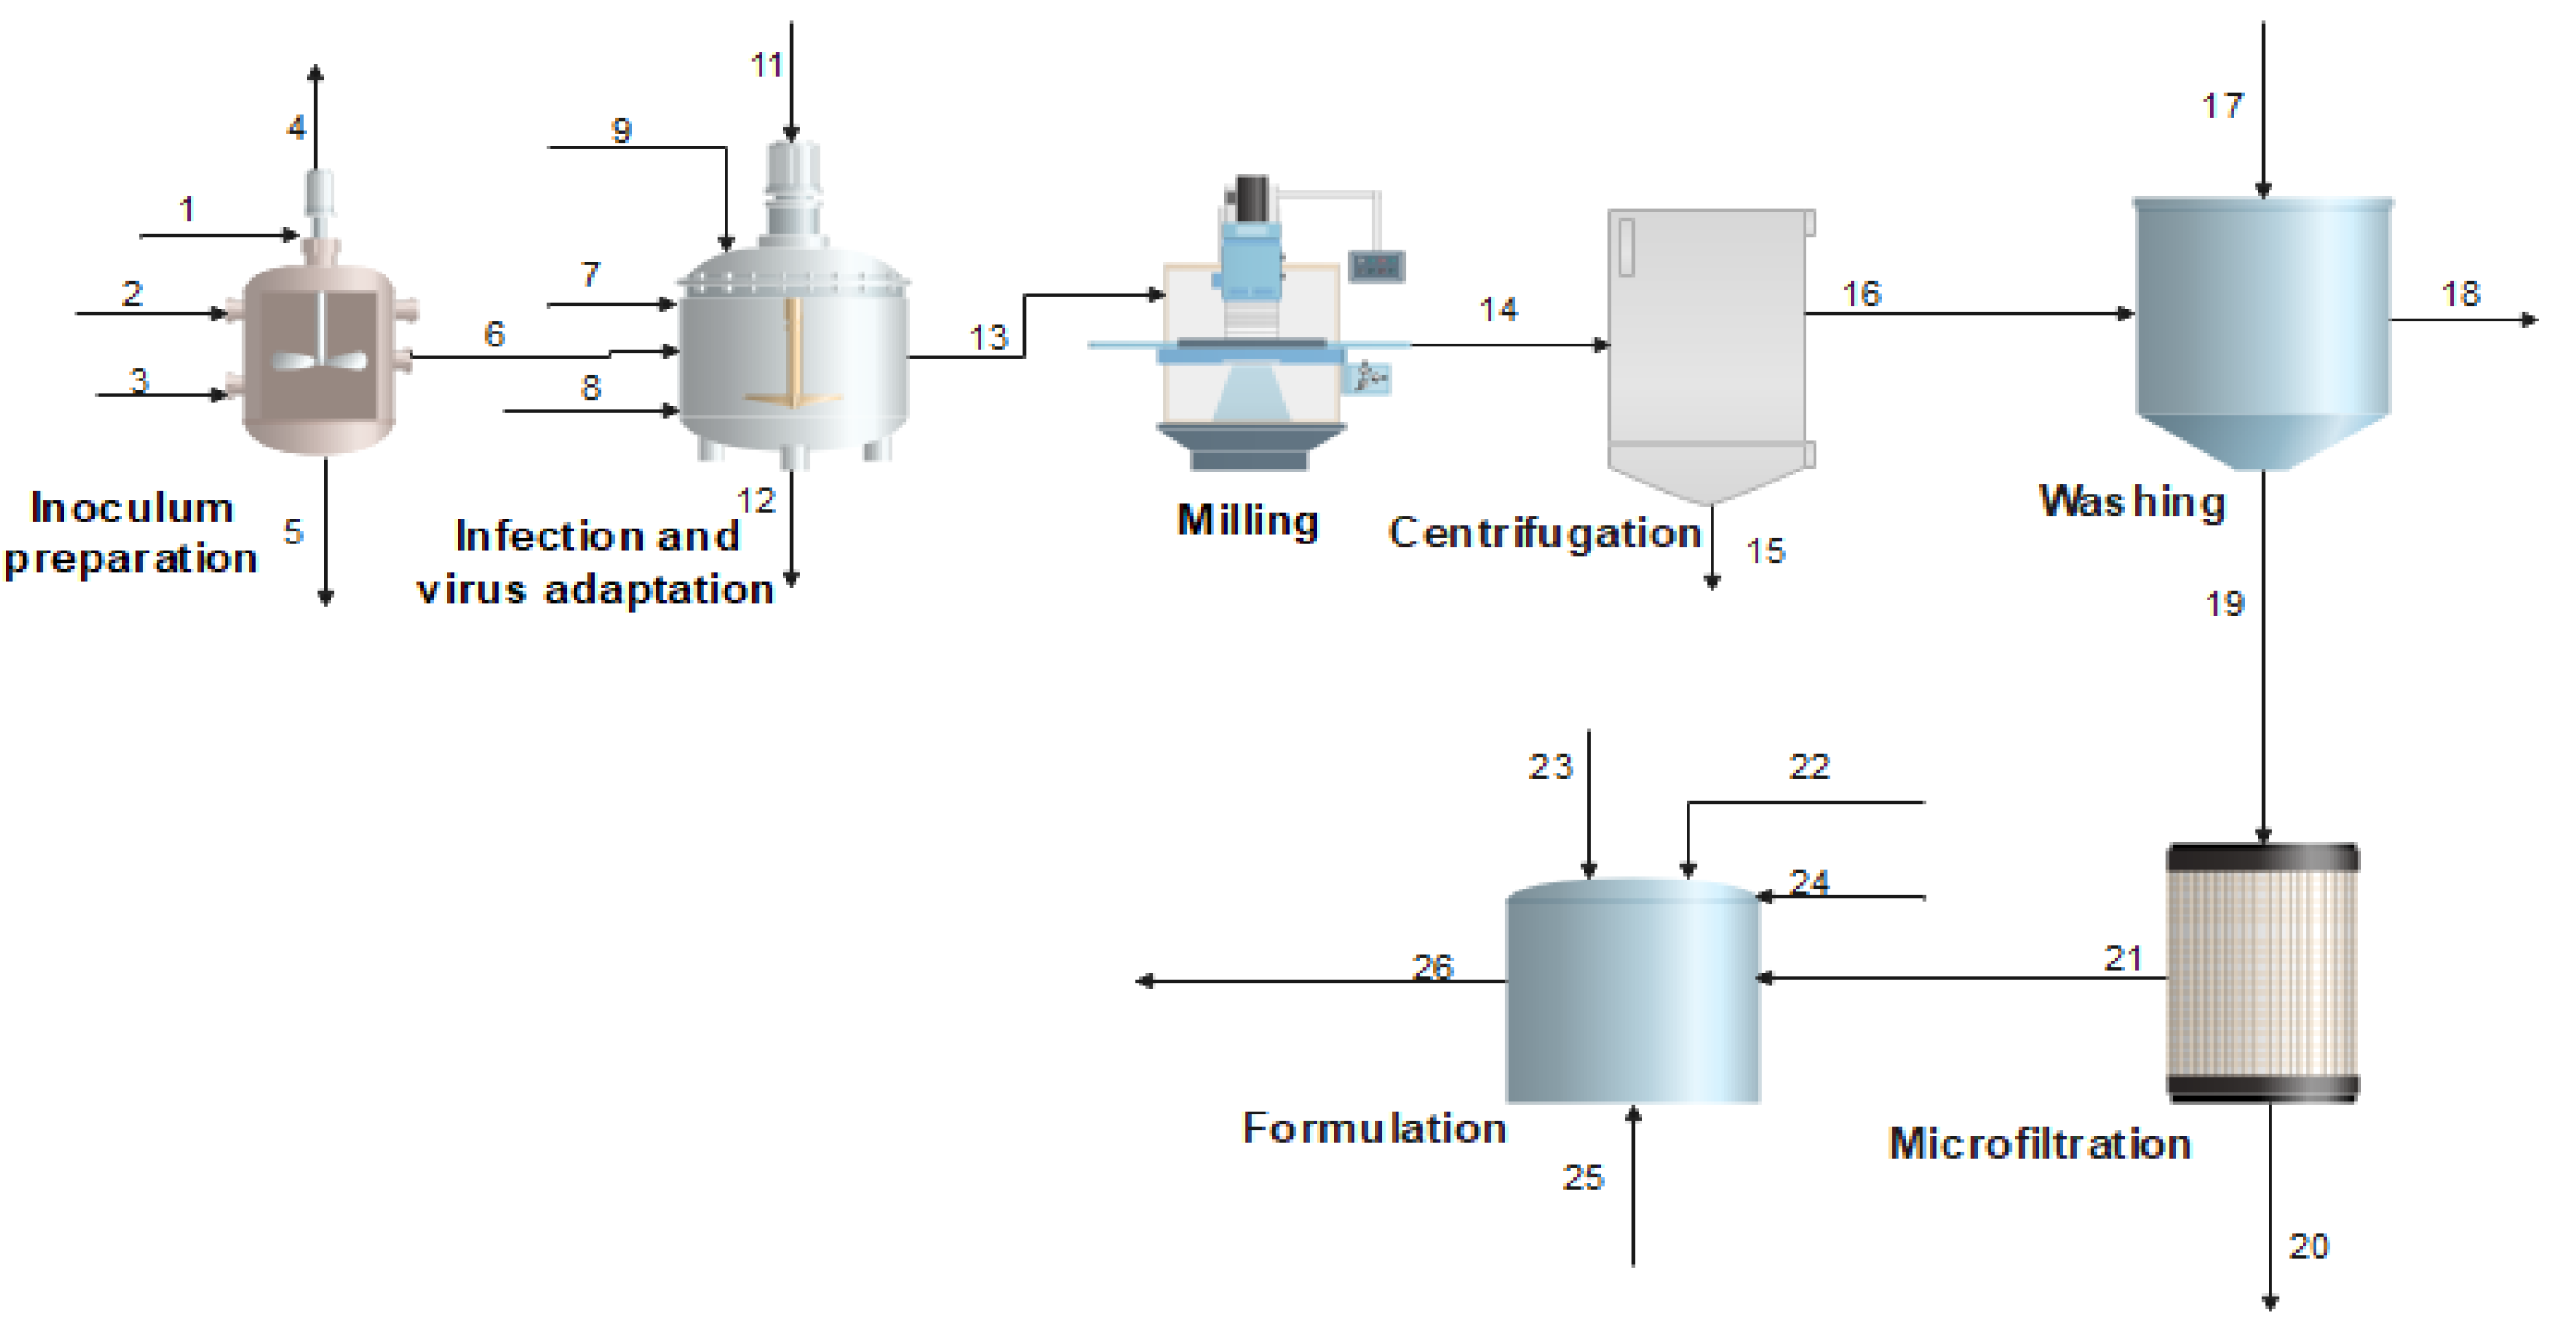
2.1. Process Description

The process starts with the inoculum preparation (stage 1); a cultivation medium DMEM, which contains aminoacids and vitamins, is used in this stage [13]. In addition, fetal bovine serum is used to supplement DMEM medium; carbon dioxide is also fed at this stage. The next step is the infection and virus adaptation (stage 2); for this, the stream for the stage one and antibiotics enter. Seventy percent of the cells produced are infected. In the milling stage (stage 3), the virus is released through cell wall disruption. The mixture enters a centrifugation stage (stage 4) to remove cellular debris. The resulting stream is purified by using salts in the washing stage (stage 5), which are further removed in the microfiltration stage (stage 6), where bacteria and suspended solids also leave the process. Finally, in the formulation stage (stage 7), penicillin, salts, and adjuvants are added. The rate of production is 3643 t/y. Figure 1 shows influenza vaccine production.

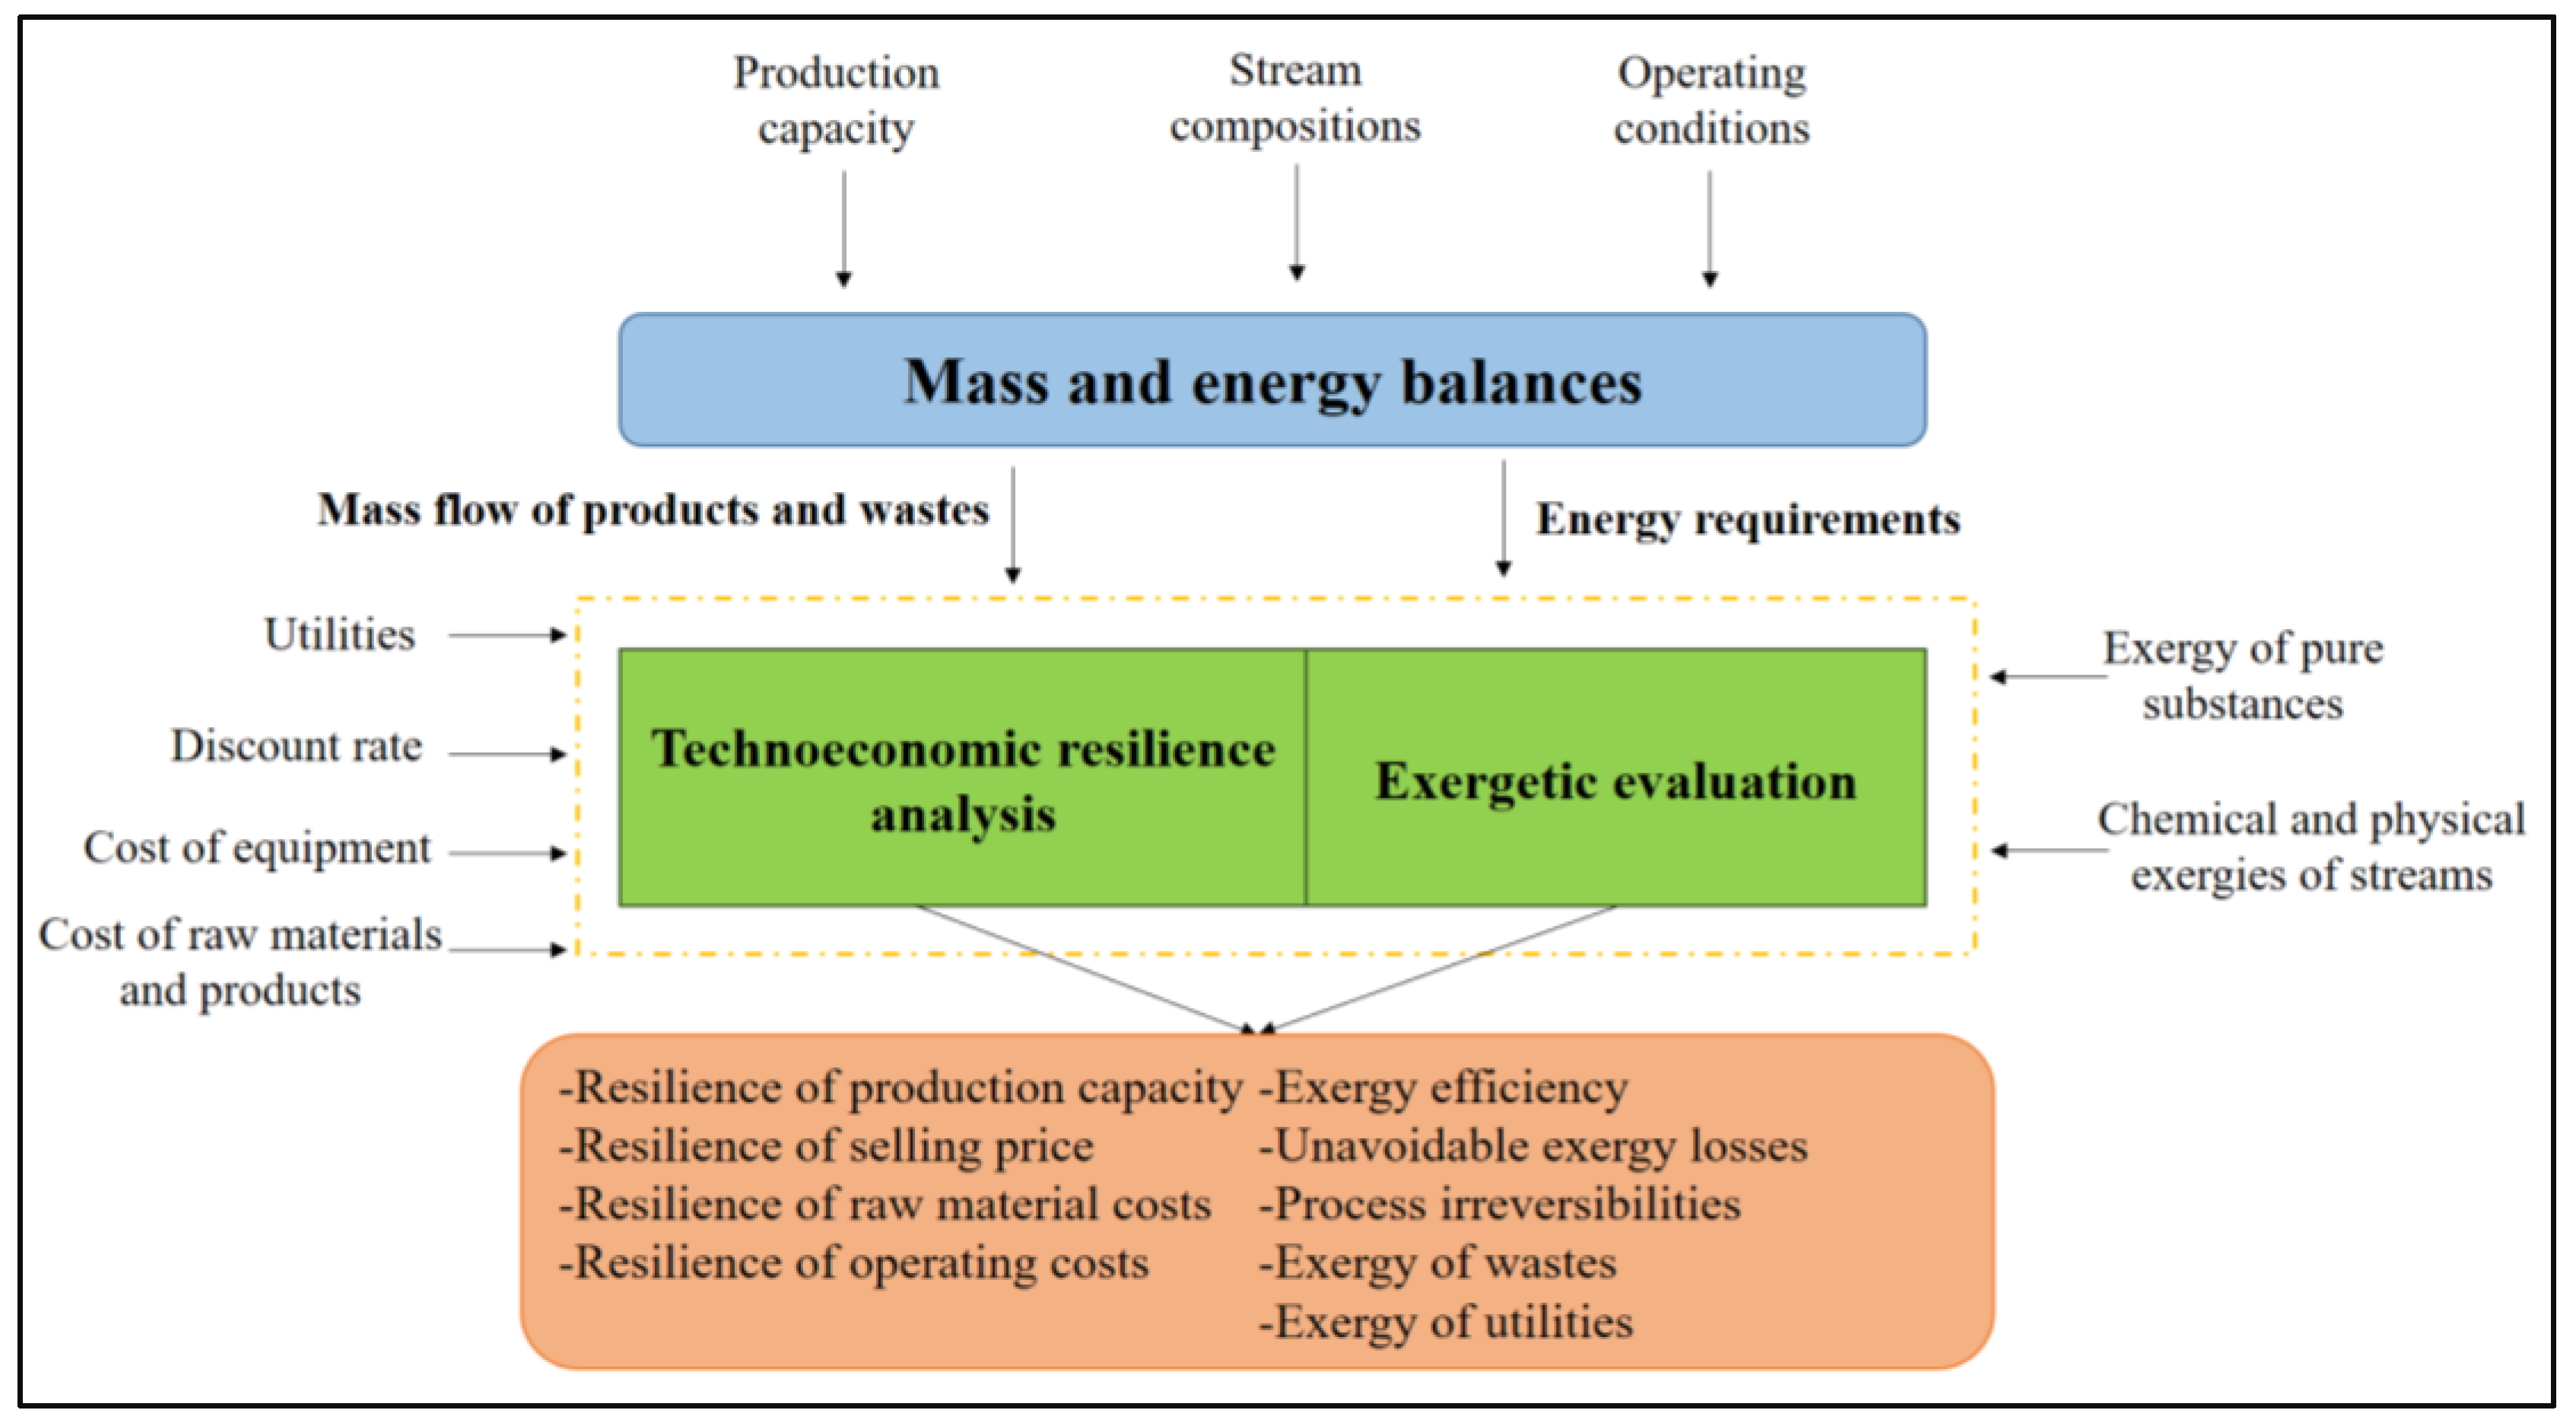
2.2. Technoeconomic Analysis

A technoeconomic resilience approach was proposed and performed to analyze the influence of certain variables such as the vaccine selling price, production capacity, raw materials cost, normalized variable operating costs on the economic indicators of the process as payback period, return on investment, net present value, and annual income. Table 1 presents the assumptions for performing the analysis. The total capital investment (TCI) was calculated using the values of the price of the equipment, land, piping, electrical installations, instrumentation, buildings, services facilities, yard improvements, engineering and supervision, construction expenses, legal expenses, contractors’ fee, contingency, working capital investment and start-up investment reported by Contreras et al. [9] using the methodology proposed by Peters et al. [14], as well as the total product cost (TPC). Besides, AFC is calculated using Equation (1), in which FCI0 corresponds to the initial value of the depreciable fixed capital investment (FCI), and FCIs to the salvage value of the FCI [15,16]. In Equation (2), represented by θ i , it is the ratio between the quantity of product i obtained per unit of raw material. The production capacity at the break-even point was calculated using Equation (3) [17,18], where FCH corresponds to fixed charges. The on-stream efficiency was then calculated using Equation (4) [16].
A F C = F C I 0 F C I s N
θ i = m R M m i
m R M B E P = A F C + F C H ( i C i v θ i ) N V O C
η O n s t r e a m B E P = m B E P m m a x  
D G P = i m i C i v T A C  
P A T = D G P ( 1 i t r )
C C F = i m i C i v A O C T C I
P B P = F C I P A T
% R O I = P A T T C I × 100
N P V = n A C F n ( 1 + i ) n
The economic indicators were estimated: gross profit (depreciation not included) (GP), gross profit (depreciation included) (DGP), profit after taxes (PAT), cumulative cash flow (CCF) (1/year), payback period (PBP), %ROI (return on investment), VPN (net present value) and annual cost/revenue, through Equations (5)–(10) [16,19]. Technoeconomic assumptions for the vaccine production plant show as Table 1.

2.3. Exergy Analysis

Exergy is defined as the maximum amount of work that a flow of energy can produce as it reaches a state of thermodynamic equilibrium with the common substances of the natural environment through reversible processes [20]. In the exergetic balance, the exergy flows leaving the system can be divided into two types: useful exergy flows and residual exergy flows; for this steady-state balance. Equation (11) [21] relates the exergy destroyed to the net exergies by mass, work, and heat transfer. The exergy by work is defined by Equation (12), where W corresponds to the work of the system.
E x d e s t r o y e d = E x M a s s + E x h e a t + E x w o r k
E x w o r k = W
Exergy by mass can be calculated through Equation (13) without taking into account electrical, magnetic, nuclear, and surface tension effects. Kinetic and potential energy was also not considered due its the low contribution to exergy. Standard chemical exergy of the substances can be calculated using Equation (14) [22]; however, these can be found in the literature. The chemical and physical exergy of a mixture can be defined by Equations (15) and (16) [23], respectively.
E x m a s s = E x p h y s i c a l + E x c h e m i c a l + E x p o t e n t i a l + E x k i n e t i c  
E x c h e m i c a l = Δ G f ° + j v j E x c h e m i c a l j °
E x c h e m i c a l ,   m i x = i y i E x c h e m i c a l i + R T o   i y i ln ( y i )
E x p h y s i c a l ,   m i x = C p [ ( T T 0 ) T 0 ln T T 0 ] v m ( P P o )
where Δ G f ° corresponds to the Gibbs free energy of the formation of a component, v j indicates the number of atoms of elements j. The molar fraction is y i , R in the universal constant of gases. T and P represent the temperature and pressure, respectively. Finally, T 0 and P o are the temperature and pressure at the reference state, v m corresponds to the molar volume of the stream and C p represents the heat capacity at constant pressure. The total input mass exergy, output mass exergy, and destroyed mass exergy are defined by Equations (17)–(19), respectively. The unavoidable exergy losses are defined as the irreversibilities due to the increase in entropy; these can be calculated using Equation (20) [24]. Finally, the exergy efficiency is defined by Equation (21).
E x t o t a l ,   i n = E x m a s s , i n + E x u t i l i t i e s  
E x m a s s ,   o u t = E x p r o d u c t s + E x w a s t e
E x d e s t r o y e d = E x t o t a l , i n E x p r o d u c t s
E x u n a v o i d a b l e = E x m a s s ,   i n E x m a s s ,   o u t    
η e x e r g y = 1 ( E x d e s t r o y e d E x t o t a l ,   i n   )
The chemical exergies of the substances were found in the literature reported by [25] and [26]. The chemical and physical exergy associated with the influenza virus were calculated using Equations (14) and (16), respectively, based on the data reported by [27]. The chemical exergies of the streams were calculated using Equation (15).
Figure 2 shows a schematic representation of the methodology developed in this study where it can be seen that the material and energy balances feed both the evaluation of the technical-economic resilience and the exergetic analysis, and these assessments in turn allow us to obtain the evaluation parameters of the vaccine production plant in north-east Colombia.

3. Results and Discussion

The energy and technical-economic resilience assessments were developed taking into account the operating conditions and economic indicators for the year 2021. The exclusive parameters for the technical-economic evaluation and exclusive parameters for the exergy evaluation allowed us to generate technical-economic resilience and exergy evaluation results regardless of their previous exclusivity as independent variables for the studies; for example, the utilities required for the economic evaluation also allow exergy evaluation of the process. The results are shown below.

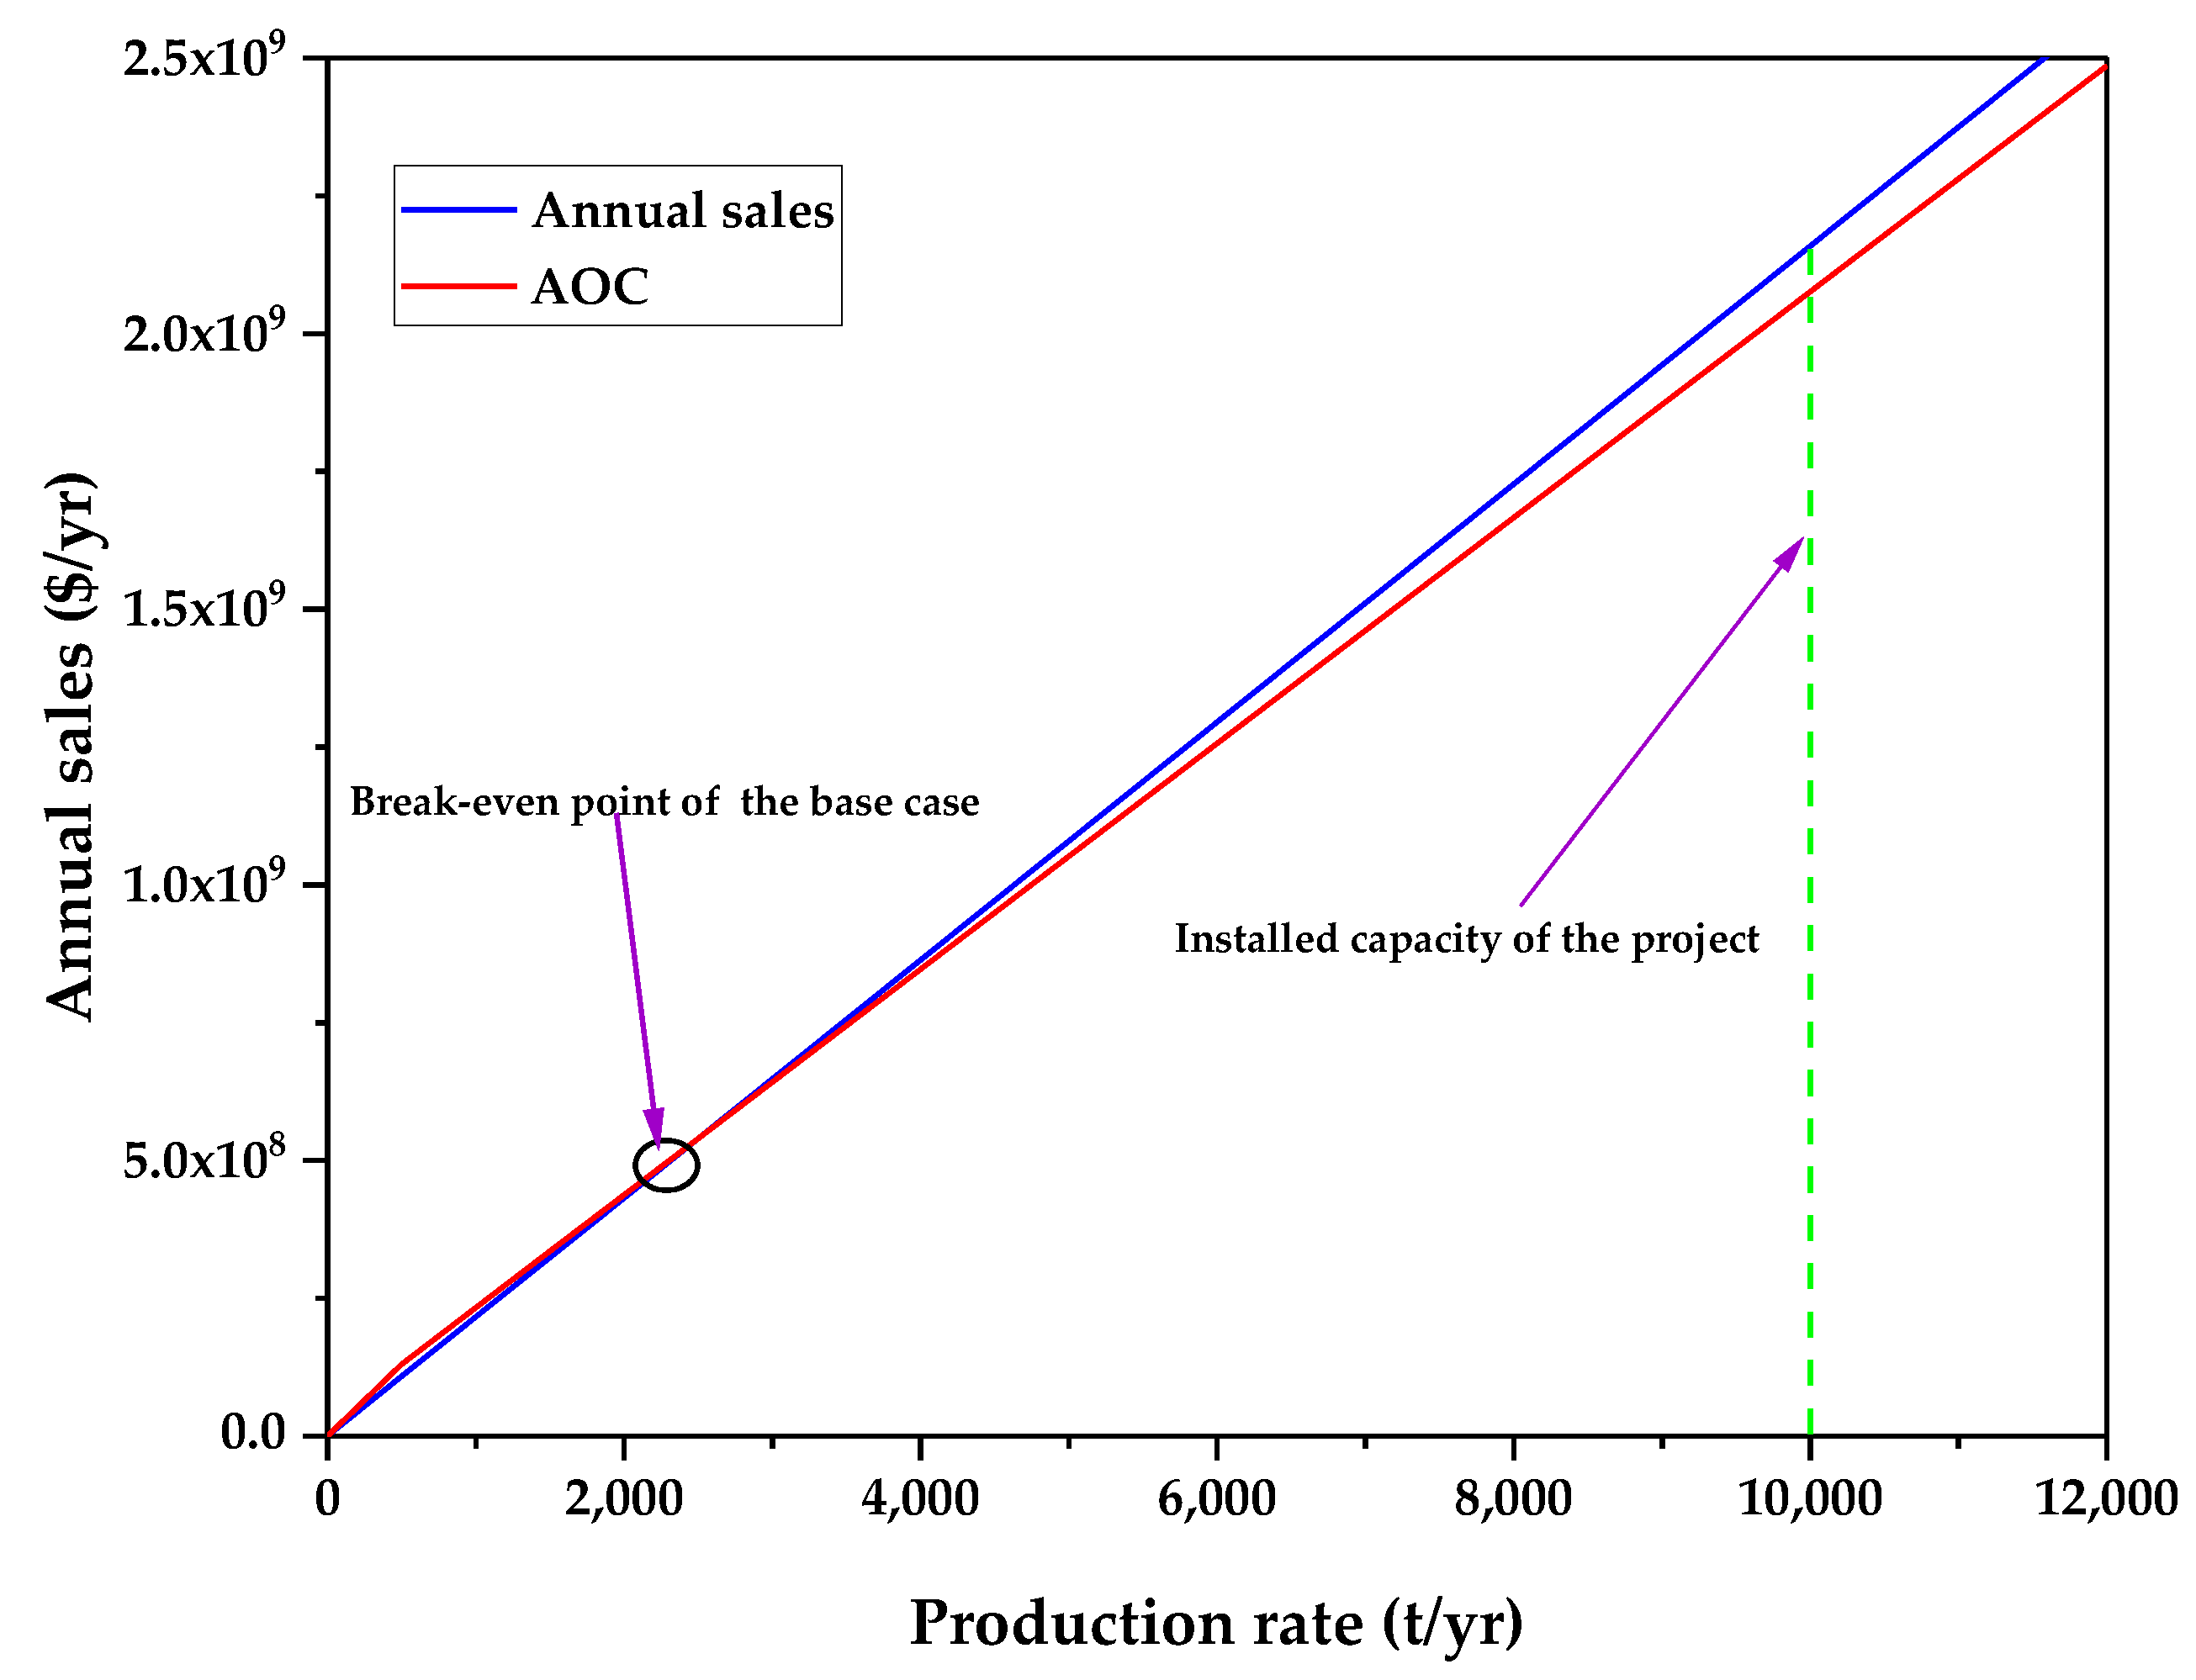
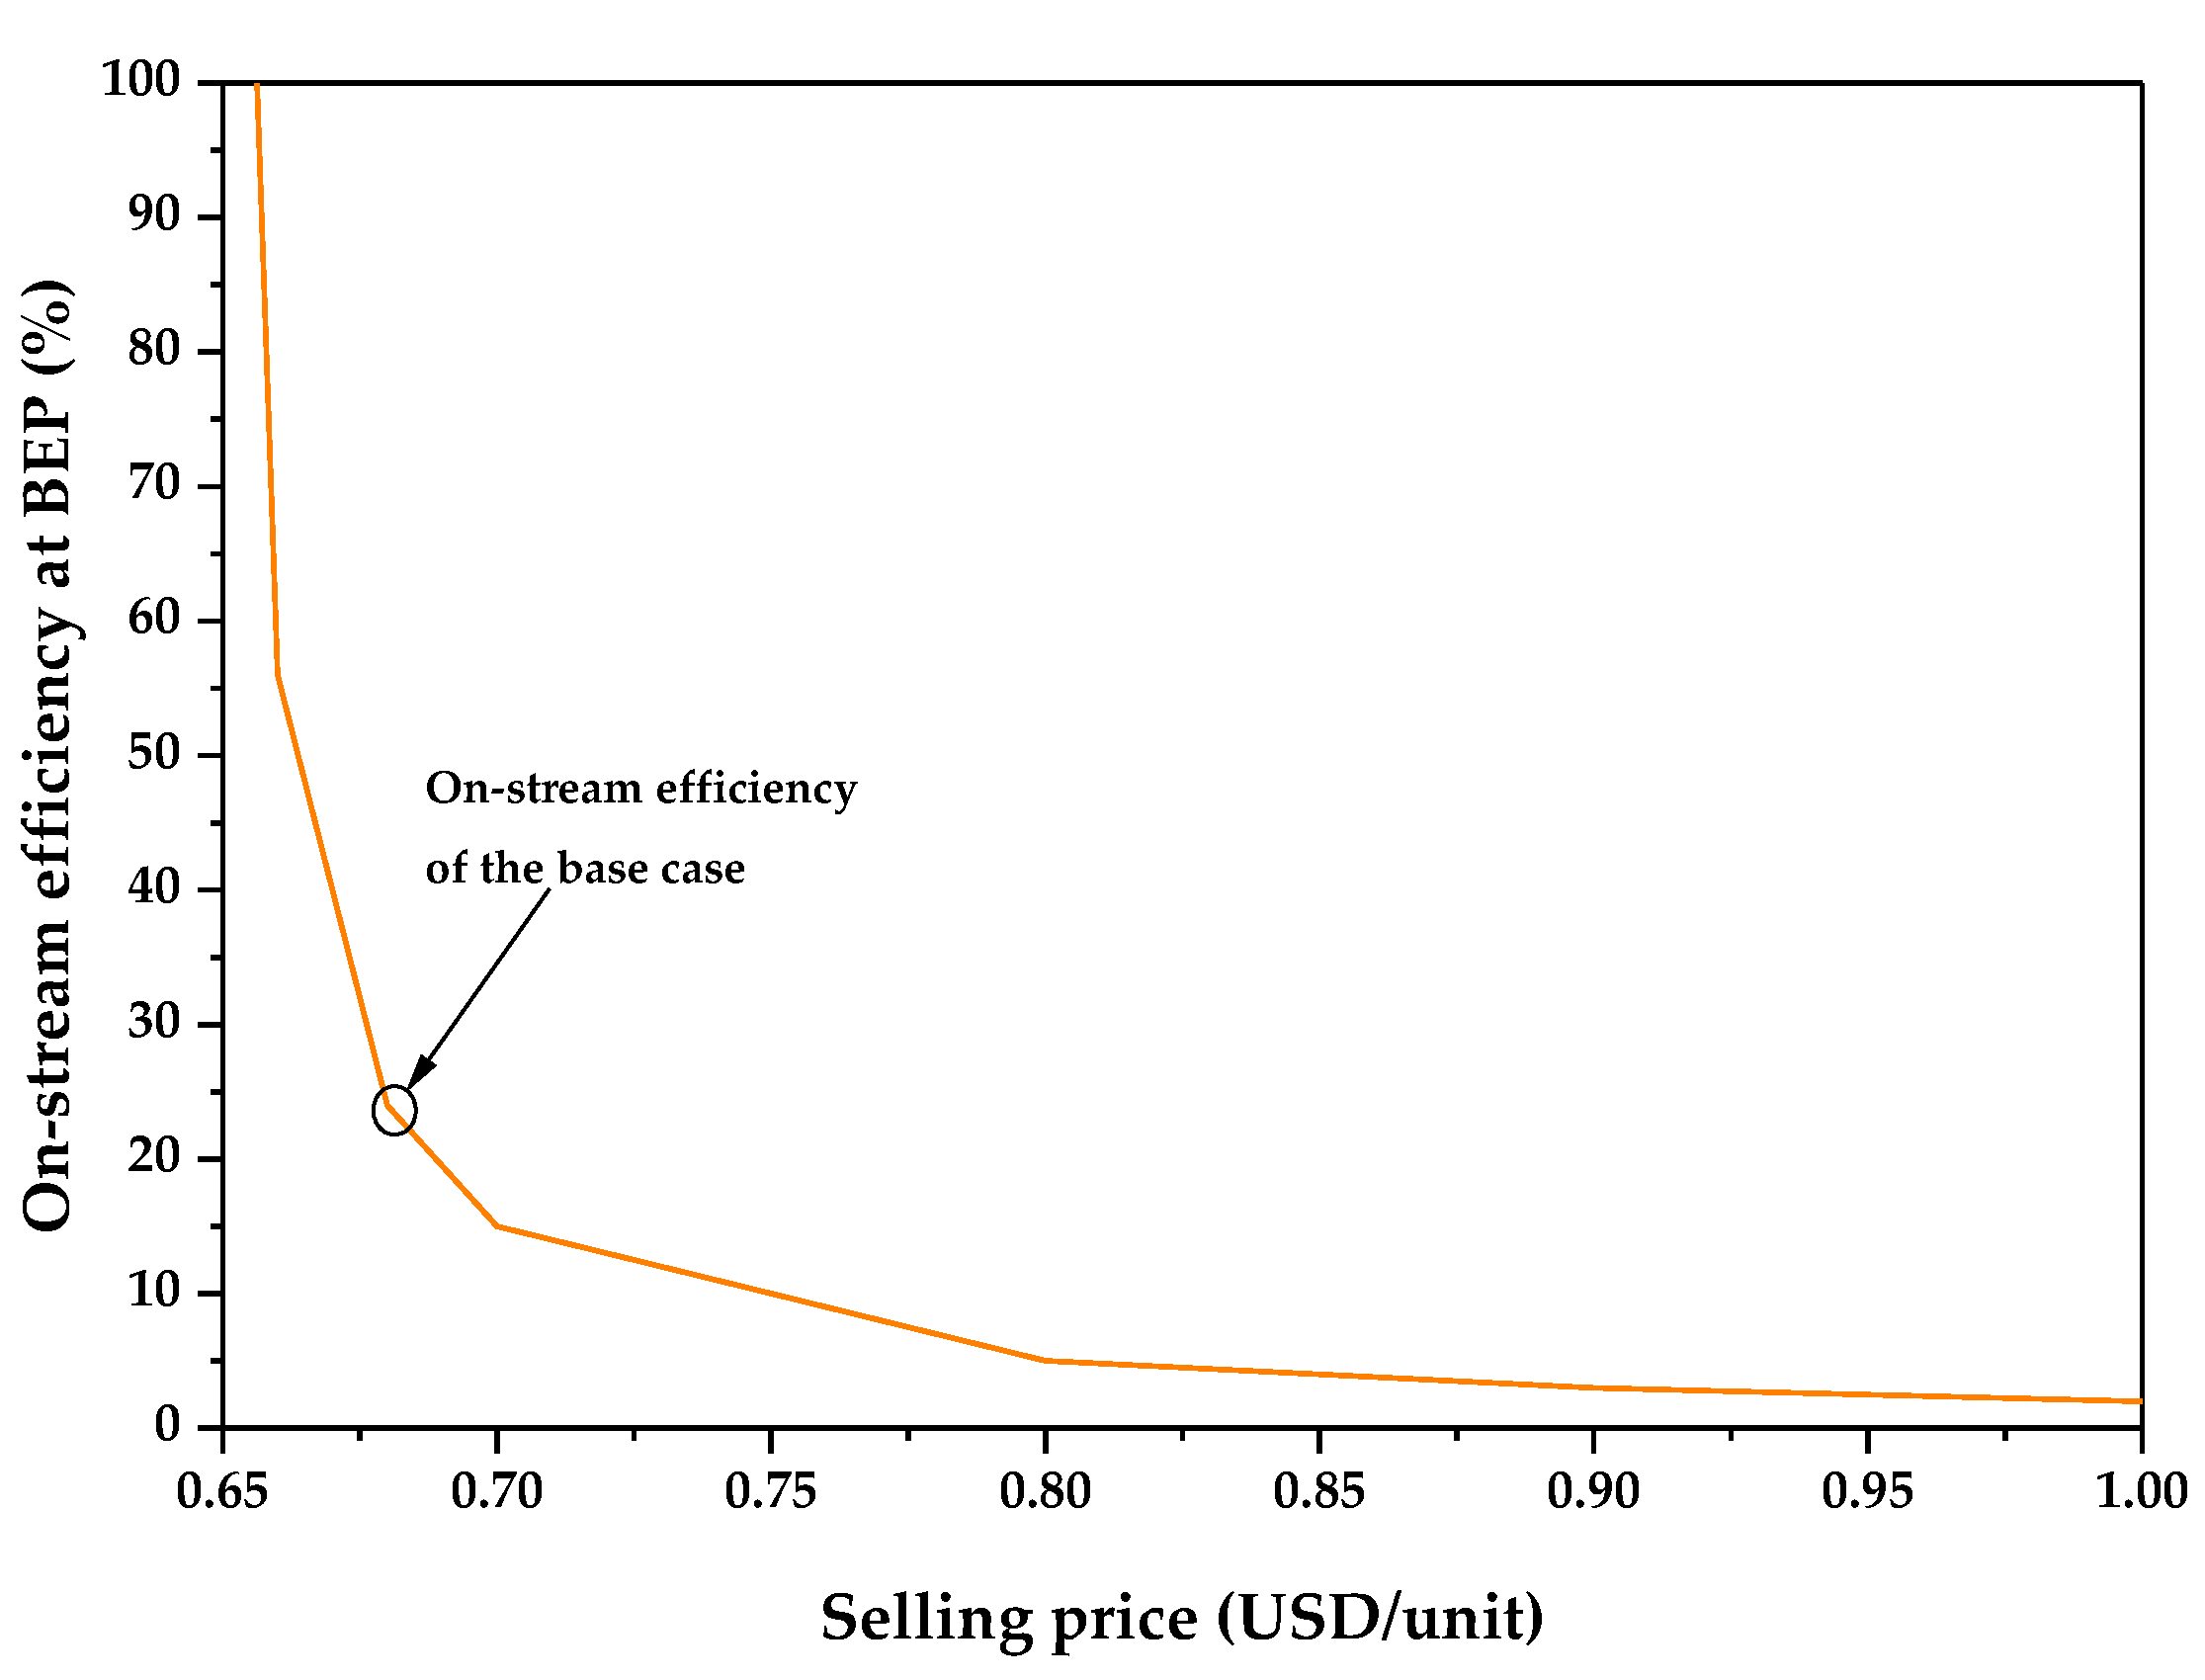
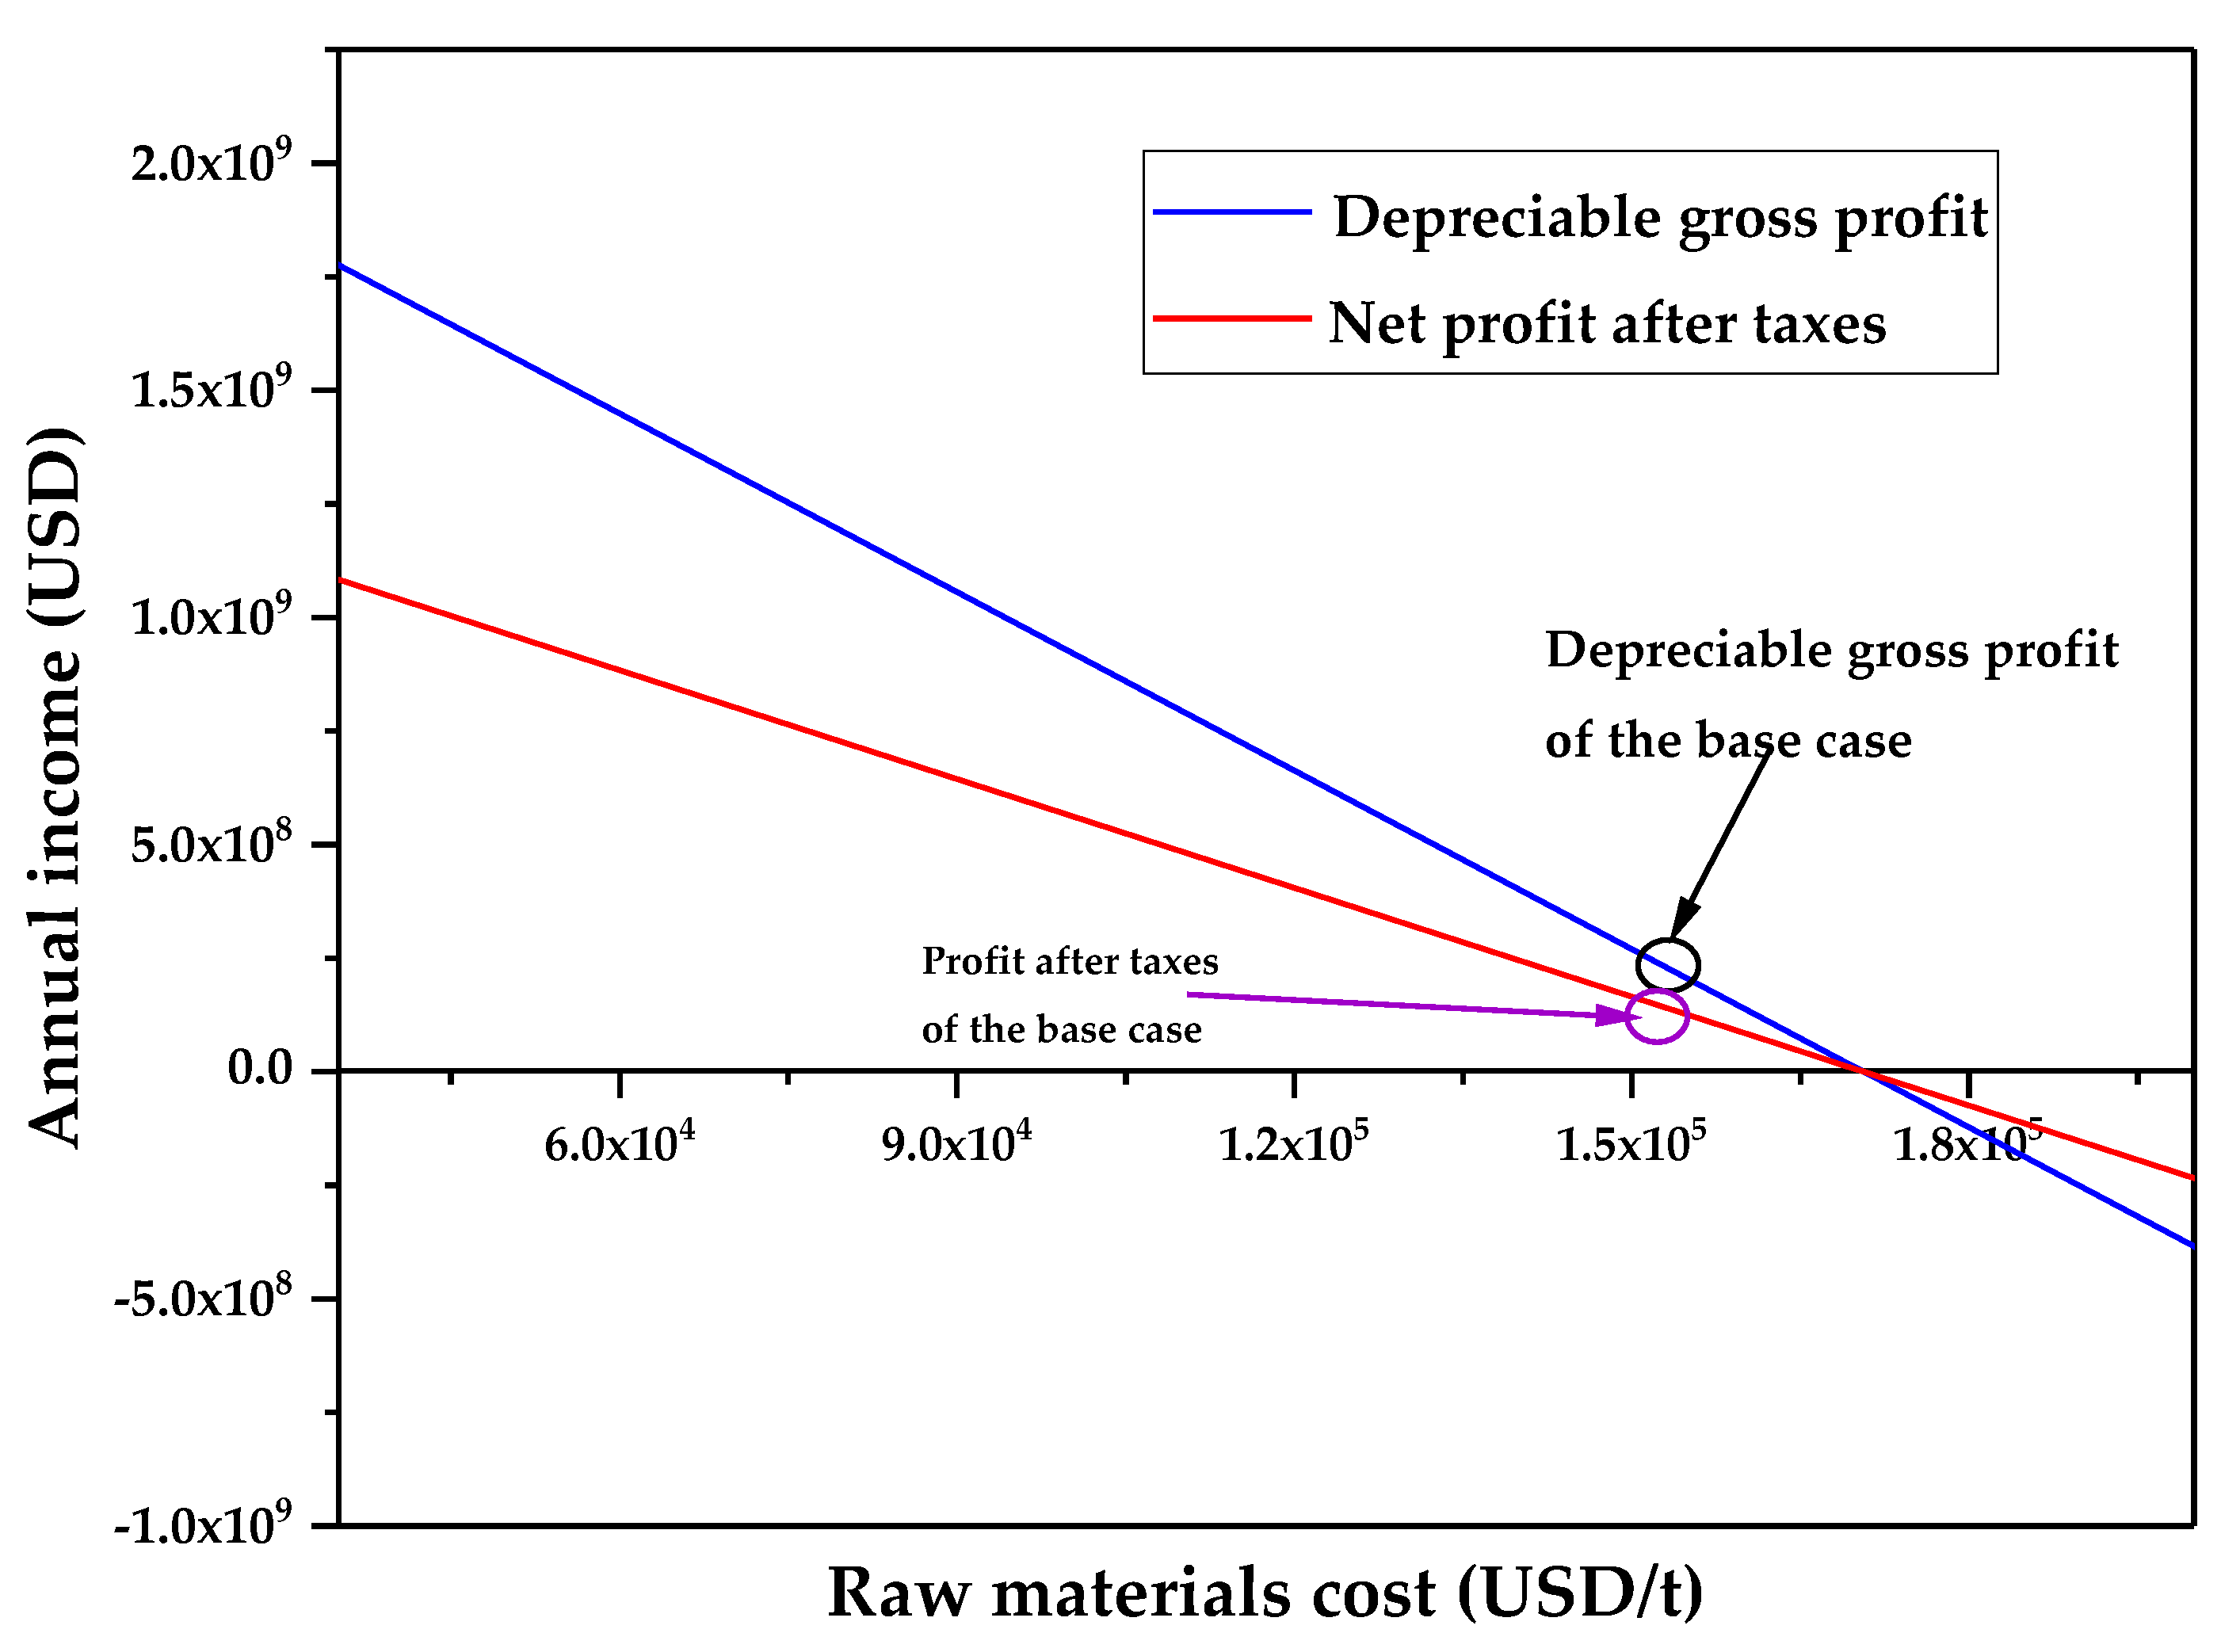
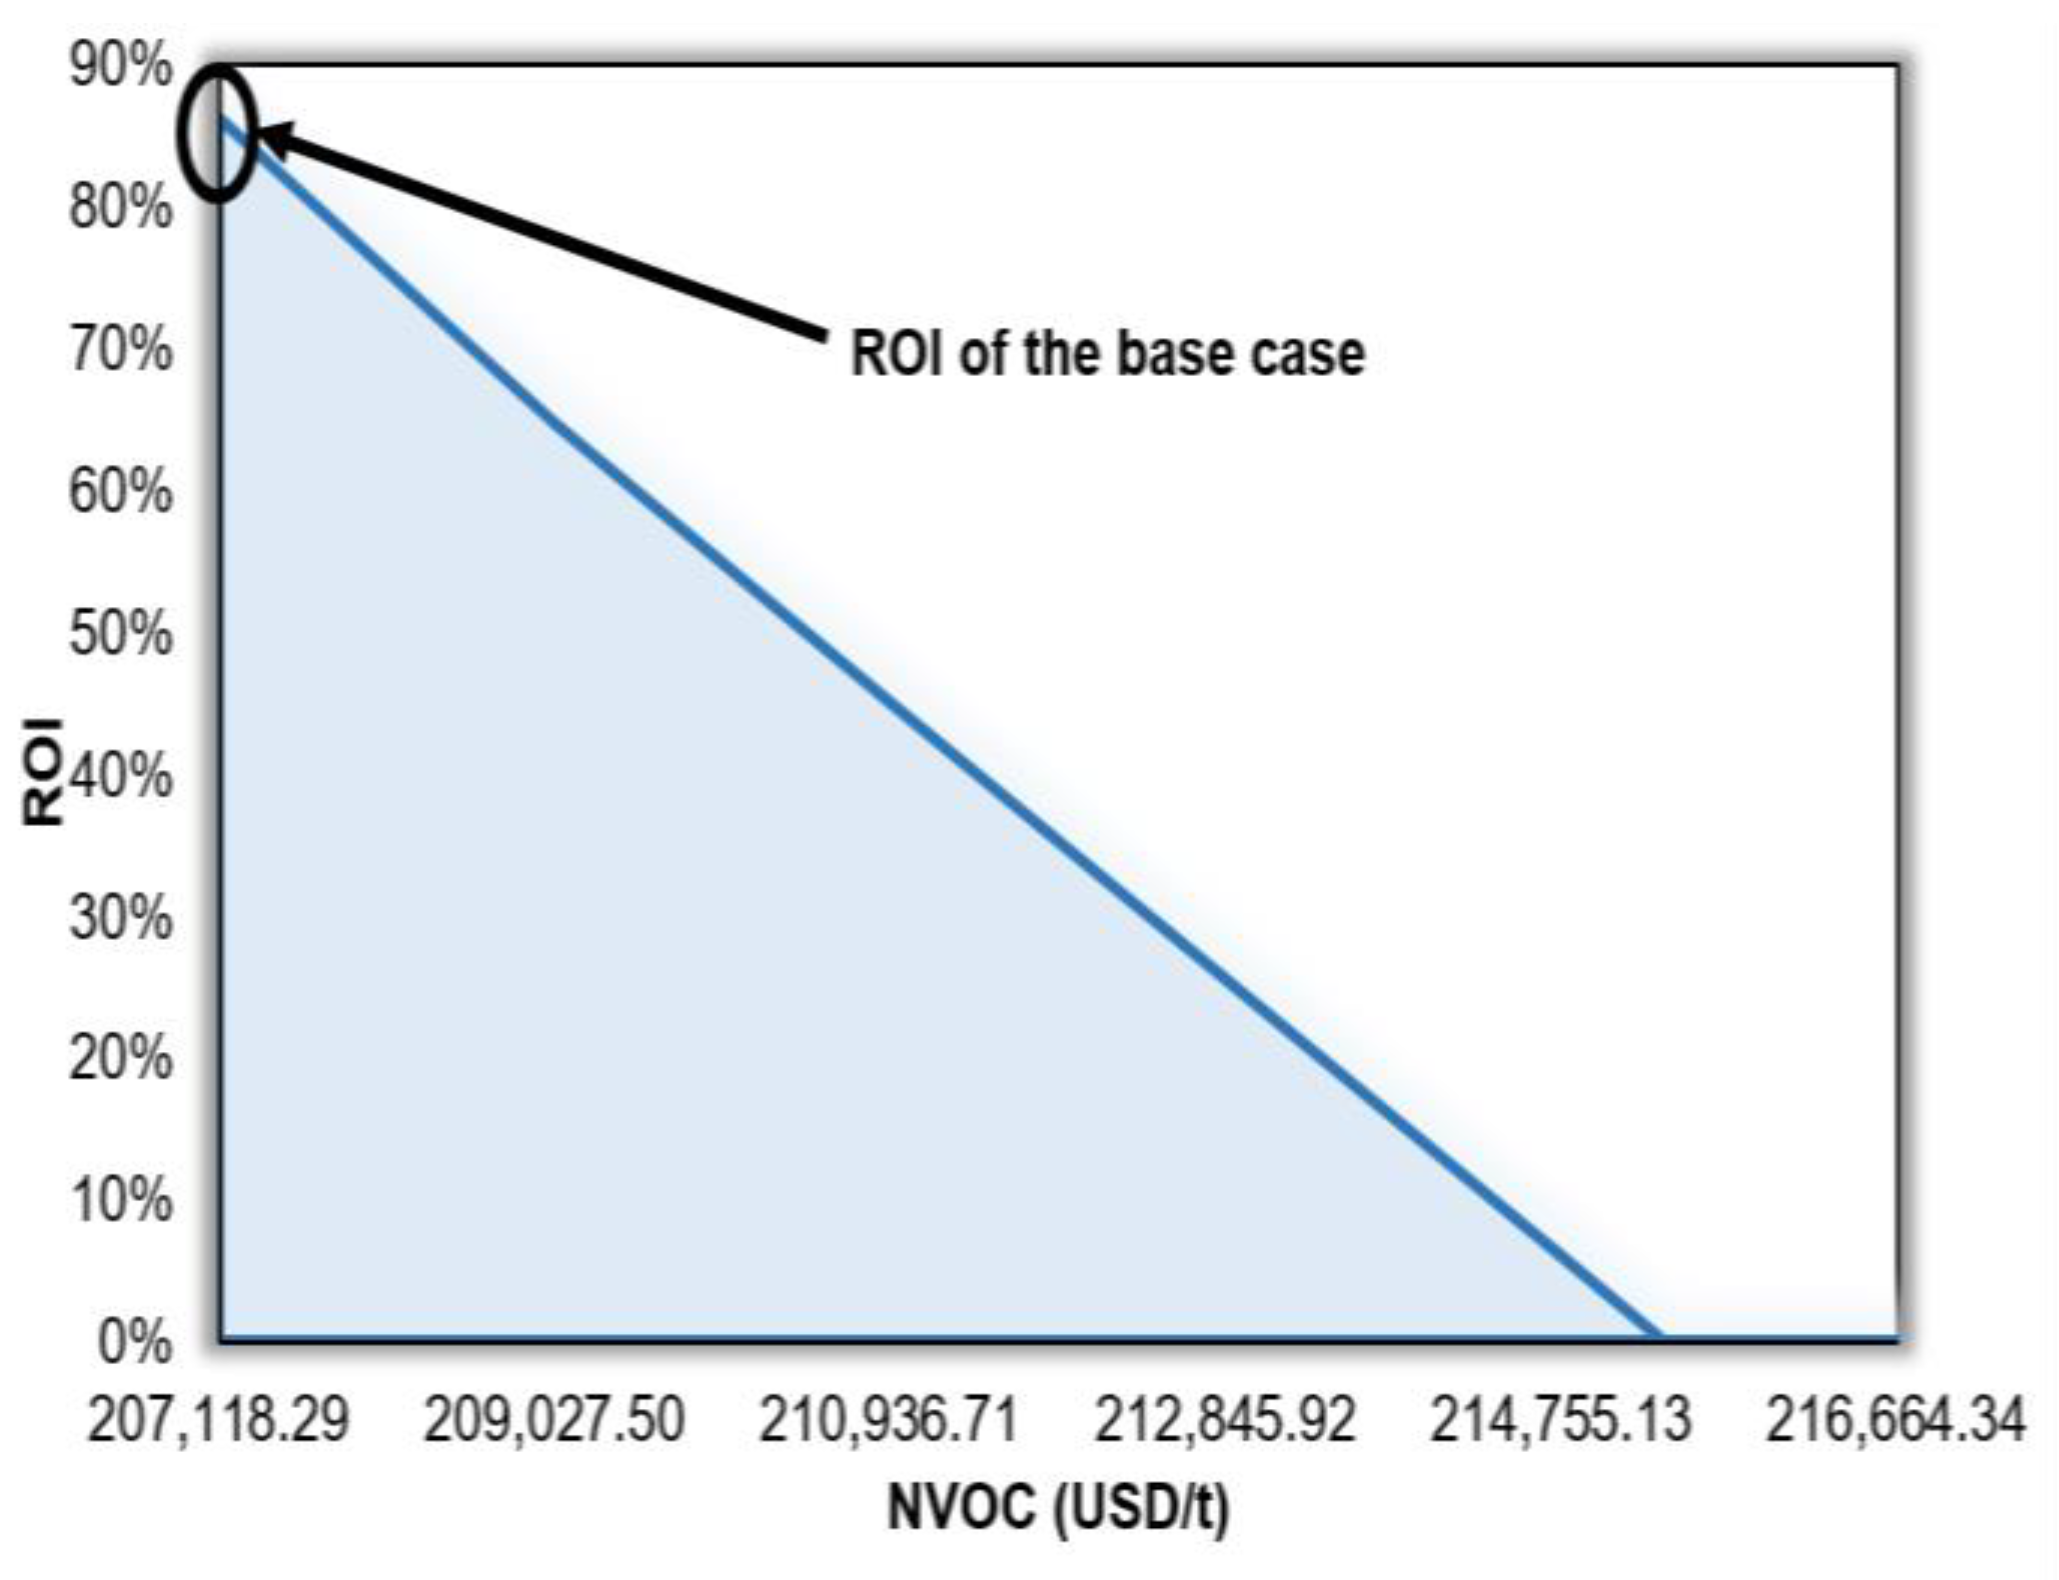
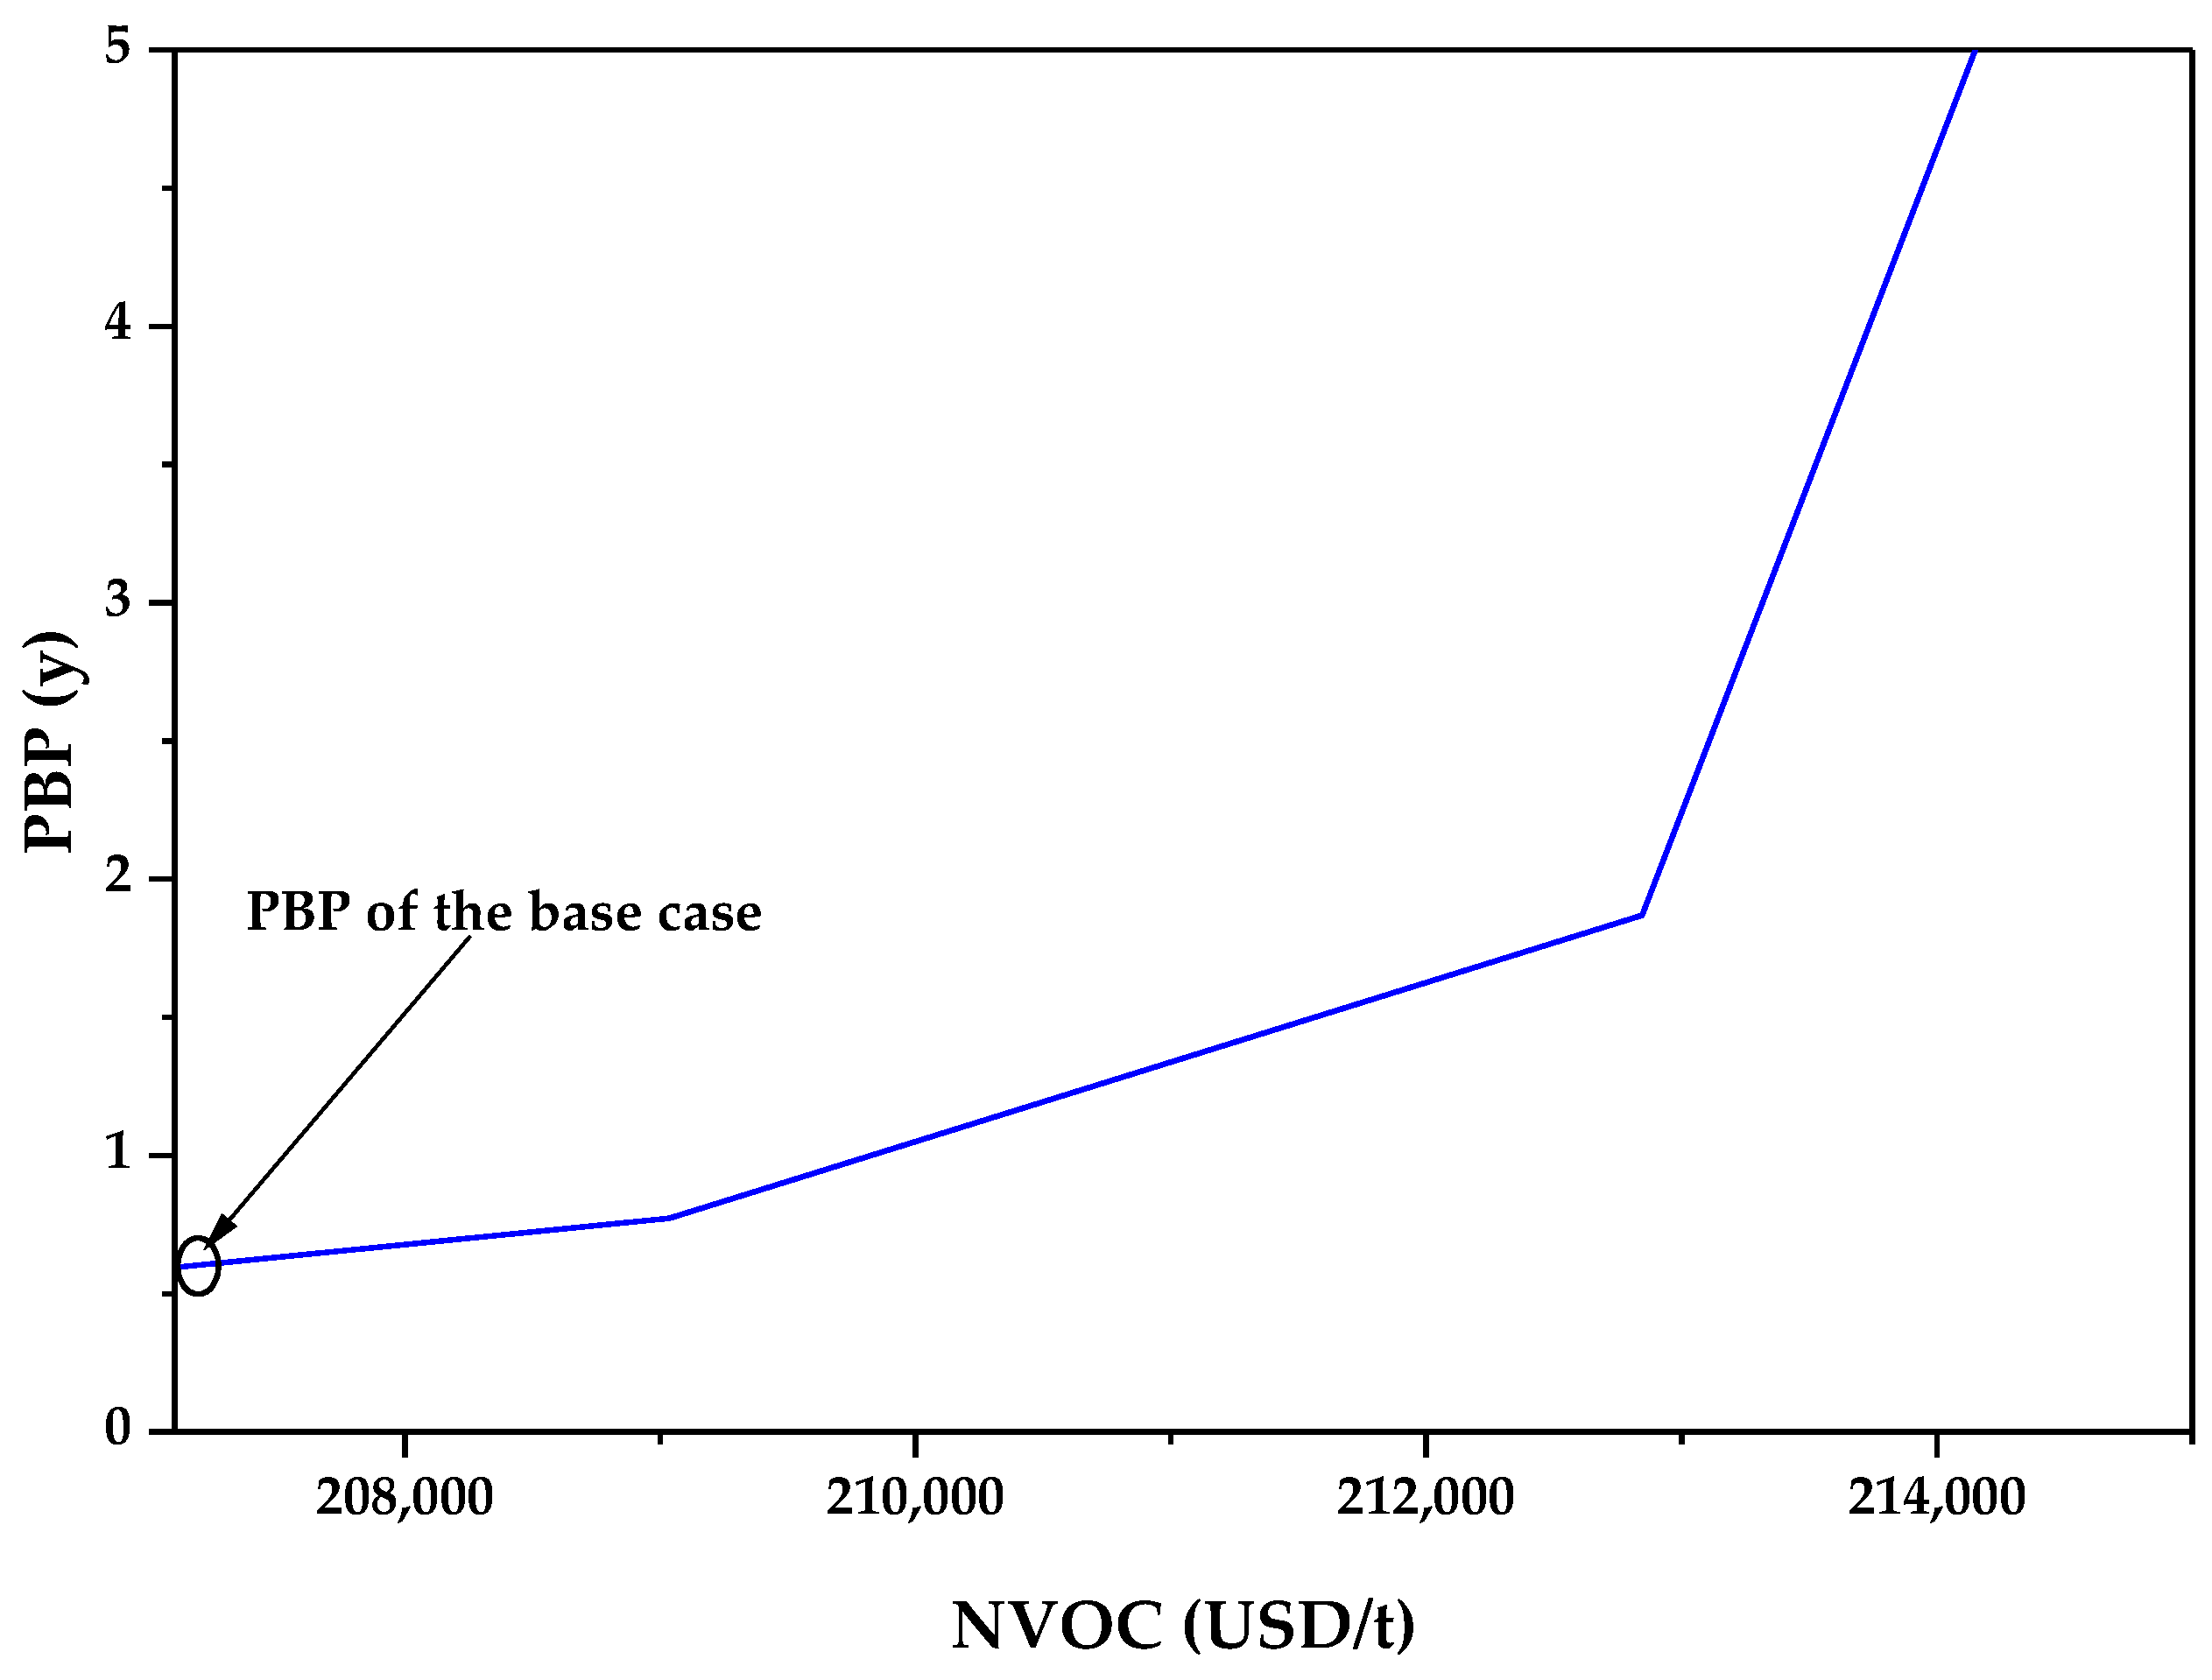
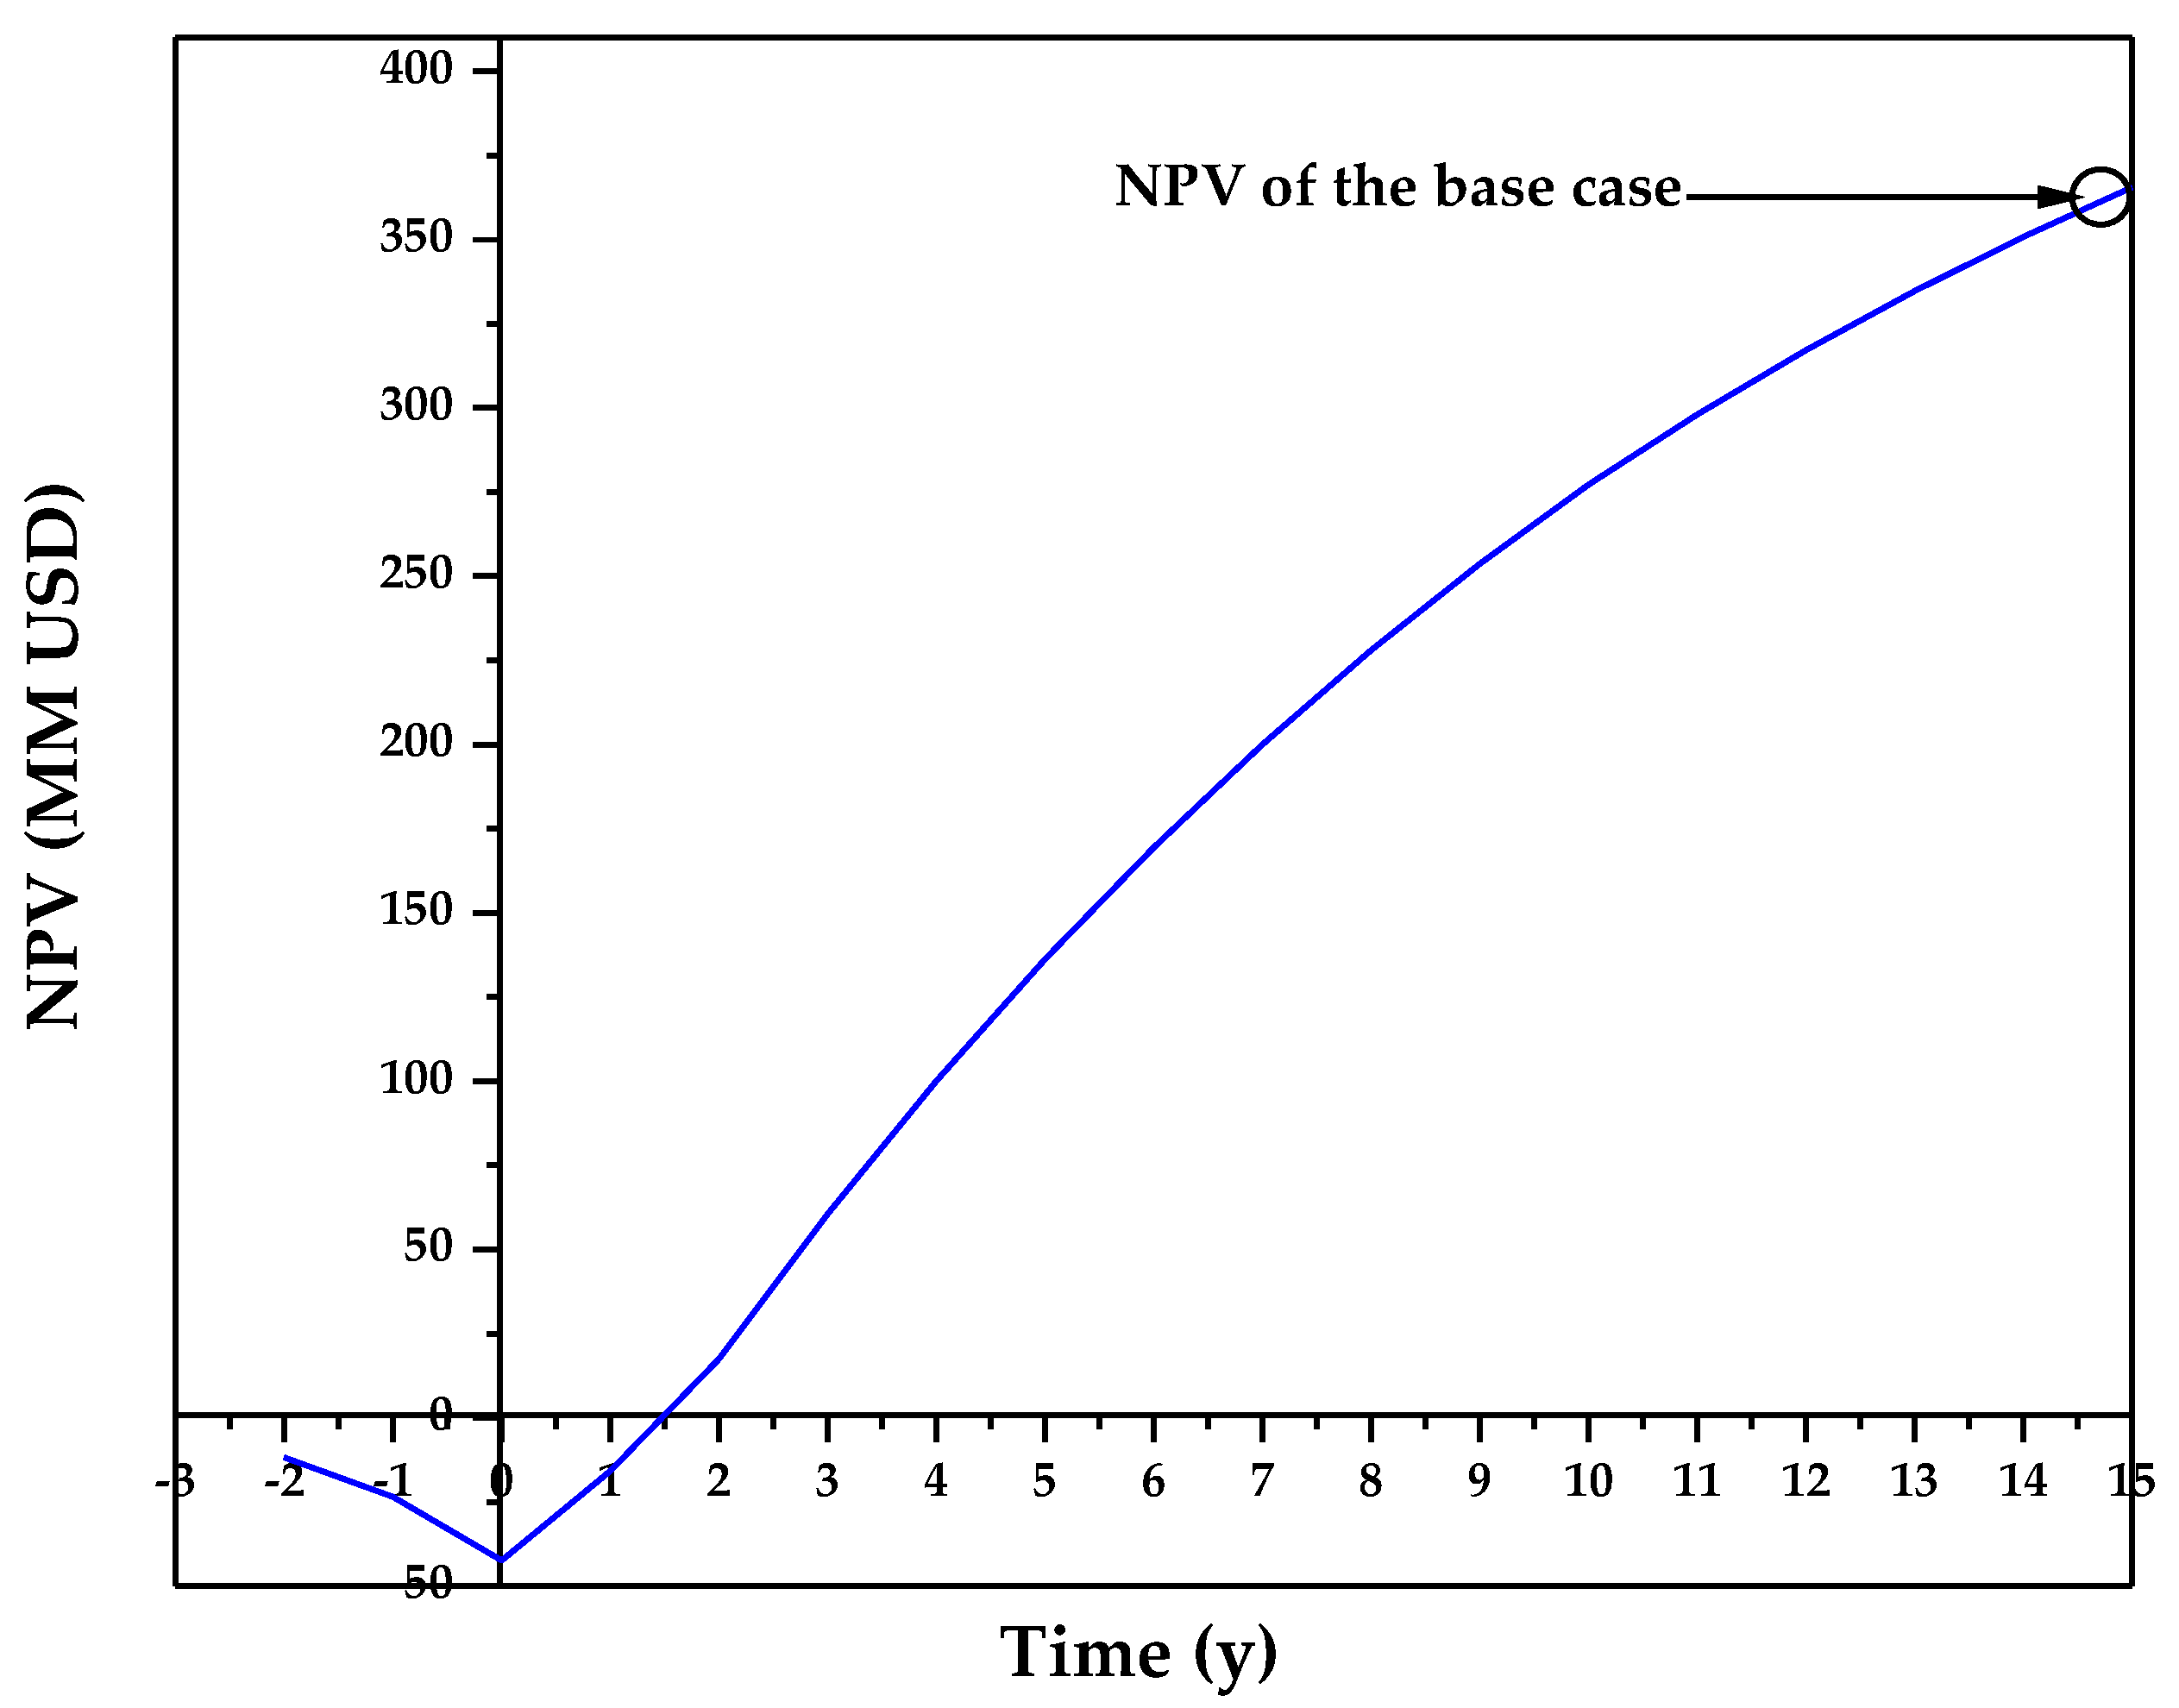
3.1. Technoeconomic Resilience Evaluation

Table 2 shows the total investment capital of the plant and the contribution of the fixed investment capital, which constitute approximately 53% of the total investment capital. This value is high compared to decentralized biomass processing depots [28] because the cost of the equipment is higher in the vaccine production plant.
Table 3 shows the contribution of each item to the total product cost of the vaccine production, with the cost of raw material being the item that contributes the most (more than 70%).
The economic indicators are shown in Table 4. This is a good indicator because it is possible to recover the investment quickly, reducing the chances that a stoppage of the project will prevent the recovery of the investment.
Figure 3 shows the break-even analysis of the process. Vaccine production shows itself to be feasible for the production capacity chosen, because annual sales are higher than annual operational costs. On the other hand, studies have reported companies to have 800 h per year of unplanned downtime, which can be caused by delaying materials, machine breakdown, or failures [29]. As a consequence, production capacity may be reduced. To guarantee the plant’s profitability when this problem occurs, it is vital to have a production capacity far from production capacity at the break-even point.
The interception between the two lines (red and blue) shows the production capacity at the break-even point of vaccine production. This value is precisely 2503.15 t/y, which only represents 24% of the plant’s production capacity. Figure 4 shows the effect of the selling price of the vaccines on the on-stream efficiency. Three regions can be identified in the figure. The first comprised between USD 0.65/unit and USD 0.7/unit, the second between USD 0.7/unit and USD 0.9/unit, and the third includes a selling price higher than USD 0.9/unit. Minor variations in the selling price cause significant changes in on-stream efficiency in the first region, considerable variations in the selling price generate small changes in on-stream efficiency in the second region, and on-stream efficiency is unaffected by variations in the selling price in the third zone. The set selling price is in the first region that occurs if the selling price decreases, onstream efficiency increases, and approaches 100%, or maximum capacity, which is inconvenient.
Figure 5 shows the resilience of the profitability based on raw material costs. It can be observed that when the cost of raw material increases approximately to 170,000 USD/t, it has negative profits; that is, it generates losses, which allows us to conclude that the process is not very resistant to increases in raw material costs. The process is not very immune to increases in raw material costs, resisting only a 4% rise, compared to the production of agar from red algae, which resists up to a 100% increase in the price of raw material [30].
Figure 6 shows the resilience of return on investment (ROI) based on normalized variable operating costs (NVOC) of the vaccine production process. A critical point can be observed in the normalized variable operational costs when they have a value of approximately 215,500 USD/t since, from this point, there is no return on investment. This value establishes that the maximum elongation that the NVOC could have for the process to have a return on investment must be less than 4%.
The effect of normalized variable operating costs on the payback period is shown in Figure 7. A critical point may be located, which divides the graph into two regions (213,000 USD). Modest variations in the PBP are caused by significant changes in the NVOC at less than the critical point, whereas small rises in NVOC values that are more than the critical point can cause the PBP to rise for years. This process’s normalized variable operating costs could increase to 2% without exceeding the critical threshold.
Figure 8 shows the cash flow diagram of the process. From the first year, positive values are presented, which is beneficial because, from this period, the investment made is recovered, taking into account the value of money over time.

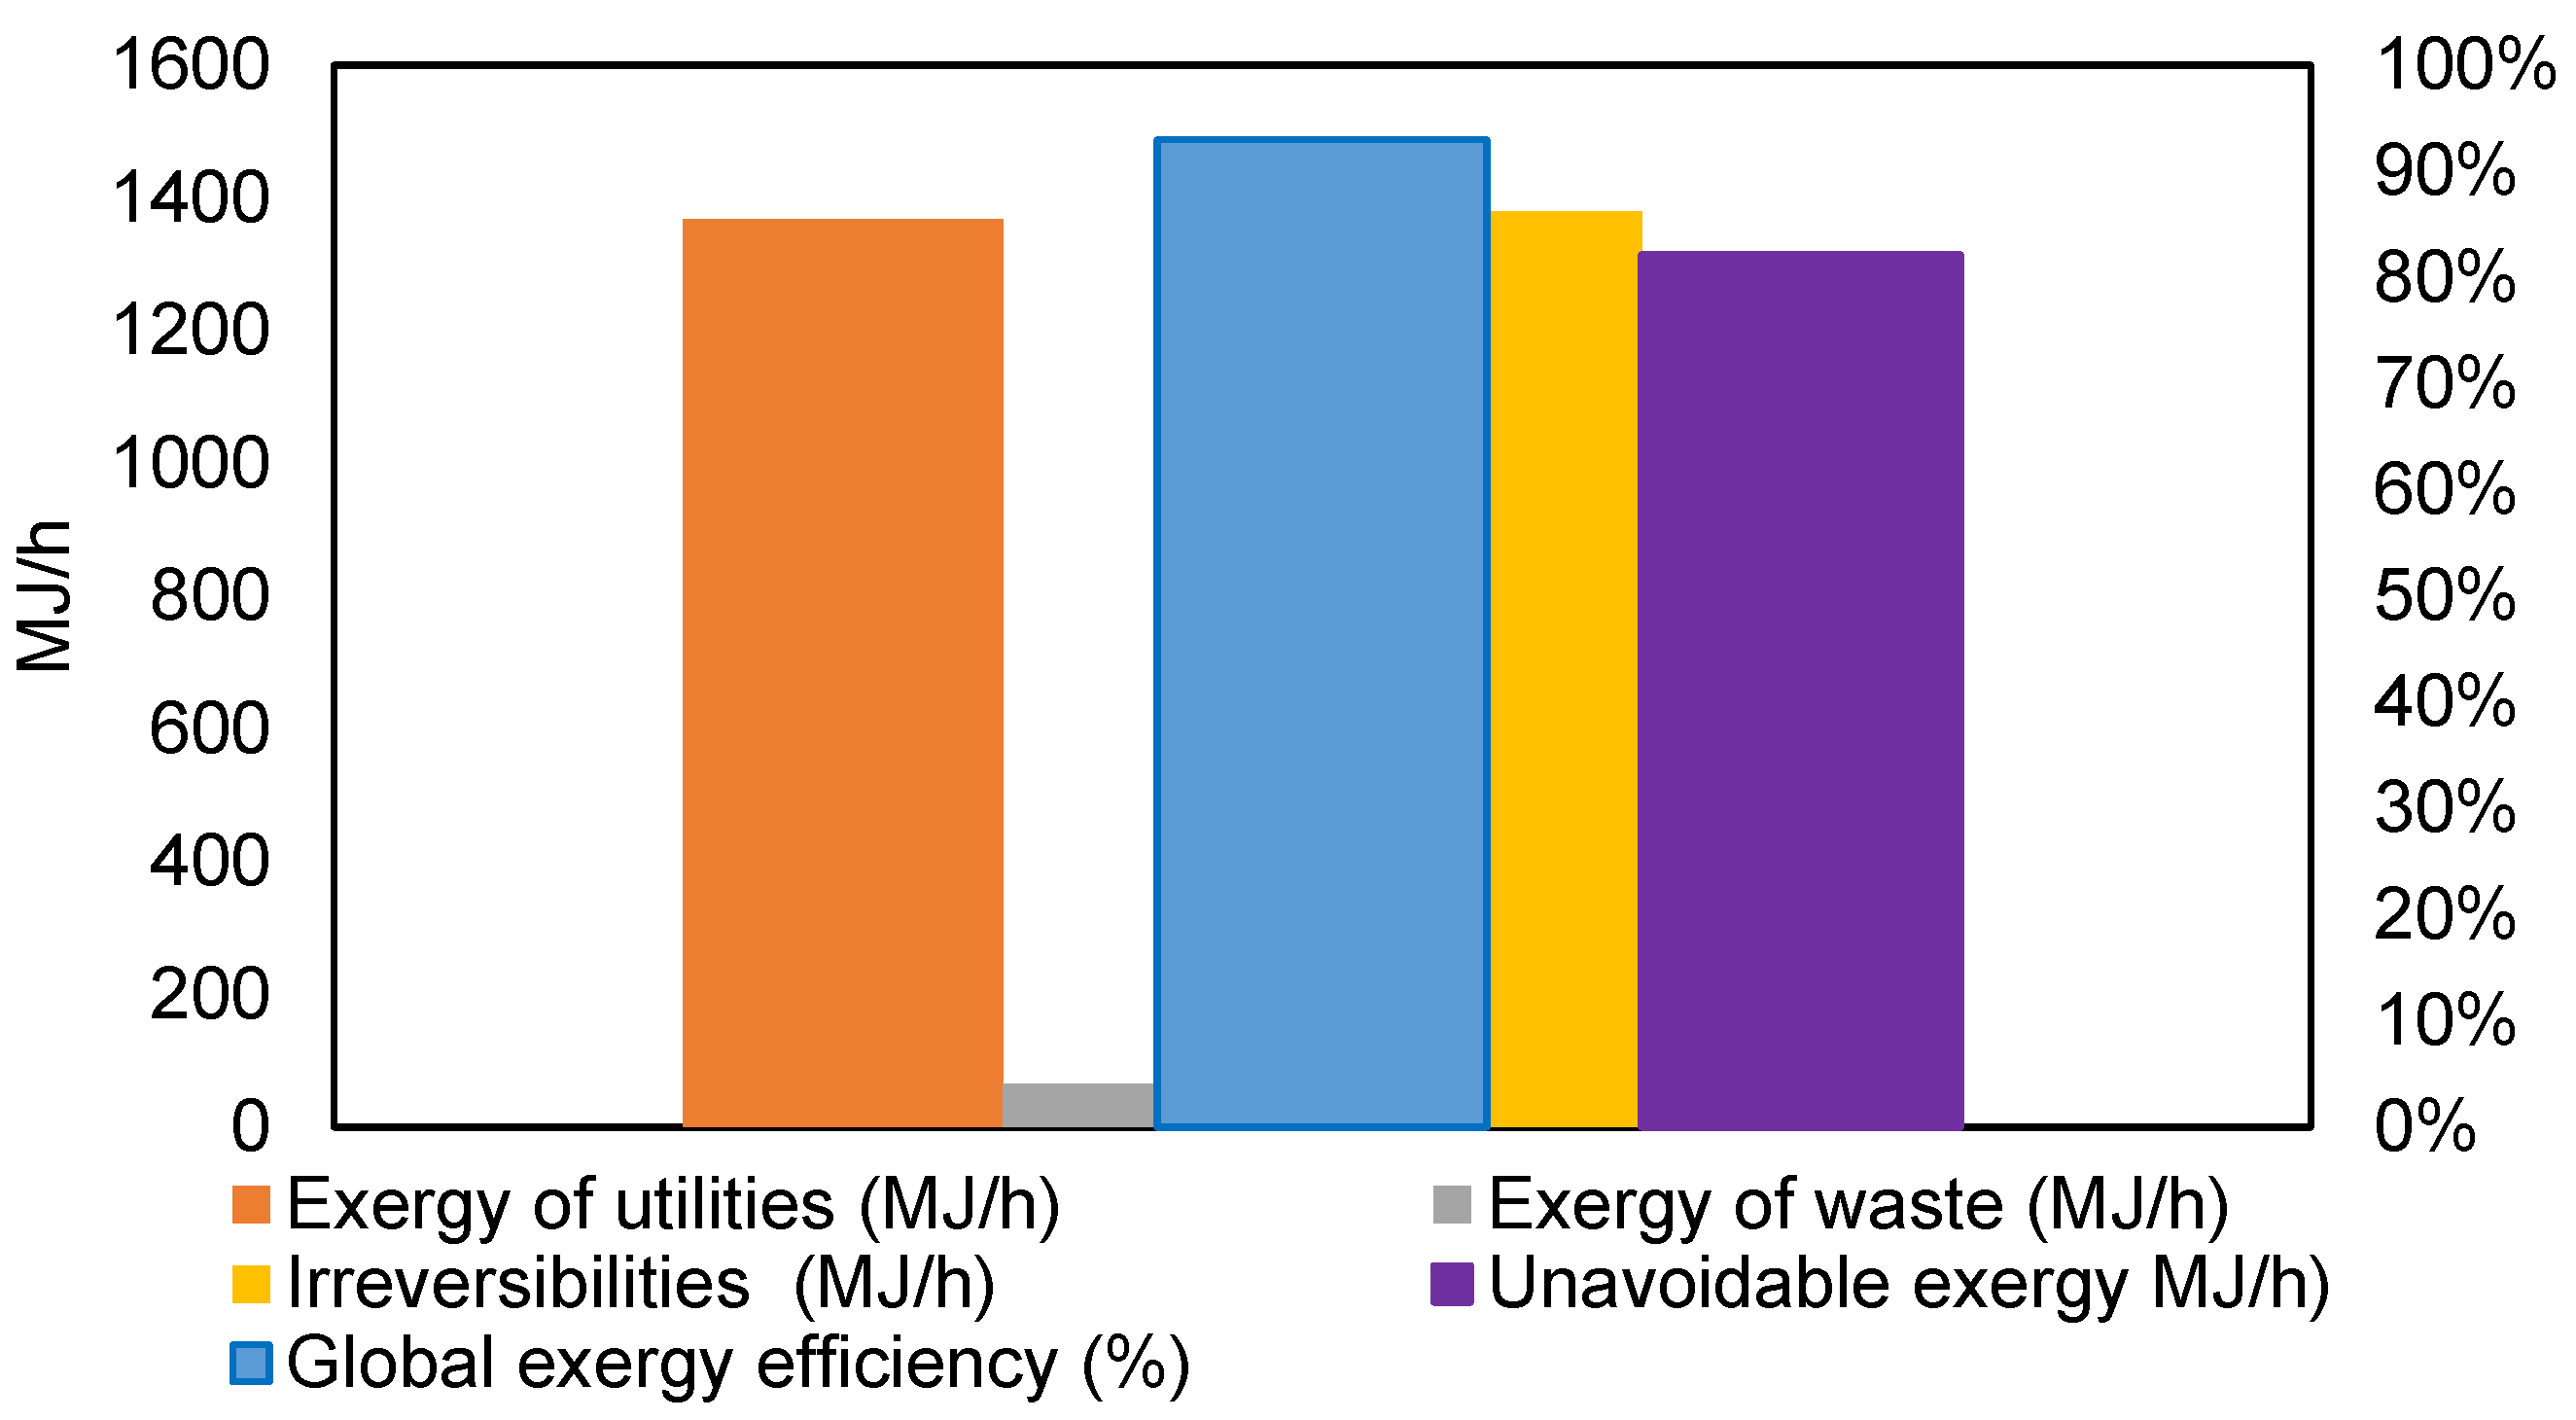
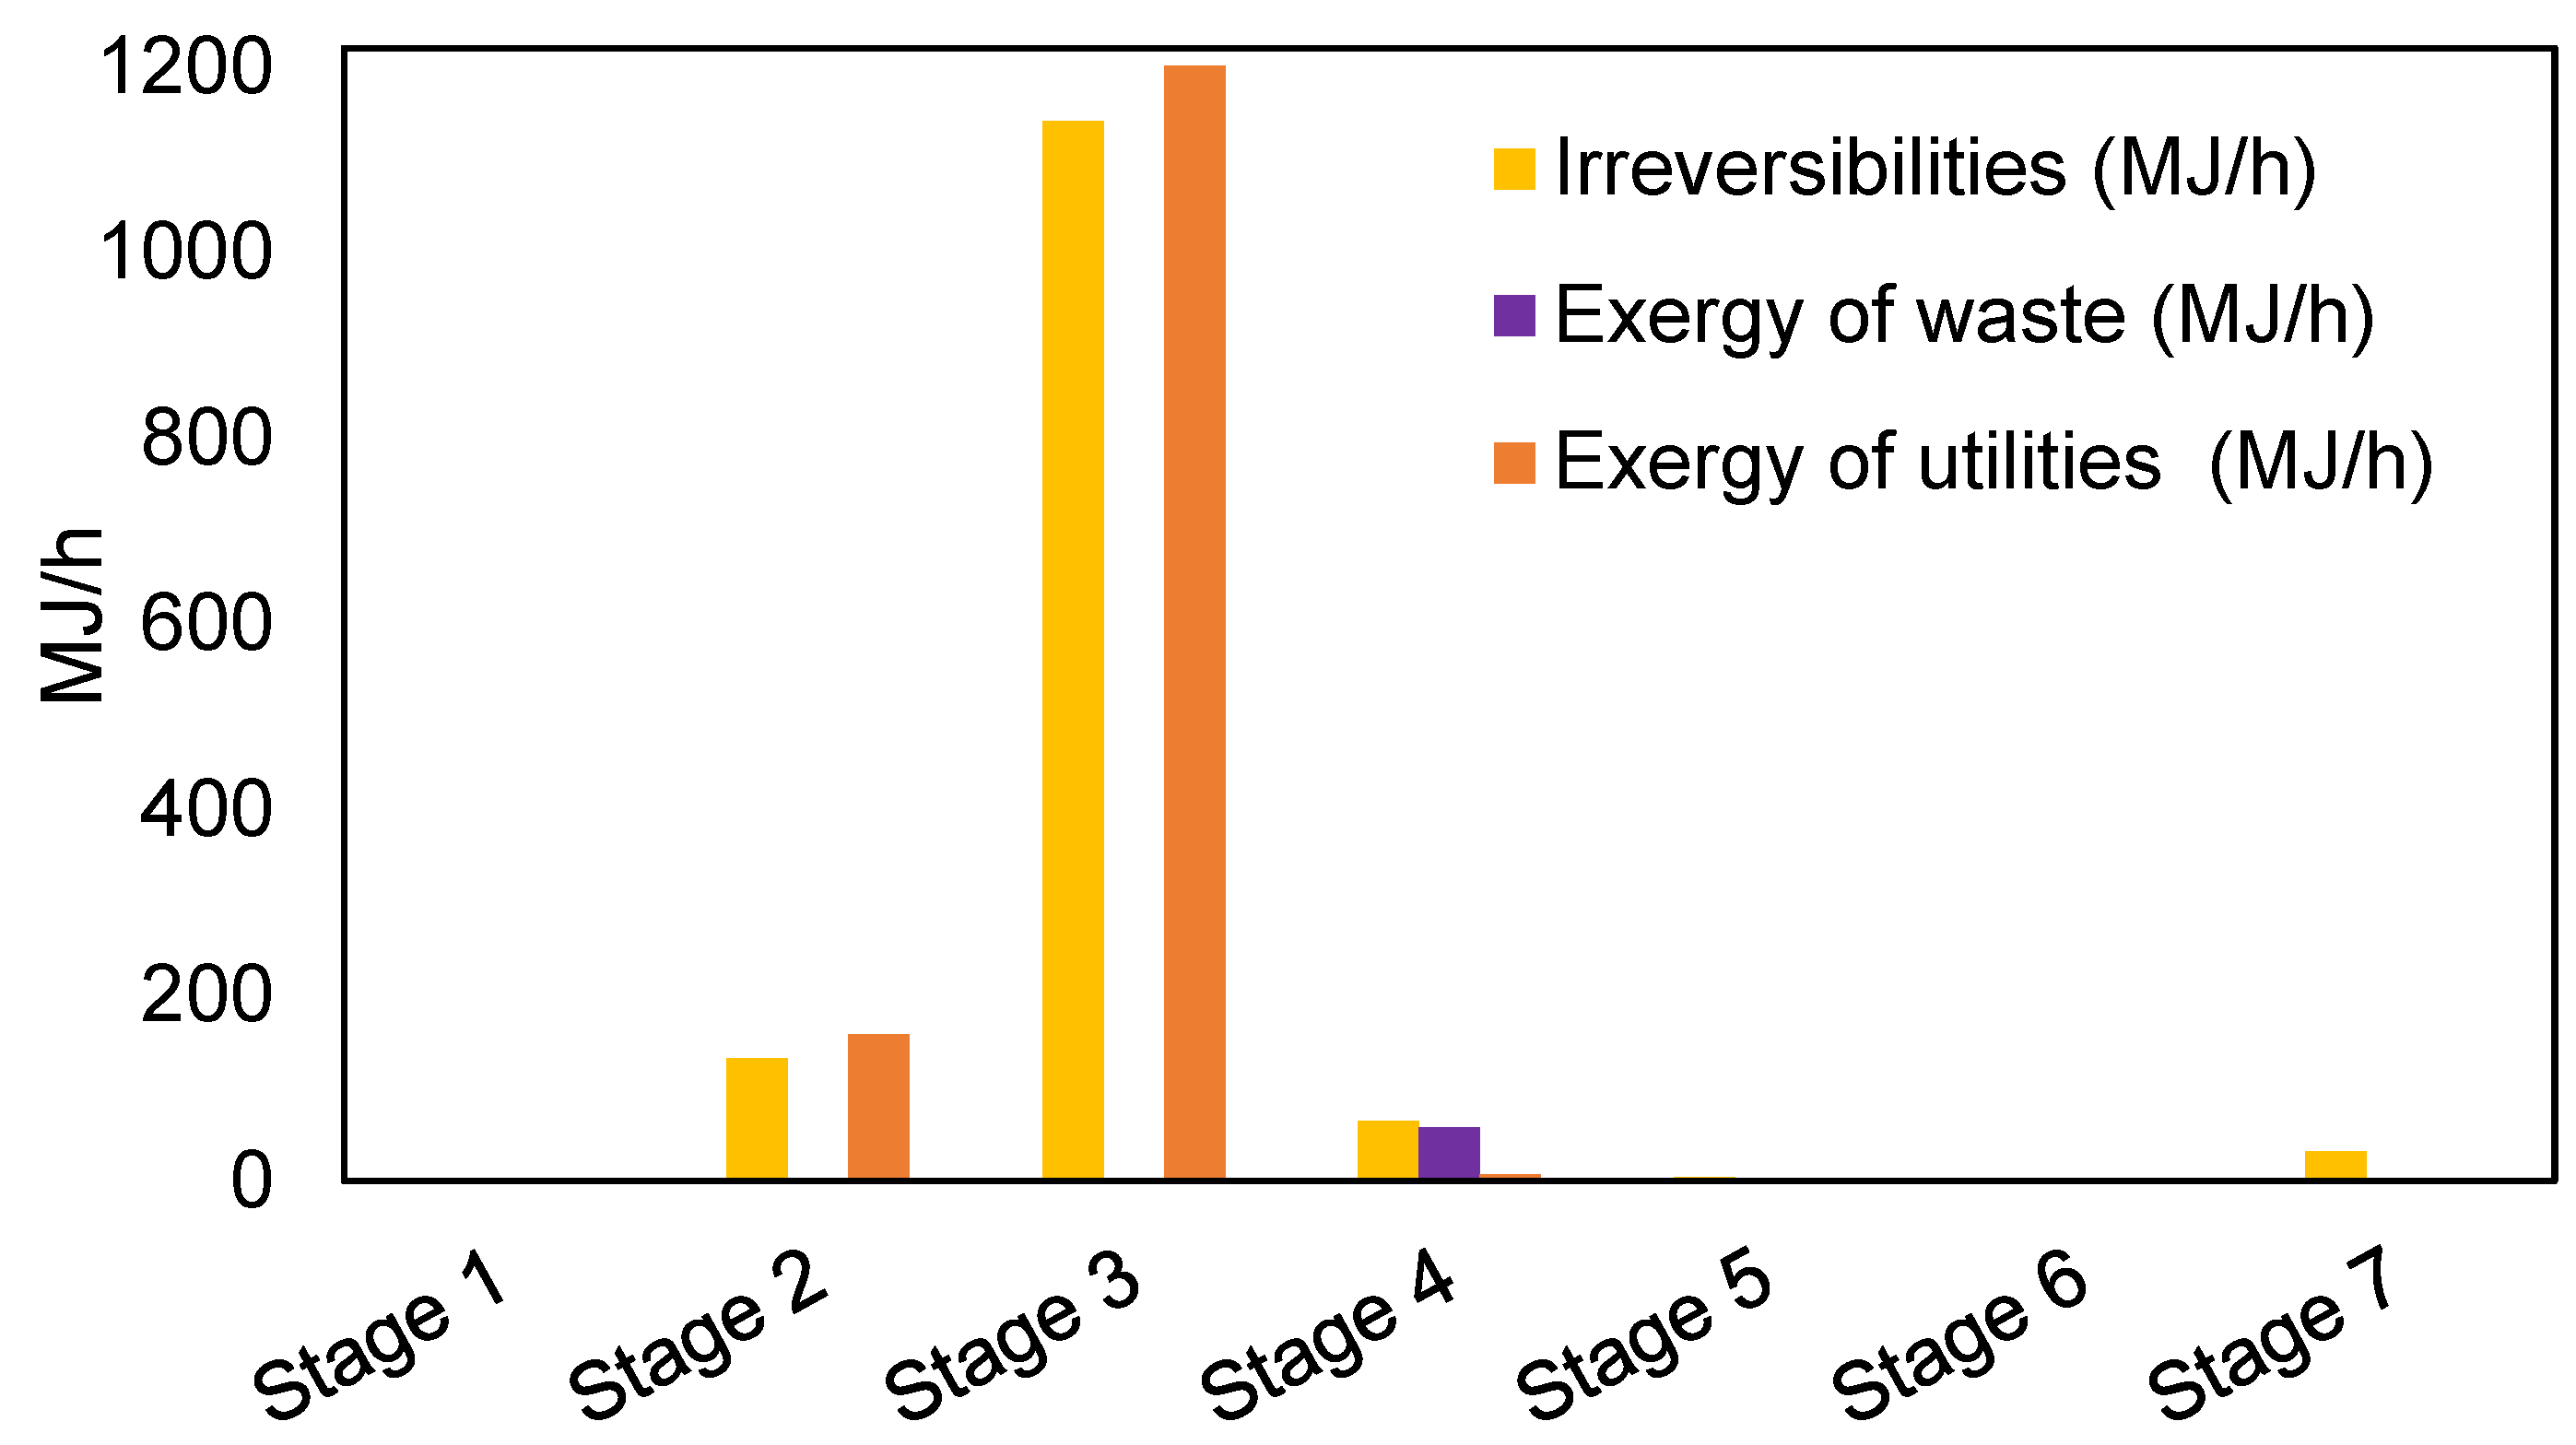
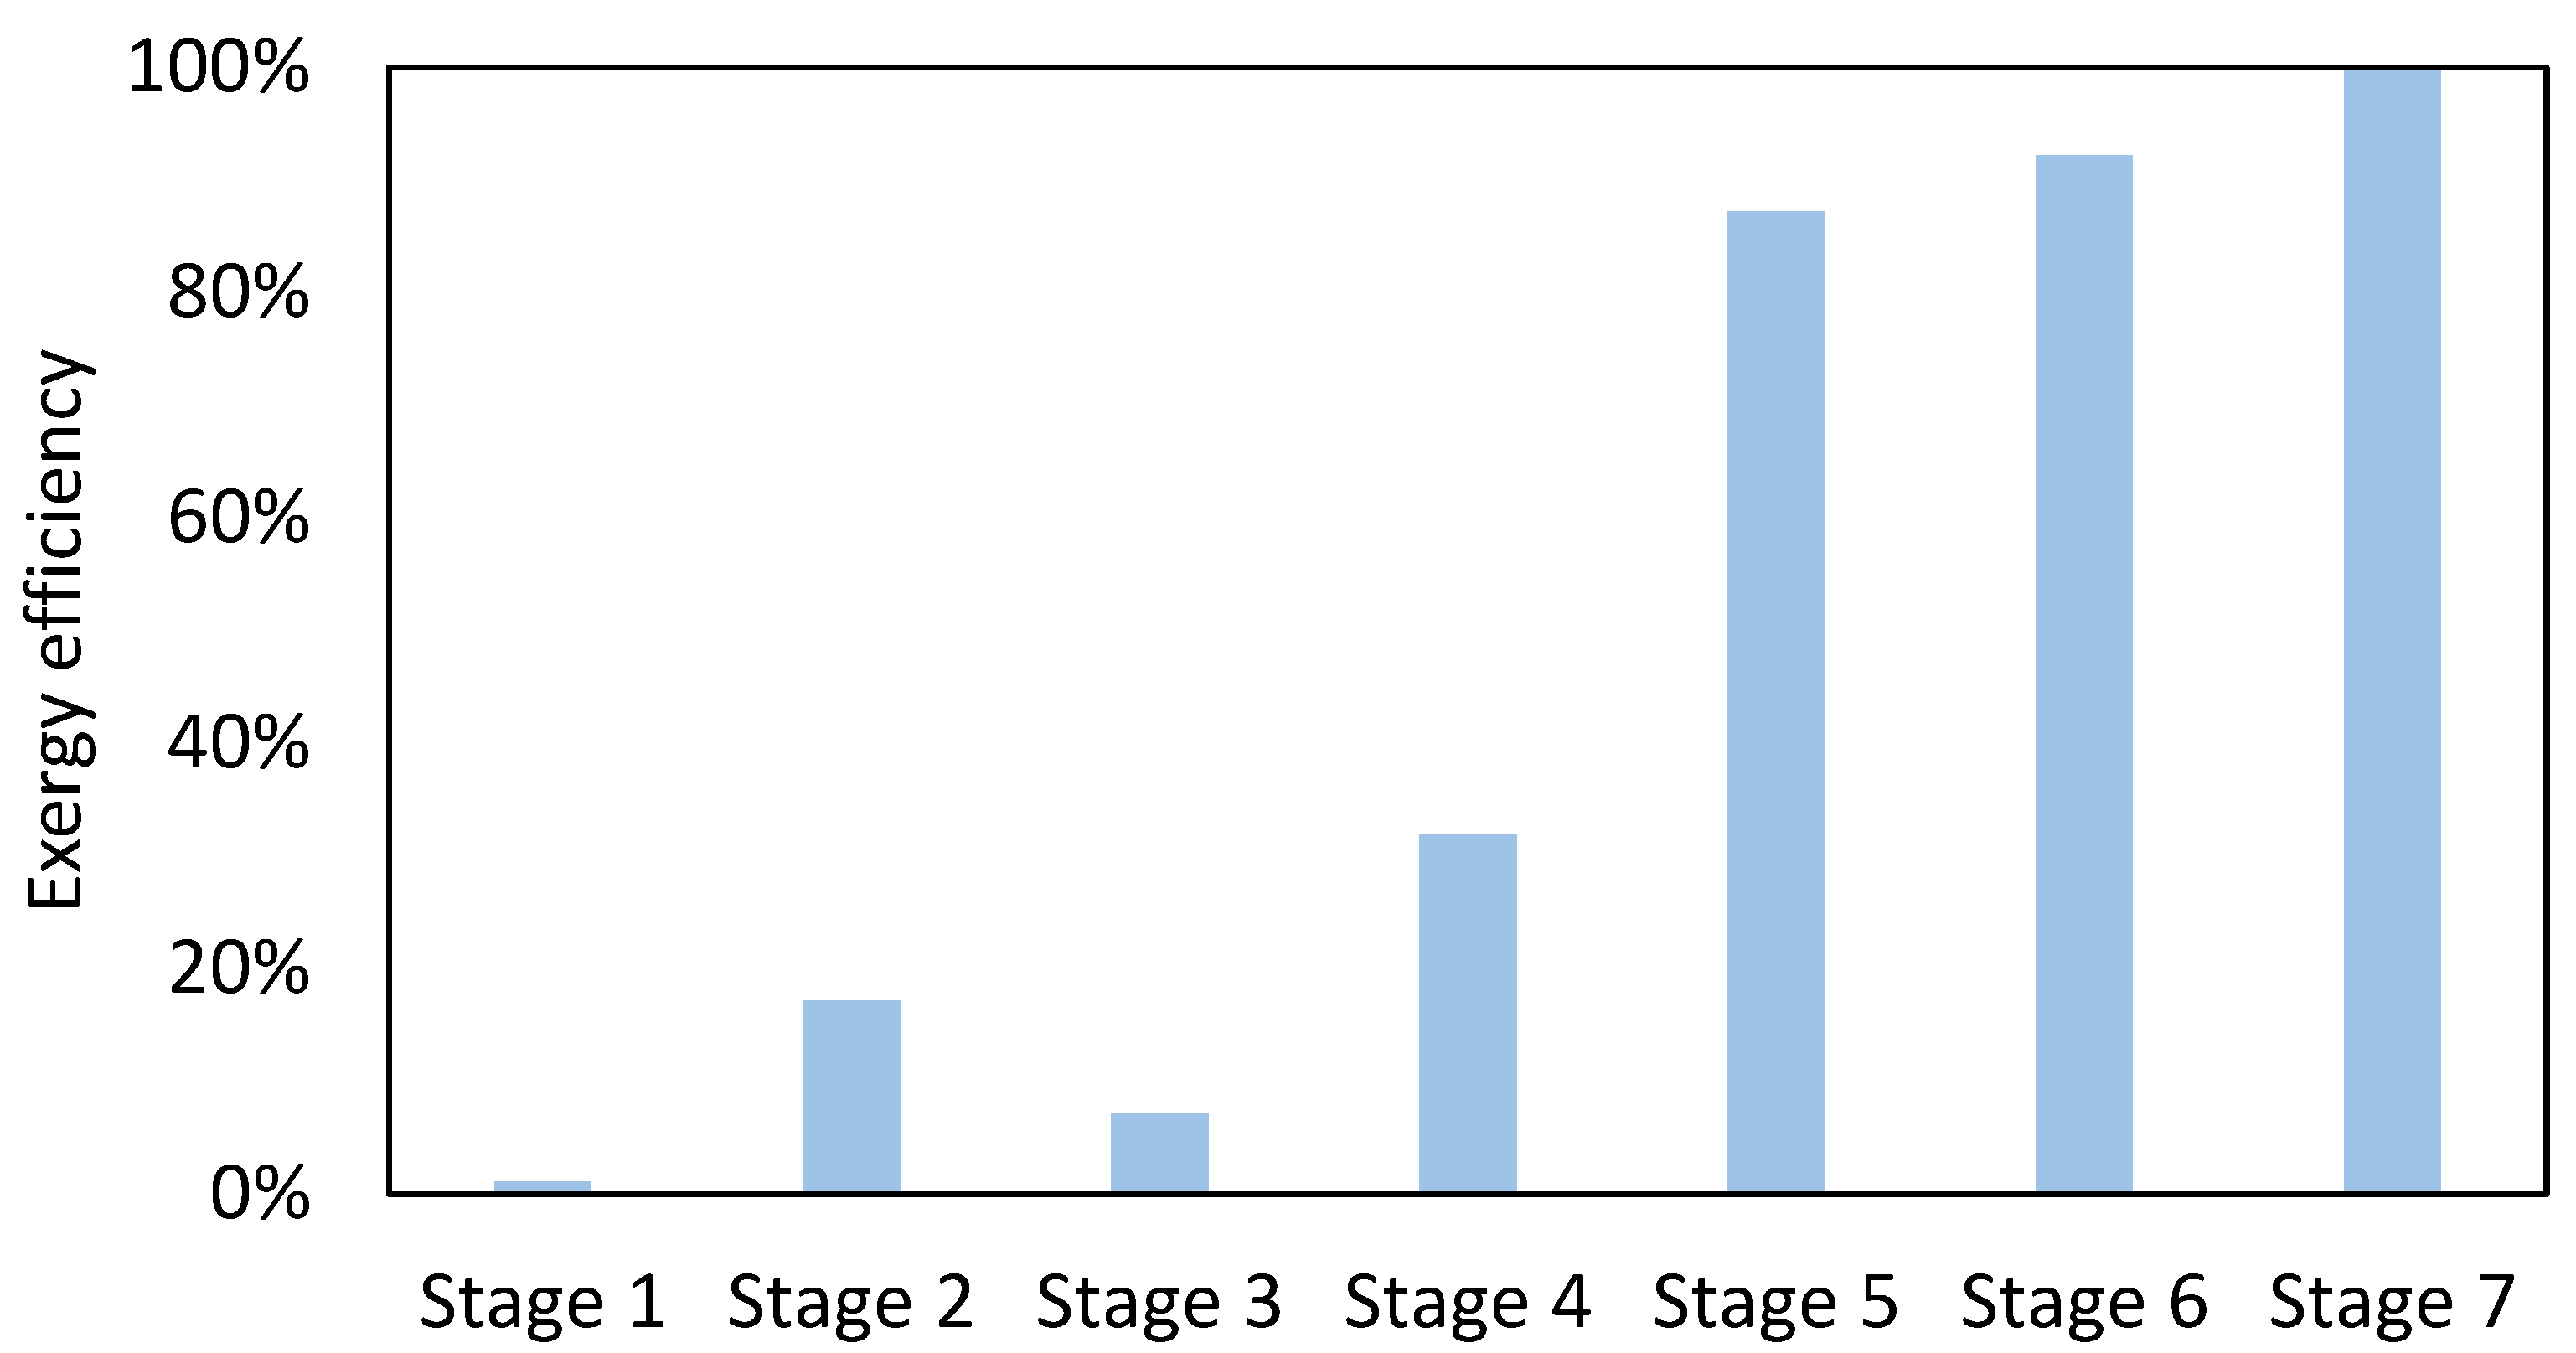
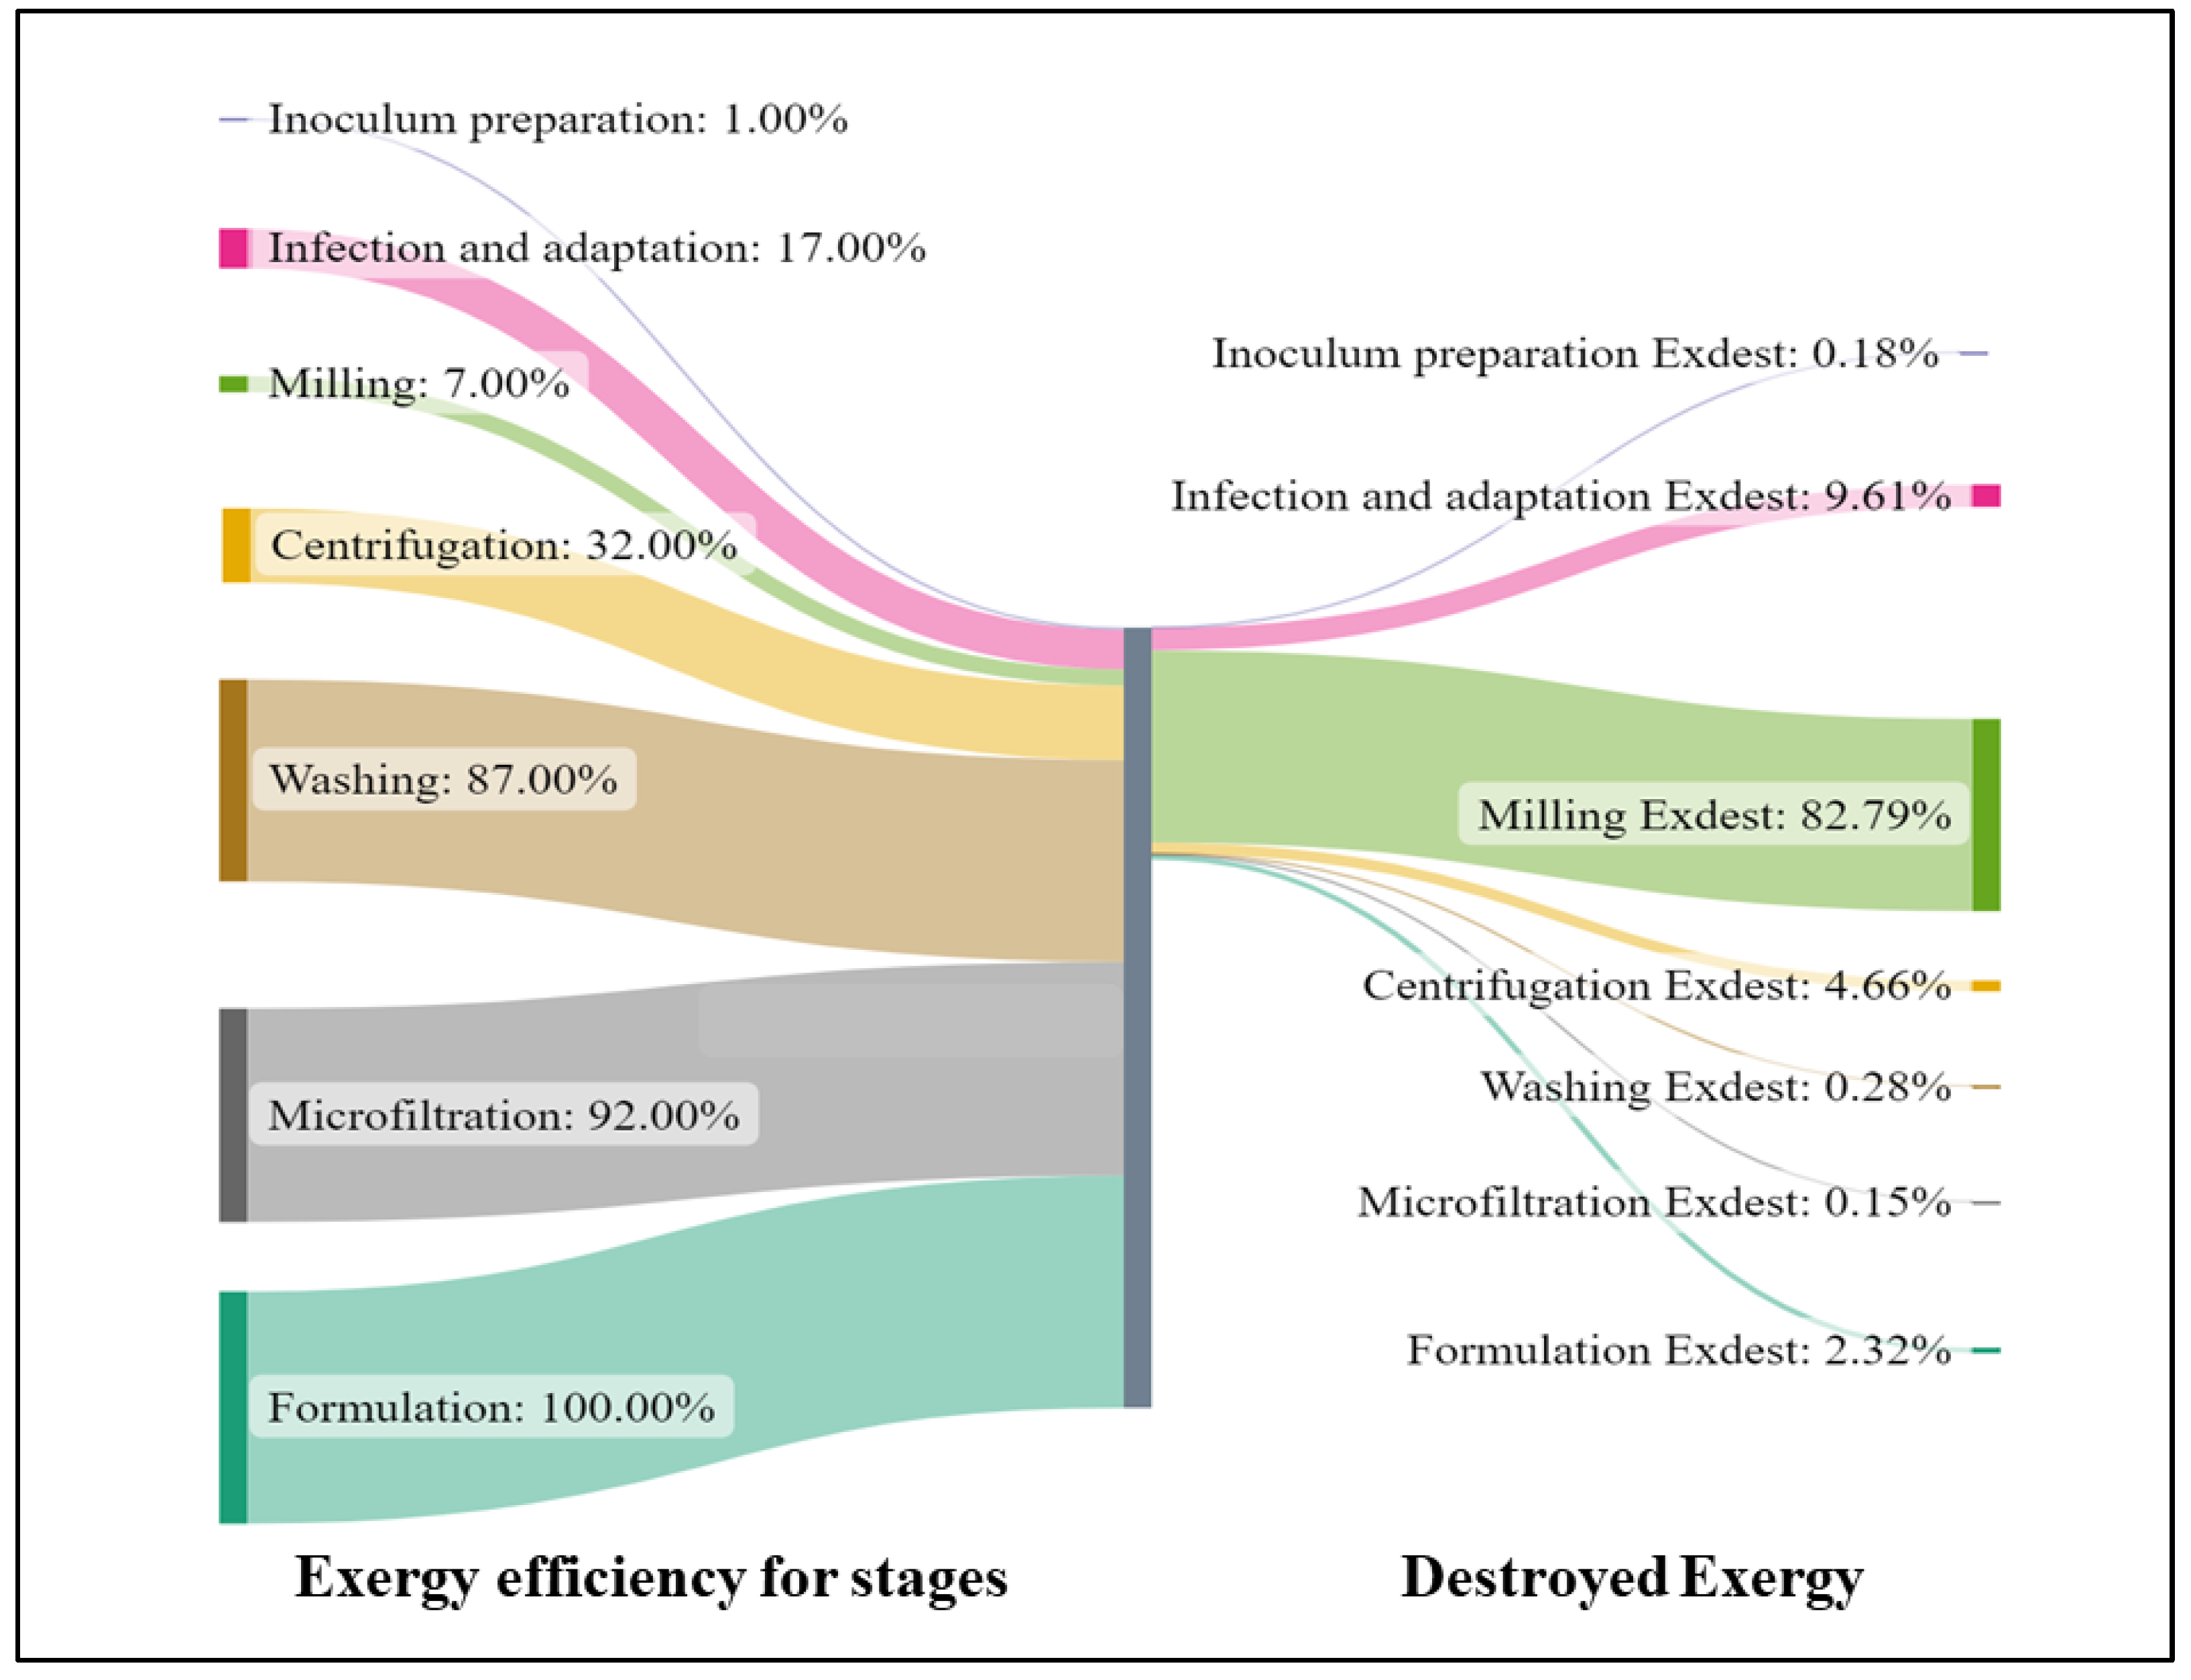
3.2. Exergy Analysis

The components’ flowrates, temperature, pressure, exergy, chemical and physical of some currents of the process are shown in Table 5 and Table 6.
On the other hand, Table 7 shows the chemical exergies of the pure substances, which are used to determine the exergies of the streams and, in turn, allow the exergy analysis of the influenza vaccine production process.
In Figure 9, the overall exergy analysis of the process is shown. The global exergy efficiency of the process reached 93%. The exergy of waste (63.74 MJ/h) represents 4% of irreversibilities since the waste streams are mainly constituted of carbon dioxide and water whose chemical exergies are low compared to other substances involved in the process. In addition, the streams deviate slightly from the standard conditions of pressure and temperature, which indicates low physical exergies. On the other hand, unavoidable exergy contributes 96% to irreversibilities. Finally, to increase global exergy efficiency, it is important to implement strategies for decreasing the energy consumption.
Figure 10 shows the exergy of waste, irreversibilities, and the exergy of utilities per stage. The most critical stage is milling (stage 3) for reaching the highest irreversibility value (1141.46 MJ/h), representing approximately 83% of the total destroyed exergy of the process. This is due to the difference between the exergy input and exergy of products. This phenomenon may also be observed in the infection and virus adaption (stage 2) and centrifugation stages (stage 4) where the second and third highest irreversibilities (132.26 and 64.28 MJ/h, respectively) were obtained. This finding agrees with the research performed by Moreno et al. [31], which found that centrifugation was one of the most critical stages in the production of crude palm kernel oil due to the energy required in the stage. Regarding the exergy of waste, the highest value was obtained in the centrifugation stage (57.27 MJ/h) because cellular debris is removed in this stage. Cellular debris contains lipids whose chemical exergy is high compared to other substances. The highest exergy of utilities corresponds to the milling stage due to the high energy consumption. It is important to choose adequate technology to save energy. According to Rajemi et al. [32], a conventional milling machine consumes 800 times more energy compared to a micro milling machine.
Exergy efficiencies of each stage of the vaccine production are shown in Figure 11. As shown in this figure, the stage with the highest exergy efficiency (100%) is blending or formulation (stage 7), since neither waste is produced in this stage nor is energy consumption required. The stage with the second-highest exergy efficiency is microfiltration (stage 6). Although a waste stream is emitted in this stage, the main constituent of this stream is water, whose chemical exergy is low. On the other hand, the lowest exergy efficiency (1%) was obtained in the inoculum preparation stage 1. In this stage, the destroyed exergy is due to the exergy of waste, which is higher than the exergy of utilities in this stage.
Figure 12 shows the Sankey diagram for the production of influenza vaccines; on the left side the exergy efficiency and on the right side the exergy destroyed by stages. This diagram shows the contribution of each of the stages of the process to the total irreversibilities. The highest contribution corresponds to the milling stage (82.79%), which confirms the results shown above. The lowest contributions correspond to the microfiltration (0.15%) and inoculum preparation (0.18%) stages. It is recommended that the energy consumption in the stages with the higher contributions to irreversibilities be evaluated. On the other hand, the stages with the highest energy efficiency correspond to formulation and microfiltration (100% and 92%, respectively).

4. Conclusions

In this work, the exergy analysis of the influenza vaccine production was performed. Some 3643 t/y are produced in the plant. First, the process was analyzed in a global way to establish its exergetic performance; subsequently, an analysis by stages was carried out. The results showed that the overall exergy efficiency of the vaccine production process is 93%, which is a sustainability indicator that allows us to identify that energy losses are low [33]. The exergy of waste is low compared to the destroyed exergy, which means wastes are not the main sink of energy. In the exergetic analysis by stages, milling obtained the highest destroyed exergy due to the difference between input exergy and product exergy. The stage with the lowest exergy efficiency was inoculum preparation (1%) because the components of the result stream have low exergy. On the other hand, the highest exergy efficiency was obtained in the formulation stage.
A technoeconomic resilience analysis of a vaccine production plant in north-east Colombia was performed in this work. The selling price established for each vaccine was 0.68 USD. The total capital investment and total product cost for the plant were 62,434,950.00 USD and 2,173,802,647.23 USD/y, respectively. The return on investment reached 86% and the payback period for the investment was 0.6 years. This period of return on the investment reduced the possibility of not recovering the investment due to a stoppage of the project. The return on investment of this project is high compared to the palm-based biorefineries process. The production capacity at the break-even point of the plant was 2503.15 t/y, representing 24% of the installed capacity. The studied process begins to have negative profits when the cost of raw materials has risen higher than 4%, which indicates that the project has a low resistance to increases in raw material costs compared to industrial agar production from red algae, which resists a 100% increase in raw material costs [30]. It is not beneficial for normalized variable operating costs to be higher than $215,500/t because higher values do not provide a return on investment.

Author Contributions

Conceptualization, Á.D.G.-D.; methodology, A.F.B.-S., J.B.G.-M. and Á.D.G.-D.; software, Á.D.G.-D.; validation, Á.D.G.-D., J.B.G.-M. and Á.D.G.-D.; formal analysis, A.F.B.-S., J.B.G.-M. and Á.D.G.-D.; investigation, A.F.B.-S., J.B.G.-M. and Á.D.G.-D.; resources, A.F.B.-S., J.B.G.-M. and Á.D.G.-D.; data curation, A.F.B.-S., J.B.G.-M. and Á.D.G.-D.; writing—original draft preparation, A.F.B.-S., J.B.G.-M. and Á.D.G.-D.; writing—review and editing, A.F.B.-S. and Á.D.G.-D.; visualization, Á.D.G.-D.; supervision, Á.D.G.-D.; project administration, Á.D.G.-D.; funding acquisition, Á.D.G.-D. All authors have read and agreed to the published version of the manuscript.

Funding

This research received no external funding.

Institutional Review Board Statement

Not applicable.

Informed Consent Statement

Not applicable.

Data Availability Statement

The data used in this study are available on request to the corresponding author.

Acknowledgments

The authors thank the University of Cartagena and Universidad Francisco de Paula Santander for providing the equipment required to successfully conclude this study.

Conflicts of Interest

The authors declare no conflict of interest.

Nomenclature

FCIFixed Capital Investment ($)
FCI0Initial Value of Depreciable Fixed Capital Investment ($)
FCIsSalvage Value of Fixed Capital Investment ($)
OCOperating Costs ($)
DPCDirect Production Costs ($/y)
POHPlant Overhead ($/y)
GEGeneral Expenses ($/y)
AFCAnnualized Fixed Costs ($/y)
ACFNet Profit for Year n ($)
AOCAnnualized Operating Costs ($/y)
NVOCNormalized Variable Operating Cost ($/t-rm)
PATProfit after Taxes ($/y)
CCFCumulative Cash Flow (1/y)
ACRAnnual Cost/Benefit Ratio
ROIReturn on Investment (%)
NPVNet Present Value (MM$)
PBPPayback Period (y)
DGPGross Profit (depreciation included) (MM$/y)
nYears
iInflation Rate (%)
θiRatio between the quantity of product i obtained per unit of raw material
itrTax rate set by the government for income derived from the process (%)
m R M Mass flow of raw material (t/y)
E x m a s s Exergy of mass flow (MJ/h)
E x h e a t Exergy of heat (MJ/h)
E x w o r k Exergy of work (MJ/h)
E x p h y s i c a l Physical Exergy (MJ/h)
E x c h e m i c a l , m i x Chemical Exergy of the mixture (MJ/h)
E x c h e m i c a l Chemical Exergy ((MJ/kg)
E x u t i l i t i e s Exergy of utilities (MJ/h)
E x p o t e n t i a l Potential Exergy (MJ/h)
E x k i n e t i c Kinetic Exergy (MJ/h)
E x p r o d u c t s Exergy of products (MJ/h)
E x w a s t e Exergy of waste (MJ/h)
η E n e r g y Exergy efficiency (%)
Δ G f Gibbs free energy of formation (MJ/kmol)
PPressure (atm)
P0Pressure of the reference state (atm)
TTemperature (K)
T0Temperature of the reference state (K)
v m Molar volume (m3/mol)
R Universal constant of gases (MJ/kmol·K)
y i Molar fraction
y j Number of atoms of elements j
C p Heat capacity at constant pressure (J/kg·K)

References

  1. Warmath, C.R.; Ortega-Sanchez, I.R.; Duca, L.M.; Porter, R.M.; Usher, M.G.; Bresee, J.S.; Lafond, K.E.; Davis, W.W. Comparisons in the health and economic assessments of using quadrivalent versus trivalent influenza vaccines: A systematic literature review. Value Health 2022, in press. [Google Scholar] [CrossRef] [PubMed]
  2. Kalil, A.C.; Thomas, P.G. Influenza virus-related critical illness: Pathophysiology and epidemiology. Crit. Care 2019, 23, 1–7. [Google Scholar] [CrossRef] [PubMed] [Green Version]
  3. Sellers, S.A.; Hagan, R.S.; Hayden, F.G.; Fischer, W.A. The hidden burden of influenza: A review of the extra-pulmonary complications of influenza infection. Influ. Other Respir. Viruses 2017, 11, 372–393. [Google Scholar] [CrossRef] [PubMed] [Green Version]
  4. Paget, J.; Spreeuwenberg, P.; Charu, V.; Taylor, R.J.; Iuliano, A.D.; Bresee, J.; Viboud, C. Global mortality associated with seasonal influenza epidemics: New burden estimates and predictors from the GLaMOR Project. J. Glob. Health 2019, 9, 1–12. [Google Scholar] [CrossRef] [PubMed]
  5. Walensky, R.P.; Jernigan, D.B.; Bunnell, R.; Layden, J.; Kent, C.K.; Gottardy, A.J.; Sanchez, J.N. Morbidity and Mortality Weekly Report Prevention and Control of Seasonal Influenza with Vaccines: Recommendations of the Advisory Committee on Immunization Practices, United States, 2021–2022 Influenza Season Centers for Disease Control and Prevention. MMWR Recomm. Rep. 2021, 70, 1. [Google Scholar]
  6. Loeb, M.; Roy, A.; Dokainish, H.; Dans, A.; Palileo-Villanueva, L.; Karaye, K.; Zhu, J.; Liang, Y.; Goma, F.; Damasceno, A.; et al. Influenza vaccine to reduce adverse vascular events in patients with heart failure: A multinational randomised, double-blind, placebo-controlled trial. Lancet Glob. Health 2022, 10, e1835–e1844. [Google Scholar] [CrossRef]
  7. Karlsson, E.A.; Ciuoderis, K.; Freiden, P.J.; Seufzer, B.; Jones, J.C.; Johnson, J.; Schultz-Cherry, S. Prevalence and characterization of influenza viruses in diverse species in Los Llanos, Colombia. Emerg. Microbes Infect. 2013, 2, 1–10. [Google Scholar] [CrossRef]
  8. Gasparini, R.; Amicizia, D.; Lai, P.L.; Panatto, D. Influenza vaccination: From epidemiological aspects and advances in research to dissent and vaccination policies. J. Prev. Med. Hyg. 2016, 57, E1–E4. [Google Scholar]
  9. Contreras, J.E.; Ruiz, S.L.; García, J.B.; Urbina, N.A.; López, G.L.; Barajas, A.F.; Zuorro, A. A simulation analysis of an influenza vaccine production plant in areas of high humanitarian flow. A preliminary study for the region of Norte de Santander (Colombia). Appl.Sci. 2022, 12, 183. [Google Scholar]
  10. Barragan, D.; Morales, S.A.; Kafarov, V. Exergetic analysis of combustion processes of variable mixtures of refinery residual gas: Effect of propane. Chem. Eng. Trans. 2018, 70, 1183–1188. [Google Scholar]
  11. Klemeš, J.J.; Jiang, P.; Fan, Y.; Van Bokhari, A.; Wang, X.C. COVID-19 pandemics Stage II—Energy and environmental impacts of vaccination. Renew. Sustain. Energy Rev. 2021, 150, 111400. [Google Scholar] [CrossRef] [PubMed]
  12. Crager, S.E. Improving global access to new vaccines: Intellectual property, technology transfer, and regulatory pathways. Am. J. Public Health 2018, 108, S414–S420. [Google Scholar] [CrossRef]
  13. Kawakami, T.; Kawamura, K.; Fujimori, K.; Koike, A.; Amano, F. Influence of the culture medium on the production of nitric oxide and expression of inducible nitric oxide synthase by activated macrophages in vitro. Biochem. Biophy. Rep. 2016, 5, 328–334. [Google Scholar] [CrossRef] [PubMed] [Green Version]
  14. Peters, M.S.; Peters, J.I. Plant Design and Economics for Chemical Engineers; Engineering Economics; McGraw-Hill: New York, NY, USA, 2002; Volume 5. [Google Scholar]
  15. Li, G.; Chang, Y.; Liu, T.; Yu, Z.; Liu, F.; Ma, S.; Weng, Y.; Zhang, Y. Hydrogen element flow and economic analyses of a coal direct chemical looping hydrogen generation process. Energy 2020, 206, 118243. [Google Scholar] [CrossRef]
  16. Romero, J.; Vergara, L.; Peralta, Y.; González, A. A Techno-Economic Sensitivity Approach for Development of a Palm-based Biorefineries in Colombia. Chem. Eng. Trans. 2017, 57, 13–18. [Google Scholar] [CrossRef]
  17. Herrera-Rodriguez, T.; Parejo-Palacio, V.; González-Delgado, A. Techno-economic Evaluation of Creole Avocado Biomass Valorization via Oil Production in North-colombia. Chem. Eng. Trans. 2022, 92, 409–414. [Google Scholar] [CrossRef]
  18. El-Halwagi, M. Sustainable Design through Process Integration: Fundamentals and Applications to Industrial Pollution Prevention, Resource Conservation, and Profitability Enhancement; Elsevier: Amsterdam, The Netherland, 2011. [Google Scholar]
  19. El-Halwagi, M. A return on investment metric for incorporating sustainability in process integration and improvement projects. Clean Technol. Environ. Policy 2016, 19, 611–617. [Google Scholar] [CrossRef]
  20. Terzi, R. Application of Exergy Analysis to Energy Systems; Application of Exergy: London, UK, 2018. [Google Scholar] [CrossRef] [Green Version]
  21. González-Delgado, Á.D.; Moreno-Sader, K.A.; Martínez-Consuegra, J.D. Biorrefinación Sostenible del Camarón: Desarrollos desde la Ingeniería de Procesos Asistida por Computador; Corporación Universitaria Minuto de Dios-UNIMINUTO: Bogotá, Colombia, 2022. [Google Scholar]
  22. Herrera-Rodriguez, T.; Parejo-Palacio, V.; González-Delgado, A. Quality of Energy Conservation in an Avocado Oil Extraction Via Exergy Analysis. Chem. Eng. Trans. 2022, 91, 241–246. [Google Scholar] [CrossRef]
  23. Moreno, K.; Meramo, S.I.; González, A. Computer-aided environmental and exergy analysis as decisionmaking tools for selecting bio-oil feedstocks. Renew. Sustain. Energy Rev. 2019, 112, 42–57. [Google Scholar] [CrossRef]
  24. Arteaga-Díaz, S.J.; Meramo, S.; González-Delgado, Á.D. Computer-Aided Modeling, Simulation, and Exergy Analysis of Large-Scale Production of Magnetite (Fe3O4) Nanoparticles via Coprecipitation. ACS Omega 2021, 6, 30666–30673. [Google Scholar] [CrossRef]
  25. Szargut, J. Chemical exergies of the elements. Appl. Energy 1989, 32, 269–286. [Google Scholar] [CrossRef]
  26. Reed, J.J. Digitizing “The NBS tables of chemical thermodynamic properties: Selected values for inorganic and C1 and C2 organic substances in SI Units”. J. Res. Nat. Inst. Stand. Technol. 2020, 125, 125007. [Google Scholar] [CrossRef] [PubMed]
  27. Popovic, M.; Minceva, M. A thermodynamic insight into viral infections: Do viruses in a lytic cycle hijack cell metabolism due to their low Gibbs energy. Heliyon 2020, 6, e03933. [Google Scholar] [CrossRef] [PubMed]
  28. Lamers, P.; Roni, M.S.; Tumuluru, J.S.; Jacobson, J.J.; Cafferty, K.G.; Hansen, J.K.; Bals, B. Techno-economic analysis of decentralized biomass processing depots. Biores. Technol. 2015, 194, 205–213. [Google Scholar] [CrossRef] [PubMed] [Green Version]
  29. Nallaperuma, W.; Ekanayake, U.; Punchi-Manage, R. Identifying Factors that Affect the Downtime of a Production Process. In Proceedings of the 15th Open University Research Sessions (OURS 2017), Colombo, Sri Lanka, 16–17 November 2017. [Google Scholar]
  30. Herrera-Rodriguez, T.; Parejo-Palacio, V.; González-Delgado, Á.D. Technoeconomic sensibility analysis of industrial agar production from red algae. Chem. Eng. Trans. 2018, 70, 2029–2034. [Google Scholar]
  31. Moreno Sader, K.; León Pulido, J.; González-Delgado, Á. Evaluación de la producción de aceite crudo de palma y palmiste en el norte de Colombia mediante el análisis de exergía asistido por computador. Revista ION 2021, 34, 31–41. [Google Scholar] [CrossRef]
  32. Rajemi, M.F.; Mativenga, P.T.; Aramcharoen, A.; Velchev, S.; Kolev, I.; Ivanov, K.; Rajemi, M.F. Energy Analysis in Turning and Milling. J. Clean. Prod. 2010, 18, 149–152. [Google Scholar]
  33. González-Delgado, Á.D.; García-Martínez, J.B.; Barajas-Solano, A.F. Inherent Safety Analysis and Sustainability Evaluation of a Vaccine Production Topology in North-East Colombia. Sustainability 2022, 14, 9985. [Google Scholar] [CrossRef]
Figure 1. Process diagram of the vaccine production process.
Sustainability 15 00287 g001
Figure 2. Schematic representation of the methodological procedure for the exergy and technical-economic resilience assessment.
Sustainability 15 00287 g002
Figure 3. Resilience of the plant to vaccine production capacity.
Sustainability 15 00287 g003
Figure 4. Resilience of the selling price of vaccine production respect to on-stream efficiency at the break-even point.
Sustainability 15 00287 g004
Figure 5. Resilience of the profitability based on raw material costs.
Sustainability 15 00287 g005
Figure 6. Resilience of return on investment (ROI) based on operating costs of vaccine production process.
Sustainability 15 00287 g006
Figure 7. Resilience of the payback period (PBP) with respect to normalized variable operating costs (NVOC).
Sustainability 15 00287 g007
Figure 8. Net present value of vaccine production.
Sustainability 15 00287 g008
Figure 9. Overall exergy analysis for influenza vaccine production.
Sustainability 15 00287 g009
Figure 10. Exergy analysis per stage for influenza vaccine production.
Sustainability 15 00287 g010
Figure 11. Exergy efficiencies per stage for influenza vaccine production.
Sustainability 15 00287 g011
Figure 12. Sankey diagram of irreversibilities and exergy efficiency for influenza vaccine production.
Sustainability 15 00287 g012
Table 1. Technoeconomic assumptions for vaccine production plant.
ParametersValue/Description
Main product flow (t/y)3326.4
Raw materials cost ($/t)163,891.7201
Useful life of the plant (years)15
Salvage value10% of depreciable FCI
Construction time of the plant (years)3
Income tax rate (itr)39%
Interest9%
Type of processNew and unproven
Process controlDigital
Project typePlant on non-built land
Soil typeSoft clay
Selling price per unit (USD)0.68
Table 2. Total capital investment for vaccine production plant.
Cost of Capital InvestmentTotal (USD)
Equipment Purchase Cost7,755,000.00
Total direct plant cost (TPDC)18,786,000.00
Contractor’s fee1,267,000.00
Land775,500.00
Contingency2,533,000.00
Total Plant Indirect Cost (TPIC)14,074,500.00
FCI32,860,500.00
Start up (SU)3,286,050.00
WCI26,288,400.00
Total Capital Investment (TCI)62,434,950.00
Table 3. Total product cost for the vaccine production plant.
Total Product Cost (TPC)Total (USD/y)
Raw materials1,716,852,131.18
Utilities (U)48,445.00
Maintenance and repairs (MR)1,643,025.00
Operating supplies246,453.75
Operating labor (OL)8,537,291.00
Direct supervision and clerical labor1,280,593.65
Laboratory charges853,729.10
Patents and royalties328,605.00
Direct production cost (DPC)1,729,790,273.68
Depreciation (D)2,190,700.00
Local taxes985,815.00
Insurance328,605.00
Interest/rent624,349.50
Fixed charges (FCH)4,129,469.50
Plant overhead (POH)5,122,374.60
Total Manufacturing Cost (TMC)1,739,042,117.78
General expenses (GE)434,760,529.45
Total product cost (TPC)2,173,802,647.23
Table 4. Economic parameters for vaccine plant production.
Economic Parameters of the Base CaseValue
Gross Profit (depreciation not included) (GP) (USD/y)90,340,052.77
Gross Profit (depreciation included) (DGP)88,149,352.77
Profit After Taxes (PAT) (USD/y)53,771,105.19
Payback Period (PBP) (years)0.61
%ROI86%
NPV (MM USD)388.87
Annual Cost/Revenue48.24
Table 5. Component flowrates, temperature, pressure, mass flow, chemical and physical exergy of the main stream of the process.
Stream1461213161718
T °C25.00111.00100.0039.6439.6225.0025.0025.00
P (atm)1.001.001.001.001.001.001.001.00
Mass flow (kg/h)2.990.363.320.323.240.890.991.12
Exchemical (MJ/h)0.000.000.010.0027.4130.110.073.19
Exphysical (MJ/h)0.000.010.090.000.040.000.000.00
Components
Cholesterol0.0000.0003.1 × 10−60.0003.3 × 10−58.4 × 10−50.0001.2 × 10−5
Urea0.0000.0002.3 × 10−60.0002.5 × 10−56.4 × 10−50.0009.3 × 10−6
Carbon Dioxide0.0001.0000.9631.0000.0000.0000.0000.000
Water0.9900.0000.0360.0000.8640.4360.9890.920
Sodium bicarbonate0.0040.0009.9 × 10−50.0000.0010.0070.0000.000
Sodium chloride0.0060.0001.7 × 10−40.0000.0020.0010.0080.007
D-glucose0.0000.0004.9 × 10−60.0005.4 × 10−51.4 × 10−40.0010.001
Sodium phosphate0.0000.0000.0000.0000.0000.0000.0010.001
Nitrogen0.0000.0000.0000.0000.0000.0000.0000.000
Oxygen0.0000.0000.0000.0000.0000.0000.0000.000
Penicillin0.0000.0000.0000.0000.0090.0220.0000.000
Potassium alum0.0000.0000.0000.0000.0000.0000.0000.000
Organelles0.0000.0000.0000.0000.0000.0890.0000.071
Virus0.0000.0000.0000.0000.1230.4490.0000.000
Table 6. Component flowrates, temperature, pressure, mass flow, chemical and physical exergy of the main stream of the process. (Continuation).
Stream19202122232526
T °C25.0025.0025.0025.0025.0025.0025.00
P (atm)1.001.001.001.001.001.001.00
Mass flow (kg/h)0.760.380.37297.6289.29453.04840.32
Exchemical (MJ/h)26.331.1824.3011,322.533396.913401.1818,112.89
Exphysical (MJ/h)0.000.000.000.000.000.000.00
Components
Cholesterol8.1 × 10−51.6 × 10−40.0000.0000.0000.0000.000
Urea6.2 × 10−51.2 × 10−40.0000.0000.0000.0000.000
Carbon Dioxide0.0000.0000.0000.0000.0000.0000.000
Water0.4580.9160.0000.0000.0000.5220.281
Sodium bicarbonate0.0010.0020.0000.0000.0000.0000.000
Sodium chloride0.0010.0030.0000.0000.0000.0050.003
D-glucose1.3 × 10−42.6 × 10−40.0000.0000.0000.0000.000
Sodium phosphate0.0000.0000.0000.0000.0000.0000.000
Nitrogen0.0000.0000.0000.0000.0000.0000.000
Oxygen0.0000.0000.0000.0000.0000.0000.000
Penicillin0.0260.0260.0001.0001.0000.1580.546
Potassium alum0.0000.0000.0000.0000.0000.3160.170
Organelles0.0000.0530.0000.0000.0000.0000.000
Virus0.5130.0001.0000.0000.0000.0000.000
Table 7. Chemical exergies of the substances.
ComponentChemical Exergy (MJ/kg)
Cholesterol57.36645078
Urea0.011465201
Carbon Dioxide0.000454545
Water0.05
Sodium bicarbonate0.257142857
Sodium chloride0.244695414
D-glucose15.50434068
Sodium phosphate0.41695122
Nitrogen0.025714286
Oxygen0.1240625
Penicillin38.04359354
Potassium alum4.831223629
Organelles39.20553822
Virus65.68514885
Disclaimer/Publisher’s Note: The statements, opinions and data contained in all publications are solely those of the individual author(s) and contributor(s) and not of MDPI and/or the editor(s). MDPI and/or the editor(s) disclaim responsibility for any injury to people or property resulting from any ideas, methods, instructions or products referred to in the content.

