Article

Deep Journalism and DeepJournal V1.0: A Data-Driven Deep Learning Approach to Discover Parameters for Transportation

1
Department of Computer Science, Faculty of Computing and Information Technology, King Abdulaziz University, Jeddah 21589, Saudi Arabia
2
Department of Information Systems, Faculty of Computing and Information Technology, King Abdulaziz University, Jeddah 21589, Saudi Arabia
3
High Performance Computing Center, King Abdulaziz University, Jeddah 21589, Saudi Arabia
*
Author to whom correspondence should be addressed.
Sustainability 2022, 14(9), 5711; https://doi.org/10.3390/su14095711
Submission received: 16 March 2022 / Revised: 30 April 2022 / Accepted: 2 May 2022 / Published: 9 May 2022
(This article belongs to the Special Issue Sustainable Mobility and Transport)

Abstract

:
We live in a complex world characterised by complex people, complex times, and complex social, technological, economic, and ecological environments. The broad aim of our work is to investigate the use of ICT technologies for solving pressing problems in smart cities and societies. Specifically, in this paper, we introduce the concept of deep journalism, a data-driven deep learning-based approach, to discover and analyse cross-sectional multi-perspective information to enable better decision making and develop better instruments for academic, corporate, national, and international governance. We build three datasets (a newspaper, a technology magazine, and a Web of Science dataset) and discover the academic, industrial, public, governance, and political parameters for the transportation sector as a case study to introduce deep journalism and our tool, DeepJournal (Version 1.0), that implements our proposed approach. We elaborate on 89 transportation parameters and hundreds of dimensions, reviewing 400 technical, academic, and news articles. The findings related to the multi-perspective view of transportation reported in this paper show that there are many important problems that industry and academia seem to ignore. In contrast, academia produces much broader and deeper knowledge on subjects such as pollution that are not sufficiently explored in industry. Our deep journalism approach could find the gaps in information and highlight them to the public and other stakeholders.

1. Introduction

1.1. A Complex World, Governance Failures, and Deep Journalism

We live in a complex world characterised by complex people, complex times, and complex social, economic, and technological environments. Because this was not enough, our complex activities have complex effects on our ecological environment. This is not an easy time for our governments to to manage matters that affect our social, economic, and environmental sustainability. There is clear evidence that governments are failing at addressing education, healthcare, public safety, and the list goes on [1,2,3,4,5,6,7,8,9]. The recent COVID-19 pandemic is a major example of global governance failure both at preventing such pandemics (caused by the effects of our lifestyles, processed food we eat, and other activities that damage our planet’s environment) and managing the COVID-19 pandemic [10,11,12,13,14,15]. Governments are elected by people, and in a sense, government failure is also a failure of the public. It is time that we take responsibility for both success and failure and look into ways of collaboratively improving governance.
While there are many reasons for government failures, we believe the lack of information availability is a fundamental reason that limits a government’s ability to act smartly and allows a lack of transparency to creep into policies and actions, leading to corruption and failure. While the sincerity and intentions of the people involved could be a major cause of shortcomings in any institution or system, particularly large-scale public institutions and systems, practical efforts can be made to reduce silos and segmentation and bridge the gaps in the information and knowledge available to different communities through direct or indirect cross-sectional conversations and collaborations enabled through automated and autonomous technologies such as deep learning, big data analytics, and others.
To this end, this paper introduces the concept of deep journalism, a data-driven deep learning-based approach for discovering multi-perspective parameters related to a topic of interest. We examine the academic, industrial, public, governance, and political parameters for the transportation sector as a case study to introduce deep journalism and our tool, DeepJournal (Version 1.0), that implements our proposed approach. The concept of deep journalism will be illustrated in the rest of this section (and this paper) as we introduce the challenges facing the transportation sector and our work on detecting parameters for it as viewed by the public, governments, industry, and academia. The production and distribution of multi-perspective parameters are expected to provide a holistic and multi-perspective view of a sector and help bridge the knowledge and collaboration gaps that exist to reduce inefficiencies and failures.

1.2. Transportation and Challenges

Transportation is fundamental to modern societies and economies. However, transportation is a major challenge considering the many issues that this sector faces and the design parameters that need considering in developing successful policies, systems, and operations. The issues facing transportation include the safety of people and goods, rising costs, growth of megacities, long commutes for work, parking problems, damage to health and the planet, and more.
Several modes of transportation exist—road, rail, air, and marine—each with its own challenges. Road transportation is considered the backbone of modern economies although it costs over 1 million deaths and 50 million human injuries annually [16]. Rail transport requires huge capital investments and is therefore subject to monopolies, is relatively inflexible in terms of adjustments to individual passenger needs, cannot be moved around, and may be underutilised in different times and situations (such as during the recent COVID-19 pandemic). Moreover, heavily utilised trains are prone to frequent faults [17], cancellations [18,19] accidents [20,21,22], etc. [23]. Air transportation faces many challenges including pollution [24,25], high costs [26], high safety [27,28] and security risks [29,30], huge capital investments, fuel requirements [31], and others. Marine transportation also faces many challenges such as pollution, security risks [32,33,34], increasing costs, and environmental regulations [35,36]. These challenges are threatening the sustainability of our societies, economies, and our planet.
There is a need for innovative approaches based on collaborative thinking enabled through the availability of integrated information. Academia is not being used to its full potential [37]. What is possible in terms of technology and the potential of academia and people is not being matched with what is being done. Policy and action need to work together through dialogue to make information available to all bodies working in the transportation sector, the government, industry, academia, journalism, and the public. Deep Journalism could provide a solution.

1.3. Summary of the Proposed Work

In this work, we bring together a range of deep learning, big data, and other technologies to discover transportation parameters from three different perspectives using three different types of data sources, viz., a newspaper (The Guardian), a transportation technology magazine (Traffic Technology International), and academic literature on transportation (from Web of Science). The three types of data sources provide three different views of the transportation domain, that is, a view as seen by the public and governed by the political and other institutions, a second view from the transportation industry, and a third view as seen by the academics and researchers. Certainly, these views are not mutually exclusive and are to some extent affected by each other, but they do represent different perspectives with considerable differences. We call this approach Deep Journalism for two reasons. First, we call it deep in the actual sense of the word because it allows capturing and reporting a relatively deeper view of a topic (e.g., transportation) from multiple perspectives, dimensions, stakeholders, and depths. Second, we use deep learning to automatically discover multi-perspective parameters about a topic.
The newspaper dataset that we built to discover parameters for public, governance, and political aspects of transportation is collected from a UK-based newspaper, The Guardian. We collected all the articles from The Guardian newspaper that contain the word “transport” (in the title of the news, the full text of the news article, or the meta-information about the article) and found a total of 14,381 unique articles dated between September 1825 [38] and January 2022 [39]. We discovered a total of 25 parameters from The Guardian dataset and grouped them into 6 macro-parameters, namely Road Transport; Rail Transport; Air Transport; Crash and Safety; Disruptions and Causes; and Employment Rights, Disputes, and Strikes.
The industry and technology magazine dataset that we built to discover parameters about industrial aspects of transportation was collected from a technology-focused magazine, Traffic Technology International (TTI), a popular magazine reporting the latest transport technologies and news. We collected all the articles, a total of 5193 articles dated between February 2015 [40] and January 2022 [41] from the magazine website without any filters or search queries because this magazine only covers transportation-related news. We discovered a total of 15 parameters from the TTI dataset and grouped them into 5 macro-parameters, namely Industry, Innovation, and Leadership; Autonomous and Connected Vehicles; Sustainability; Mobility Services; and Infrastructure.
The academic-view dataset that we built to discover parameters for the academia-focused aspects of transportation is collected from an academic database, Web of Science. We collected in aggregate 21,446 research article abstracts (with titles and keywords) in the English language only from about 20 categories of academic disciplines in Web of Science, such as transportation science and technology, engineering, environmental science, telecommunications, economics, computer science, business, and others. The collected article abstracts were limited to the publishing years 2000 [42] to 2022 [43]. We discovered 49 transportation parameters from the academic dataset and grouped them into 6 macro-parameters. These are policy, planning and sustainability; transportation modes; logistics and SCM; pollution; technologies; and modelling.
We implemented the proposed deep journalism approach into a tool called DeepJournal (Version 1.0). The tool is able to discover transportation parameters using the datasets described above. The tool comprises four software components; Data Collection and Storage, Data Preprocessing, Parameter Modelling and Discovery, and Validation and Visualisation. The three datasets were collected using web scraping and other techniques and were preprocessed to remove duplicate and irrelevant data, tokenise data, clean up the data, and lemmatise data to generate data in a form that can be processed by the deep learning processing engine. We used a pretrained BERT (bidirectional encoder representations from transformers) word embedding model [44] to capture the contextual relations within the data. The BERT model was used along with UMAP (uniform manifold approximation and projection) [45] (a dimension reduction technique), HDBSCAN (hierarchical density-based spatial clustering of applications with Noise) [46] (a clustering algorithm), and a class-based TF–IDF (term frequency–inverse document frequency) score, to automatically group documents in the datasets into document clusters.
Subsequently, we discovered transportation parameters and macro-parameters from each dataset using the document clusters along with the domain knowledge and a range of quantitative analysis methods performed on the clustered data including similarity metrics [47], hierarchical clustering [48], term score [49], keyword score [50], and intertopic distance map [51]. A range of visualisation methods were used to elaborate on the datasets, document clusters, and the discovered parameters. These include dataset histograms [52], taxonomies, similarity matrices [53], temporal progression plots, word clouds, and others. Multiple taxonomies of transportation from public, industry, and academic views were extracted using automatic clustering of datasets. Figure 1 depicts a high-level combined multi-perspective taxonomy of transportation as viewed by the public, industry, and academia. The first and second level branches in the figure show the discovered macro-parameters and parameters, respectively.
The findings related to a multi-perspective view (public, governance, political, industrial, and academic) of transportation show that there are many important problems such as transportation operations and public satisfaction that industry and academia seem to ignore, or perhaps if they do focus on them, the solutions do not achieve measurable results from the policymakers and industrialists. We can also see that academia produces much broader and deeper knowledge on the subject, while many important issues such as pollution are not publicised. Our deep journalism approach could find the gaps and highlight them for the public and other stakeholders.
The validation of our results can be considered internal or external. The internal validation is performed by investigating whether the articles and documents belonging to a certain parameter are related to the parameter. We have provided discussions on many articles in each dataset as to how those articles relate to the parameters. The external validation is performed by comparing parameters, keywords, and quantitative metrics across the three datasets (i.e., the three perspectives of transportation). The external validation is also performed by using sources other than the three dataset sources. Moreover, both the internal and external validation is performed using the depictions produced by various visualisation methods.
Further details on the methodology and design of our deep journalism approach and the DeepJournal tool are presented in Section 3.

1.4. Broader Aim, Novelty, and Contributions

The broader aim of our work is to investigate the use of ICT technologies for solving pressing problems in smart cities and societies. Specifically, in this paper, we investigate the use of deep learning and digital methods to discover and analyse cross-sectional multi-perspective information to enable better decision making and develop better instruments for academic, corporate, national, and international governance. The contributions of this paper can be summarised as follows.
  • We investigated the use of deep learning and big data analytics methods in transportation and show that important parameters related to the design and operations and the broader environmental parameters can be automatically discovered using cutting-edge technologies. The parameters can be discovered from multiple perspectives involving specific foci, stakeholders, etc. The transportation sector is used as a case study, and the approach can be applied to other sectors. Important parameters and insights are reported and explained.
  • We discovered 25 parameters and 6 macro-parameters for transportation from the public, governance, and political perspectives using a newspaper, The Guardian.
  • We discovered 15 parameters and 5 macro-parameters for transportation from an industrial perspective using a transportation magazine, Traffic Technology International (TTI).
  • We discovered 49 parameters and 6 macro-parameters for transportation from an academic perspective using the well-known database of scientific literature, Web of Science.
  • We built three datasets specifically for the work presented in this paper. These datasets will be provided openly to the community for further research and development.
  • We brought the three analytics from multiple perspectives together and introduced and investigated the novel concept of deep journalism that could be applied to any problem, sector, or domain.
  • We developed a complete big data analytics tool, DeepJournal Version 1.0, from scratch for this purpose. The tool is general and can be used on other datasets and sectors.
  • We elaborated on 89 transportation parameters and hundreds of dimensions reviewing 400 technical, academic, and news articles.
The literature review (Section 2) establishes that this work is novel in several respects: the proposed scheme of deep journalism, the developed digital methods and tools for the purpose, the use of three (or more) data sources to create a multi-perspective view of the transportation sector, the three datasets, the specific findings, and more.

1.5. Journalism, Citizen Journalism, and Deep Journalism

The public in many parts of the world is frustrated with their governments regarding the governance of social, economic, and other aspects of public lives. The public trust in governments has declined sharply with the emergence of phenomena such as kleptocracy, partisanship, and populism leading to extremism in our societies [54,55]. The main issues are related to the public’s perception that the responsibility to provide impartial information and ideal governance lies with other people and not themselves. The American Press Institute defines the purpose of journalism as ”to provide citizens with the information they need to make the best possible decisions about their lives, their communities, their societies, and their governments” [56]. Traditional journalism has failed at this purpose due to many reasons such as difficulty in maintaining the freedom and impartiality of media organisations and funding cuts, leading to public mistrust [57,58]. This is, for instance, highlighted by the UN News with a statement by UN Secretary-General, António Guterres, “at a time when disinformation and mistrust of the news media are growing, a free press is essential for peace, justice, sustainable development, and human rights” [59]. The distrust of traditional journalism coupled with the rise of the Internet, digital technologies, and digital and social media has given rapid rise to citizen journalism, i.e., journalism by the general public particularly using digital and social media [60,61,62,63,64]. Citizen journalism has also been referred to as public journalism, democratic journalism, participatory journalism, and other names.
Citizen journalism is complex due to its multifaceted, multidimensional, multilevel, and multimodal nature [65]. It is multifaceted due to its embrace of “a wide array of societal institutions, organisations, groups, and social actors at the intersection between journalism, community, and democracy”. It is multidimensional due to it “embracing not only news production and creation but also news consumption and sharing, thus, generating interactive processes among news producers, consumers, and citizens”. It is multilevel due to it “comprising journalists, sources, and news audiences at the individual level (micro-level), news organisations and other societal institutions at the organisational level (meso-level), and interorganisational networks in local communities and beyond (macro-level)”. It is multimodal because it operates “across diverse communication platforms and channels” including radio, television, Internet, social media platforms, and more [65].
While citizen journalism solves some of the problems of traditional journalism, it comes with its own problems such as subjectivity and potentially lacking regulations, standards, quality, and responsibility [66,67,68]. The responsibility to maintain ideals lies with all people, and therefore, everyone has the responsibility and needs to work towards upholding honesty, sincerity, equity, freedom, and other ideals. Traditional and citizen journalism need to work together, and their problems need to be resolved collaboratively by the public.
Regarding journalism, the specific aim of this paper is to contribute to this area of journalism and help improve it through academic integrity and rigour. Academics should be in the vanguard of objective information, sincerity, impartiality, equity, and other ideals. Academics should search, pursue, propagate and defend these ideals. If the academics fail to do so, then the responsibility lies with common people to pursue and be in the vanguard of the ideals needed to maintain a free society. The idea of deep journalism is to make impartial, cross-sectional, and multiperspective information available, to bring rigour to journalism by nurturing responsibility in people by making it easy to generate information for the public benefit using deep learning, and to make tools and information available to common people so they can search and defend the ideals of freedom, including social, environmental and economic sustainability.

1.6. Software and Hardware

The work reported in this paper was developed on the Aziz supercomputer that comprises a total of 500 CPU, GPU, and Intel MIC nodes. In addition, we also used Google Colab to run some experiments. Specifically, we used an Nvidia V100 GPU with 32 GB RAM, which combines 5120 CUDA cores and 640 Tensor cores for deep learning and other HPC loads. The V100 has a double performance of 7.066 TFLOPS and a single performance of 14.13 TFLOPS. The software and platforms used in this work include Python as the programming language, along with Pandas [69], Numpy [70], BERTopic [71], NLTK [72], Scikit-Learn [73], Gensim [74], SentenceTransformer, and PyTorch [75]. The data visualisation libraries used in this work include Seaborn [76], Plotly [77], and Matplotlib [78].

1.7. Section Organisation

The rest of the paper is structured as follows. Section 2 reviews the related works and establishes the research gap. Section 3 describes the deep journalism methodology and the design of our tool. Section 4 introduces and discusses the parameters for public, governance, and politics. Section 5 and Section 6 discuss the parameters for industry and academia, respectively. Section 7 provides discussion. Section 8 concludes and gives directions for future work.

2. Literature Review

We discuss in this section the works related to the proposed work in this paper. We conducted an extensive review of academic research on the use of artificial intelligence (AI) and data analytics for transportation. We did not find any work directly related to our paper. However, to place our work in the context of the overall body of work on data analytics in transportation, we review works in three areas. First, we discuss studies related to the use of AI and machine learning for transportation. Subsequently, we review research works that analyse and detect transport-related events by using social media data. Finally, we discuss works on the scientometric analysis of the general transportation literature, including scientometric analysis studies on specific areas of transportation.
Researchers have used machine learning for different problems in transportation. For example, a large body of work on the use of deep learning is in object detection, environment perception, health effect, resilience in transport, etc [79]. For example, Wang et al. [80] proposed a model MobileNetv1_yolov3lite to detect objects and speed in real-time. Zhu et al. [81] presented an overview of datasets, evaluation criteria, and future work on environment perception, i.e., vehicle tracking, scene understanding, traffic sign detection, lane and road detection, etc. for intelligent vehicles. Deep learning has also been used for many transport modelling problems, including collaborative decision making for environment perception [82], incident detection [83], disaster management [84], rapid transit systems for megacities [85], and traffic flow modelling [86]. Some other research works are on traffic flow prediction [87], autonomous vehicles [88], vehicular networking [89], automatic license plate recognition [90], crash prediction [91], and others.
Researchers have also used various social media data to analyse and detect different events to discover and solve transportation issues. For example, Alomari et al. [92] used a tool and machine learning algorithms for traffic event detection by using a total of 2,511,000 tweets and transportation-related concerns detection during the COVID-19 pandemic [93]. Later, in another study, they [16] used 33.5 million tweets for event detection and road traffic social sensing by using distributed machine learning algorithms. Their research demonstrated Twitter’s efficacy in spotting major occurrences without previous information. Suma et al. used a big data tool for automatic event detection [94] from Twitter data and also used apache spark to automatically detect and validate the events [95]. Traffic incident detection is another challenge for the transportation system. Zhang [96] proposed LDA and a clustering-based algorithm to detect traffic incidents by using the Twitter dataset. They used the Carlo K-test to validate their research outcomes. There is other research on using social media datasets for various topics in transportation such as transportation planning and management, the traffic monitoring system, traffic event detection, etc. Wang et al. [97] proposed a traffic management system (i.e., traffic alert and warning) using Twitter data and the LDA topic modelling algorithm. In 2020, a BERT-based automatic traffic alert system was developed by Wan et al. [98]. The authors used Twitter data to evaluate their system. Additionally, they implemented a question-answering model to extract the location, time, and nature of the traffic events.
The works that can be considered more related to this paper are those where researchers used scientometric analysis for transportation-related topics. For example, Heilig et al. [99] used scientometric analysis to perform a study on academic research on public transportation, which offers better knowledge of articles, authors, countries, and keywords based on citation information. They used 7868 research articles with 160,132 references from 2009 to 2013. This is the only work that looked into the transportation area as a whole. All other works on scientometric analysis have focused on specific topics in transportation, and these are discussed in the following paragraph.
Das et al. [100] analysed 15,357 paper abstracts from 7 years of Transportation Research Board (TRB) yearly meetings (2008–2014) by using LDA to show the research patterns and intriguing histories of transport research. Sun and Yin [101] proposed an LDA-based topic modelling approach to find the research topics and temporal information over the last 25 years of transportation. They collected transport-related abstracts of 17,163 articles from 22 journals between 1990 and 2015 and applied LDA to discover 50 key academic research topics. In 2021, Putri et al. [102] proposed a systematic review of ITS by using the LDA and named entity recognition. They retrieved 23,823 titles and abstracts from the Scopus database between 1974 and 2020. Their research findings include the evolution of ITS development and related research areas. Some other research work has been conducted on several transport-related topics. For example, road safety is a significant component of the transportation system. Zou et al. [103] presented a scientometric analysis to reveal the core research area of road safety. The authors found that road safety studies focused mostly on driver psychological behaviour, prevention of traffic accidents, the impact of driver risk factors, and the analysis of the consequences and frequency of road crashes. In another research study, Gao et al. [104] presented a scientometric analysis on traffic safety sign research from 1990 to 2019. The authors collected 3102 articles from the Web of Science database and used Citespace to analyze and visualise the research domain. They discovered that most of the research had been conducted in the last 10 years. Their research also found that the United States is in the lead position in traffic sign research. AV is the most heavily researched topic to improve the transportation system. A scientometric analysis on autonomous vehicles was conducted by Faisal et al. [105]. They collected a total of 4645 research articles between 1998 and 2017 to perform the scientometric analysis. Their research presented the development of AV systems by analyzing the authors, affiliations, citations, and publications in AV research.

Research Gap

The literature review shows that the existing research on the use of machine learning in transportation has mainly focused on autonomous vehicles, object detection, and others. There are some works on social media data analysis for detecting events in transportation. The very few works that have focused on scientometric analysis are very different from our work. We did not find any research papers that have used newspapers, transport magazines, and academic research articles altogether. Our work is novel in several respects: the proposed scheme of deep journalism, the developed digital methods and tools for the purpose, the use of three (or more) data sources to create a multiperspective view of the transportation sector, the three datasets, the specific findings, and more.

3. DeepJournal V1.0: Methodology and Design

The proposed system methodology and design is depicted in Figure 2 to analyse contextual topics that discover the transportation issues, challenges, development, and future planning by using newspaper, magazine, and research article abstracts. The software architecture consists of four software components which are described in the following subsections. The methodology overview, including the master algorithm, is provided in Section 3.1. In this research, we use d three types of data sources named The Guardian, Traffic Technology International, and Web of Science. Section 3.2, Section 3.3, Section 3.4 and Section 3.5 summarise these three data sources, discuss the data collection algorithm, and describe the datasets. Section 3.6, Section 3.7, Section 3.8 and Section 3.9 cover data preprocessing, parameter modelling, parameter discovery and quantitative analysis, and validation and visualisation, respectively.

3.1. Methodology Overview

Algorithm 1 outlines the master algorithm where the inputs are the search queries and website URLs which are needed for the data collection. The dataset was collected using the web scraping technique and stored in a CSV file. Then, the CSV file was loaded into the Pandas data frame, and the articles were passed to the data preprocessing function which removes duplicate articles, accomplishes tokenisation, removes irrelevant characters and stop words from the articles, and performs lemmatisation with allowed POS (part-of-speech) tags, i.e., noun, adjective, verb, and adverb and generates cleaned tokens. After that, a pretrained BERT (bidirectional encoder representations from transformers) [44] word embedding model was used to capture the contextual relations between the words. Subsequently, we used the UMAP (uniform manifold approximation and projection) [45]/which is a dimension reduction technique, HDBSCAN (hierarchical density-based spatial clustering of applications with noise) [46] which is a clustering algorithm and a class-based TF–IDF (term frequency–inverse document frequency) score to calculate the importance of words for each cluster. Additionally, we reduced the number of clusters by merging the most similar clusters. After that, we saved the clustering model and assigned the cluster to each article. Then, the clusters were relabelled as parameters and  the parameters were grouped into macro-parameters using the domain knowledge along with a similarity matrix, hierarchical clustering, and other quantitative analysis methods. Finally, we visualised and validated the parameters against external and internal sources.
Algorithm 1 Master Algorithm
Input:   searchQuery , weblink
Output:  article with lebelled parameter and visualization
  1:
C S V _ f i l e d a t a C o l l e c t i o n ( s e a r c h Q u e r y )
  2:
a r t i c l e _ D F r e a d _ C S V ( C S V _ f i l e )
  3:
p r o c e s s _ a r t c l e d a t a P r e P r o c e s s i n g ( a r t i c l e _ D F )
  4:
w o r d _ e m b e d d i n g c r e a t e B E R T _ E m b e d d i n g ( p r o c e s s _ a r t c l e )
  5:
u m a p _ e m b e d d i n g d i m e n s i o n R e d u c t i o n ( w o r d _ e m b e d d i n g )
  6:
H D B S C A N _ c l u s t e r i n g d i m e n s i o n R e d u c t i o n ( u m a p _ e m b e d d i n g )
  7:
c a l c u l a t e _ C l a s s T F I D F c l u s t e r i n g ( H D B S C A N _ c l u s t e r i n g )
  8:
c l u s t e r s c l u s t e r R e d u c t i o n ( c a l c u l a t e _ C l a s s T F I D F )
  9:
m o d e l s a v e M o d e l ( B E R T C l u s t e r i n g M o d e l )
 10:
p a r a m e t e r s r e l a b e l l e d ( c l u s t e r s )
 11:
p a r a m e t e r _ v i s u a l i z a t i o n ( p a r a m e t e r s )

3.2. Data Collection

We used three types of data sources in this research: The Guardian (newspaper), Traffic Technology International (magazine), and the Web of Science (academic research). We utilised web scraping techniques (i.e., Python, BeautifulSoup, Requests, and Pandas) to obtain the The Guardian and TTI datasets from their corresponding websites. We collected the Web of Science dataset from its website as it allows users to download the dataset as a CSV format. We discuss the data collection steps for The Guardian, Traffic Technology International, and Web of Science in Section 3.3, Section 3.4 and Section 3.5, respectively.

3.3. Dataset: Newspaper Articles (The Guardian)

The newspaper dataset was collected from the UK-based newspaper The Guardian from September 1825 to January 2022. We retrieved all transport-related articles from the website using the web scraping technique and collected about 14,855 articles.
Algorithm 2 shows the steps of the data collection process. Initially, we used “transport” keywords to search for the related articles on the website. After that, we passed the web link to the newspaper as a parameter in the algorithm. We divided our data collection methodology into two functions: article link collection and data collection. In the first function, after acquiring all the links from the web page content, we removed the irrelevant links and saved the links as a data frame. In the data collection function, we analysed the HTML and JavaScript code to obtain the article, date, and headline from the web page content. For each news article, we acquired the related heading and publication date. We saved the data in a data frame and finally saved the data frame into a CSV file. After retrieving the articles, we encountered a few duplicate articles. We eliminated all duplicate articles, resulting in 14,381 unique articles from The Guardian.
Algorithm 2 Data Collection (The Guardian)
Input: searchQuery, weblink
Output: CSV file
  1:
functionarticlelink( w e b l i n k )   ▹ weblink: https://www.theguardian.com/uk/
  2:
     p a g e s length(totalPage)          ▹ total web page after searching
  3:
    for  p a g e N u m b e r 1 to p a g e s  do
  4:
         u r l weblink/transport?page=pageNumber
  5:
         c o n t e n t obtain content from URL
  6:
         l i n k s _ D F save links as DataFrame from content ▹ remove irrelevant links
  7:
    end for
  8:
end function
  9:
functiondatacollection( l i n k s _ D F )
 10:
     l i n k s length(links_DF)
 11:
    for  p a g e N u m b e r 1 to l i n k s  do
 12:
         c o n t e n t obtain content from link
 13:
         a r t i c l e obtain article from content
 14:
         h e a d l i n e obtain headline from content
 15:
         d a t e obtain publication date from content
 16:
         g u a r d i a n _ D F article, headline, date
 17:
         g u a r d i a n _ C S V guardian_DF
 18:
    end for
 19:
end function
Figure 3 shows the histogram of The Guardian news articles. The y-axis indicates the number of news articles for the increasing word count per news article. We noticed that the prevalent length of news articles was 200–500 words. The number of news articles that contained more than 800 words was relatively small. The maximum number of words in a document was 8341. For more visual understanding, the zoomed portion inside the graph is shown. The figure also shows the density against the increasing number of words per news article. The maximum density is around 0.0016.

3.4. Dataset: Technology Magazine Articles (Traffic Technology International)

TTI stands for Traffic Technology International which is a popular magazine related to the latest transport technology. From February 2015 to January 2022, we gathered 10,620 articles from all categories on the TTI website using the web scraping approach.
Algorithm 3 shows the steps of the data collection process. We divided the algorithm into two functions: article link collection and data collection. In the beginning, we passed the web link to the article link collection function. We used two loops, where the first loop was for the category list and the second loop was for the total web page number for each category. We used a dictionary-type variable to store the category as a key and the total web page number for that category as a value. After obtaining all the links from the web pages, we removed the irrelevant links and saved the links as a data frame. In the data collection function, we analysed the HTML and JavaScript code to obtain the article, publication date, and headline from the web page content. For each news article, we received the related heading and publication date. We saved the data in a data frame and finally saved the data frame into a CSV file. After saving the data, we found a lot of duplicate data as some articles are common in multiple categories.Therefore, we removed the duplicate articles from the dataset, and finally, we found 5193 unique articles.
Algorithm 3 Data Collection (Traffic Technology International)
Input: weblink
Output: CSV file
  1:
functionarticlelink( w e b l i n k ) ▹ weblink: https://www.traffictechnologytoday.com/
  2:
     c a t e g o r y L i s t list of the category
  3:
     p a g e s D i c t dictionary type variable (key: category, value:pages number)
  4:
    for  c a t e g o r y 1 to l e n g t h ( c a t e g o r y L i s t )  do
  5:
        for  p a g e N u m b e r 1 to p a g e s D i c t [ c a t e g o r y L i s t [ c a t e g o r y ] ]  do
  6:
            u r l weblink/news/categoryList[category]/page/pageNumber
  7:
            c o n t e n t obtain content from URL
  8:
            l i n k s _ D F save links as DataFrame from content ▹ remove irrelevant links
  9:
        end for
 10:
    end for
 11:
end function
 12:
functiondatacollection( l i n k s _ D F )
 13:
     l i n k s length(links_DF)
 14:
    for  p a g e N u m b e r 1 to l i n k s  do
 15:
         c o n t e n t obtain content from link
 16:
         a r t i c l e obtain article from content
 17:
         h e a d l i n e obtain headline from content
 18:
         d a t e obtain publication date from content
 19:
         T T I _ D F article, headline, date
 20:
         T T I _ C S V TTI_DF
 21:
    end for
 22:
end function
Figure 4 depicts the histogram of the Traffic Technology International magazine articles. The y-axis and x-axis demonstrate the number of magazine articles and the increasing word count for magazine articles, respectively. The majority of magazine articles were between 300 and 450 words and 500 to 600 words (see graph peaks).The number of news articles that contained more than 600 words was relatively small. The maximum number of words in a document was 2323. The magnified plot inside the figure is presented for the convenience of the reader. The graph also depicts the density in relation to the increasing quantity of words per magazine article. The highest density is around 0.005.

3.5. Dataset: Academic Articles (Web of Science)

We obtained the most pertinent documents from the Web of Science, the most comprehensive database with a consistent query language and data format. Furthermore, it facilitates access to subject indexes, citation indexes, and other databases from other disciplines which assists in the discovery of relevant research and the evaluation of its findings. We collected 21,446 research articles by using “transportation” keyword from several Web of Science categories, for example, transportation science technology, engineering electrical electronics, transportation, environmental science, telecommunications, economics, computer science information system, business, etc. The document type was limited to proceedings papers, articles, and review articles. Excluded were publications produced from news items, corrections, book chapters, data papers, book reviews, letters, editorial materials, and so on. Furthermore, we narrowed our search filtering option to the English language and the publishing years 2000–2022. In addition, we utilised advanced search and selected the “topic search” option which yielded results from the title, abstract, and keywords columns.
Figure 5 illustrates the histogram of the Web of Science research article abstracts. The y-axis and x-axis show the number of article abstracts as well as the increasing word count for article abstracts. The majority of article abstracts contained between 150 and 250 words. A few article abstracts had more than 450 words. The number of article abstracts that contained more than 400 words was relatively small. The maximum number of words in an article abstract was 1132. The magnified plot inside the figure is presented for the convenience of the reader. The graph also shows the density in relation to the increasing quantity of words per article abstract. The highest density is around 0.006.

3.6. Data Preprocessing

We employed the same preprocessing algorithm for the three datasets. Algorithm 4 shows the preprocessing steps as follows: (1) remove duplicate articles, (2) remove irrelevant characters, (3) tokenisation, (4) stop word removal, and (5) lemmatisation with POS tags. In the beginning, we read the CSV file using the Python package “Pandas” and saved it as a data frame (DF). In the second step, we removed all duplicate data to reduce the data redundancy, and in the third step, we removed all irrelevant characters, for example, several Unicode characters, from the texts. Furthermore, in the fourth step, we tokenised the texts using the simple_preprocess function, which is included in the Python package called “gensim”. The fifth step was to remove the stop words from the article. Initially, we used the NLTK predefined stop words list for clustering and implemented the BERT parameter model. After getting the parameter from the BERT parameter model, we reviewed the corresponding keywords and explored the unnecessary keywords that were obtaining a high probability score in the parameter. After some testing, we finalised a list of stop words that did not carry significant importance for generating parameters. As a result, in our final model, we added those keywords to the stop words list and removed them from the articles. In the final step of data preprocessing, we used lemmatisation using the “Spacy” engine and allowed only four types of parts of speech tags, including noun, verb, adjective, and adverb. After the preprocessing step, we obtained the cleaned articles, which were used for parameter modelling.
Algorithm 4 Data Preprocessing
Input:  a r t i c l e s
Output:  cleanarticles
 1:
a r t i c l e _ D F r e a d _ C S V ( C S V _ f i l e )
 2:
r d _ D F r e m o v e D u p l i c a t e ( a r t i c l e _ D F )
 3:
r i c _ D F r e m o v e I r r e l e v a n t C h a r a c t e r s ( r d _ D F )
 4:
t o k e n _ D F t o k e n i z e r ( r i c _ D F )
 5:
r S W _ D F r e m o v e S t o p W o r d s ( t o k e n _ D F )
 6:
l e m m a _ D F l e m m a t i z a t i o n ( r S W _ D F )
 7:
c l e a n _ D F c l e a n A r t i c l e ( l e m m a _ D F )

3.7. Parameter Modelling

We utilised the BERT topic modeling method [71] to cluster the data and discover parameters. At the beginning of parameter modelling, we generated a word-embedding model using the BERT (Bidirectional Encoder Representations from Transformers), which is a transformer-based approach developed by Google [44]. Word embedding is a low-dimensional, dense vector representation of words, and BERT develops contextual embeddings. In this paper, we used the pretrained “distilbert-base-nli-mean-tokens” model as it maintains the balance between performance and execution time. We implemented a dimensional reduction algorithm, UMAP, to keep the maximum information in a lower dimensionality. Furthermore, we used HDBSCAN to group identical articles together that define a cluster or parameter. HDBSCAN is a density-based approach that complements UMAP effectively, considering UMAP retains a range of local structures even at lower dimensionality. Additionally, HDBSCAN does not compel data points to clusters since they are considered outliers.
Furthermore, a class-based TF–IDF (term frequency–inverse document frequency) score was used to calculate the importance of words for each parameter. By determining the frequency of a word in a given document as well as the measure of how prominent the word is in the entire corpus, TF–IDF provides a means of comparing the relevance of words between documents. However, if we consider all documents in a single group as a distinct document and then execute TF–IDF, we will achieve significance scores for words inside a cluster. This significance score is called the c-TF–IDF score. The more significant the words inside a cluster, the more representative the parameter. As a result, we can obtain keyword-based descriptions for every parameter. Equation (1) [50] describes the formula of the c-TF–IDF score, where f is the frequency of each word derived for each class c and divided by the number of words w. The total number of unjoined documents (d) is then divided by the total frequency of words (f) throughout all classes (cc).
c T F I D F c = f c w c × log d p c c f p
We fit all of the articles and trained the BERT parameter model after obtaining the c-TF–IDF. The number of parameters was then decreased by recalculating the articles’ c-TF–IDF matrices and then iteratively merging the most often occurring parameter with the most similar one based on the respective c-TF–IDF matrices.
Finally, we assigned parameters to all the articles and saved the model. As the parameter was originally represented as an integer number, we further scrutinised the corresponding parameter articles and relabelled the parameters and aggregated them into macro-parameters using domain knowledge and quantitative analysis methods which are discussed in the next section.

3.8. Parameter Discovery and Quantitative Analysis

We discovered the parameters and macro-parameters using domain knowledge and quantitative analysis methods (i.e., term score, keyword score, intertopic distance, hierarchical clustering, and similarity matrix).

3.8.1. Term Score

A list of keywords (terms) for each parameter does not express the context of the related parameter in the same way. To find a parameter, we must first determine how many keywords are required, as well as the starting and finishing positions of significant keywords. We visualised the keywords c-TF–IDF score for each parameter by sorting them in decreasing order [71]. This term score visualisation has a significant influence on identifying the parameter.

3.8.2. Intertopic Distance Map

The intertopic distance map is a two-dimensional representation of the parameters, with the area of the parameter circles proportional to the number of words in the dictionary associated with each parameter. The circles are formed using a MinMaxScaler algorithm depending on the words they contain, with parameters closer together sharing more words [71].

3.8.3. Keyword Score

In the BERT parameter model, we obtained a set of keywords representing a parameter, where each keyword has an importance score or c-TF–IDF score (see Section 3.7) that describes the context of the parameter.

3.8.4. Hierarchical Clustering

Hierarchical clustering systematically pairs the parameters based on the cosine similarity matrices between the parameter embeddings [71]. By systematically pairing clusters, hierarchical clustering assembles a unique cluster of nested clusters. At each phase, beginning with the correlation matrix, all clusters are attempted in all possible pairs, and the pair with the greatest average inter-correlation within the experimental cluster is chosen as the new unique cluster.

3.8.5. Similarity Matrix

The similarity matrix was visualised as a heatmap using the Plotly library in Python to show the similarity between parameters based on the cosine similarity matrix [71]. We computed the similarity matrix by calculating the cosine similarity score between the parameters embedding to show the relationship between the parameters. We have used Plotly “BnGu” (green to blue) as the continuous color scale where the dark blue color represents the highest similarity relationship between parameters, while the light green represents the lowest similarity.

3.9. Validation and Visualisation

The validation of our results can be considered to be internal or external. The internal validation was performed by investigating whether the articles and documents belonging to a certain parameter are related to the parameter. We have provided discussions on many articles in each dataset as to how those articles relate to the parameters. The external validation was performed by comparing parameters, keywords, and quantitative metrics across the three datasets (i.e., the three perspectives of transportation). The external validation was also performed by using sources other than the three dataset sources. Moreover, both the internal and external validation were performed using the depictions produced by various visualisation methods.
A range of visualisation methods were used to elaborate on the datasets, document clusters, and the discovered parameters. These include dataset histograms [52], taxonomies, similarity matrices [53], temporal progression plots, word clouds, and others. For example, we visualised the temporal progression for both parameters and macro-parameters. Initially, we merged the similar representable parameters and then counted the number of articles (intensity) by grouping the parameters and article publication year. Consequently, we obtained a list of intensities for each parameter with specific years. After that, we sorted the list according to the year and plotted the intensity against the year for each parameter. We also plotted the macro-parameter temporal progression in the same way by integrating the parameters of each macro-parameter.
We used several python libraries for these visualisations including Seaborn, Plotly, and Matplotlib.

4. Public, Governance and Politics: Transportation Parameters Discovery

In this section, we discuss the parameters detected by our BERT model from The Guardian dataset. The parameters are grouped into six macro-parameters. We provide an overview of the parameters and macro-parameters in Section 4.1. The quantitative analysis is discussed in Section 4.2. Subsequently, we discuss each macro-parameter in separate sections, Section 4.3, Section 4.4, Section 4.5, Section 4.6, Section 4.7 and Section 4.8. Finally, Section 4.9 discusses the temporal analysis of the parameters and macro-parameters.

4.1. Overview and Taxonomy (The Guardian)

We detected a total of 25 parameters from The Guardian dataset using BERT. These 25 parameters were grouped into 6 macro-parameters using the domain knowledge along with similarity matrix, hierarchical clustering, and other quantitative analysis methods. The methodology and process of the discovery of parameters and their groupings into macro-parameters have already been discussed in Section 3.
Table 1 lists the parameters and macro-parameters of The Guardian dataset. The parameters are categorised into 6 macro-parameters, including road transport, rail transport, air transport, crash and safety, disruptions and causes, and employment rights, disputes, and strikes (Column 1). The parameters are listed in Column 2, where some of them are merged. For example, Parameters 9 and 4 have been combined into a single parameter, rail projects and contracts. The third column indicates the cluster number. The percentage of the number of articles is recorded in the fourth column. Our BERT model labelled 50.5% of articles as the outlier clusters. The outlier clusters are more analogous to the average article compared to any of the other clusters. Consequently, we ignored these clusters, and the rest of the 49.5% of articles are listed in the fourth column. The fifth column represents the top keywords associated with each parameter.
Figure 6 provides a taxonomy of the transportation domain extracted from a newspaper-focused on public, governance and politics. The taxonomy was created using the parameters and macro-parameters discovered from The Guardian. The first-level branches show the macro-parameters, the second-level branches show the discovered parameters, and the third-level branches show the most representative keywords.

4.2. Quantitative Analysis (The Guardian)

This section discuss the term score, word score, intertopic distance map, hierarchical clustering, and similarity matrix.
Each parameter is represented by a group of keywords, although not all of these words describe the parameter equally. The term probability declined representation depicts how many keywords are required to describe a parameter and when the benefit of adding more keywords begins to diminish (see Section 3.8). When we assess the keywords, only the top 7 to 10 terms in each parameter accurately describe the parameter, as shown in Figure 7. Because all of the other probabilities are so close to one another, ranking them becomes more or less useless. When we analysed the top keywords per parameter to discover the parameter, we used this information to focus on the top seven or so keywords in each parameter.
Figure 8 depicts the top five keywords for each parameter. The keywords are sorted based on the importance score, or c-TF–IDF score (see Section 3.8). There are 25 subfigures, and in each subfigure, the horizontal line indicates the c-TF–IDF scores, and the vertical line indicates the keywords. For example, the first subfigure is the airport expansion parameter, which is represented by the five keywords such as runway, airport, Heathrow, expansion, and government, having 0.07, 0.05, 0.49, 0.39, and 0.26 scores, respectively.
Figure 9 shows the intertopic distance map (see Section 3.8), where six macro-clusters are separately identified.
Figure 10 describes the hierarchical clustering of the 25 clusters and systematically pairs the clusters based on the similarity matrix (see Section 3.8). We noticed that clusters No. 6, 3, 9, 2, and 4 created a unique cluster that we labelled as the rail transport parameter.
Figure 11 visualises the similarity matrix among the parameters (see Section 3.8). Note the dark blue colour between clusters 22 and 16 which showed a high similarity score because both clusters 22 (train, carriage, and crash) and 16 (police, crash, and accidents) have high resemblance. For example, whenever a train or carriage crash happens, at that time there is a high possibility of an accident, and police might react at that time.

4.3. Road Transport

The macro-parameter road transport includes the following parameters: congestion and road charging; pollution and electric vehicles, fuel and SCM (supply chain management), cycling, cycling safety, and bus transport.

4.3.1. Congestion and Road Charging

The congestion and road charging parameter concerns road congestion and the imposed congestion charging to address the congestion. It is represented by keywords (detected by our model) such as road, congestion, traffic, charge, scheme, car, and city. Looking at the news articles that belong to this parameter we were able to find a number of topics that capture various dimensions of this parameter. These include congestion charging [106], traffic reduction and management [107], smart roads [108], parking [109], walking [110], cycling [111], congestion charge for non-residents [112], e-scooters [113], etc. For example, Harvey reports in a Guardian article [114] that the traffic congestion levels in September 2020 in outer London increased above the prepandemic (COVID-19) lockdown levels in 2019. The article also shows the impact of congestion charging on outside central London and central London traffic between prepandemic, 2019, traffic and 2020.

4.3.2. Pollution and Electric Vehicles

The pollution and electric vehicles parameter captures various dimensions of transportation from The Guardian. These dimensions and related news include high air pollution and fears of high risks for COVID-19 infection [115], London being the worst city in Europe in terms of the damages to health due to air pollution [24], inadequacy of electric vehicle reforms alone in solving the pollution problem and the need for holistic solutions [116], the proposed increase in diesel and petrol vehicle prices to curb pollution [117], UK cities delaying creating clean air zones supposedly for COVID-19 excuses [118], the fall in air pollution levels in London by 50 percent through anti-pollution measures reported in April 2020 [119], the UK to introduce E10, a high-ethanol fuel, to cut pollution [120], the UK’s plans to ban diesel and petrol vehicles by 2035 or even earlier [121], Bristol’s plan (late 2019) to ban diesel vehicles [122], Oxford’s plan (late 2017) to become the first zero emissions area in the world [123], charging station deserts and monopoly [124], opening of first all-electric vehicle charging station [125], Tesla struggling in the US, asking funds from government [126], a 2008 article on myths about renewable energy [127], the concerns that despite electric and hybrid car sales the emission gains are only 1% between 2011 and 2021 [128], and many more news and topics. The parameter includes the following keywords detected by our model: car, vehicle, emission, diesel, pollution, fuel, electric, petrol, carbon, and hydrogen.

4.3.3. Fuel and SCM (Supply Chain Management)

The fuel and SCM (Supply Chain Management) parameter contains keywords fuel, oil, price, petrol, driver, duty, tax, government, shortage, car, and rise. Many news articles in this parameter are about fuel prices, shortages, crises, [31,129], and costs of supply chains [130,131,132]. For example, a Guardian article [133] dated 17 November 2021 discussed the rising costs affecting all streams of businesses featuring case studies on agriculture, farming, hospitality, transport (individuals, small and large businesses), manufacturing, and retail. We found in this parameter a fascinating article on just-in-time supply chains by Kim Moody [134], Moody writes, “Decades of deregulation, privatisation and market worship have left society vulnerable to the unbidden force of “just-in-time” supply chains. No amount of government subsidies, ...will be enough to address the crises we face, from the pandemic to climate breakdown, ...Now is the time to think about not just how we make and consume things, but also how we move them ”. Moody discusses how we became used to a ‘just-in-time world’, while not appreciating the complexity of it, including cross-continent shipping, fuel price variations, floods, closed roads, last-mile delivery people and their well-being, and the most important, the triple bottom-line effects of all of it.

4.3.4. Cycling

The cycling parameter captures the transportation issues associated with cycling and bikes, an issue that has become important due to climate and health. It includes the following keywords: bike, cycling, cycle, cyclist, city, ride, road, bicycle, route, lane, scheme, year, car, traffic, transport, way, safe, work, street, and day. The parameter discloses several important dimensions of cycling through The Guardian news articles, including the planned 5000 miles of dedicated cycle routes in the UK announced in June 2000 and supported by the charity Sustrans [135], barring charity cyclists from using new trains [136], the increase in the number of bikes and rise of the ’born-again bikers’ in the UK, covered in February 2004 [137], ministers setting examples for bike usage in 2004 [138], a major rise of weekend cycling in the UK [139], the loss of a legal case made by cycling and rambling campaigners to prohibit vehicle driving in the Lake District [140], funding to nurture increased walking and cycling in the UK [141], cycle thefts [142], the rise of cycling holidays [143], a new 500-mile cycle route network in West Midlands, UK [144], cycling with young children [145], Uber launching electric bikes for hire in Islington borough [146], and more.

4.3.5. Cycling Safety

The parameter cycling safety is about the risks and safety of cycling due to vehicles and other hazards on the road. Our model detected the following keywords for the parameter: cyclist, cycle, road, bike, cycling, death, kill, pedestrian, traffic, ride, safety, accident, driver, year, lorry, safe, helmet, injury, lane, and number. This parameter captured some issues related to road accidents in general, from the early 2000s such as higher accident risks for children from deprived areas [147] and the use of explicit graphic accident images in ads to nurture road safety [148], but the parameter was dominated by road risks and safety for cyclists. Examples include the increase in cyclist deaths in the UK in 2020 [149]; advice on keeping safe while cycling [150]; cheaper insurance for drivers who take cycle training to improve cyclist safety [151]; concerns that pavements are being used for cycle stands and other purposes, causing problems for pedestrians [152]; the possibility that Great Britain could become a great cycling nation, but road safety is a hurdle [39]; and more.

4.3.6. Bus Transport

The parameter bus transport is represented by keywords including bus, service, route, local, public, passenger, and operator. The parameter captures bus transport issues in the UK, though most of these are applicable to other countries in one way or another. The dimensions and issues of bus transport include schemes from the government to provide cheaper bus fares for pensioners introduced in August 2000 [153]; government-hired pensioners in 2000 to go undercover and check bus service quality [154]; the proposals in late 2002 to scrap cheaper fares for pensioners and instead provide for jobless and students [155]; better employment conditions for bus drivers [156]; a bus strike in London in January 2015 and its effects on commuters [157]; an article from 2019 discussing the importance for integrated public transport across the UK while allowing city mayors to have freedom for local transport operations [158]; the launch of buses in the UK in 2020 that filter air (“air-filtering buses”) while in operation around a city [159]; the need for security for bus drivers against coronavirus infection [160], a boost in electric buses in the UK with a GBP 20 million contract [161]; the behaviour of passengers towards physical distancing measures deteriorating as people get vaccinated [162]; a 2021 news report discussing the government’s plans to introduce a major redesign of public transport with new bus lanes, new fare plans, and richer bus schedules [163]; changes in commuting patterns due to COVID-19 [164]; compulsory masks on tranport in London [165]; severely negative effects of privatisation of bus services outside London [166]; the effect of the COVID-19 pandemic on setting back public attitudes by two decades regarding giving preference to private cars over public transport for safety reasons [167]; an article discussing the downfall of British public transport services by bus privatisation [168]; and more.

4.4. Rail Transport

The macro-parameter rail transport defines the characteristics of the transportation sector that relate to trains and railways, as captured by the topic modelling of The Guardian dataset. Rail transport includes the parameters, public discontentment; rail fairs; funding, costs, and fares; industry and privatisation; rail projects and contracts; and governance and politics.

4.4.1. Public Discontentment

The public discontentment parameter is represented by keywords train, rail, passenger, service, company, network, year, railtrack, timetable, and railway. The overarching theme of the news articles in this parameter is the state of public discontentment with the rail services in the UK. The range of issues that the public is discontented with includes train delays, particularly due to ineffective train schedules. For example, The Guardian reported on 18 May 2019 that a new rail timetable was announced by the Rail Chief, UK, to improve the chaotic situation with the rail services in the UK due to many cancellations and delays in train services during the last year, 2018–2019 [19]. A couple of months later, people again encountered severe delays and cancellations affecting the train schedule due to overhead wire damage in July 2019 on the mainlines connecting London with Scotland, northeast England, and other regions [169]. A revised rail timetable was developed and put in place in late 2019 to enhance the rail services promised to be the biggest change in the UK train schedule, but the plans were ruined reportedly due to staff shortages [170]. These and similar incidents caused public upheaval and discussions on train delays schedules around the UK.
Other issues of discontent include poor train accessibility [171], delay in project completions [172,173], dissatisfaction with specific train service providers [174,175], discontent of company staff with their management [176], companies trying to win back customer satisfaction [177], change of management due to discontentment with services [178], and more.

4.4.2. Rail Fares

The rail fares parameter is depicted by keywords such as fare, ticket, rail, season, price, commuter, cheap, and peak. The parameter includes issues such as EasyJet in fare wars with Virgin trains [179], the withdrawal of cheaper fares amid train delays and cancellations [180], denial of compensation subsequent to the Hatfield crash in 2000 for those who did not keep their tickets [181], a planned increase in rail fares in England reported in 2020 [182], rail fares to increase by 3.8% in March 2022 reported in December 2021 [183], the launch of budget rail London–Edinburgh announced in September 2021 [184], postpandemic flexible rail season tickets [185], and more.

4.4.3. Funding, Costs, and Revenues

The train funding, costs, and fares parameter includes the keywords rail, company, network, profit, government, cost, fare, rise, revenue, public, and others. One of the news articles in this parameter, dated 5 December 2021, discusses the hefty budget cuts required by the UK government from train operators who are contracted to deliver train services for a fixed price while the revenues and risks are born by the government [186]. While the consequences of the pandemic on train travel patterns are obvious and being explored, some groups argue that it is critical to maintain services and cut costs to attract passengers and save taxpayer money. There are other political and public issues, including job cuts that harm some segments of the public. At the same time, it is necessary to reduce costs and improve public services. Other articles touch on a range of dimensions and issues of this parameter including penalties and cutting bonuses [187], bailouts [188], increase in demands and revenues [189,190,191], funding and funding gaps [192], and more.

4.4.4. Industry and Privatisation

The industry and privatisation parameter is characterised by keywords such as shareholder, railtrack, company, eurotunnel, buyer, debt, government, tunnel, share, and investor. The parameter captures transportation dimensions surrounding governance, privatisation, and industry, mainly for rail transportation. The earliest article [193] in this parameter dates back to 7 February 1964 about the agreement on the Channel Tunnel between the French and British governments seen as “a sound investment”. The Channel Tunnel as we know was opened in 1994. We then witness a news article [194] from 1999 opposing the cabinet view on partly privatising the public transport system in the UK due to its weaknesses. We also see an article [195] from December 2000 deliberating comments from a chief executive officer of Atkins who was a major stakeholder in two London Underground bids that “the public does not appreciate the benefits brought to the railways by the private sector”. These and similar issues [196] show the debates around and pros and cons of privatisation versus government-owned services. Another issue or dimensions that we can learn from our BERT model is the legal battles between companies such as the one reported in a Guardian article [197] from 2001 about the company Virgin planning to sue the company Railtrack for their losses due to the Hatfield train crash [198]. The legal battles between companies also extend to the leadership of a company being offered a job by another company such as reported in December 2009 by Dan Milmo that the chief of Tube Lines was offered a position at National Express [199]. There is also an article from September 2020 reporting the former transport secretary being offered a lucrative contract by Hutchison Ports [200,201]. Other news and dimensions of this parameter include the Stagecoach offer in 2009 to its rival National Express for a merger [202], the Channel Tunnel operator Eurotunnel’s hope in 2007 for “investors to back a debt-for-equity swap” to save it from bankruptcy [203], the problems with the public and private sector working together such as the London Underground public–private partnership (PPP) and East Coast Rail [204], the rail and bus company FirstGroup rejecting a takeover bid from the American company Apollo [205], the postBrexit rebranding of Eurotunnel to Getlink [206], and more.

4.4.5. Rail Projects and Contracts

The rail projects and contracts parameter was created by merging two clusters (numbers nine and four) because the two clusters contained keywords pointing to similar subjects. The parameter is represented by keywords franchise, rail, government, train, contract, railway, company, service, bid, plan, rail, project, line, transport, north, high, speed, government, plan, and route. The Guardian confirmed on 18 November 2021 [207] that the eastern link of HS2 connecting Leeds was abandoned by the government, and this caused fury among the affected segments of the public.

4.4.6. Governance and Politics

The governance and politics parameter represents the government’s decision or plan-related keywords including government, buyer, transport, labour, public, minister, private, decision, political, privatisation, and secretary. For example, The Guardian reported on 14 November 2021 [23] that the government dropped the plan for HS2 and instead decided to support projects that benefit the ruling party. HS2 was reportedly promised by the prime minister during the very early days of his job. It was expected to provide a new high-speed railway link serving as the foundation of Britain’s transportation network.

4.5. Air Transport

The macro-parameter air transport includes the parameters airport expansions, air pollution, airport security, and air costs and fares.

4.5.1. Airport Expansions

The airport expansions parameter is about expansions planned for airports and related facilities that are needed to meet the increasing demands for air travel [208] as well as about the opposition to expansions due to their negative impacts on climate [209,210]. This parameter includes the keywords runway, airport, Heathrow, expansion, government, aviation, decision, flight, build, and plan. For example, the matter of London Heathrow Airport expansion and construction of a third runway has remained a matter of discussion for many years. The project was approved, but climate activists challenging it, leading to the issue becoming bogged down in the courts [211]. Asthana, Laville, and Kale in a Guardian news item [212] discussed the Court of Appeal decision announced in March 2020 to deem the expansion unlawful due to the UK government’s failure of not considering the climate impacts of the expansion. This topic has continued to remain in the news due to the airport trying to challenge the court decision [213]. In addition, Tim Crosland, the lawyer and a campaigner for environmental protection was found guilty (May 2021) by the supreme court and lost his appeal (December 2021) for disclosing the court decision before its official announcement to the public [214].

4.5.2. Air Pollution

The air pollution parameter contains the following keywords: emission, carbon, aviation, climate, airline, fuel, environmental, biofuel, and others. The parameter relates to air pollution caused by air transport. For example, Ungoed-Thomas from The Guardian wrote in a news item [215] about the high number of flights being taken by UK government staff (293 every day according to a report) despite the UK government’s promises to protect the climate and make the government greener.

4.5.3. Airport Security

The airport security parameter is represented by keywords such as flight, airport, passenger, drone, and security. This parameter is exemplified in a news March 2008 article by Dodd and Milmo [30] reporting an incident of a breach, the second within a three-week period, where a man succeeded in reaching a runway at Heathrow airport.

4.5.4. Air Costs and Fares

The air costs and fares parameter represents the transportation characteristics connected to the costs and fees incurred by air transportation providers and consumers. The keywords include airline, airport, flight, passenger, carrier, cost, price, business, market, and profit. An example of various issues that come under this parameter is a Guardian news article reported by Topham and Kollewe [26] on 19 October 2021. The news is about Heathrow airport potentially increasing charges for passengers by 56 percent by 2023. Topham and Kollewe explained that Heathrow will be permitted by the CAA, the Civil Aviation Authority, to raise the landing charges considerably from the summer of 2022. This was in response to the airport organisation that asked for doubling the charges due to the massive business losses caused by the dearth of airport activity during the COVID-19 pandemic. CAA explained that the permission to increase charges was necessary for keeping the airport competitive and safe. The airlines are affected by the decision as the costs for their operations will increase. The news shows the complexity of the parameter in terms of the different stakeholders (airport management, airline operators, CAA, and consumers) and changing times and situations.

4.6. Crash and Safety

The macro-parameter crash and safety includes three parameters: train crashes, accidents and deaths, and dangerous driving and speeding.

4.6.1. Train Crashes

The keywords that represent the parameter train crashes are crash, safety, train, railtrack, rail, signal, and accident. The earliest Guardian article we found in this parameter dates back to one from 6 October 1999 about the worst crash of the decade between Great Western and Thames trains near Paddington in London [216] making safety of rail transport a major political issue [217], making the two train operators, Railtrack, and the government, to begin an inquiry into the crash [218], and government pledging GBP 1 billion for safety of rails [219]. This has further led to the possibility of manslaughter charges against Thames Trains and Railtrack [220]. Railtrack, a group of companies, owned a major part of the rail infrastructure in the UK from 1994. It was renationalised in 2002. Many other news items were found relating to train accidents such as the rail accident between two trains at Salisbury in November 2021 caused potentially by low adhesion between rail tracks and train wheels [221].
There have also been many news items from The Guardian in this parameter about losses to rail companies due to accidents, compensations, penalties, etc., [222]. The parameter also contained some articles related to rail suicides such as the article from November 2017 about urging commuters to indulge in small talk with people potentially attempting suicides [223]. It was reported in this article that about 273 people committed suicide on the railways in the UK during 2016–17. The parameter and the contained news articles show the richness of information that can be extracted from our BERT-based modelling approach.

4.6.2. Accidents and Deaths

The accidents and deaths parameter is represented by keywords such as police, crash, accident, incident, scene, woman, injure, die, man, and injury. This parameter contains news articles about deaths and road accidents as opposed to the parameter train crashes where the focus of the articles is on train crashes and the various issues surrounding them such as financial, political, investigative, and industrial issues. Moreover, while this parameter mainly contains articles about roads, we also found some articles that involved trains such as a death (potentially a murder) by a woman pushing another person in front of a train [20]. Another example in this parameter showing the focus on deaths rather than the mode of transportation is news from October 2000 about the history of train accidents in the UK [224]. The article focuses on injuries and deaths rather than other details, and this is the reason we believe this article, though also related to train crashes, is mainly associated by our BERT model to the accidents and deaths parameter. Another example is an article about the death of a woman who was a staff member in a railway ticket office. She died because of COVID-19 infection that she may have caught due to a man claiming to have COVID-19 who spat and coughed on her while she was on duty [225]. The news is related to rail transport but is about a death. Other examples of articles in this parameter that involve railways and trains (or even air transport) but are mainly about deaths, road transport, and vehicles include [226,227,228,229,230,231,232,233].
The dimensions and issues connected to this parameter as seen through the news articles include the UK government strategy for road safety highlighting the gravity of the matter due to over 0.3 million road casualties in the UK every year (1 March 2000; [234]), the release of the driver of the bus that crashed and killed two and injured dozens of people (5 January 2007, [235]); death and injuries of various people in different incidents due to cold, black ice, road death traps, etc. (8 February 2009, [236], 31 March 2010, [237]); the M5 crashes in November 2011 [238] and March 2012 [239]; the M1 crash in December 2012 and its investigations [240]; the death of a man due to collision with a Nottingham tram (16 August 2016, [241]); the rescue of 60 children from a bus operated by Stagecoach after its crash (11 November 2021, [242]); a woman killed due to the collision of two buses near Victoria Station, London (10 August 2021, [243]), and many more.
One of the issues discovered from this parameter is the deaths on and the safety concerns of smart motorways in the UK [244,245]. This topic of smart motorways was also detected in Parameters 7 and 14 in relation to congestion reduction and speeding, respectively.
The discussions in this article are supported by a large number of articles for the discovered parameters. These may be seen as unnecessary or of little or no benefit. We discuss a large number and range of articles to show the complexity and breadth of the parameter topics. The knowledge gained through the parameter discovery and analysis process that is currently partly automatic and partly manual and will become increasingly automatic and autonomous will allow autonomous modelling, (exploratory, dynamic, and real-time) analysis, and optimisation of transportation and other sectors. The discussions presented in this article are also helpful in understanding the working and performance of BERT and other clustering algorithms.

4.6.3. Dangerous Driving and Speeding

The dangerous driving and speeding parameter is characterised by drunk, dozing, and other dangerous driving, speeding, speed limits, methods to measure and curb dangerous driving and their devastating effects, and penalties and legal punishments. The first article in this parameter is dated 1 March 2000 and is about the government pledging to introduce tougher measures for drunk-driving and speeding to reduce child pedestrian deaths and other injuries, while road safety and environmental protection groups show dismay, criticising the government for giving in to the motoring lobby [246].
The dimensions and issues related to this parameter include, among others, efforts by the government to intervene and improve dangerous driving behaviour [247]; government caving in to different lobbies, including motoring and alcohol lobbies [248]; dozing drivers causing deaths and their legal punishments [249]; the use of virtual reality in driving tests [250]; dangerous and drunk drivers and their legal punishments [251]; devices that would not let drunk driver start the vehicle [252]; drunk police officers [253]; uninsured drivers [254]; speed cameras and privacy [255]; the law being soft on dangerous and drunk drivers [256]; the benefits of lower speed limits to air quality and the environment [257]; penalties and jails for drivers using mobile phones [258]; illegal use of devices to deceive speed measuring equipment [259]; improvements to driving tests to improve driving behaviour of young people [260]; the benefits of autonomous cars to free us from dangerous drivers [261]; shocking driving speed violations during the COVID-19 lockdown [262]; and more.

4.7. Disruptions and Causes

The macro-parameter disruptions and causes comprises two parameters: extreme weather impacts and disruptions and delays.

4.7.1. Extreme Weather Impacts

The extreme weather impacts parameter captures the various impacts on transportation of extreme weathers such as snow, rain, floods, heat, and wind-storms. The keywords detected by our BERT model for this parameter include snow, weather, temperature, flood, road, cold, rain, heavy, condition, and wind. The issues and dimensions for this parameter as evidenced through Guardian news articles include, among others, ice bombs (“frozen effluent falling from planes") [263]; impact on rail transport causing delays, cancellations, accidents, deaths, injuries, financial losses, and more [264]; magic de-icer to help railways in applying timely brakes [265]; effects of snow on roads [266]; heaviest snow in 18 years and its effects [267]; government rejecting criticism over transport management during extreme weathers [268]; resignation of transport minister over snow chaos [269]; strong winds, snow, and floods beat up the country and bring it to a halt [270]; extreme weather effects on air travel [271]; weather impact on schooling [272]; travel chaos in the country [273]; storm Darcy, cold and snow to cause disruptions [274]; weather impacts on Christmas and its arrangements [275]; deaths due to storms [276]; weather impacts on rail repairs [277] derailing of a train due to rain and landslide [17]; village evacuation due to extreme weather [278]; government advice to businesses not to penalise staff for following government snow advice [279]; travel chaos due to rain and high temperatures [280]; the inability of UK rail transport to deal with extreme climates and a call for investments [281]; damages to bridges due to flooding [282]; and more.

4.7.2. Disruptions and Delays

The disruptions and delays parameter contains the following keywords detected by our BERT model: train, service, weekend, holiday, passenger, expect, delay, busy, work, station, line, travel, day, fire, weather, rail, disruption, run, and traffic.
The earliest article in this parameter is from 19 November 1987 about a fire at King’s Cross underground train station in London. This shows travel and other disruptions caused by the fire. The dimensions and issues related to travel disruptions include, among others, closure of many stations in London underground due to coronavirus [283], disruptions due to peak-hour services cancellations [18]; a warning for people to plan their travel due to expected heavy traffic from bank holiday getaway travellers amid expected fine weather [284]; bridge failure causing disruptions [285]; advice to avoid travel due to rail works [286]; rail services disrupted by lightening strikes [287] arson at a train station [288]; getaways for Easter expected to cause traffic at motorways [289]; a leaf clearing operation by Network Rail to reduce rail accident risks [290]; disruptions in Christmas Eve travels due to engineering problems and weather [291]; disruptions due to Notting Hill carnival [292]; heavy road traffic and delays due to rail closures [293]; disruptions and delays due to London 2012 Olympics [294]; disruptions due to tunnel falls in London Underground [295]; crowded airports and rail stations and congested roads due to school holidays and good weather [296]; and many more.
Considering the keywords and news articles in this parameter, we can say that this parameter is about travel disruptions, delays and their causes. The causes include accidents, fires, both bad and good weather, faults, repairs and new installations in transport infrastructures, and holidays, including bank holidays, Easter, and Christmas.

4.8. Employment Rights, Disputes, and Strikes

This macro-parameter has only one parameter which was created by merging two clusters, numbers 5 and 20. The parameter employment rights, disputes, and strikes captures information about employees, their rights, job cuts, employment conditions, disputes with the management, and union strikes and their impact on people and economy. Two document clusters were detected with similar keywords and articles, the cluster numbers 5 and 20, and therefore we merged them into a single parameter. We noted some difference in the two clusters with cluster number 5 containing more articles related to rail transport and cluster number 20 a bit inclined towards air transport. We also consider this parameter as a macro-parameter because of its vast impact on social, economic, and environmental sustainability. There are always apparent exceptions in the cluster documents such as this article [297] that is about cancellation of trains due to Covid but primarily belongs to the parameter employment rights, disputes, and strikes; however, on a close inspection, one can find the connection such as the mention of strikes in the aforementioned article.
The earliest article reported by The Guardian related to this parameter is on 14 October 1999 about rail guards voting to go for a strike over safety matters [298]. We see matters related to job cuts such as British Airways announcing on 7 December 2000 to cut 1000 jobs at the Gatwick airport [299]. Among the news related to employment rights, union disputes, and strikes we find articles including one about a dispute between the Amalgamated Engineering and Electrical Union (AEEU) and Virgin Atlantic reported on 29 December 2000 [300], the dispute between RMT (National Union of Rail, Maritime, and Transport Workers) and the government (precisely, TfL, Transport for London) over the work rosters threatening to go for a strike from 26 November 2021 [301], train drivers threatening a major rail strike in London rail in January 2000 subsequent to rail privatisation [302], British Airways employees’ strike for disputes regarding salaries reported in June 2017 [303], a strike stretching multiple weeks during March 2019 by French customs over poor working conditions causing havoc to Eurostar trains [304], Yodel employees threatening to strike in September 2021 due to poor salaries and conditions causing potential disruptions to deliveries for major supermarkets and others [305], Stagecoach under threat of strike by drivers’low wages [306], a recent article (October 2021) on post-COVID-19 abuse of staff working at transport stations and other customer-facing staff by customers [307], and more.
These examples of different types of employment disputes and strikes reveal insights into a range of issues surrounding stakeholders, causes, and impacts of disputes and strikes.

4.9. Temporal Analysis (The Guardian)

In this section, we will analyse how the parameters have grown over time. Figure 12 displays the temporal progression of the parameters which are distributed into six subfigures. The vertical line of the graph indicates the number of articles which is defined as the intensity and the horizontal line indicates the years. Figure 12a depicts the temporal progression of the macro-parameter road transport. Fuel and SCM has a higher intensity compared to the others. Figure 12b illustrates the temporal progression of macro-parameter rail transport, where the rail projects and contracts and industry and privatisation parameter were started in 1960. After that, both parameters were highly discussed between 2000 and 2005. The intensity of articles for the macro-parameter air transport which includes four parameters is depicted in Figure 12c. Air pollution and air airport expansions both had a peak value of around 80 between 2007 and 2008. The temporal progression of the macro-parameter crash and safety which includes three parameters is shown in Figure 12d. We observed that there are more articles related to train crashes compared to others. Figure 12e displays the temporal progression of the macro-parameter disruptions and causes. The parameter extreme weather impacts was highly discussed in 2010 and had the highest peak value of 60. The temporal progression of the macro-parameters employment rights, disputes, and strikes, is shown in Figure 12f, where the highest peak value of intensity was more than 80 in 2010.
The temporal progression of all macro-parameters is summarised in Figure 13. For the first time, rail transport was discussed in 1960. After 2000, the parameter was highly concerned and topics for discussion had the highest peak value of 225. In 2008, the macro-parameter air transport had the highest peak value. We also saw in 2020 that the macro-parameters road transport, rail transport, and air transport were equally discussed. The macro-parameters crash and safety, disruptions and causes, and employment rights, disputes, and strikes were also of equal concern in 2020.

5. Industry: Transportation Parameters Discovery

In this section, we discuss the parameters detected by our BERT model from the dataset acquired from the Traffic Technology International (TTI) magazine. The parameters are grouped into five macro-parameters. We provide an overview of the parameters and macro-parameters in Section 5.1. The quantitative analysis is discussed in Section 5.2. Subsequently, we discuss each macro-parameter in separate sections, Section 5.3, Section 5.4, Section 5.5, Section 5.6 and Section 5.7. Section 5.8 discusses the temporal analysis of the parameters and macro-parameters.

5.1. Overview and Taxonomy (Traffic Technology International Magazine)

We detected a total of 15 parameters from the TTI dataset using BERT. These 15 parameters were grouped into 5 macro-parameters using the domain knowledge together with a similarity matrix, hierarchical clustering, and other quantitative analysis methods. The methodology and process of the discovery of parameters and their groupings into macro-parameters have already been discussed in Section 3.
Table 2 lists the parameters and macro-parameters of the transportation magazine, TTI. The parameters are categorised into five macro-parameters, including industry, innovation, and leadership, autonomous and connected vehicles, sustainability, mobility services, and infrastructure (Column 1). The second and third columns list the parameters and the cluster number, respectively. The fourth column lists the proportion of the total number of articles. Our BERT model identified 58.16% of the articles as having outlier clusters. As a result of excluding this cluster, the remaining 41.84% of articles are listed in the fourth column. The top keywords related to each parameter are represented in the fifth column.
Figure 14 provides a taxonomy of the transportation domain extracted from a transportation industry-focused technical magazine. The taxonomy was created using the parameters and macro-parameters discovered from the TTI magazine. The first-level branches show the macro-parameters, the second-level branches show the discovered parameters, and the third-level branches show the most representative keywords.

5.2. Quantitative Analysis (Traffic Technology International Magazine)

This section discuss the term score, word score, intertopic distance map, hierarchical clustering and similarity matrix.
Figure 15 shows that only the top 7 to 10 keywords in each parameter actually represent the parameter when we evaluate the keywords (see Section 3.8). Because the probabilities of all the other possibilities are so close to one another, their ranking becomes more or less meaningless. When we analysed the top keywords per parameter to discover the parameter, we used this information to focus on the top seven or so keywords in each parameter.
Figure 16 depicts the top five keywords for each parameter. The importance score, or c-TF–IDF score, is used to order the keywords (see Section 3.8). There are 15 subfigures and in each subfigure, the horizontal line shows the importance score, and the vertical line shows the parameter keywords.
Figure 17 shows the intertopic distance map (see Section 3.8), where two clusters are clearly identified on the left–below corner side, and the right–upper side represents the three clusters. However, we manually tagged the parameters into five macro-parameters.
Figure 18 represents the hierarchical clustering of the 15 clusters and systematically pairs the clusters based on the similarity matrix (see Section 3.8). We noticed that initially, the clusters were grouped into five clusters: (1, 8, 9, 0, 3), (13, 2, 4), (11, 5, 7), (10), and (14, 6, 12). This automated hierarchical clustering grouped the clusters correctly, with some exceptions. Furthermore, based on our knowledge and magazine articles, we manually grouped the clusters that are discussed in Table 2.
Figure 19 visualises the similarity matrix among the parameters (see Section 3.8). We used the same configuration as discussed in Figure 11. The dark blue colour represents the highest similarity relationship between parameters, while the light green represents the lowest similarity. For example, Cluster 3, labelled as transport services, and Cluster 1, labelled as AV systems, have high similarity scores as the main intention of AV systems is to improve transport services and make them smoother and more flexible. There is another high similarity between Clusters 8 and 9, which are labelled as AV trials and V2X trials, respectively.

5.3. Industry, Innovation, and Leadership

The macro-parameter industry, innovation, and leadership includes two parameters: leadership, and competitive innovation, which reveals events, appointments, innovations, and awards-related information and topics. The leadership parameter captures the transportation events and leadership news that have a high impact on transportation development. For example, the appointment of Angelos Amditis as ITS Europe chairman in 2018 [308], Laura Chace as CEO and president of ITS America in 2021 [309], and Laura Shoaf as the chair of the UK’s transport group in 2021 [310], and much more news and topics. The competitive innovation parameter is about new innovations and projects related to transportation. It includes the following keywords: award, project, winner, competition, solution, and so on.We discovered an award-related announcement that occurred in Florida, and the Woolpert was awarded for operating district-wide aerial photogrammetry and various surveys [311].

5.4. Autonomous and Connected Vehicles Systems

The macro-parameter autonomous and connected vehicles systems includes autonomous vehicles (AV) systems, AV trials, vehicle-to-everything (V2X) trials, and platooning/truck platooning. The AV system is designed to develop an autonomous driving vehicle by using several technologies, sensors, GPS, etc. This parameter reveals several significant innovations and projects through Traffic Technology International magazine articles, including the first thermal sensor-equipped production for AV [312], the first use of blockchain to provide connected vehicle data by CyberCar [313], a thermal sensor technology for the AV system announced on November 5, 2019, by the Veoneer system [312], the first vehicle-to-cloud infrastructure for automated connected vehicles by SENSORIS [314], and so on. We found AV trials-related news that illustrates the AV trials by Singapore’s Land Transport Authority [315].
Communication between a car and any component that can be affected by the car is referred to as V2X communication. Platooning is a technology that helps vehicles drive together and boosts road capacity by applying the automated highway system to reduce the distance between automobiles or trucks.

5.5. Infrastructure

The macro-parameter infrastructure includes road infrastructure, crash and safety, tolling, and ALPR (automatic licence plate recognition). The road infrastructure is represented by the following keywords: project, lane, road, motorway, traffic, construction, bridge, improvement, scheme, work, design, tunnel, junction, etc. We uncovered the following example related to this parameter: Highways England (HE) marked a turning point in road construction, encouraging better-planned roadworks and more consistent travel on motorways and key trunk routes [316]. The crash and safety is presented by road, death, pedestrian, crash, safety, fatality, injury, speed, etc. We noted that UK road deaths increased in 2016 [317]. Tolling is illustrated by toll, system, tolling, lane, toll collection, electronic, etc. We noticed that Canadas’s A25 highway electronic tolling system was upgraded on 24 October 2017 [318]. ALPR is defined by the camera, video, system, traffic, surveillance, detection, plate, etc. The enforcement system employs over 120 Sicore ALPR cameras located at 80 locations along major arterial routes around the UK capital [319].

5.6. Mobility Services

The macro-parameter mobility services retains transport services and parking services. By applying our model, we found that the traffic enforcement system is one of the transport services [320]. The parking system is another solution to make transportation services more convenient. We found news that merged the parking payment solution and electric vehicle charging system in the UK [321].

5.7. Sustainability / Sustainable Infrastructure

The macro-parameter sustainability includes air pollution and quality, street lighting, and electric vehicles. Diminishing transport-sourced air pollution is one of the major concerns as the number of vehicles is dramatically increasing every day. We found the Wolverhampton project focused on diminishing air pollution and improving the air quality monitoring system [322].
Street lighting is one of the solutions for smart cities’ public safety and traffic optimisation. For example, CityIQ Edge collects and processes street-level video and audio information that will enable urban areas to handle day-to-day problems [323]. To reduce carbon emissions and improve air quality, low emission electric vehicles are one of the best solutions. The following news article is an example of this parameter: the Department for Transport had contracted the UK’s Transport Research Laboratory (TRL) to observe and evaluate the effectiveness and implications of low-emission buses at 13 sites around the country [324].

5.8. Temporal Analysis (Traffic Technology International Magazine)

In this section, we will analyze how the parameters have evolved over time. Figure 20 shows the temporal progression of the parameter which is distributed into six subfigures. The first five subfigures represent the temporal progression of five macro-parameters, whereas the last subfigure depicts the temporal progression of all macro-parameters. The vertical line of the graph indicates the number of articles which is defined as the intensity. The temporal progression of the macro-parameter industry, innovation, and leadership is depicted in Figure 20a. Leadership has a higher intensity compared to the innovation parameter. Figure 20b shows that the AV systems’ intensity was increasing over time until 2017, but after that, the intensity declined. Figure 20c shows that the intensity of the road infrastructure parameter which is one of the components of the macro-parameter infrastructure was high in 2017 and then gradually decreased. The temporal progression of macro-parameter mobility services which includes two parameters, parking services and transport services is shown in Figure 20d. We observed that there are more articles related to transport services compared to parking services. The intensity of articles for the macro-parameter sustainability which includes three parameters: street lighting, air quality and pollution, and electric vehicles is depicted in Figure 20e. street lighting and air quality and pollution have both had the same peak value of 25 in 2017.
The temporal progression of all macro-parameters is summarised in Figure 20f. In 2017, macro-parameters autonomous and connected vehicles, infrastructure, and sustainability had the highest peak values of 140, 120, and 60, respectively.

6. Academia: Transportation Parameters Discovery

In this section, we discuss the parameters detected by our BERT model from the Web of Science. We provide an overview of the parameters and macro-parameters in Section 6.1. The quantitative analysis is discussed in Section 6.2. Subsequently, we discuss each macro-parameter in separate sections, Section 6.3, Section 6.4, Section 6.5, Section 6.6, Section 6.7 and Section 6.8. Section 6.9 discusses the temporal analysis of the parameters and macro-parameters.

6.1. Overview and Taxonomy (Web of Science)

We detected a total of 50 parameters from The Guardian dataset using BERT. We skip Cluster 19 as it is related to narrative transportation [325,326,327], not related to general transportation. These 49 parameters were grouped into 6 macro-parameters using the domain knowledge along with a similarity matrix, hierarchical clustering, and other quantitative analysis methods. The methodology and process of the discovery of parameters and their groupings into macro-parameters have already been discussed in Section 3.
Table 3 and Table 4 list the parameters and macro-parameters of the academic dataset. The macro-parameters policy, planning and sustainability; transportation modes; logistics and SCM; pollution; technologies; and modelling, are listed in Column 1 with the associated parameters (Column 2). Some parameters are merged. For example, the Clusters 33 and 38, and 44 and 45 are merged as road safety and freight and logistics, respectively, in Table 3. The third column indicates the cluster number. The percentage of the number of articles is recorded in the fourth column. Our BERT model labelled 56.42% of articles as the outlier clusters. Consequently, we ignored this outlier cluster, and the rest of the 43.58% of articles are listed in the fourth column. The fifth column represents the top keywords associated with each parameter.
Figure 21 provides a taxonomy of the transportation domain extracted from academia. The taxonomy was created using the parameters and macro-parameters discovered from the Web of Science dataset. The macro-parameters are shown on the first level of branches, the discovered parameters are shown on the second level of branches, and the most representative keywords are shown on the third level of branches.

6.2. Quantitative Analysis (Web of Science)

This section discuss the term score, word score, intertopic distance map, hierarchical clustering, and similarity matrix.
Figure 22 depicts that only the top 13 keywords in each parameter actually represent the parameter when we evaluate the keywords (see Section 3.8). Because the probabilities of all the other possibilities are so close to one another, their ranking becomes more or less pointless. When we investigated the top keywords per parameter to label the parameter, we used this information to focus on the top 10 or so keywords in each parameter.
Figure 23 shows the top five keywords for each parameter. The importance score, or c-TF–IDF score, is used to order the keywords (see Section 3.8). There are 50 subfigures and in each subfigure, the horizontal line shows the importance score, and the vertical line shows the parameter keywords.
Figure 24 shows the intertopic distance map (see Section 3.8), where nine groups of parameters are clearly identified. In the bottom left corner, one group of parameters contains more parameters than the others. There are two small-size parameters on the right side, which are comparatively small. However, we notice that the BERT model clusters are not very well clustered, so we used domain knowledge and other information to label them. Additionally, we manually labelled the parameters into six macro-parameters.
Figure 25 describes the hierarchical clustering of the 50 clusters and systematically pairs them based on the cosine similarity matrix (see Section 3.8). This automated hierarchical clustering grouped the clusters correctly, with some exceptions.
Figure 26 visualises the similarity matrix among the parameters (see Section 3.8). We use the same configuration as discussed in Figure 11. The dark blue colour represents the highest similarity relationship between parameters, while the light green represents the lowest similarity. For example, Cluster 12, labelled as traffic flow modelling, and Cluster 17, labelled as traffic congestion, have high similarity scores as the main focus on traffic. There is another high similarity between cCusters 2 and 30, and both are labelled as VANET.

6.3. Policy, Planning and Sustainability

The macro-parameter policy, planning and sustainability discusses the policy, services, planning, and development related to transportation. It includes 15 parameters, including land-use planning, smart cities, low-income neighborhoods, urban mobility, road safety, traffic congestion, subways, vehicles ownership, electric vehicles and charging, bike sharing and ridesourcing, children and schools, gender and race equality, parking, tolling, and tourism.
The land-use planning parameter discussed how to manage and map the transportation area based on several criteria. For example, analysing the usage of spatial metrics and population data to map the urban transportation areas [328] or the impact of walkability to the metro station on retail location choice [329], types of suburbanisation [330], etc. The smart cities parameter refers to urban areas that have experienced rapid growth and are technologically sophisticated. Crowd management [331], green transportation [332], and improving the quality of transportation systems [333] are the important areas of smart cities. With the progress of civilisation and rapid industrialisation, urban mobility becomes one of the key research areas in transportation. The investigation of urban mobility is the key factor for policy makers, and transport planners. The Road safety parameter is the combination of Parameters 33 and 38. This parameter is related to the research on road accidents and crashes, traffic collisions, pedestrian walking and safety [334], sidewalks, etc.
Transportation affordability is one of the major issues in low-income neighbourhoods. Extensive research work has been conducted to analyse the issue and co-relation between transportation and low-income households. In [335], the authors examined transportation services and policies between 1960 and 2000 to determine the relationship between poverty and public transportation.In another study, the transportation affordability of low-income people in US cities was examined, and it was discovered that transit-rich neighbourhoods are more inexpensive than auto-oriented ones owing to reduced transportation costs [336]. With the advancement of civilisation and fast industrialisation, urban mobility has become one of the major research areas in transport research. For policy makers and transportation planners, investigating urban mobility is fundamental [337].
Hybrid electric vehicles (HEVs), battery electric vehicles (BEVs), plug-in electric vehicles (PEVs), and plug-in hybrid electric vehicles (PHEVs) are the most prevalent forms of electric vehicles. There are two types of charger systems: off-board and on-board, with uplink and downlink power transmission. A study of battery charger layouts, infrastructure for PHEVs, and charging voltage levels is provided by [338]. Zhang et al. [339] demonstrated efficient planning of PEVs fast-charging stations while taking into account interactions between transportation and electrical networks. In other research, Fernandez et al. [340] evaluated the impact of PEVs on distribution networks. The PHEVs batteries are charged at home from the outlet or corporate car park, which has an extra impact on the distribution grid (i.e., voltage deviations and power loss) [341].
Recently, research on bike sharing and ridesourcing are dramatically increased after COVID-19. There is a lot of ongoing research work to improve the quality of resourcing and bike-sharing systems. For example, the survey of ridesourcing research [342,343,344], shared autonomous vehicles [344,345,346], the survey of bike share [347], and traveller experience after using the ride-sharing services, such as Uber [348].

6.4. Transportation Modes

The macro-parameter transportation modes includes four parameters: road transport, rail transport, air transport, marine transport. The road transport parameter is related to public transportation. Normally, there are three types of public transportation in rural areas such as intercity buses, demand-responsive transit, and deviated fixed-route transit which is discussed in this study. One of the keys to bringing sustainable growth and a higher quality of life to urban areas is better public transit planning, control, and management [349]. Public transit uses road space more effectively than private traffic and creates fewer accidents and pollutants. Furthermore, owing to the impractical nature of public transit in many places, many choose to use private transportation rather than public transportation [350]. Much research has been conducted to improve the quality of public transportation. For example, evaluation of road transportation in Brazil [351], analysing passenger satisfaction with public transportation in Romania [352], passenger flow prediction in public transport based on the timetable in India [353], effective system design for public transport in the USA [354], etc.
The rail transport parameter shows key research areas in rail transportation such as high-speed railways [355], rail freight transportation [356], risk management [357], railway transit traffic [358], and train services [359]. The objective of high-speed rail (HSR) is to enhance mobility via inter-city conveyance and facilitate financial growth. In October 1964, Japan’s first modern high-speed rail line opened, linking Tokyo and Osaka at a maximum speed of 210 km/h [360]. In 1976, British Railways established a high-speed train link between London and Bristol. Following that, France started its first high-speed rail service between Paris and Lyon in 1981. Since then, several European countries, including Spain, Germany, Italy, Belgium, and the Netherlands, have built HSR lines. South Korea built its first high-speed rail line between Daegu and Seoul in 2004 which was later extended to Busan in 2009, while Taiwan began service between Taipei and Kaohsiung in 2007. China declared in 2016 that they would have about 38,000 km of HSR tracks by 2025 [361].
The air transport parameter is represented by keywords airport, airline, flight, air, aircraft, passenger, aviation, air transportation, and others. It discusses the environmental impact of air transportation with respect to air pollution, noise, and climate change [362]. The marine transport parameter is defined by the keywords ship, port, maritime, container, shipping, sea, vessel, ferry, model, cargo, etc. Marine transportation accounts for 80–90% of worldwide trade, transporting about 10 billion tonnes of cartons and solid–liquid weighty cargo across the world’s oceans each year [363]. Some research has been conducted on marine transportation trade [364,365], waterway or marine transportation systems [33,34], waterway traffic flow modelling [366], and so on.

6.5. Logistics and SCM

The macro-parameter logistics and SCM comprises three parameters, the Clusters 44 and 45 are combined as freight and logistics, food supply chain, and cost and pricing. The logistics and SCM parameter contains the following keywords, business, company, industry, service, freight, and others. The parameter relates to freight transportation, where companies or industries are using technologies to evaluate and improve their business models, logistics services, and activities. For example, marine transportation contributes 75% of all international freight [36,367], and as international freight increases, seaports need to improve their infrastructure to maintain the services and market demand. International freight transportation should be expanded to promote the growth of the logistics industry [368,369].
The food supply chain parameter is represented by keywords including food, chain, product, meal, supply, supply chain, food supply, waste, food waste, temperature, etc. This parameter is associated with research aimed at enhancing the quality and safety of industrial food supply chain management. In [370], the authors presented an architecture for goods supply chain management with three key elements: real-time surveillance of the goods to reduce lost and perishable goods; anticipating the heat of the package; and triggering an alarm if the goods are not reserved under the acceptance conditions. Fresh food transportation is another research area in the food SCM parameter. A mathematical model was proposed by [371] to distribute the fresh food to the end customer. The distributed ledger and blockchain technologies are also used in the agri-food supply chain [372].
The cost and pricing parameter is an important research area in transportation. For example, the spatial price policy under transportation asymmetry [373], reducing transportation carrier cost [374], and analysing the global transportation system [375].

6.6. Pollution

The macro-parameter pollution contains eight parameters, namely air quality and pollution, soil pollution, noise pollution, fuel types and effects, coal transport and consumption, waste management, wastewater treatment, and incident and risk management. The transportation industry is responsible for around 30% of the greenhouse emissions that contribute to global warming [376]. In recent times, air pollution in transportation has become a major public concern. Consequently, it is crucial to enhance transport efficiency to keep urban air quality [377]. A number of studies have examined the levels of exposure to presumed air pollutants such as VOCs (volatile organic compounds) [378]. Traffic congestion also has an impact on air pollution and quality [379].
Transportation is a major contributor to soil pollution. Railway transport, for example, pollutes nearby soils with heavy metals. Heavy metal contamination has a significant detrimental influence on the natural environment, including decreased enzyme activity in soil and ecosystem destruction [380]. Noise pollution, which is mostly caused by transportation and automobile traffic [381], is a significant environmental contaminant because of its physical and mental impacts on humans.
The fuel types and effects parameter includes several types of fuels keywords such as diesel, biodiesel, gasoline, oil, biofuel, etc. Biofuel use has an impact on carbon dioxide emission in the United States transportation [382]. To determine more sustainable fuel is another area of research. In [383], the authors analyze the factors which help to choose between ethanol and gasoline for the flex-fuel vehicles. Bayramoğlu et al. [376] analyze the valve lift effects on the diesel engine.

6.7. Technologies

ITS, computer vision, smartphone sensing, VANET, autonomous vehicles and taxis, IoT security, physical layer communication, and robot mobility are the eight parameters of macro-parameter technologies.
Intelligent transportation systems (ITS) which have seen substantial advancement in the recent decade have been recognised as viable solutions to improve the transportation system’s safety and reliability [384].
The computer vision parameter is the state-of-the-art research area including vehicle detection, vehicle type recognition, vehicle colour recognition [385], automatic license plate recognition [90], tracking moving vehicles, incident detection through the image processing task, vehicle counting system, traffic light detection, pedestrian detection, traffic sign recognition, etc.
The smartphone sensing parameter is another research area in the transportation field. Transport organisations actively promote public transportation to alleviate the traffic congestion produced by private vehicles. To increase the number of passengers using public transport, transport authorities can evaluate their local and premium services and market policies by analysing the travel patterns and regularity. For example, Ma et al. [386] proposed a data-mining process to identify the travel patterns in China based on the temporal and spatial features of Chinese smart card transaction data.
VANET referred to as vehicular ad-hoc networks, encloses V2V (vehicle-to-vehicle) and V2I (vehicle-to-infrastructure) communication architectures to enhance navigation, road safety, and other transport services. We noticed that VANET has been the most active research field for more than 10 years. The top three survey papers for VANET are [89,387,388] which provide an overview of VANET.
The parameter autonomous vehicles, also known as self-driving cars or driverless cars, have the ability to reduce travel time, increase road safety, improve fuel efficiency, and provide automatic parking facilities [389]. More research work is ongoing to improve the performance and quality of AV systems. For example, Haboucha et al. [390] discussed user preference concerning AV. In other research, a cost analysis of several types of AV was presented by [391].

6.8. Modelling

The macro-parameter modelling includes two parameters traffic flow modelling, and transportation modelling algorithms. Traffic flow models are important for analysing the performance of ITS applications. Extensive research work has been conducted on traffic flow models. For example, traffic flow prediction [392], traffic speed prediction [393], traffic violation detection, traffic sign detection, traffic congestion prediction, traffic data collection methods and passenger flow prediction [394]. Traffic coordination and monitoring depend on the traffic flow model. To solve the transportation modelling problems, i.e., fuzzy transportation problems where transportation source, destination, and time are represented as exponential fuzzy numbers, transportation scheduling problems, transport shipment problems, transport parameters (such as cost, capacity, speed) problem, and transportation network design problems, the researcher proposed several algorithms. For example, the genetic algorithm was used to solve the solid transportation problem [395].

6.9. Temporal Analysis (Web of Science)

In this section, we will analyse how the parameters have developed over time. Figure 27 shows the temporal progression of the parameter, which is distributed into eight subfigures. The first two subfigures represent the temporal progression of the policy, planning and sustainability parameter by showing seven and eight parameters, respectively. The next five macro-parameters show the temporal progression of transportation modes, logistics and SCM, pollution, technologies, and modelling, respectively. The last subfigure depicts the temporal progression of all macro-parameters.
The vertical line of the graph indicates the number of articles, which is defined as the intensity. The temporal progression of the macro-parameter policy, planning and sustainability is depicted in Figure 27a,b for better visualisation. The EV and Charging parameter has a higher intensity compared to the other parameters. Figure 27c shows that the rail transport intensity was increasing over time until 2017, and also more research was conducted on this parameter.
The intensity of articles for the macro-parameter logistics and SCM which includes three parameters: cost and pricing, freight and logistics and food supply chain is depicted in Figure 27d. Freight and logistics has the highest peak of about 14 in 2017. The temporal progression of macro-parameter pollution which includes eight parameters is shown in Figure 27e. We observed that there are more articles related to air quality and pollution and coal transport and consumption compared to others. Figure 27f shows the parameters of the technologies macro-parameter, where we observed that there was more research conducted on the VANET parameter. The intensity of articles for the macro-parameter modelling which includes two parameters: traffic flow modelling and transportation modelling algorithms is depicted in Figure 27g. We noticed that more research work was conducted on the transport flow modelling parameter. The temporal progression of all macro-parameters is summarised in Figure 27h. We discovered that n 2019 the macro-parameter policy, planning and sustainability had the highest peak value of 350. Pollution had the highest peak in 2021, about 250. The macro-parameter technologies and transportation modes intensity was about 150 between 2016 and 2020. There has been less research on macro-parameter modelling, logistics and SCM.

7. Discussion

The broader aim of our work is to investigate the use of ICT technologies for solving pressing problems in smart cities and societies. Specifically, in this paper, we investigate the use of digital methods to discover and analyse cross-sectional multi-perspective information to enable better decision making and develop better instruments for academic, corporate, national and international governance. We brought together a range of deep learning, big data, and other technologies to discover transportation parameters from three different perspectives using three different types of data sources, viz. a newspaper (The Guardian), a transportation technology magazine (Traffic Technology International), and academic literature on transportation (from Web of Science). These three types of transportation parameters were described in detail in Section 4, Section 5 and Section 6, respectively.
We discovered a total of 25 parameters from The Guardian dataset and grouped them into 6 macro-parameters, namely road transport; rail transport; air transport; crash and safety; disruptions and causes; and employment rights, disputes, and strikes. Figure 28 depicts the word cloud of the keywords of The Guardian parameters discovered by the BERT modelling, where the size of each keyword denotes its frequency that can be related to the importance of the keywords. The figure shows that The Guardian is primarily concerned with the government, trains, passengers, the general public, and accidents. As The Guardian is a UK-based newspaper, the train is one of the most used public transport in the UK which is clearly seen in the word cloud by the following keywords: train, rail, and railtrack. Additionally, some major transportation issues, such as accidents, delays, injuries, traffic, safety, and crashes, are also shown in this figure. Heathrow airport is the central international airport in the UK and is visible in the word cloud.
A total of 15 parameters were discovered from the TTI dataset, and we grouped them into 5 macro-parameters, namely industry, innovation, and leadership; autonomous and connected vehicles; sustainability; mobility services; and infrastructure. Figure 29 depicts the word cloud of the keywords of the TTI parameters discovered by the BERT modelling, where the size of each keyword denotes its frequency. The word cloud for transportation magazines is heavily dominated by the transportation industry. The keywords such as technology, project, system, traffic, solution, autonomous vehicles are highly related to the transport industry field. Datum is a well-known organisation that has been providing solutions and services in the transportation sector since 1999, especially in the UK and Europe, where the majority of transport infrastructure and projects are conducted under this organisation.
We discovered 49 transportation parameters from the academic dataset and grouped them into 6 macro-parameters. These are policy, planning and sustainability; transportation modes; logistics and SCM; pollution; technologies; and modelling. Figure 30 depicts the word cloud of the keywords of the academia parameters. Academic transportation research covers a wide range of topics such as public transportation, various pollution impacts and solutions, intelligent transportation systems, traffic, supply chain management, cost, and so on.
Reflecting on the multi-perspective view (public, governance, political, industrial, and academic) of transportation gained through the discovery of parameters from three different sources of datasets (see Figure 1; more detailed taxonomies and analyses are provided in the respective sections), we note that the newspaper parameters show more of a public and political view of transportation with the focus on the road, rail, and air transportation issues highlighting public discontent, accidents, cycling, pollution and effects on climate, road congestion, fuel prices, travel costs, privatisation and its impacts, dangerous driving, deaths, extreme weather impacts, and employment rights. Rail transport has a very high significance in the newspaper dataset due to the importance of the London underground and intercity rail transport in the UK. It may vary from country to country depending on the nature of transport in that country being used for intra- and intercity travel. Megacities tend to rely on rapid transit systems, but it can vary. The transport magazine parameters show an industrial view of transportation with great deal of the focus on autonomous and connected vehicles owing to several trials in progress around the world. The spotlights are also on crash and safety, tolling, parking, pollution, and electric vehicles. The Web of Science parameters show an academic view of transportation with various foci on policy, planning, sustainability, equity, children and schools, vehicle ownership, tourism, four transportation modes, freight and logistics, a wide range of pollution and its sources, modelling methods, and several technologies.
The three views show that there are many important problems such as transportation operations and public satisfaction that industry and academia seem not to place their focus on, or perhaps if they do, the solutions do not get much attention from policy makers and industrialists. For example, the fare-related parameters for public transport in The Guardian dataset show the importance of this topic for the public while it is not visible in the TTI and academic parameters. This could show the need for research in this area to model fares, provide insights, provide solutions for people for lower fares, and so on. Similarly, other parameters, issues, and contents such as the need for better employment conditions for drivers discovered from the public view (The Guardian) could be studied by academics and addressed by the industry, and this could set new trends where the technology-focused literature could bridge the gaps between social sciences, sustainability, and technology. We can also see that academia produces much broader and deeper knowledge on the subject, while many important issues such as a wide range of pollution affecting people and the planet do not reach the public eye. Our deep journalism approach could find the gaps and highlight them to the public and other stakeholders. We called this approach Deep Journalism because it allows capturing and reporting a relatively deeper view of a topic (e.g., transportation) from multiple perspectives, dimensions, stakeholders, and depths. Second, we use deep learning to automatically discover multi-perspective parameters about a topic.
Commenting on the relationship and contributions of this work to the specific field of journalism, we make the following observations. Traditional journalism has failed at its core purpose of providing citizens impartial information to maintain ’free’ societies due to many reasons such as difficulties in maintaining the freedom and impartiality of media organisations and funding cuts, leading to public mistrust. The mistrust in traditional journalism coupled with the rise of digital technologies has given a rapid rise to citizen journalism. While citizen journalism solves some of the problems of traditional journalism, it comes with its own problems such as subjectivity and lack of regulations, standards, quality, and responsibility. In this work, we aimed to contribute to improving journalism through academic integrity and rigour. Academics should be in the vanguard of objective information, sincerity, impartiality, equity, and other ideals, and therefore the academics should search, pursue, propagate, and defend these ideals. If the academics fail to do so, then the responsibility lies on common people to pursue and be in the vanguard of the ideals needed to maintain a free society. An academic is not by profession and job but rather by action. The responsibility to maintain ideals lies with all people, and therefore everyone has the responsibility and needs to work towards upholding honesty, sincerity, equity, freedom, and other ideals. Through deep journalism, we aim to make impartial, cross-sectional, and multi-perspective information available to people, bring rigour to the journalism field by nurturing responsibility in people, make it easy for people to generate information for public benefit using deep learning, and make tools and information available to common people so they can search and defend ideals of free societies, including social, environmental, and economic sustainability. As we have explained earlier, the methods and tools developed in this work are not limited to journalism and can be used by engineers, scientists, policy makers, and others to understand the parameters for the design and operations of any sector such as healthcare, supply chain management, etc.

8. Conclusions

We live in a complex world characterised by complex people, complex times, and complex social, technological, and ecological environments. There is clear evidence that governments are failing at most public matters. The recent COVID-19 pandemic is a major example of global governance failure both at preventing such a pandemic and managing it. It is time that all of us take responsibility for both success and failure rather than criticising our governments and look into ways of collaboratively improving the governance of public matters.
While there are many reasons for government failures, we believe the lack of information availability is a fundamental reason that limits governments’ abilities to act smartly and allows the lack of transparency to creep into policy and action, leading to corruption and failure. To this end, this paper introduced the concept of deep journalism, a data-driven deep learning-based approach for discovering multi-perspective parameters related to a topic of interest. We examined the academic, industrial, public, governance, and political parameters for the transportation sector as a case study to introduce deep journalism and our tool, DeepJournal (Version 1.0), that implements our proposed approach. We built three datasets specifically for the work presented in this paper. These datasets will be provided openly to the community for further research and development. We elaborated on 89 transportation parameters and hundreds of dimensions, reviewing 400 technical, academic, and news articles.
The work presented in this paper and the investigation into the proposed Deep Journalism approach is far from perfect both in terms of its definition and scope as well as its exploration in this paper such as the different types of media, the use of deep learning and other computing methods, the investigations into the specific media and sources used in this paper, and more. We work in a range of research topics including smart cities [396,397,398,399,400], cloud, fog, and edge computing [401,402,403], big data [404,405], high performance computing [406,407], education [408,409], and healthcare [410,411], and plan to benefit from these technologies and topics for extending and improving Deep Journalism in the future.
Regarding NLP (natural language processing), more research is needed to understand the clustering performance of BERT and other clustering methods. For example, some clusters have some similarities, and it is not clear why these clusters are separated by the clustering algorithms or why an article from one topic is included in another, the quality of cluster boundaries, and so on. One obvious reason is that documents are related to all clusters, some more and others less. Another reason by example is a train crash that could also be linked to a road crash because there is something about crashes and similar vocabulary there. Death and injuries can be other linked topics. Another matter related to topic modelling, NLP, and BERT performance is to investigate the effects of language used by different communities and sectors such as in the case of newspapers using a different vocabulary because dramatisation is important for them.
The aim of the work presented in this paper is partly to understand the transportation domain comprehensively and use this understanding to improve the transportation sector. Our research concerns multiple sectors and disciplines such as healthcare and smart cities, with a focus on developing interdisciplinary methods and technologies allowing for the minimisation of silos and inefficiencies through policy and action integration and the facilitation of holistic designs and optimisations. The proposed approach can also be utilised to create disciplines and curricula for teaching in schools and universities, training for staff in industry and government institutions, and more. Given ICT is penetrating all spheres of our lives, be it transport, politics, corruption investigations, legal actions, and more, capturing such details automatically is useful because it can lead to the development of automated algorithms for cross-disciplinary exploratory analysis, real-time investigations, decision making, and more.
Finally, a broader direction of investigation in the future would be to find how deep learning can further help develop multi-perspective and deeper insights into different issues, sectors, etc., related to our societies. We wish to investigate whether it is possible to develop rigorous methodologies and processes to gain deeper insights into various issues, the processes that could be automated and followed easily by the public to objectively investigate matters of civic concerns and produce impartial information that could be consumed by the public to develop informed societies. We wish to explore whether it is possible to cultivate informed societies through such processes (deep journalism), i.e., by enabling and nurturing the public to study matters of public concern through automated, rigorous, ‘deep’, processes and contribute to the debate through objective processes and impartial information. The definition of deep journalism proposed in this paper also entails that the scope of journalism should not be limited and should extend to any matters affecting the public and society.
We believe the possibilities for utilisation and potential impacts of the work presented in this paper and the proposed approach are significant and endless; we invite all communities interested in transportation and otherwise to investigate our proposed approach for a sustainable and joint future for all.
The bottom line is that a society is as informed as it wishes to be. This statement does not relieve oppressed governments and institutions from the responsibility for their oppressive actions against the public. It only highlights the fact that if individuals do not take responsibility for the governance of their environment, opportunists will rise and will blind them through misinformation and enslave them.

Author Contributions

Conceptualization, I.A. and R.M.; methodology, I.A. and R.M.; software, I.A.; validation, I.A. and R.M.; formal analysis, I.A. and R.M.; investigation, I.A., R.M., F.A. and E.A; resources, R.M., F.A. and E.A.; data curation, I.A.; writing—original draft preparation, I.A. and R.M.; writing—review and editing, R.M., F.A. and E.A.; visualization, I.A.; supervision, R.M. and F.A.; project administration, R.M.; funding acquisition, R.M. All authors have read and agreed to the published version of the manuscript.

Funding

The authors acknowledge with thanks the technical and financial support from the Deanship of Scientific Research (DSR) at the King Abdulaziz University (KAU), Jeddah, Saudi Arabia, under Grant No. RG-11-611-40.

Institutional Review Board Statement

Not applicable.

Informed Consent Statement

Not applicable.

Data Availability Statement

The data used in this paper will be made publicly available.

Acknowledgments

The work carried out in this paper is supported by the HPC Center at the King Abdulaziz University. The training and software development work reported in this paper was carried out on the Aziz supercomputer.

Conflicts of Interest

The authors declare no conflict of interest.

References

  1. Dauvergne, P. Why is the global governance of plastic failing the oceans? Glob. Environ. Chang. 2018, 51, 22–31. [Google Scholar] [CrossRef]
  2. Keping, Y. Governance and good governance: A new framework for political analysis. Fudan J. Humanit. Soc. Sci. 2018, 11, 1–8. [Google Scholar] [CrossRef] [Green Version]
  3. Howlett, M.; Ramesh, M. The two orders of governance failure: Design mismatches and policy capacity issues in modern governance. Policy Soc. 2014, 33, 317–327. [Google Scholar] [CrossRef] [Green Version]
  4. Keech, W.R.; Munger, M.C. The anatomy of government failure. Public Choice 2015, 164, 1–42. [Google Scholar] [CrossRef]
  5. Hudson, B.; Hunter, D.; Peckham, S. Policy failure and the policy-implementation gap: Can policy support programs help? Policy Des. Pract. 2019, 2, 1–14. [Google Scholar] [CrossRef]
  6. McKinnon, C. Sleepwalking into lock-in? Avoiding wrongs to future people in the governance of solar radiation management research. Environ. Politics 2019, 28, 441–459. [Google Scholar] [CrossRef]
  7. Schmelzle, C.; Stollenwerk, E. Virtuous or Vicious Circle? Governance Effectiveness and Legitimacy in Areas of Limited Statehood. 2018. Available online: https://www.tandfonline.com/doi/full/10.1080/17502977.2018.1531649 (accessed on 15 February 2022).
  8. Hudson, B. We Need to Talk About Policy Failure—And How to Avoid It. Available online: https://blogs.lse.ac.uk/politicsandpolicy/policy-failure-and-how-to-avoid-it/ (accessed on 15 February 2022).
  9. Goldin, I. Divided Nations: Why Global Governance Is Failing, and What We Can Do about It. Available online: https://blog.politics.ox.ac.uk/divided-nations-why-global-governance-is-failing-and-what-we-can-do-about-it/ (accessed on 15 February 2022).
  10. Cohen, J.; van der Meulen Rodgers, Y. Contributing factors to personal protective equipment shortages during the COVID-19 pandemic. Prev. Med. 2020, 141, 106263. [Google Scholar] [CrossRef] [PubMed]
  11. Templeton, A.; Guven, S.T.; Hoerst, C.; Vestergren, S.; Davidson, L.; Ballentyne, S.; Madsen, H.; Choudhury, S. Inequalities and identity processes in crises: Recommendations for facilitating safe response to the COVID-19 pandemic. Br. J. Soc. Psychol. 2020, 59, 674–685. [Google Scholar] [CrossRef]
  12. Kim, D.K.D.; Kreps, G.L. An analysis of government communication in the United States during the COVID-19 pandemic: Recommendations for effective government health risk communication. World Med. Health Policy 2020, 12, 398–412. [Google Scholar] [CrossRef]
  13. Williams, O.D. COVID-19 and private health: Market and governance failure. Development 2020, 63, 181–190. [Google Scholar] [CrossRef]
  14. Greer, S.L.; Ruijter, A.D.; Brooks, E. The COVID-19 pandemic: Failing forward in public health. In The Palgrave Handbook of EU Crises; Springer: Berlin/Heidelberg, Germany, 2021; pp. 747–764. [Google Scholar]
  15. Park, J.; Chung, E. Learning from past pandemic governance: Early response and Public-Private Partnerships in testing of COVID-19 in South Korea. World Dev. 2021, 137, 105198. [Google Scholar] [CrossRef] [PubMed]
  16. Alomari, E.; Katib, I.; Albeshri, A.; Yigitcanlar, T.; Mehmood, R. Iktishaf+: A big data tool with automatic labeling for road traffic social sensing and event detection using distributed machine learning. Sensors 2021, 21, 2993. [Google Scholar] [CrossRef] [PubMed]
  17. Topping, A.; Davies, C. Train Derails after Landslide as Heavy Rain Causes UK travel Chaos. 2016. Available online: https://www.theguardian.com/uk-news/2016/sep/16/torrential-rain-travel-chaos-england-floods (accessed on 15 February 2022).
  18. Media, P. Major Disruption at Euston Station after Rush-Hour Services Cancelled. 2019. Available online: https://www.theguardian.com/uk-news/2019/oct/25/major-disruption-at-euston-station-after-rush-hour-services-cancelled (accessed on 15 February 2022).
  19. Topham, G. Rail Chiefs Confident Timetable Change will Not Repeat 2018 Chaos. Available online: https://www.theguardian.com/uk-news/2019/may/18/rail-timetable-change-trains-extra-services (accessed on 18 May 2019).
  20. Jones, S. Woman Held Over Tube Station Death. 2010. Available online: https://www.theguardian.com/uk/2010/oct/26/kings-cross-tube-death-arrest (accessed on 15 February 2022).
  21. Topham, G. ‘Railway Accidents Happen Because Someone Makes a Mistake’. 2013. Available online: https://www.theguardian.com/uk-news/2013/jul/25/railway-accidents-human-error-warning-systems (accessed on 15 February 2022).
  22. Heidarysafa, M.; Kowsari, K.; Barnes, L.; Brown, D. Analysis of railway accidents’ narratives using deep learning. In Proceedings of the 2018 17th IEEE International Conference on Machine Learning and Applications (ICMLA), Orlando, FL, USA, 17–20 December 2018; IEEE: Piscataway, NJ, USA, 2018; pp. 1446–1453. [Google Scholar]
  23. Pidd, H. Government to Finally Drop Plan for HS2 Link to Leeds—Reports. 14 November 2021. Available online: https://www.theguardian.com/uk-news/2021/nov/14/government-to-finally-drop-plan-for-hs2-link-to-leeds-reports (accessed on 15 February 2022).
  24. Valentino, S. London the Worst City in Europe for Health Costs from Air Pollution. 2020. Available online: https://www.theguardian.com/environment/2020/oct/21/london-the-worst-city-in-europe-for-health-costs-from-air-pollution (accessed on 15 February 2022).
  25. Stone, T. New Report Shows Local Transport is the Main Contributor to UK Air Pollution. 2018. Available online: https://www.traffictechnologytoday.com/news/public-transit/new-report-shows-local-transport-is-the-main-contributor-to-uk-air-pollution.html (accessed on 15 February 2022).
  26. Topham, G.; Kollewe, J. Heathrow Passenger Charges Could Rise by Up to 56% by 2023. 19 October 2021. Available online: https://www.theguardian.com/uk-news/2021/oct/19/heathrow-passenger-charges-rise-tickets-caa (accessed on 15 February 2022).
  27. Rat, C.L. Safety Management System In Air Transportation. In Proceedings of the International Management Conference; Faculty of Management, Academy of Economic Studies: Bucharest, Romania, 2019; Volume 13, pp. 1051–1058. [Google Scholar]
  28. Stone, T. Virginia Launches Flight Information Exchange to Improve Drone Safety. 2020. Available online: https://www.traffictechnologytoday.com/news/asset-management/virginia-launches-flight-information-exchange-to-improve-drone-safety.html (accessed on 15 February 2022).
  29. Association, P. Stansted Airport Security Fault Causes Passengers to Miss Flights. 2017. Available online: https://www.theguardian.com/uk-news/2017/may/09/stansted-airport-security-fault-passengers-miss-flights (accessed on 15 February 2022).
  30. Dodd, V.; Milmo, D. Runway Invader Sparks New Security Fears. 14 March 2008. Available online: https://www.theguardian.com/uk/2008/mar/14/uksecurity.transport (accessed on 15 February 2022).
  31. Davies, R. Nearly Half of UK’s Independent Petrol Stations Still Lack Fuel. 2021. Available online: https://www.theguardian.com/business/2021/sep/30/half-uk-independent-petrol-stations-out-of-fuel (accessed on 15 February 2022).
  32. Gou, X.; Lam, J.S.L. Risk analysis of marine cargoes and major port disruptions. Marit. Econ. Logist. 2019, 21, 497–523. [Google Scholar] [CrossRef]
  33. Wang, Z.; Yin, J. Risk assessment of inland waterborne transportation using data mining. Marit. Policy Manag. 2020, 47, 633–648. [Google Scholar] [CrossRef]
  34. Samekto, A.A.; Kristiyanti, M. Development of Risk Management Model in Maritime Industry. Qual. Access Success 2020, 21, 178. Available online: https://www.proquest.com/openview/87dc6ba79b35b9df29abdeec3539e0c2/1?pq-origsite=gscholar&cbl=1046413 (accessed on 15 February 2022).
  35. Stone, T. Washington Seaports to Launch Apps to Speed Up Cargo Flow, Reduce Emissions and Save Fuel. 2016. Available online: https://www.traffictechnologytoday.com/news/emissions-low-emission-zones/washington-seaports-to-launch-apps-to-speed-up-cargo-flow-reduce-emissions-and-save-fuel.html (accessed on 15 February 2022).
  36. Garg, C.P.; Kashav, V. Evaluating value creating factors in greening the transportation of Global Maritime Supply Chains (GMSCs) of containerised freight. Transp. Res. Part D Transp. Environ. 2019, 73, 162–186. [Google Scholar] [CrossRef]
  37. Academics Can Change the World—If They Stop Talking Only to Their Peers. 31 March 2017. Available online: https://theconversation.com/academics-can-change-the-world-if-they-stop-talking-only-to-their-peers-55713 (accessed on 15 February 2022).
  38. Stockton and Darlington Railway. 24 September 1825. Available online: https://www.theguardian.com/world/1825/sep/24/transport.uk (accessed on 15 February 2022).
  39. Becket, A. How Can Britain Become a ‘Great Cycling Nation’ When It’s So Scary to Ride a Bike? 1 January 2022. Available online: https://www.theguardian.com/commentisfree/2022/jan/01/britain-cycling-scary-ride-bike (accessed on 15 February 2022).
  40. Stone, T. Netherlands to Test AVs on Public Roads. 2 June 2015. Available online: https://www.traffictechnologytoday.com/news/autonomous-vehicles/netherlands-to-test-avs-on-public-roads.html (accessed on 15 February 2022).
  41. Stone, T. #TRBAM 2022: South Dakota DOT Secretary Joel Jundt Named as New TRB Board Member. 11 January 2022. Available online: https://www.traffictechnologytoday.com/news/appointments/trbam-2020-south-dakota-dot-secretary-joel-jundt-named-as-new-trb-board-member.html (accessed on 15 February 2022).
  42. Nagurney, A. Congested urban transportation networks and emission paradoxes. Transp. Res. Part D Transp. Environ. 2000, 5, 145–151. [Google Scholar] [CrossRef]
  43. Li, X.; Hu, Z.; Zou, C. Noise annoyance and vibration perception assessment on passengers during train operation in Guangzhou Metro. Environ. Sci. Pollut. Res. 2022, 29, 4246–4259. [Google Scholar] [CrossRef]
  44. Devlin, J.; Chang, M.W.; Lee, K.; Toutanova, K. Bert: Pretraining of deep bidirectional transformers for language understanding. arXiv 2018, arXiv:1810.04805. [Google Scholar]
  45. McInnes, L.; Healy, J.; Melville, J. Umap: Uniform manifold approximation and projection for dimension reduction. arXiv 2018, arXiv:1802.03426. [Google Scholar]
  46. McInnes, L.; Healy, J.; Astels, S. hdbscan: Hierarchical density based clustering. J. Open Source Softw. 2017, 2, 205. [Google Scholar] [CrossRef]
  47. Li, B.; Han, L. Distance weighted cosine similarity measure for text classification. In Proceedings of the International Conference on Intelligent Data Engineering and Automated Learning, Hefei, China, 20–23 October 2013; Springer: Berlin/Heidelberg, Germany, 2013; pp. 611–618. [Google Scholar]
  48. Murtagh, F.; Contreras, P. Algorithms for hierarchical clustering: An overview, II. Wiley Interdiscip. Rev. Data Min. Knowl. Discov. 2017, 7, e1219. [Google Scholar] [CrossRef] [Green Version]
  49. Tmtoolkit: Text Mining and Topic Modeling Toolkit. Available online: https://tmtoolkit.readthedocs.io/en/latest/index.html (accessed on 14 March 2022).
  50. Grootendorst, M. c-TF-IDF. Available online: https://github.com/MaartenGr/cTFIDF (accessed on 14 March 2022).
  51. Sievert, C.; Shirley, K. LDAvis: A method for visualizing and interpreting topics. In Proceedings of the Workshop on Interactive Language Learning, Visualization, and Interfaces, Baltimore, MD, USA, 27 June 2014; pp. 63–70. [Google Scholar]
  52. Histograms. Available online: https://matplotlib.org/stable/gallery/statistics/hist.html (accessed on 14 March 2022).
  53. heatmap. Available online: https://seaborn.pydata.org/generated/seaborn.heatmap.html (accessed on 14 March 2022).
  54. Goodwin, M.J. Right Response: Understanding and Countering Populist Extremism; Chatham House: London, UK, 2011. [Google Scholar]
  55. Alvares, C.; Dahlgren, P. Populism, extremism and media: Mapping an uncertain terrain. Eur. J. Commun. 2016, 31, 46–57. [Google Scholar] [CrossRef]
  56. What Is the Purpose of Journalism? Available online: https://www.americanpressinstitute.org/journalism-essentials/what-is-journalism/purpose-journalism/ (accessed on 27 August 2021).
  57. Carlson, M. The perpetual failure of journalism. Journalism 2019, 20, 95–97. [Google Scholar] [CrossRef]
  58. Allern, S.; Pollack, E. Journalism as a public good: A Scandinavian perspective. Journalism 2019, 20, 1423–1439. [Google Scholar] [CrossRef]
  59. A Free Press is ‘Cornerstone’ for Accountability and ‘Speaking Truth to Power’: Guterres. Available online: https://news.un.org/en/story/2019/05/1037741 (accessed on 28 August 2021).
  60. Wall, M. Citizen Journalism. Digit. J. 2015, 3, 797–813. [Google Scholar] [CrossRef]
  61. Sienkiewicz, M. Start making sense: A three-tier approach to citizen journalism. Media Cult. Soc. 2014, 36, 691–701. [Google Scholar] [CrossRef]
  62. Raza, S.H.; Emenyeonu, O.C.; Yousaf, M.; Iftikhar, M. Citizen journalism practices during COVID-19 in spotlight: Influence of user-generated contents about economic policies in perceiving government performance. Inf. Discov. Deliv. 2022, 50, 142–154. [Google Scholar] [CrossRef]
  63. Zeng, X.; Jain, S.; Nguyen, A.; Allan, S. New perspectives on citizen journalism. Glob. Media China 2019, 4, 3–12. [Google Scholar] [CrossRef]
  64. Carmichael, V.; Adamson, G.; Sitter, K.C.; Whitley, R. Media coverage of mental illness: A comparison of citizen journalism vs. professional journalism portrayals. J. Ment. Health 2019, 28, 520–526. [Google Scholar] [CrossRef] [Green Version]
  65. Nah, S.; Chung, D.S. Understanding Citizen Journalism as Civic Participation; Routledge: Philadelphia, NY, USA, 2020; p. 179. [Google Scholar] [CrossRef]
  66. Al-Ghazzi, O. “Citizen Journalism” in the Syrian Uprising: Problematizing Western Narratives in a Local Context. Commun. Theory 2014, 24, 435–454. Available online: https://academic.oup.com/ct/article-pdf/24/4/435/21958510/jcomthe0435.pdf (accessed on 15 February 2022). [CrossRef] [Green Version]
  67. Social Media Poses ‘Existential Threat’ to Traditional, Trustworthy News. Available online: https://news.un.org/en/story/2022/03/1113702 (accessed on 28 August 2021).
  68. Mutsvairo, B.; Salgado, S. Is citizen journalism dead? An examination of recent developments in the field. Journalism 2022, 23, 354–371. [Google Scholar] [CrossRef]
  69. McKinney, W. Data structures for statistical computing in python. In Proceedings of the 9th Python in Science Conference, Austin, TX, USA, 3 July–28 June 2010; Volume. 445, pp. 51–56. [Google Scholar]
  70. Harris, C.R.; Millman, K.J.; van der Walt, S.J.; Gommers, R.; Virtanen, P.; Cournapeau, D.; Wieser, E.; Taylor, J.; Berg, S.; Smith, N.J.; et al. Array programming with NumPy. Nature 2020, 585, 357–362. [Google Scholar] [CrossRef] [PubMed]
  71. Grootendorst, M. BERTopic: Leveraging BERT and c-TF-IDF to Create Easily Interpretable Topics; Cornell University: Ithaca, NY, USA, 2020. [Google Scholar] [CrossRef]
  72. Bird, S.; Klein, E.; Loper, E. Natural Language Processing with Python: Analyzing Text with the Natural Language Toolkit; O’Reilly Media, Inc.: Sebastopol, CA, USA, 2009. [Google Scholar]
  73. Buitinck, L.; Louppe, G.; Blondel, M.; Pedregosa, F.; Mueller, A.; Grisel, O.; Niculae, V.; Prettenhofer, P.; Gramfort, A.; Grobler, J.; et al. API design for machine learning software: Experiences from the scikit-learn project. In Proceedings of the ECML PKDD Workshop: Languages for Data Mining and Machine Learning, Prague, Czech Republic, 23–27 September 2013; pp. 108–122. [Google Scholar]
  74. Rehurek, R.; Sojka, P. Gensim–Python Framework for Vector Space Modelling; NLP Centre, Faculty of Informatics Masaryk University: Brno, Czech Republic, 2011; Volume 3, Available online: https://pypi.org/project/gensim/ (accessed on 15 February 2022).
  75. Paszke, A.; Gross, S.; Massa, F.; Lerer, A.; Bradbury, J.; Chanan, G.; Killeen, T.; Lin, Z.; Gimelshein, N.; Antiga, L.; et al. PyTorch: An Imperative Style, High-Performance Deep Learning Library. In Advances in Neural Information Processing Systems 32; Curran Associates, Inc.: Red Hook, NY, USA, 2019; pp. 8024–8035. [Google Scholar]
  76. Waskom, M.; Botvinnik, O.; O’Kane, D.; Hobson, P.; Lukauskas, S.; Gemperline, D.C.; Augspurger, T.; Halchenko, Y.; Cole, J.B.; Warmenhoven, J.; et al. mwaskom/seaborn: V0.8.1 (September 2017). Zenodo 2017. [Google Scholar] [CrossRef]
  77. Inc., P.T. Collaborative Data Science. 2015. Available online: https://plot.ly (accessed on 15 February 2022).
  78. Hunter, J.D. Matplotlib: A 2D graphics environment. Comput. Sci. Eng. 2007, 9, 90–95. [Google Scholar] [CrossRef]
  79. Alam, F.; Mehmood, R.; Katib, I.; Altowaijri, S.M.; Albeshri, A. TAAWUN: A Decision Fusion and Feature Specific Road Detection Approach for Connected Autonomous Vehicles. Mob. Netw. Appl. 2019, 1–17. [Google Scholar] [CrossRef]
  80. Wang, N.; Chen, R.; Xu, K. A real-time object detection solution and its application in transportation. In Proceedings of the 2021 International Conference on Communications, Information System and Computer Engineering (CISCE), Beijing, China, 14–16 May 2021; IEEE: Piscataway, NJ, USA, 2021; pp. 486–491. [Google Scholar]
  81. Zhu, H.; Yuen, K.V.; Mihaylova, L.; Leung, H. Overview of environment perception for intelligent vehicles. IEEE Trans. Intell. Transp. Syst. 2017, 18, 2584–2601. [Google Scholar] [CrossRef] [Green Version]
  82. Suma, S.; Mehmood, R.; Albugami, N.; Katib, I.; Albeshri, A. Enabling Next Generation Logistics and Planning for Smarter Societies. Procedia Comput. Sci. 2017, 109, 1122–1127. [Google Scholar] [CrossRef]
  83. Aqib, M.; Mehmood, R.; Alzahrani, A.; Katib, I. In-Memory Deep Learning Computations on GPUs for Prediction of Road Traffic Incidents Using Big Data Fusion. In Smart Infrastructure and Applications; Springer: Berlin/Heidelberg, Germany, 2020; pp. 79–114. [Google Scholar]
  84. Aqib, M.; Mehmood, R.; Albeshri, A.; Alzahrani, A. Disaster Management in Smart Cities by Forecasting Traffic Plan Using Deep Learning and GPUs. In Societies, Infrastructure, Technologies and Applications. SCITA 2017. Lecture Notes of the Institute for Computer Sciences, Social Informatics and Telecommunications Engineering (LNICST); Springer: Cham, Switzerland, 2017; Volume 224, pp. 139–154. [Google Scholar]
  85. Aqib, M.; Mehmood, R.; Alzahrani, A.; Katib, I.; Albeshri, A.; Altowaijri, S. Rapid Transit Systems: Smarter Urban Planning Using Big Data, In-Memory Computing, Deep Learning, and GPUs. Sustainability 2019, 11, 2736. [Google Scholar] [CrossRef] [Green Version]
  86. Aqib, M.; Mehmood, R.; Alzahrani, A.; Katib, I.; Albeshri, A.; Altowaijri, S. Smarter Traffic Prediction Using Big Data, In-Memory Computing, Deep Learning and GPUs. Sensors 2019, 19, 2206. [Google Scholar] [CrossRef] [Green Version]
  87. Lv, Y.; Duan, Y.; Kang, W.; Li, Z.; Wang, F.Y. Traffic flow prediction with big data: A deep learning approach. IEEE Trans. Intell. Transp. Syst. 2014, 16, 865–873. [Google Scholar] [CrossRef]
  88. Van Brummelen, J.; O’Brien, M.; Gruyer, D.; Najjaran, H. Autonomous vehicle perception: The technology of today and tomorrow. Transp. Res. Part C Emerg. Technol. 2018, 89, 384–406. [Google Scholar] [CrossRef]
  89. Karagiannis, G.; Altintas, O.; Ekici, E.; Heijenk, G.; Jarupan, B.; Lin, K.; Weil, T. Vehicular Networking: A Survey and Tutorial on Requirements, Architectures, Challenges, Standards and Solutions. IEEE Commun. Surv. Tutorials 2011, 13, 584–616. [Google Scholar] [CrossRef]
  90. Li, Y.; Liu, Y.; Wang, M. Study and realization for license plate recognition system. In Proceedings of the 2009 Asia-Pacific Conference on Information Processing, Shenzhen, China, 18–19 July 2009; IEEE: Piscataway, NJ, USA, 2009; Volume 2, pp. 501–504. [Google Scholar]
  91. Theofilatos, A.; Chen, C.; Antoniou, C. Comparing machine learning and deep learning methods for real-time crash prediction. Transp. Res. Rec. 2019, 2673, 169–178. [Google Scholar] [CrossRef]
  92. Alomari, E.; Katib, I.; Mehmood, R. Iktishaf: A big data road-traffic event detection tool using Twitter and spark machine learning. Mobile Netw. Appl. 2020, 1–16. [Google Scholar] [CrossRef]
  93. Alomari, E.; Katib, I.; Albeshri, A.; Mehmood, R. COVID-19: Detecting government pandemic measures and public concerns from Twitter arabic data using distributed machine learning. Int. J. Environ. Res. Public Health 2021, 18, 282. [Google Scholar] [CrossRef] [PubMed]
  94. Suma, S.; Mehmood, R.; Albeshri, A. Automatic event detection in smart cities using big data analytics. In Proceedings of the International Conference on Smart Cities, Infrastructure, Technologies and Applications, Jeddah, Saudi Arabia, 27–29 November 2018; Springer: Berlin/Heidelberg, Germany, 2017; pp. 111–122. [Google Scholar]
  95. Suma, S.; Mehmood, R.; Albeshri, A. Automatic detection and validation of smart city events using hpc and apache spark platforms. In Smart Infrastructure and Applications; Springer: Berlin/Heidelberg, Germany, 2020; pp. 55–78. [Google Scholar]
  96. Zhang, S. Using twitter to enhance traffic incident awareness. In Proceedings of the 2015 IEEE 18th International Conference on Intelligent Transportation Systems, Las Palmas de Gran Canaria, Spain, 15–18 September 2015; IEEE: Piscataway, NJ, USA, 2015; pp. 2941–2946. [Google Scholar]
  97. Wang, D.; Al-Rubaie, A.; Clarke, S.S.; Davies, J. Real-time traffic event detection from social media. ACM Trans. Internet Technol. (TOIT) 2017, 18, 1–23. [Google Scholar] [CrossRef]
  98. Wan, X.; Ghazzai, H.; Massoud, Y. Leveraging personal navigation assistant systems using automated social media traffic reporting. In Proceedings of the 2020 IEEE Technology and Engineering Management Conference (TEMSCON), Novi, MI, USA, 3–6 June 2020; IEEE: Piscataway, NJ, USA, 2020; pp. 1–6. [Google Scholar]
  99. Heilig, L.; Voß, S. A scientometric analysis of public transport research. J. Public Transp. 2015, 18, 8. [Google Scholar] [CrossRef] [Green Version]
  100. Das, S.; Sun, X.; Dutta, A. Text mining and topic modeling of compendiums of papers from transportation research board annual meetings. Transp. Res. Rec. 2016, 2552, 48–56. [Google Scholar] [CrossRef]
  101. Sun, L.; Yin, Y. Discovering themes and trends in transportation research using topic modeling. Transp. Res. Part C Emerg. Technol. 2017, 77, 49–66. [Google Scholar] [CrossRef] [Green Version]
  102. Zulkarnain; Putri, T.D. Intelligent transportation systems (ITS): A systematic review using a Natural Language Processing (NLP) approach. Heliyon 2021. [Google Scholar] [CrossRef] [PubMed]
  103. Zou, X.; Vu, H.L. Mapping the knowledge domain of road safety studies: A scientometric analysis. Accid. Anal. Prev. 2019, 132, 105243. [Google Scholar] [CrossRef] [PubMed]
  104. Gao, J.; Wu, X.; Luo, X.; Guan, S. Scientometric Analysis of safety sign research: 1990–2019. Int. J. Environ. Res. Public Health 2021, 18, 273. [Google Scholar] [CrossRef]
  105. Faisal, A.; Yigitcanlar, T.; Kamruzzaman, M.; Paz, A. Mapping two decades of autonomous vehicle research: A systematic scientometric analysis. J. Urban Technol. 2021, 28, 45–74. [Google Scholar] [CrossRef]
  106. Topham, G. Sadiq Khan Considering £3.50 Daily Charge for Drivers Entering London. 2020. Available online: https://www.theguardian.com/uk-news/2020/dec/11/khan-considering-350-daily-charge-for-drivers-entering-london (accessed on 15 February 2022).
  107. Walker, P. Local Councils Advised to Push Ahead with Traffic Reduction Schemes. 2020. Available online: https://www.theguardian.com/politics/2020/nov/13/local-councils-advised-to-push-ahead-with-traffic-reduction-schemes (accessed on 15 February 2022).
  108. Topham, G. What Are Smart Motorways and Are They Safe? 2021. Available online: https://www.theguardian.com/world/2021/jan/19/what-are-smart-motorways-and-are-they-safe (accessed on 15 February 2022).
  109. Osborne, H. London Borough of Newham tops UK Parking Fines Table. 2021. Available online: https://www.theguardian.com/society/2021/jan/18/london-borough-of-newham-tops-uk-parking-fines-table (accessed on 15 February 2022).
  110. Carrington, D. Study Reveals World’s Most Walkable Cities. 2020. Available online: https://www.theguardian.com/cities/2020/oct/15/study-reveals-worlds-most-walkable-cities (accessed on 15 February 2022).
  111. Letters. Calm UK’s Roads to Encourage Walking and Cycling. 2017. Available online: https://www.theguardian.com/politics/2017/mar/24/calm-uks-roads-to-encourage-walking-and-cycling (accessed on 15 February 2022).
  112. Morris, S. Cardiff Proposes £2 Congestion Charge for Non-Residents. 2020. Available online: https://www.theguardian.com/politics/2020/jan/15/cardiff-proposes-congestion-charge-for-non-residents (accessed on 15 February 2022).
  113. Connolly, K. Eco Wonder or Safety Nightmare? Germany to Vote on E-Scooters. 2019. Available online: https://www.theguardian.com/cities/2019/may/16/germany-to-vote-on-law-allowing-e-scooters-on-roads (accessed on 15 February 2022).
  114. Harvey, F. Road Congestion Levels in Outer London Higher than before Lockdown. 15 September 2020. Available online: https://www.theguardian.com/environment/2020/sep/15/road-congestion-levels-in-outer-london-higher-than-before-lockdown (accessed on 15 February 2022).
  115. Taylor, M. Air Pollution Roars Back in Parts of UK, Raising Covid Fears. 2020. Available online: https://www.theguardian.com/environment/2020/dec/10/air-pollution-roars-back-in-parts-of-uk-raising-covid-fears (accessed on 15 February 2022).
  116. Monbiot, G. Electric Cars Won’t Solve Our Pollution Problems—Britain Needs a Total Transport Rethink. 2020. Available online: https://www.theguardian.com/commentisfree/2020/sep/23/electric-cars-transport-train-companies (accessed on 15 February 2022).
  117. Jolly, J. Petrol and Diesel Cars Could Cost Up to £1500 More under Proposals. 2020. Available online: https://www.theguardian.com/business/2020/sep/09/petrol-and-diesel-cars-could-cost-up-to-1500-more-under-proposals (accessed on 15 February 2022).
  118. Laville, S. Manchester Becomes Latest UK City to Delay Clean Air Zone. 2020. Available online: https://www.theguardian.com/environment/2020/may/21/manchester-becomes-latest-uk-city-to-delay-clean-air-zone (accessed on 15 February 2022).
  119. Taylor, M. Toxic Air Over London Falls by 50% at Busiest Traffic Spots. 2020. Available online: https://www.theguardian.com/environment/2020/apr/23/toxic-air-over-london-falls-by-50-at-busiest-traffic-spots (accessed on 15 February 2022).
  120. Association, P. E10 Petrol: UK to Standardise Higher Ethanol Blend. 2020. Available online: https://www.theguardian.com/uk-news/2020/mar/04/e10-petrol-uk-to-standardise-higher-ethanol-blend (accessed on 15 February 2022).
  121. Jolly, J. UK Could Ban Sale of Petrol and Diesel Cars in 12 years, Says Shapps. 2020. Available online: https://www.theguardian.com/environment/2020/feb/12/uk-ban-sale-petrol-diesel-cars-shapps-transport (accessed on 15 February 2022).
  122. Murray, L. I Applaud Bristol for Banning Diesel Vehicles. But Why Not Ban All Private Cars? 2019. Available online: https://www.theguardian.com/commentisfree/2019/nov/04/bristol-ban-diesel-cars-climate-emergency (accessed on 15 February 2022).
  123. Jones, H. Oxford Aims for World’s First Zero Emissions Zone with Petrol Car Ban. 2017. Available online: https://www.theguardian.com/uk-news/2017/oct/11/oxford-aims-to-cut-air-pollution-car-ban-zero-emissions-zone (accessed on 15 February 2022).
  124. Jolly, J. Electric Cars: UK Government Urged to Prevent ‘Charging Deserts’. 2021. Available online: https://www.theguardian.com/business/2021/jul/23/electric-cars-uk-government-urged-to-prevent-charging-deserts (accessed on 15 February 2022).
  125. Ambrose, J. UK’s First All-Electric Car Charging Forecourt Opens in Essex. 2020. Available online: https://www.theguardian.com/environment/2020/dec/07/uk-first-all-electric-car-charging-forecourt-opens-in-essex (accessed on 15 February 2022).
  126. Johnson, B. Why Obama Should Treat the Car Industry Like the Internet. 2008. Available online: https://www.theguardian.com/technology/blog/2008/dec/01/engineering-automotive (accessed on 15 February 2022).
  127. Goodall, C. The 10 Big Energy Myths. 2008. Available online: https://www.theguardian.com/environment/2008/nov/27/renewableenergy-energy (accessed on 15 February 2022).
  128. Syal, R. SUVs and Extra Traffic Cancelling Out Electric Car Gains in Britain. 26 February 2021. Available online: https://www.theguardian.com/environment/2021/feb/26/suvs-and-extra-traffic-cancelling-out-electric-car-gains-in-britain (accessed on 15 February 2022).
  129. Editorial. The Guardian View on Fuel Shortages: This Crisis Needs Management. 2021. Available online: https://www.theguardian.com/commentisfree/2021/sep/28/the-guardian-view-on-fuel-shortages-this-crisis-needs-management (accessed on 15 February 2022).
  130. Helm, T. Secret Report Reveals Government Fear of SCHOOLS chaos after No-Deal Brexit. 2019. Available online: https://www.theguardian.com/politics/2019/aug/03/secret-education-report-no-deal-brexit-school-chaos (accessed on 15 February 2022).
  131. Weaver, M. Hundreds of KFC Shops Closed as Storage Depot Awaits Registration. 2018. Available online: https://www.theguardian.com/uk-news/2018/feb/21/hundreds-of-kfc-shops-closed-as-storage-depot-awaits-registration (accessed on 15 February 2022).
  132. Weaver, M. KFC Was Warned about Switching UK Delivery Contractor, Union Says. 2018. Available online: https://www.theguardian.com/business/2018/feb/20/kfc-was-warned-about-switching-uk-delivery-contractor-union-says (accessed on 15 February 2022).
  133. Jasper, J.; Joanna, P.S.B.; Topham, G. There Is Nothing That Hasn’t Gone Up‘: How Rising Costs are Hitting UK Businesses. 2021. Available online: https://www.theguardian.com/business/2021/nov/17/how-rising-costs-are-hitting-uk-businesses-inflation-covid (accessed on 15 February 2022).
  134. Moody, K. Why It’s High Time to Move on from ‘Just-In-Time’ Supply Chains. 11 October 2021. Available online: https://www.theguardian.com/commentisfree/2021/oct/11/just-in-time-supply-chains-logistical-capitalism (accessed on 15 February 2022).
  135. Addley, E. Get Out That Puncture Repair Kit... 2000. Available online: https://www.theguardian.com/money/2000/jun/26/officehours.workandcareers (accessed on 15 February 2022).
  136. Clark, A. Charity Cyclists Barred from New Trains. 2004. Available online: https://www.theguardian.com/uk/2004/jan/15/transport.world (accessed on 15 February 2022).
  137. Jowit, J. Beware Mature Men Wobbling on Big Motorbikes. 2004. Available online: https://www.theguardian.com/uk/2004/feb/29/transport.world (accessed on 15 February 2022).
  138. Staff.; agencies. On Yer Bikes, Urge Pedal-Pushing MPs. 2004. Available online: https://www.theguardian.com/politics/2004/jun/16/immigrationpolicy.transport (accessed on 15 February 2022).
  139. Laker, L. Big Rise in UK Weekend Cycling Amid Calls for More Investment. 2021. Available online: https://www.theguardian.com/lifeandstyle/2021/jul/22/big-rise-in-uk-weekend-cycling-amid-calls-for-more-investment (accessed on 15 February 2022).
  140. Pidd, H.; Glover, M. Campaigners Lose Legal Challenge Over Lake District 4 × 4 vehicles. 2020. Available online: https://www.theguardian.com/uk-news/2020/aug/24/campaigners-lose-legal-challenge-over-lake-district-4x4-vehicles (accessed on 15 February 2022).
  141. Taylor, M. UK Increase in Cycling and Walking Must Be Nurtured, Says Minister. 2021. Available online: https://www.theguardian.com/politics/2021/mar/18/uk-increase-in-cycling-and-walking-must-be-nurtured-says-minister (accessed on 15 February 2022).
  142. Hopkins, J. How to Stop Your Bicycle from Being Stolen. 2020. Available online: https://www.theguardian.com/environment/bike-blog/2020/aug/28/how-to-stop-your-bicycle-from-being-stolen (accessed on 15 February 2022).
  143. Reid, C. How to Take a Cycling Holiday This Year Despite the Pandemic. 2020. Available online: https://www.theguardian.com/travel/bike-blog/2020/aug/12/how-to-take-a-cycling-holiday-this-year-despite-the-pandemic (accessed on 15 February 2022).
  144. Parveen, N. West Midlands to Gain 500-Mile Cycle Network. 2020. Available online: https://www.theguardian.com/uk-news/2020/aug/11/west-midlands-to-gain-500-miles-of-cycle-routes (accessed on 15 February 2022).
  145. Caird, J. How to start CYCLING with Young Children. 2020. Available online: https://www.theguardian.com/environment/bike-blog/2020/aug/04/how-to-start-cycling-with-young-children (accessed on 15 February 2022).
  146. Topham, G. Uber to Launch Jump Bike Hire Scheme in Islington Borough. 2019. Available online: https://www.theguardian.com/uk-news/2019/may/24/uber-to-launch-jump-bike-hire-scheme-in-islington-borough (accessed on 15 February 2022).
  147. Walters, J. Road Death Risk Higher for Deprived Children. 2002. Available online: https://www.theguardian.com/politics/2002/oct/20/uk.transport (accessed on 15 February 2022).
  148. Clark, A. Shock Tactics Hailed as Road Injuries Fall. 2003. Available online: https://www.theguardian.com/uk/2003/may/02/transport.immigrationpolicy (accessed on 15 February 2022).
  149. Walker, P. Cyclist Fatalities on British Roads Rose by 40% in 2020, says DfT. 2021. Available online: https://www.theguardian.com/world/2021/jun/24/cyclists-killed-on-british-roads-rose-by-40-in-2020-official-figures-show (accessed on 15 February 2022).
  150. Letters. Sound Advice on Staying Safe When Cycling. 2020. Available online: https://www.theguardian.com/lifeandstyle/2020/jun/03/sound-advice-on-staying-safe-when-cycling (accessed on 15 February 2022).
  151. Walker, P. Drivers Who Pass Cycle Training Scheme Could Get Cheaper Insurance. 2018. Available online: https://www.theguardian.com/uk-news/2018/nov/22/drivers-who-pass-cycle-training-scheme-could-get-cheaper-insurance (accessed on 15 February 2022).
  152. Jeffries, S. Pavements Are for Everybody. Except Pedestrians. 2018. Available online: https://www.theguardian.com/commentisfree/2018/feb/27/pavements-pedestrians-cyclists-walkers-hire-bikes (accessed on 15 February 2022).
  153. News, U. Pensioners to Get Cheap Bus Travel. 2000. Available online: https://www.theguardian.com/uk/2000/aug/09/transport.world (accessed on 15 February 2022).
  154. Wainwright, M. Undercover Pensioners Test Bus Service Quality. 2000. Available online: https://www.theguardian.com/world/2000/mar/06/transport.uk (accessed on 15 February 2022).
  155. Clark, A. Half Fares on Buses Urged for Students and Jobless. 2002. Available online: https://www.theguardian.com/uk/2002/dec/02/highereducation.transport (accessed on 15 February 2022).
  156. Hill, D. London’S Bus Drivers Deserve A Better Deal. 2015. Available online: https://www.theguardian.com/uk-news/davehillblog/2015/jan/13/londons-bus-drivers-deserve-a-better-deal (accessed on 15 February 2022).
  157. Tran, M. London Bus Strike Hits Commuters. 2015. Available online: https://www.theguardian.com/uk-news/2015/jan/13/london-bus-strike-hits-commuters (accessed on 15 February 2022).
  158. Letters. A Case for Integrated Public Transport across the Country. 2019. Available online: https://www.theguardian.com/politics/2019/may/27/a-case-for-integrated-public-transport-across-the-country (accessed on 15 February 2022).
  159. Topham, G. Air-Filtering Bus to Launch Across Six Regions in the UK. 2020. Available online: https://www.theguardian.com/global/2020/jan/24/air-filtering-bus-to-launch-across-six-regions-in-the-uk (accessed on 15 February 2022).
  160. Letters. Why Aren’t All Bus Drivers Being Protected? 2020. Available online: https://www.theguardian.com/world/2020/apr/07/why-arent-all-bus-drivers-being-protected (accessed on 15 February 2022).
  161. Ambrose, J. UK Electric Buses Boosted by Innovative £20 m Battery Deal. 2020. Available online: https://www.theguardian.com/business/2020/jun/23/uk-electric-buses-battery-deal-zenobe-energy (accessed on 15 February 2022).
  162. Blackall, M. Behaviour Is Getting Worse’: The Latest from the UK Covid Frontline. 2021. Available online: https://www.theguardian.com/world/2021/mar/09/behaviour-is-getting-worse-the-latest-from-the-uk-covid-frontline (accessed on 15 February 2022).
  163. Media, P. Boris Johnson to Unveil £3 bn Bus Sector Shake-Up to Drive ‘Levelling Up’. 2021. Available online: https://www.theguardian.com/politics/2021/mar/15/boris-johnson-to-unveil-3bn-bus-sector-shake-up-to-drive-levelling-up (accessed on 15 February 2022).
  164. Team, G.C. Tell Us: Has Your Commute Changed Due to the Pandemic? 2021. Available online: https://www.theguardian.com/cities/2021/jun/21/tell-us-has-the-pandemic-changed-your-attitude-towards-commuting (accessed on 15 February 2022).
  165. Mason, R. Transport Secretary Backs London Mayor’s Rule for Compulsory Masks on TfL. 2021. Available online: https://www.theguardian.com/uk-news/2021/jul/14/shapps-mask-wearing-expected-to-remain-on-public-transport (accessed on 15 February 2022).
  166. Topham, G. UK Bus privatisation BREACHED Basic Rights, Says Ex-UN Rapporteur. 2021. Available online: https://www.theguardian.com/politics/2021/jul/19/uk-bus-privatisation-has-caused-poverty-and-job-losses-says-un (accessed on 15 February 2022).
  167. Topham, G. Covid Set Back Attitudes to Public Transport by TWO decades, Says RAC. 2020. Available online: https://www.theguardian.com/uk-news/2020/nov/09/covid-set-back-attitudes-to-public-transport-by-two-decades-says-rac (accessed on 15 February 2022).
  168. Khawaja, B. Bus Privatisation Has Destroyed a British Public Service—But There Is a Way Back. 26 July 2021. Available online: https://www.theguardian.com/commentisfree/2021/jul/26/bus-privatisation-public-service-strategy-british-private-market (accessed on 15 February 2022).
  169. Association, P. East coast MAINLINE Trains Severely Disrupted by Wire Damage. 10 July 2019. Available online: https://www.theguardian.com/uk-news/2019/jul/10/east-coast-mainline-trains-severely-disrupted-by-wire-damage (accessed on 15 February 2022).
  170. Walawalkar, A. Staff Shortages Hit Rail Services as New Timetable Takes Effect. 15 December 2019. Available online: https://www.theguardian.com/uk-news/2019/dec/15/staff-shortages-hit-rail-services-as-new-timetable-takes-effect (accessed on 15 February 2022).
  171. Walker, A. Majority of Passengers with Disabilities Report Problems Using Trains. 2019. Available online: https://www.theguardian.com/society/2019/jul/08/majority-passengers-disabilities-report-problems-using-trains-uk (accessed on 15 February 2022).
  172. Topham, G. London Seeks Further Treasury Funds for Delayed Crossrail. 2018. Available online: https://www.theguardian.com/uk-news/2018/sep/06/delays-to-london-crossrail-could-cost-tfl-20m-in-lost-revenue (accessed on 15 February 2022).
  173. Topham, G. Crossrail Boss Steps Down after Project Delays. 2018. Available online: https://www.theguardian.com/uk-news/2018/nov/02/crossrail-boss-steps-down-after-project-delays (accessed on 15 February 2022).
  174. Topham, G. Southern Rail Gets Lowest Satisfaction Score in Passenger Survey. 2017. Available online: https://www.theguardian.com/uk-news/2017/jul/25/southern-rail-gets-lowest-satisfaction-score-in-passenger-survey (accessed on 15 February 2022).
  175. Branigan, T. Big Train Firms Fare Worst for Satisfaction. 2007. Available online: https://www.theguardian.com/uk/2007/jun/05/transport.politics (accessed on 15 February 2022).
  176. Cash, M. The Southern Scandal Has Gone on Long Enough. GTR Must Lose Its Contract. 2016. Available online: https://www.theguardian.com/commentisfree/2016/jul/20/southern-scandal-gtr-rail-services (accessed on 15 February 2022).
  177. Walters, J.; Ahmed, K. Railtrack Goes Half Steam Ahead. 2000. Available online: https://www.theguardian.com/uk/2000/nov/26/transport.world (accessed on 15 February 2022).
  178. Topham, G. ‘What Matters Is That It Works’: Peter Hendy on TfL, Network Rail and Mayors. 2015. Available online: https://www.theguardian.com/business/2015/jul/03/ex-london-transport-chief-completes-move-national-rail (accessed on 15 February 2022).
  179. Kelso, P. Branson Derailed in Easyjet Head to Head. 1999. Available online: https://www.theguardian.com/world/1999/dec/11/transport.uk (accessed on 15 February 2022).
  180. Harper, K.; Wilson, J. Apex Fares Cancelled by Train Companies. 2000. Available online: https://www.theguardian.com/uk/2000/oct/28/transport.hatfield2 (accessed on 15 February 2022).
  181. The Guardian. Most passengers miss out on rail compensation. 2000. Available online: https://www.theguardian.com/world/2000/nov/21/transport.uk (accessed on 15 February 2022).
  182. Topham, G. Rail Fares in England to Rise above Inflation for First Time Since 2013. 2020. Available online: https://www.theguardian.com/money/2020/dec/16/rail-fares-in-england-to-rise-above-inflation-for-first-time-since-2013 (accessed on 15 February 2022).
  183. Topham, G. Rail Fares to Increase by 3.8% in March. 2021. Available online: https://www.theguardian.com/money/2021/dec/17/rail-fares-increase-march-inflation (accessed on 15 February 2022).
  184. Topham, G. FirstGroup to Launch Budget London to Edinburgh Rail Service Next Month. 2021. Available online: https://www.theguardian.com/uk-news/2021/sep/07/firstgroup-to-launch-budget-london-to-edinburgh-rail-service-next-month (accessed on 15 February 2022).
  185. Topham, G.; Makortoff, K. Flexible Rail Season Tickets in England Criticised over Savings Claims. 21 June 2021. Available online: https://www.theguardian.com/money/2021/jun/21/flexible-rail-season-tickets-on-sale–england-covid-19-pandemic (accessed on 15 February 2022).
  186. Topham, G. Back to the Bad Old Days’: Swingeing Rail Cuts Set Alarm Bells Ringing. 5 December 2021. Available online: https://www.theguardian.com/business/2021/dec/05/back-bad-old-days-swingeing-rail-cuts-alarm-bells-ringing (accessed on 15 February 2022).
  187. Milmo, D. Network Rail Cuts Bonuses over Crash. 2007. Available online: https://www.theguardian.com/business/2007/may/24/transportintheuk1 (accessed on 15 February 2022).
  188. Milmo, D. Downturn Is Shunting Railway Industry towards Bail-Out. 2009. Available online: https://www.theguardian.com/business/2009/feb/01/transport-rail-industry-uk-bail-out (accessed on 15 February 2022).
  189. Milmo, D. Go-Ahead ‘Surprised’ by Public Transport Boom. 2008. Available online: https://www.theguardian.com/business/2008/sep/06/goaheadgroup.transport (accessed on 15 February 2022).
  190. Milmo, D. Drivers Taking the Bus Help FirstGroup Revenues. 2007. Available online: https://www.theguardian.com/business/2007/nov/08/transportintheuk (accessed on 15 February 2022).
  191. The Guardian. Government ‘Underestimates’ Air Travel Boom. 2006. Available online: https://www.theguardian.com/travel/2006/nov/20/travelnews.uknews.transportintheuk1 (accessed on 15 February 2022).
  192. Milmo, D. Tube Station Work Halted after Discovery of £400 m Funding Gap. 2009. Available online: https://www.theguardian.com/uk/2009/apr/01/london-transport-tube-travel (accessed on 15 February 2022).
  193. Greenfield, E. Channel Tunnel is Final Choice—‘a sound investment’. 1964. Available online: https://www.theguardian.com/world/1964/feb/07/france.transport (accessed on 15 February 2022).
  194. Kramer, S. Bonds: They’ll Work Here. 1999. Available online: https://www.theguardian.com/world/1999/nov/24/transport.uk1 (accessed on 15 February 2022).
  195. Bowers, S. Tube Bidder Lauds Private Sector Role. 2000. Available online: https://www.theguardian.com/business/2000/dec/01/transportintheuk (accessed on 15 February 2022).
  196. The Guardian. Transport Commissioner Attacks Labour’s Tube Plans. 2001. Available online: https://www.theguardian.com/world/2001/jul/06/transport.uk (accessed on 15 February 2022).
  197. Walters, J. Virgin to Sue Railtrack. 2001. Available online: https://www.theguardian.com/business/2001/apr/15/transportintheuk.transportpolicy (accessed on 15 February 2022).
  198. The Guardian. Four Die as Train Derails. 2000. Available online: https://www.theguardian.com/uk/2000/oct/17/hatfield.transport (accessed on 15 February 2022).
  199. Milmo, D. Tube Lines Chief Offered National Express Job. 2009. Available online: https://www.theguardian.com/business/2009/dec/07/tube-lines-finch-national-express (accessed on 15 February 2022).
  200. Syal, R. Chris Grayling Lands £100 k Job Advising Some of UK’s Top Ports. 2020. Available online: https://www.theguardian.com/politics/2020/sep/17/chris-grayling-lands-100k-job-advising-some-of-uks-top-ports (accessed on 15 February 2022).
  201. Greenfield, P. No-Deal Brexit Ferry Company Owns No Ships and Has Never Run Channel Service. 2018. Available online: https://www.theguardian.com/politics/2018/dec/30/no-deal-brexit-ferry-company-owns-no-ships-and-has-never-run-ferry-service (accessed on 15 February 2022).
  202. Whey, S. Stagecoach Makes £1.7 bn Merger Offer for Rival National Express. 2009. Available online: https://www.theguardian.com/uk/2009/oct/19/national-express-stagecoach-merger (accessed on 15 February 2022).
  203. Milmo, D. Eurotunnel Shareholders Cast Decisive Vote. 2007. Available online: https://www.theguardian.com/business/2007/may/21/france.transportintheuk (accessed on 15 February 2022).
  204. Inman, P. When Private Meets Public Sector: The History of a Tangled Relationship. 2018. Available online: https://www.theguardian.com/politics/2018/jan/13/private-public-sector-history-tangled-relationship (accessed on 15 February 2022).
  205. Greenfield, P. FirstGroup Rejects Takeover Bid from US Equity Group Apollo. 2018. Available online: https://www.theguardian.com/business/2018/apr/11/firstgroup-rejects-takeover-bid-from-us-equity-group-apollo (accessed on 15 February 2022).
  206. Topham, G. Eurotunnel Renamed Getlink in Preparation for Post-Brexit Era. 20 November 2017. Available online: https://www.theguardian.com/business/2017/nov/20/eurotunnel-rebrand-getlink-brexit-channel-tunnel (accessed on 15 February 2022).
  207. Topham, G. HS2 Rail Leg to Leeds Scrapped, Grant Shapps Confirms. 18 November 2021. Available online: https://www.theguardian.com/uk-news/2021/nov/18/hs2-rail-leg-to-leeds-scrapped-grant-shapps-confirms (accessed on 15 February 2022).
  208. Heathrow Airport Expansion. 2016. Available online: https://www.gov.uk/government/collections/heathrow-airport-expansion (accessed on 15 February 2022).
  209. Airport Expansions. Available online: https://friendsoftheearth.uk/climate/airport-expansions (accessed on 15 February 2022).
  210. Taylor, M. Campaigners Say UK Airport Expansion Plans Must Be Suspended Amid New Climate Goals. 2021. Available online: https://www.theguardian.com/world/2021/may/10/campaigners-say-uk-airport-expansion-plans-must-be-suspended-amid-new-climate-goals (accessed on 15 February 2022).
  211. Third Runway. Available online: https://www.theguardian.com/environment/heathrow-third-runway (accessed on 15 February 2022).
  212. Asthana, A.; Laville, S.; Kale, S. Grounded: Why Heathrow’s Third Runway May Never Happen. 6 March 2020. Available online: https://www.theguardian.com/news/audio/2020/mar/06/grounded-why-heathrows-third-runway-may-never-happen (accessed on 15 February 2022).
  213. Topham, G. Heathrow to Challenge Third Runway Verdict Using Climate Pledge. 2020. Available online: https://www.theguardian.com/environment/2020/oct/06/heathrow-to-challenge-third-runway-verdict-using-climate-pledge (accessed on 15 February 2022).
  214. Media, P. Climate Lawyer Loses Supreme Court Appeal over Heathrow Leak. 20 December 2021. Available online: https://www.theguardian.com/environment/2021/dec/20/climate-lawyer-loses-supreme-court-appeal-over-heathrow-leak (accessed on 15 February 2022).
  215. Ungoed-Thomas, J. Nearly 300 Flights within UK Taken by Government Staff...Every Day. 7 November 2021. Available online: https://www.theguardian.com/environment/2021/nov/07/nearly-300-flights-within-uk-taken-by-government-staff-every-day (accessed on 15 February 2022).
  216. Harper, K. Inquiry Likely to Focus on Driver Error. 1999. Available online: https://www.theguardian.com/uk/1999/oct/06/ladbrokegrove.transport1 (accessed on 15 February 2022).
  217. Carnage at Paddington. 1999. Available online: https://www.theguardian.com/uk/1999/oct/06/ladbrokegrove.transport9 (accessed on 15 February 2022).
  218. Statement by Railtrack, Thames Trains, First Great Western. 1999. Available online: https://www.theguardian.com/uk/1999/oct/06/ladbrokegrove.transport5 (accessed on 15 February 2022).
  219. Harper, K.; Maguire, K. Prescott Pledges £1 bn for Rail Safety. 1999. Available online: https://www.theguardian.com/uk/1999/oct/07/ladbrokegrove.transport10 (accessed on 15 February 2022).
  220. Harper, K.; Hall, S. Lamentable Failures that Claimed 31 Lives. 2001. Available online: https://www.theguardian.com/uk/2001/jun/20/ladbrokegrove.transport2 (accessed on 15 February 2022).
  221. Topham, G.; Morris, S. Salisbury Train Crash May Have been Caused by Leaves on Line. 2 November 2021. Available online: https://www.theguardian.com/uk-news/2021/nov/02/salisbury-train-crash-may-have-been-caused-by-leaves-on-line (accessed on 15 February 2022).
  222. The Guardian. Railtrack Faces £600 m Losses. 2001. Available online: https://www.theguardian.com/world/2001/jan/15/transport.uk (accessed on 15 February 2022).
  223. Khomami, N. Commuters Urged to Make Small Talk to Help Prevent Railway Suicides. 2017. Available online: https://www.theguardian.com/uk-news/2017/nov/15/commuters-urged-to-make-small-talk-to-help-prevent-railway-suicides (accessed on 15 February 2022).
  224. Britain’s Rail Disaster History. 2000. Available online: https://www.theguardian.com/uk/2000/oct/17/ladbrokegrove.transport (accessed on 15 February 2022).
  225. Weaver, M.; Dodd, V. UK Rail Worker Dies of Coronavirus after Being Spat at While on Duty. 2020. Available online: https://www.theguardian.com/uk-news/2020/may/12/uk-rail-worker-dies-coronavirus-spat-belly-mujinga (accessed on 15 February 2022).
  226. Wainwright, M. Selby Rail CRASH Motorist blames ‘Fate’. 2011. Available online: https://www.theguardian.com/uk/2011/feb/28/selby-rail-crash-driver-fate (accessed on 15 February 2022).
  227. Malik, S.; Agencies. Woman and Child Killed by Rush-Hour Train in Surrey. 2013. Available online: https://www.theguardian.com/uk/2013/mar/22/woman-child-killed-train-surrey (accessed on 15 February 2022).
  228. Quinn, B. Woman Gets Electric Shock after Climbing on to Freight Train. 2014. Available online: https://www.theguardian.com/uk-news/2014/feb/01/woman-train-hackney-hospital (accessed on 15 February 2022).
  229. Siddique, H. Heathrow Airport: Engineer Killed in Vehicle Crash on Airfield. 2018. Available online: https://www.theguardian.com/uk-news/2018/feb/14/heathrow-airport-serious-accident-on-airfield-disrupts-flights (accessed on 15 February 2022).
  230. Association, P. Woman Killed on Train May Have been Leaning Out of Window, Say Police. 2018. Available online: https://www.theguardian.com/uk-news/2018/dec/02/woman-killed-on-train-may-have-been-leaning-out-of-window-say-police (accessed on 15 February 2022).
  231. Campbell, L. Man Jailed for Driving a Car Half a Mile on Railway Track in Birmingham. 2021. Available online: https://www.theguardian.com/uk-news/2021/sep/07/man-jailed-for-driving-a-car-half-a-mile-on-railway-track-in-birmingham (accessed on 15 February 2022).
  232. Morris, S. Woman Hit by Branch When Leaning Out Train Window Near Bath, Inquest Hears. 2021. Available online: https://www.theguardian.com/uk-news/2021/may/26/woman-hit-by-branch-leaning-out-train-window-inquest-bethan-roper (accessed on 15 February 2022).
  233. Marsh, S. Missing 12-Year-Old Girls Found after Night Locked Inside Train. 2021. Available online: https://www.theguardian.com/uk-news/2021/mar/22/missing-12-year-old-girls-found-after-night-locked-inside-train (accessed on 15 February 2022).
  234. The Government’s Road Safety Strategy: Text of Tony Blair’s Speech. 2000. Available online: https://www.theguardian.com/world/2000/mar/01/transport.uk1 (accessed on 15 February 2022).
  235. Association, P. Bail for Driver in Fatal Coach Crash. 2007. Available online: https://www.theguardian.com/uk/2007/jan/05/transport.world2 (accessed on 15 February 2022).
  236. Davies, C. Britain’s Freeze Claims a New Victim as Boy Falls through Ice. 2009. Available online: https://www.theguardian.com/uk/2009/feb/08/snow-deaths-ice (accessed on 15 February 2022).
  237. Carrell, S. Girl DIES in school Bus Crash. 2010. Available online: https://www.theguardian.com/uk/2010/mar/31/school-bus-crash-kills-girl (accessed on 15 February 2022).
  238. Association, P. M5 Crash: Somerset Residents Describe Tragic Scene. 2011. Available online: https://www.theguardian.com/uk/2011/nov/05/m5-crash-somerset-residents-scene (accessed on 15 February 2022).
  239. Neild, B. M5 Coach CRASH leaves One Dead as Police Arrest Driver. 2012. Available online: https://www.theguardian.com/uk/2012/mar/24/m5-coach-crash-lorry-motorway (accessed on 15 February 2022).
  240. Morris, S. Police Investigating Claims of ‘BMW Race’ in Lead-Up to M1 Crash. 2012. Available online: https://www.theguardian.com/uk/2012/dec/03/police-investigating-bmw-race-crash (accessed on 15 February 2022).
  241. Perraudin, F. Man Dies in Collision with Nottingham Tram. 2016. Available online: https://www.theguardian.com/uk-news/2016/aug/16/man-dies-in-collision-with-nottingham-tram (accessed on 15 February 2022).
  242. Wolfe-Robinson, M. Sixty Schoolchildren Rescued from Doubledecker in Lincoln after Crash. 11 November 2021. Available online: https://www.theguardian.com/uk-news/2021/nov/11/sixty-schoolchildren-rescued-from-doubledecker-in-lincoln-after-crash (accessed on 15 February 2022).
  243. Slawson, N. Woman Killed as Buses Collide at Victoria Station in London. 2021. Available online: https://www.theguardian.com/uk-news/2021/aug/10/woman-killed-buses-collide-victoria-station-london (accessed on 15 February 2022).
  244. Wolfe-Robinson, M. Smart Motorways Present Ongoing Risk of Death, Says Coroner. 2021. Available online: https://www.theguardian.com/world/2021/jan/18/smart-motorways-present-ongoing-risk-of-death-says-coroner (accessed on 15 February 2022).
  245. Topham, G. Highways England’s Smart Motorways Policy Killed Drivers, Says Ex-Minister. 2020. Available online: https://www.theguardian.com/politics/2020/jan/27/highways-englands-smart-motorways-policy-killed-drivers-exminister (accessed on 15 February 2022).
  246. The Guardian. Government Accused of ‘Wimping out’ on Road Safety. 2000. Available online: https://www.theguardian.com/world/2000/mar/01/transport.uk (accessed on 15 February 2022).
  247. Gibbs, G. Fake Crash Aimed to Deter Joyriding. 2000. Available online: https://www.theguardian.com/world/2000/mar/10/transport.uk (accessed on 15 February 2022).
  248. Harper, K. Drink-Driving Cave-in to Alcohol Lobby. 2000. Available online: https://www.theguardian.com/uk/2000/mar/27/transport.world (accessed on 15 February 2022).
  249. Wainwright, M. Dozing Driver Who Caused 10 Deaths Gets Five Years. 2002. Available online: https://www.theguardian.com/uk/2002/jan/12/transport.selby (accessed on 15 February 2022).
  250. Carter, H. Driving test enters VIRTUAL Reality. 2002. Available online: https://www.theguardian.com/uk/2002/sep/20/transport.world (accessed on 15 February 2022).
  251. Ahmed, K. Reckless Drivers Who Kill Face 14 Years in Jail. 2003. Available online: https://www.theguardian.com/politics/2003/may/11/transport.ukcrime (accessed on 15 February 2022).
  252. Jowit, J. Device That Won’t Let Drinkers Drive. 2004. Available online: https://www.theguardian.com/politics/2004/feb/29/uk.transport (accessed on 15 February 2022).
  253. Muir, H. Met ‘Soft’ on Drink and Drive Officers. 2004. Available online: https://www.theguardian.com/uk/2004/jun/22/drugsandalcohol.ukcrime (accessed on 15 February 2022).
  254. Jones, R. Car Menaces Still at Large. 2004. Available online: https://www.theguardian.com/uk/2004/jul/17/motoring.lifeandhealth (accessed on 15 February 2022).
  255. Sturcke, J. Privacy CONCERNS over police ROAD Camera Plans. 2005. Available online: https://www.theguardian.com/uk/2005/mar/23/ukcrime.transport (accessed on 15 February 2022).
  256. Morris, S. Judge Gives Discharge to 159mph PC. 2006. Available online: https://www.theguardian.com/uk/2006/aug/26/transport.ukcrime (accessed on 15 February 2022).
  257. Osborne, H. Speed Limit Enforcement Cuts Pollution, Report Shows. 2006. Available online: https://www.theguardian.com/environment/2006/oct/23/travelsenvironmentalimpact.transportintheuk (accessed on 15 February 2022).
  258. Dyer, C. Motorists Risk Jail for Using Phones in Car. 2006. Available online: https://www.theguardian.com/uk/2006/dec/14/ukcrime.mobilephones (accessed on 15 February 2022).
  259. Wainwright, M. Driver Who Deflected Speed Guns Guilty of Perverting Justice. 2007. Available online: https://www.theguardian.com/uk/2007/aug/31/transport.world1 (accessed on 15 February 2022).
  260. Milmo, D. Driving Test Changes Planned to Cut Deaths of Young Motorists. 2009. Available online: https://www.theguardian.com/uk/2009/apr/21/driving-test-changes (accessed on 15 February 2022).
  261. Bennett, C. Driverless cars WILL Geld the Dangerous Stallions of the Road. 2016. Available online: https://www.theguardian.com/commentisfree/2016/dec/04/driverless-cars-boris-johnson-stallion-road-safety (accessed on 15 February 2022).
  262. O’Carroll, L. RAC Hits Out at ‘Truly Shocking’ Lockdown Speeding Offences. 2 June 2020. Available online: https://www.theguardian.com/uk-news/2020/jun/02/rac-hits-out-at-truly-shocking-lockdown-speeding-offences (accessed on 15 February 2022).
  263. The Guardian. Beware of ‘Ice Bombs’ from Airliners, Says MP. 2000. Available online: https://www.theguardian.com/uk/2000/nov/16/transport.world (accessed on 15 February 2022).
  264. Patrick, G.P.W.; Wolfe-Robinson, M. Bad Weather Causes Delays on Train Routes to Glasgow Cop26 Talks. 2021. Available online: https://www.theguardian.com/uk-news/2021/oct/31/bad-weather-causes-delays-on-train-route-to-glasgow-cop26-talks (accessed on 15 February 2022).
  265. Tran, M. Network Rail Unveils ‘Magic’ De-Icer. 2005. Available online: https://www.theguardian.com/business/2005/nov/24/transportintheuk.money (accessed on 15 February 2022).
  266. Balakrishnan, A. Peril on Roads after Heavy Snow in Northern England and Scotland. 2008. Available online: https://www.theguardian.com/uk/2008/dec/04/snow-roads-northern-england-scotland (accessed on 15 February 2022).
  267. Jones, S.; Gillan, A. The Day the Snow Came—And Britain Stopped. 2009. Available online: https://www.theguardian.com/uk/2009/feb/02/snow-brings-britain-travel-chaos (accessed on 15 February 2022).
  268. Mulholland, H. London Snowfall: Boris Transport Chief Rejects Livingstone Criticism. 2009. Available online: https://www.theguardian.com/politics/2009/feb/03/boris-johnson-ken-livingstone-snow-london (accessed on 15 February 2022).
  269. The Guardian. Transport Minister Resigns over Scotland’s Snow Chaos. 2010. Available online: https://www.theguardian.com/uk/2010/dec/11/scottish-transport-minister-stewart-stevenson-resigns-snow (accessed on 15 February 2022).
  270. Williams, R. Floods, Snow and Gales Batter Britain. 2009. Available online: https://www.theguardian.com/uk/2009/feb/10/flood-snow-weather-uk (accessed on 15 February 2022).
  271. Milmo, D.; Gabbatt, A. Snow Strands Passengers at Gatwick and Luton. 2010. Available online: https://www.theguardian.com/uk/2009/dec/18/snow-england-north-east-south (accessed on 15 February 2022).
  272. Walker, P. Schools Reopen as UK Temperatures Rise. 2010. Available online: https://www.theguardian.com/uk/2010/jan/11/schools-reopen-uk-temperatures-rise (accessed on 15 February 2022).
  273. Wainwright, M.; Milmo, D. UK Snow-Readiness Audit Ordered as Travel Chaos Takes over Country. 2010. Available online: https://www.theguardian.com/uk/2010/dec/01/snow-readiness-audit-travel-chaos (accessed on 15 February 2022).
  274. Mistlin, A. UK Weather: Storm Darcy to Cause Further Disruption across UK. 8 February 2021. Available online: https://www.theguardian.com/uk-news/2021/feb/08/storm-darcy-snow-ice-further-disruption-across-uk (accessed on 15 February 2022).
  275. Topham, G.; Ratcliffe, R. Smooth Christmas Getaway in Prospect with UK Transport Links Working Well. 2011. Available online: https://www.theguardian.com/uk/2011/dec/16/christmas-getaway-rail-roads-weather-good (accessed on 15 February 2022).
  276. Peter Walker, B.Q.; Urquhart, C. Storms across Britain Leave Five Dead and Christmas Travel in Chaos. 2013. Available online: https://www.theguardian.com/uk-news/2013/dec/24/storms-britain-dead-christmas-travel-chaos (accessed on 15 February 2022).
  277. Gwyn Topham, T.C. UK Storms and Flooding Set Back Rail Repairs. 2014. Available online: https://www.theguardian.com/environment/2014/feb/17/uk-storms-flooding-rail-repairs (accessed on 15 February 2022).
  278. Davies, C.; Gayle, D. Villagers Evacuated as Snow, High Winds and Flooding Bring Havoc to UK. 2017. Available online: https://www.theguardian.com/uk-news/2017/jan/12/storms-bring-snow-high-winds-and-flood-warnings-to-britain (accessed on 15 February 2022).
  279. Association, P. Scottish Firms Warned Not to Punish Staff Who Followed Snow Advice. 2018. Available online: https://www.theguardian.com/uk-news/2018/mar/04/scottish-employers-warned-penalising-staff-snow-advice (accessed on 15 February 2022).
  280. Busby, M. UK Weather: Heavy Rain and High Temperatures Bring Travel Chaos. 2019. Available online: https://www.theguardian.com/uk-news/2019/jul/27/uk-weather-warning-heavy-rain-high-temperatures-met-office (accessed on 15 February 2022).
  281. Topham, G. UK Railways Cannot Cope with Climate Crisis, Says Rail Boss. 2019. Available online: https://www.theguardian.com/uk-news/2019/nov/07/uk-railways-cannot-cope-with-effects-climate-change-warns-rail-boss (accessed on 15 February 2022).
  282. Campbell, L. Two Bridges Swept away Amid Flooding in Scottish Borders. 29 October 2021. Available online: https://www.theguardian.com/uk-news/2021/oct/29/two-bridges-swept-away-flooding-scottish-borders (accessed on 15 February 2022).
  283. Rawlinson, K. London Tube to Close Many Stations Because of Coronavirus. 2020. Available online: https://www.theguardian.com/uk-news/2020/mar/19/london-tube-to-close-many-stations-because-of-coronavirus (accessed on 15 February 2022).
  284. Hall, R. Bank Holiday Weekend Travel Warning as Fine Weather Forecast for UK. 27 August 2021. Available online: https://www.theguardian.com/uk-news/2021/aug/27/bank-holiday-weekend-travel-warning-as-fine-weather-forecast-for-uk (accessed on 15 February 2022).
  285. Campbell, L. Tower Bridge Stuck in Open Position Overnight after ‘Technical Failure’. 2021. Available online: https://www.theguardian.com/uk-news/2021/aug/09/disruption-as-tower-bridge-stuck-open-after-technical-failure (accessed on 15 February 2022).
  286. Press Association. London Waterloo Commuters Told Not to Travel Due to Engineering Delays. 2018. Available online: https://www.theguardian.com/uk-news/2018/nov/19/london-waterloo-commuters-told-not-to-travel-due-to-engineering-delays (accessed on 15 February 2022).
  287. Pidd, H.; Walker, A. Lightning Strikes Disrupt rail Services in Northern England. 2018. Available online: https://www.theguardian.com/uk-news/2018/jul/27/lightning-strikes-disrupt-rail-services-in-northern-england (accessed on 15 February 2022).
  288. Slawson, N.; Grierson, J. Nottingham Train Station Fire Was Arson, Police Believe. 2018. Available online: https://www.theguardian.com/uk-news/2018/jan/12/nottingham-train-station-evacuated-after-large-fire (accessed on 15 February 2022).
  289. Jones, H. Easter Getaway: M6 and M4 to Bear Brunt of Bank Holiday Traffic. 2017. Available online: https://www.theguardian.com/uk-news/2017/apr/13/easter-getaway-busy-roads-and-mild-weather-forecast (accessed on 15 February 2022).
  290. Clark, A. Leaf Blitz Clears Rail Lines. 2003. Available online: https://www.theguardian.com/uk/2003/nov/04/transport.world (accessed on 15 February 2022).
  291. Rawlinson, K. Christmas Eve Journeys Hit by Rail Disruption across UK. 2015. Available online: https://www.theguardian.com/uk-news/2015/dec/24/christmas-eve-journeys-rail-train-travellers (accessed on 15 February 2022).
  292. Gayle, D. Notting Hill Carnival: Bank Holiday Rain Threatens to Dampen Spirits. 2015. Available online: https://www.theguardian.com/uk-news/2015/aug/30/bank-holiday-weather-thundery-downpours-loom-for-southern-england (accessed on 15 February 2022).
  293. Topham, G. Easter Road Traffic Set to Hit 2015 Peak as Major Rail Lines Close. 2015. Available online: https://www.theguardian.com/world/2015/apr/02/easter-road-traffic-set-to-hit-2015-peak-as-major-rail-lines-close (accessed on 15 February 2022).
  294. Waldram, H. How to Get to the Olympics: Alternative Travel Routes. 2012. Available online: https://www.theguardian.com/uk/london-2012-olympics-blog/2012/aug/03/how-to-get-to-olympics-alternative-routes (accessed on 15 February 2022).
  295. Association, P. Bakerloo Line Hit by Delays as Part of Tunnel Falls on Track. 2012. Available online: https://www.theguardian.com/uk/2012/apr/26/bakerloo-line-delays-tunnel-track (accessed on 15 February 2022).
  296. Harris, P. Britons Swelter—In Airports and Traffic Jams. 2002. Available online: https://www.theguardian.com/uk/2002/jul/28/transport.world (accessed on 15 February 2022).
  297. Moloney, C. Southern Cancels London Victoria Trains for Two Weeks over Covid. 2021. Available online: https://www.theguardian.com/uk-news/2021/dec/30/southern-cancels-london-victoria-trains-for-two-weeks-over-covid (accessed on 15 February 2022).
  298. Taylor, R. Rail Guards Vote to Strike over Train Safety. 1999. Available online: https://www.theguardian.com/uk/1999/oct/14/ladbrokegrove.transport1 (accessed on 15 February 2022).
  299. Bowers, S. BA to Shed 1000 Jobs at Gatwick. 2000. Available online: https://www.theguardian.com/business/2000/dec/07/transportintheuk1 (accessed on 15 February 2022).
  300. Gow, D. Cabin Crew Union Takes on Branson. 2000. Available online: https://www.theguardian.com/uk/2000/dec/29/transport.world (accessed on 15 February 2022).
  301. Davies, C. London Underground Strikes Threaten to Disrupt Festive Season. 25 November 2021. Available online: https://www.theguardian.com/uk-news/2021/nov/25/london-underground-strikes-threaten-to-disrupt-festive-season (accessed on 15 February 2022).
  302. Harper, K. London commuters FACE Rail Strikes. 2000. Available online: https://www.theguardian.com/world/2000/jan/15/transport.uk (accessed on 15 February 2022).
  303. Topham, G. British Airways Cabin Crew to Hold Four-Day Strike Over Pay Dispute. 2017. Available online: https://www.theguardian.com/business/2017/jun/02/ba-shutdown-caused-by-contractor-who-switched-off-power-reports-claim (accessed on 15 February 2022).
  304. Chrisafis, A. French Customs Strike Continues to Cause Cross-Channel Travel Chaos. 2019. Available online: https://www.theguardian.com/world/2019/mar/20/french-customs-strike-continues-to-cause-cross-channel-travel-chaos (accessed on 15 February 2022).
  305. Butler, S. Yodel Workers to Strike, Threatening MS, Aldi and Very Deliveries. 2021. Available online: https://www.theguardian.com/business/2021/sep/16/yodel-workers-strike-marks-spencer-aldi-very-deliveries (accessed on 15 February 2022).
  306. Weaver, M. Bus Network in Britain Facing Strikes over Drivers’ Low Pay. 2021. Available online: https://www.theguardian.com/uk-news/2021/oct/14/bus-network-in-britain-facing-strikes-over-drivers-low-pay (accessed on 15 February 2022).
  307. Tapper, J. Nurses and Shop Staff in UK Face Tide of Abuse since End of Lockdowns. 2021. Available online: https://www.theguardian.com/money/2021/oct/23/nurses-and-shop-staff-in-uk-face-tide-of-abuse-since-end-of-lockdowns (accessed on 15 February 2022).
  308. Stone, T. ERTICO—ITS Europe Elects Angelos Amditis as New Board Chairman. 2018. Available online: https://www.traffictechnologytoday.com/news/its/ertico-its-europe-elects-angelos-amditis-as-new-board-chairman.html (accessed on 15 February 2022).
  309. Stone, T. ITS America Picks Laura Chace as New President and CEO. 2021. Available online: https://www.traffictechnologytoday.com/news/appointments/its-america-picks-laura-chace-as-new-president-and-ceo.html (accessed on 15 February 2022).
  310. Stone, T. Laura Shoaf Appointed New Chair of the UK’s Urban Transport Group. 2021. Available online: https://www.traffictechnologytoday.com/news/appointments/laura-shoaf-appointed-new-chair-of-the-uks-urban-transport-group.html (accessed on 15 February 2022).
  311. Stone, T. Woolpert Awarded District-Wide Aerial Photogrammetry Survey Project in Florida. 4 May 2018. Available online: https://www.traffictechnologytoday.com/news/data/woolpert-awarded-district-wide-aerial-photogrammetry-survey-project-in-florida.html (accessed on 15 February 2022).
  312. Frost, A. First Thermal Sensor-Equipped Production AV Set for 2021. 2019. Available online: https://www.traffictechnologytoday.com/news/autonomous-vehicles/first-thermal-sensor-equipped-production-av-set-for-2021.html (accessed on 15 February 2022).
  313. Stone, T. CyberCar Successfully Demonstrates First Use of Blockchain to Deliver Connected Car Data. 2017. Available online: https://www.traffictechnologytoday.com/news/connected-vehicles-infrastructure/cybercar-successfully-demonstrates-first-use-of-blockchain-to-deliver-connected-car-data.html (accessed on 15 February 2022).
  314. Stone, T. SENSORIS Project Releases First Vehicle-to-Cloud Data Standard for CAVs. 2018. Available online: https://www.traffictechnologytoday.com/news/autonomous-vehicles/sensoris-project-releases-first-vehicle-to-cloud-data-standard-for-cavs.html (accessed on 15 February 2022).
  315. Stone, T. Singapore LTA Announces Second Partner to Trial Autonomous Mobility-on-Demand Service. 3 August 2016. Available online: https://www.traffictechnologytoday.com/news/autonomous-vehicles/singapore-lta-announces-second-partner-to-trial-autonomous-mobility-on-demand-service.html (accessed on 15 February 2022).
  316. Stone, T. Highways England Awards Contracts for New Regional Delivery Partnership Scheme. 7 November 2018. Available online: https://www.traffictechnologytoday.com/news/traffic-management/highways-england-awards-contracts-for-new-regional-delivery-partnership-scheme.html (accessed on 15 February 2022).
  317. Stone, T. Organizations Call for New Measures as UK Road Deaths Rise in 2016. 29 September 2017. Available online: https://www.traffictechnologytoday.com/news/safety/organizations-call-for-new-measures-as-uk-road-deaths-rise-in-2016.html (accessed on 15 February 2022).
  318. Stone, T. Emovis Delivers Upgraded Electronic Tolling System for Canada’s A25 Highway. 24 October 2017. Available online: https://www.traffictechnologytoday.com/news/tolling/emovis-delivers-upgraded-electronic-tolling-system-for-canada%c2%92s-a25-highway.html (accessed on 15 February 2022).
  319. Stone, T. Siemens Completes Roll-Out of UK’s Largest Permanent Average Speed Enforcement System. 19 July 2017. Available online: https://www.traffictechnologytoday.com/news/enforcement/siemens-completes-roll-out-of-uks-largest-permanent-average-speed-enforcement-system.html (accessed on 15 February 2022).
  320. Allen, J. Vitronic’s Speed Enforcement Trailer Gets Type Approval in The Netherlands. 10 April 2018. Available online: https://www.traffictechnologytoday.com/news/enforcement/vitronics-speed-enforcement-trailer-gets-type-approval-in-the-netherlands.html (accessed on 15 February 2022).
  321. Stone, T. New UK Partnership Combines Parking and EV Charging Payments. 23 November 2021. Available online: https://www.traffictechnologytoday.com/news/electric-vehicles-ev-infrastructure/new-uk-partnership-combines-parking-and-ev-charging-payments.html (accessed on 15 February 2022).
  322. Frost, A. Wolverhampton Project Aims to Reduce Transport-Sourced Air Pollution. 24 October 2019. Available online: https://www.traffictechnologytoday.com/news/emissions-low-emission-zones/wolverhampton-project-aims-to-reduce-transport-sourced-air-pollution.html (accessed on 15 February 2022).
  323. Stone, T. Ubicquia Acquires AI Platform to Strengthen Its Smart City, Traffic Optimisation Services. 4 May 2020. Available online: https://www.traffictechnologytoday.com/news/acquisitions-mergers/24001.html (accessed on 15 February 2022).
  324. Stone, T. UK Department for Transport Appoints TRL to Study the Impact of Low Emission Buses. 22 August 2017. Available online: https://www.traffictechnologytoday.com/news/safety/uk-department-for-transport-appoints-trl-to-study-the-impact-of-low-emission-buses.html (accessed on 15 February 2022).
  325. To, R.N.; Patrick, V.M. How the eyes connect to the heart: The influence of eye gaze direction on advertising effectiveness. J. Consum. Res. 2021, 48, 123–146. [Google Scholar] [CrossRef]
  326. Anaza, N.A.; Kemp, E.; Briggs, E.; Borders, A.L. Tell me a story: The role of narrative transportation and the C-suite in B2B advertising. Ind. Mark. Manag. 2020, 89, 605–618. [Google Scholar] [CrossRef]
  327. Bandyopadhyay, A.; Septianto, F.; Nallaperuma, K. Mixed feelings enhance the effectiveness of luxury advertising. Australas. Mark. J. 2022, 30, 28–34. [Google Scholar] [CrossRef]
  328. Nong, D.H.; Fox, J.M.; Saksena, S.; Lepczyk, C.A. The Use of Spatial Metrics and Population Data in Mapping the Rural-Urban Transition and Exploring Models of Urban Growth in Hanoi, Vietnam. Environ. Urban. ASIA 2021, 12, 156–168. [Google Scholar] [CrossRef]
  329. Tinessa, F.; Pagliara, F.; Biggiero, L.; Veneri, G.D. Walkability, accessibility to metro stations and retail location choice: Some evidence from the case study of Naples. Res. Transp. Bus. Manag. 2021, 40, 100549. [Google Scholar] [CrossRef]
  330. Mantey, D.; Sudra, P. Types of suburbs in post-socialist Poland and their potential for creating public spaces. Cities 2019, 88, 209–221. [Google Scholar] [CrossRef]
  331. Boukerche, A.; Coutinho, R.W.L. Crowd Management: The Overlooked Component of Smart Transportation Systems. IEEE Commun. Mag. 2019, 57, 48–53. [Google Scholar] [CrossRef]
  332. Tao, H.; Wang, J.; Yaseen, Z.M.; Mohammed, M.N.; Zain, J.M. Shrewd vehicle framework model with a streamlined informed approach for green transportation in smart cities. Environ. Impact Assess. Rev. 2021, 87, 106542. [Google Scholar] [CrossRef]
  333. Kim, S.J.; Kim, T.H. A study on the use of the mobile construction CALS service for the construction of a smart city. In Proceedings of the 2016 6th International Conference on Information Communication and Management (ICICM), Hertfordshire, UK, 29–31 October 2016; IEEE: Piscataway, NJ, USA, 2016; pp. 280–284. [Google Scholar]
  334. Moeini, S.M. Attitudes to urban walking in Tehran. Environ. Plan. B Plan. Des. 2012, 39, 344–359. [Google Scholar] [CrossRef]
  335. Sanchez, T.W. Poverty, policy, and public transportation. Transp. Res. Part A Policy Pract. 2008, 42, 833–841. [Google Scholar] [CrossRef]
  336. Singer, M.E. How affordable are accessible locations? Neighborhood affordability in US urban areas with intra-urban rail service. Cities 2021, 116, 103295. [Google Scholar] [CrossRef]
  337. Aljoufie, M.; Brussel, M.; Zuidgeest, M.; Van Delden, H.; van Maarseveen, M. Integrated analysis of land-use and transport policy interventions. Transp. Plan. Technol. 2016, 39, 329–357. [Google Scholar] [CrossRef]
  338. Yilmaz, M.; Krein, P.T. Review of Battery Charger Topologies, Charging Power Levels, and Infrastructure for Plug-In Electric and Hybrid Vehicles. IEEE Trans. Power Electron. 2013, 28, 2151–2169. [Google Scholar] [CrossRef]
  339. Zhang, H.; Moura, S.J.; Hu, Z.; Song, Y. PEV Fast-Charging Station Siting and Sizing on Coupled Transportation and Power Networks. IEEE Trans. Smart Grid 2018, 9, 2595–2605. [Google Scholar] [CrossRef]
  340. Pieltain Fernández, L.; Gomez San Roman, T.; Cossent, R.; Mateo Domingo, C.; Frías, P. Assessment of the Impact of Plug-in Electric Vehicles on Distribution Networks. IEEE Trans. Power Syst. 2011, 26, 206–213. [Google Scholar] [CrossRef]
  341. Clement-Nyns, K.; Haesen, E.; Driesen, J. The Impact of Charging Plug-In Hybrid Electric Vehicles on a Residential Distribution Grid. IEEE Trans. Power Syst. 2010, 25, 371–380. [Google Scholar] [CrossRef] [Green Version]
  342. Rayle, L.; Dai, D.; Chan, N.; Cervero, R.; Shaheen, S. Just a better taxi? A survey-based comparison of taxis, transit, and ridesourcing services in San Francisco. Transp. Policy 2016, 45, 168–178. [Google Scholar] [CrossRef] [Green Version]
  343. Dias, F.F.; Lavieri, P.S.; Garikapati, V.M.; Astroza, S.; Pendyala, R.M.; Bhat, C.R. A behavioral choice model of the use of car-sharing and ride-sourcing services. Transportation 2017, 44, 1307–1323. [Google Scholar] [CrossRef]
  344. Hall, J.D.; Palsson, C.; Price, J. Is Uber a substitute or complement for public transit? J. Urban Econ. 2018, 108, 36–50. [Google Scholar] [CrossRef] [Green Version]
  345. Fagnant, D.J.; Kockelman, K.M. The travel and environmental implications of shared autonomous vehicles, using agent-based model scenarios. Transp. Res. Part C Emerg. Technol. 2014, 40, 1–13. [Google Scholar] [CrossRef]
  346. Cramer, J.; Krueger, A.B. Disruptive change in the taxi business: The case of Uber. Am. Econ. Rev. 2016, 106, 177–182. [Google Scholar] [CrossRef] [Green Version]
  347. Fishman, E. Bikeshare: A review of recent literature. Transp. Rev. 2016, 36, 92–113. [Google Scholar] [CrossRef]
  348. Alemi, F.; Circella, G.; Handy, S.; Mokhtarian, P. What influences travelers to use Uber? Exploring the factors affecting the adoption of on-demand ride services in California. Travel Behav. Soc. 2018, 13, 88–104. [Google Scholar] [CrossRef]
  349. Yang, H.; Cherry, C.R. Use characteristics and demographics of rural transit riders: A case study in Tennessee. Transp. Plan. Technol. 2017, 40, 213–227. [Google Scholar] [CrossRef]
  350. Liu, Y.; Liu, C.; Yuan, N.J.; Duan, L.; Fu, Y.; Xiong, H.; Xu, S.; Wu, J. Intelligent bus routing with heterogeneous human mobility patterns. Knowl. Inf. Syst. 2017, 50, 383–415. [Google Scholar] [CrossRef]
  351. Freitas, A.L.P. Assessing the quality of intercity road transportation of passengers: An exploratory study in Brazil. Transp. Res. Part A Policy Pract. 2013, 49, 379–392. [Google Scholar] [CrossRef]
  352. Dinulescu, R.; Bugheanu, A.M. Improving users’satisfaction by implementing the analytic hierarchy process in the public transportation system. Environ. Eng. Manag. J. (EEMJ) 2020, 19. Available online: https://eds.p.ebscohost.com/eds/pdfviewer/pdfviewer?vid=0&sid=28a579a2-2525-4f6a-97be-807b8a530bea%40redis (accessed on 15 February 2022).
  353. Gummadi, R.; Edara, S.R. Analysis of passenger flow prediction of transit buses along a route based on time series. In Information and Decision Sciences; Springer: Berlin/Heidelberg, Germany, 2018; pp. 31–37. [Google Scholar]
  354. Circella, G.; Hunt, J.D.; Stefan, K.J.; Brownlee, A.T.; McCoy, M. Simplified model of local transit services. Eur. J. Transp. Infrastruct. Res. 2014, 14. [Google Scholar] [CrossRef]
  355. Ali, W.; Wang, J.; Zhu, H.; Wang, J. An Optimized Fast Handover Scheme Based on Distributed Antenna System for High-Speed Railway. In Proceedings of the 2017 IEEE 86th Vehicular Technology Conference (VTC-Fall), Toronto, ON, Canada, 24–27 September 2017; IEEE: Piscataway, NJ, USA, 2017; pp. 1–5. [Google Scholar]
  356. Yijing, Y.; Xu, W. Optimization of Delay Time of Freight Trains Based on Coordinated Wagon-Flow Allocation Operation between Technical Station. In Proceedings of the 2020 5th International Conference on Electromechanical Control Technology and Transportation (ICECTT), Nanchang, China, 15–17 May 2020; IEEE: Piscataway, NJ, USA, 2020; pp. 632–635. [Google Scholar]
  357. Mou, R.; Yue, Z. Risk Analysis of LNG Tanker for Railway Transportation. In ICTE 2019; American Society of Civil Engineers: Reston, VA, USA, 2020; pp. 462–469. [Google Scholar]
  358. Kurhan, M.B.; Kurhan, D.M. The Effectiveness Evaluation of International Railway Transportation in the Direction of “Ukraine–European Union”, Kaunas University of Technology. 2018. Available online: http://eadnurt.diit.edu.ua/jspui/handle/123456789/10781 (accessed on 15 February 2022).
  359. Khoshniyat, F.; Peterson, A. Improving train service reliability by applying an effective timetable robustness strategy. J. Intell. Transp. Syst. 2017, 21, 525–543. [Google Scholar] [CrossRef]
  360. Givoni, M. Development and impact of the modern high-speed train: A review. Transp. Rev. 2006, 26, 593–611. [Google Scholar] [CrossRef]
  361. Zhang, A.; Wan, Y.; Yang, H. Impacts of high-speed rail on airlines, airports and regional economies: A survey of recent research. Transp. Policy 2019, 81, A1–A19. [Google Scholar] [CrossRef]
  362. Schäfer, A.W.; Waitz, I.A. Air transportation and the environment. Transp. Policy 2014, 34, 1–4. [Google Scholar] [CrossRef]
  363. Schnurr, R.; Walker, T.R. Marine transportation and energy use. In Reference Module in Earth Systems and Environmental Sciences; Elsevier: Amsterdam, The Netherlands, 2019. [Google Scholar]
  364. Mahmoodjanloo, M.; Chen, G.; Asian, S.; Iranmanesh, S.H.; Tavakkoli-Moghaddam, R. In-port multi-ship routing and scheduling problem with draft limits. Marit. Policy Manag. 2021, 48, 966–987. [Google Scholar] [CrossRef]
  365. Oztanriseven, F.; Nachtmann, H. Modeling dynamic behavior of navigable inland waterways. Marit. Econ. Logist. 2020, 22, 173–195. [Google Scholar] [CrossRef]
  366. Aivazidou, E.; Politis, I. Transfer function models for forecasting maritime passenger traffic in Greece under an economic crisis environment. Transp. Lett. 2021, 13, 591–607. [Google Scholar] [CrossRef]
  367. Bou-Harb, E.; Kaisar, E.I.; Austin, M. On the impact of empirical attack models targeting marine transportation. In Proceedings of the 2017 5th IEEE International Conference on Models and Technologies for Intelligent Transportation Systems (MT-ITS), Naples, Italy, 26–28 June 2017; IEEE: Piscataway, NJ, USA, 2017; pp. 200–205. [Google Scholar]
  368. DO, Q.H. Critical Factors Affecting the Choice of Logistics Service Provider: An Empirical Study in Vietnam. J. Asian Financ. Econ. Bus. 2021, 8, 145–150. [Google Scholar]
  369. Shariff, D.; Jayaraman, K.; Shah, M.Z.; Saharuddin, A. Service quality determinants of the container haulage industry: An empirical study in Malaysia. Int. J. Shipp. Transp. Logist. 2016, 8, 66–80. [Google Scholar] [CrossRef]
  370. Nechifor, S.; Târnaucă, B.; Sasu, L.; Puiu, D.; Petrescu, A.; Teutsch, J.; Waterfeld, W.; Moldoveanu, F. Autonomic monitoring approach based on cep and ml for logistic of sensitive goods. In Proceedings of the IEEE 18th International Conference on Intelligent Engineering Systems INES 2014, Tihany, Hungary, 3–5 July 2014; IEEE: Piscataway, NJ, USA, 2014; pp. 67–72. [Google Scholar]
  371. Ghomi, S.F.; Asgarian, B. Development of metaheuristics to solve a transportation inventory location routing problem considering lost sale for perishable goods. J. Model. Manag. 2019, 14, 175–198. [Google Scholar] [CrossRef]
  372. Domínguez, J.P.; Roseiro, P. Blockchain: A brief review of Agri-Food Supply Chain Solutions and Opportunities. ADCAIJ Adv. Distrib. Comput. Artif. Intell. J. 2020, 9, 95–106. [Google Scholar] [CrossRef]
  373. Yao, J.T. The impact of transportation asymmetry on the choice of a spatial price policy. Asia-Pac. J. Reg. Sci. 2019, 3, 793–811. [Google Scholar] [CrossRef]
  374. Lyu, K.; Chen, H.; Che, A. Combinatorial Auction for Truckload Transportation Service Procurement with Auctioneer-Generated Supplementary Bundles of Requests. In Proceedings of the 2020 IEEE 23rd International Conference on Intelligent Transportation Systems (ITSC), Rhodes, Greece, 20–23 September 2020; 2020; pp. 1–6. [Google Scholar] [CrossRef]
  375. Galińska, B. Multiple criteria evaluation of global transportation systems-analysis of case study. In Scientific And Technical Conference Transport Systems Theory And Practice; Springer: Berlin/Heidelberg, Germany, 2017; pp. 155–171. [Google Scholar]
  376. Bayramoğlu, K.; Yilmaz, S.; Kaya, K.D. Numerical investigation of valve lifts effects on performance and emissions in diesel engine. Int. J. Glob. Warm. 2019, 18, 287–303. [Google Scholar] [CrossRef]
  377. Canh, N.P.; Hao, W.; Wongchoti, U. The impact of economic and financial activities on air quality: A Chinese city perspective. Environ. Sci. Pollut. Res. 2021, 28, 8662–8680. [Google Scholar] [CrossRef] [PubMed]
  378. Wang, P.; Ying, Q.; Zhang, H.; Hu, J.; Lin, Y.; Mao, H. Source apportionment of secondary organic aerosol in China using a regional source-oriented chemical transport model and two emission inventories. Environ. Pollut. 2018, 237, 756–766. [Google Scholar] [CrossRef]
  379. Macedo, J.; Kokkinogenis, Z.; Soares, G.; Perrotta, D.; Rossetti, R.J. A HLA-based multi-resolution approach to simulating electric vehicles in simulink and SUMO. In Proceedings of the 16th International IEEE Conference on Intelligent Transportation Systems, ITSC, The Hague, The Netherlands, 6–9 October 2013; IEEE: Piscataway, NJ, USA, 2013; pp. 2367–2372. [Google Scholar]
  380. Meng, X.; Ai, Y.; Li, R.; Zhang, W. Effects of heavy metal pollution on enzyme activities in railway cut slope soils. Environ. Monit. Assess. 2018, 190, 1–12. [Google Scholar] [CrossRef]
  381. Yang, W.; He, J.; He, C.; Cai, M. Evaluation of urban traffic noise pollution based on noise maps. Transp. Res. Part D Transp. Environ. 2020, 87, 102516. [Google Scholar] [CrossRef]
  382. Suh, D.H. Interfuel substitution effects of biofuel use on carbon dioxide emissions: Evidence from the transportation sector. Appl. Econ. 2019, 51, 3413–3422. [Google Scholar] [CrossRef]
  383. Andersson, L.; Ek, K.; Kastensson, Å.; Wårell, L. Transition towards sustainable transportation–What determines fuel choice? Transp. Policy 2020, 90, 31–38. [Google Scholar] [CrossRef]
  384. Noori, H. Modeling the impact of vanet-enabled traffic lights control on the response time of emergency vehicles in realistic large-scale urban area. In Proceedings of the 2013 IEEE International Conference on Communications Workshops (ICC), Budapest, Hungary, 9–13 June 2013; IEEE: Piscataway, NJ, USA, 2013; pp. 526–531. [Google Scholar]
  385. Fu, H.; Ma, H.; Wang, G.; Zhang, X.; Zhang, Y. MCFF-CNN: Multiscale comprehensive feature fusion convolutional neural network for vehicle color recognition based on residual learning. Neurocomputing 2020, 395, 178–187. [Google Scholar] [CrossRef]
  386. Ma, X.; Wu, Y.J.; Wang, Y.; Chen, F.; Liu, J. Mining smart card data for transit riders’ travel patterns. Transp. Res. Part C Emerg. Technol. 2013, 36, 1–12. [Google Scholar] [CrossRef]
  387. Al-Sultan, S.; Al-Doori, M.M.; Al-Bayatti, A.H.; Zedan, H. A comprehensive survey on vehicular ad hoc network. J. Netw. Comput. Appl. 2014, 37, 380–392. [Google Scholar] [CrossRef]
  388. Hartenstein, H.; Laberteaux, L. A tutorial survey on vehicular ad hoc networks. IEEE Commun. Mag. 2008, 46, 164–171. [Google Scholar] [CrossRef]
  389. Fagnant, D.J.; Kockelman, K. Preparing a nation for autonomous vehicles: Opportunities, barriers and policy recommendations. Transp. Res. Part A Policy Pract. 2015, 77, 167–181. [Google Scholar] [CrossRef]
  390. Haboucha, C.J.; Ishaq, R.; Shiftan, Y. User preferences regarding autonomous vehicles. Transp. Res. Part C Emerg. Technol. 2017, 78, 37–49. [Google Scholar] [CrossRef]
  391. Bösch, P.M.; Becker, F.; Becker, H.; Axhausen, K.W. Cost-based analysis of autonomous mobility services. Transp. Policy 2018, 64, 76–91. [Google Scholar] [CrossRef]
  392. Zhang, Y.; Huang, G. Traffic flow prediction model based on deep belief network and genetic algorithm. IET Intell. Transp. Syst. 2018, 12, 533–541. [Google Scholar] [CrossRef]
  393. James, J. Citywide traffic speed prediction: A geometric deep learning approach. Knowl.-Based Syst. 2021, 212, 106592. [Google Scholar]
  394. Zheng, Z.h.; Ling, X.m.; Wang, P.; Xiao, J.; Zhang, F. Hybrid model for predicting anomalous large passenger flow in urban metros. IET Intell. Transp. Syst. 2021, 14, 1987–1996. [Google Scholar] [CrossRef]
  395. Tao, Z.; Xu, J. A class of rough multiple objective programming and its application to solid transportation problem. Inf. Sci. 2012, 188, 215–235. [Google Scholar] [CrossRef]
  396. Yigitcanlar, T.; Kankanamge, N.; Regona, M.; Maldonado, A.R.; Rowan, B.; Ryu, A.; Desouza, K.C.; Corchado, J.M.; Mehmood, R.; Li, R.Y.M. Artificial Intelligence Technologies and Related Urban Planning and Development Concepts: How Are They Perceived and Utilized in Australia? J. Open Innov. Technol. Mark. Complex. 2020, 6, 187. [Google Scholar] [CrossRef]
  397. Yigitcanlar, T.; Butler, L.W.E.D.K.M.R.C.J. Can Building “Artificially Intelligent Cities” Safeguard Humanity from Natural Disasters, Pandemics, and Other Catastrophes? An Urban Scholar’s Perspective. Sensors 2020, 20, 2988. [Google Scholar] [CrossRef]
  398. Yigitcanlar, T.; Mehmood, R.; Corchado, J.M. Green Artificial Intelligence: Towards an Efficient, Sustainable and Equitable Technology for Smart Cities and Futures. Sustainability 2021, 13, 8952. [Google Scholar] [CrossRef]
  399. Yigitcanlar, T.; Corchado, J.M.; Mehmood, R.; Li, R.Y.M.; Mossberger, K.; Desouza, K. Responsible Urban Innovation with Local Government Artificial Intelligence (AI): A Conceptual Framework and Research Agenda. J. Open Innov. Technol. Mark. Complex. 2021, 7, 71. [Google Scholar] [CrossRef]
  400. Yigitcanlar, T.; Regona, M.; Kankanamge, N.; Mehmood, R.; D’Costa, J.; Lindsay, S.; Nelson, S.; Brhane, A. Detecting Natural Hazard-Related Disaster Impacts with Social Media Analytics: The Case of Australian States and Territories. Sustainability 2022, 14, 810. [Google Scholar] [CrossRef]
  401. Janbi, N.; Mehmood, R.; Katib, I.; Albeshri, A.; Corchado, J.M.; Yigitcanlar, T. Imtidad: A Reference Architecture and a Case Study on Developing Distributed AI Services for Skin Disease Diagnosis over Cloud, Fog and Edge. Sensors 2022, 22, 1854. [Google Scholar] [CrossRef]
  402. Mohammed, T.; Albeshri, A.; Katib, I.; Mehmood, R. UbiPriSEQ—Deep Reinforcement Learning to Manage Privacy, Security, Energy, and QoS in 5G IoT HetNets. Appl. Sci. 2020, 10, 7120. [Google Scholar] [CrossRef]
  403. Janbi, N.; Katib, I.; Albeshri, A.; Mehmood, R. Distributed Artificial Intelligence-as-a-Service (DAIaaS) for Smarter IoE and 6G Environments. Sensors 2020, 20, 5796. [Google Scholar] [CrossRef]
  404. Arfat, Y.; Suma, S.; Mehmood, R.; Albeshri, A. Parallel Shortest Path Big Data Graph Computations of US Road Network Using Apache Spark: Survey, Architecture, and Evaluation. In EAI/Springer Innovations in Communication and Computing; Springer: Cham, Switzerland, 2020; pp. 185–214. [Google Scholar] [CrossRef]
  405. Usman, S.; Mehmood, R.; Katib, I. Big Data and HPC Convergence for Smart Infrastructures: A Review and Proposed Architecture. In EAI/Springer Innovations in Communication and Computing; Springer: Cham, Switzerland, 2020; pp. 561–586. [Google Scholar] [CrossRef]
  406. AlAhmadi, S.; Mohammed, T.; Albeshri, A.; Katib, I.; Mehmood, R. Performance Analysis of Sparse Matrix-Vector Multiplication (SpMV) on Graphics Processing Units (GPUs). Electronics 2020, 9, 1675. [Google Scholar] [CrossRef]
  407. Alyahya, H.; Mehmood, R.; Katib, I. Parallel Iterative Solution of Large Sparse Linear Equation Systems on the Intel MIC Architecture; Springer: Cham, Switzerland, 2020; pp. 377–407. [Google Scholar] [CrossRef]
  408. Mehmood, R.; Alam, F.; Albogami, N.N.; Katib, I.; Albeshri, A.; Altowaijri, S.M. UTiLearn: A Personalised Ubiquitous Teaching and Learning System for Smart Societies. IEEE Access 2017, 5, 2615–2635. [Google Scholar] [CrossRef]
  409. Alswedani, S.; Katib, I.; Abozinadah, E.; Mehmood, R. Discovering Urban Governance Parameters for Online Learning in Saudi Arabia During COVID-19 Using Topic Modeling of Twitter Data. Front. Sustain. Cities 2022, 4. [Google Scholar] [CrossRef]
  410. Alahmari, N.; Alswedani, S.; Alzahrani, A.; Katib, I.; Albeshri, A.; Mehmood, R. Musawah: A Data-Driven AI Approach and Tool to Co-Create Healthcare Services with a Case Study on Cancer Disease in Saudi Arabia. Sustainability 2022, 14, 3313. [Google Scholar] [CrossRef]
  411. Alotaibi, S.; Mehmood, R.; Katib, I.; Rana, O.; Albeshri, A. Sehaa: A Big Data Analytics Tool for Healthcare Symptoms and Diseases Detection Using Twitter, Apache Spark, and Machine Learning. Appl. Sci. 2020, 10, 1398. [Google Scholar] [CrossRef] [Green Version]
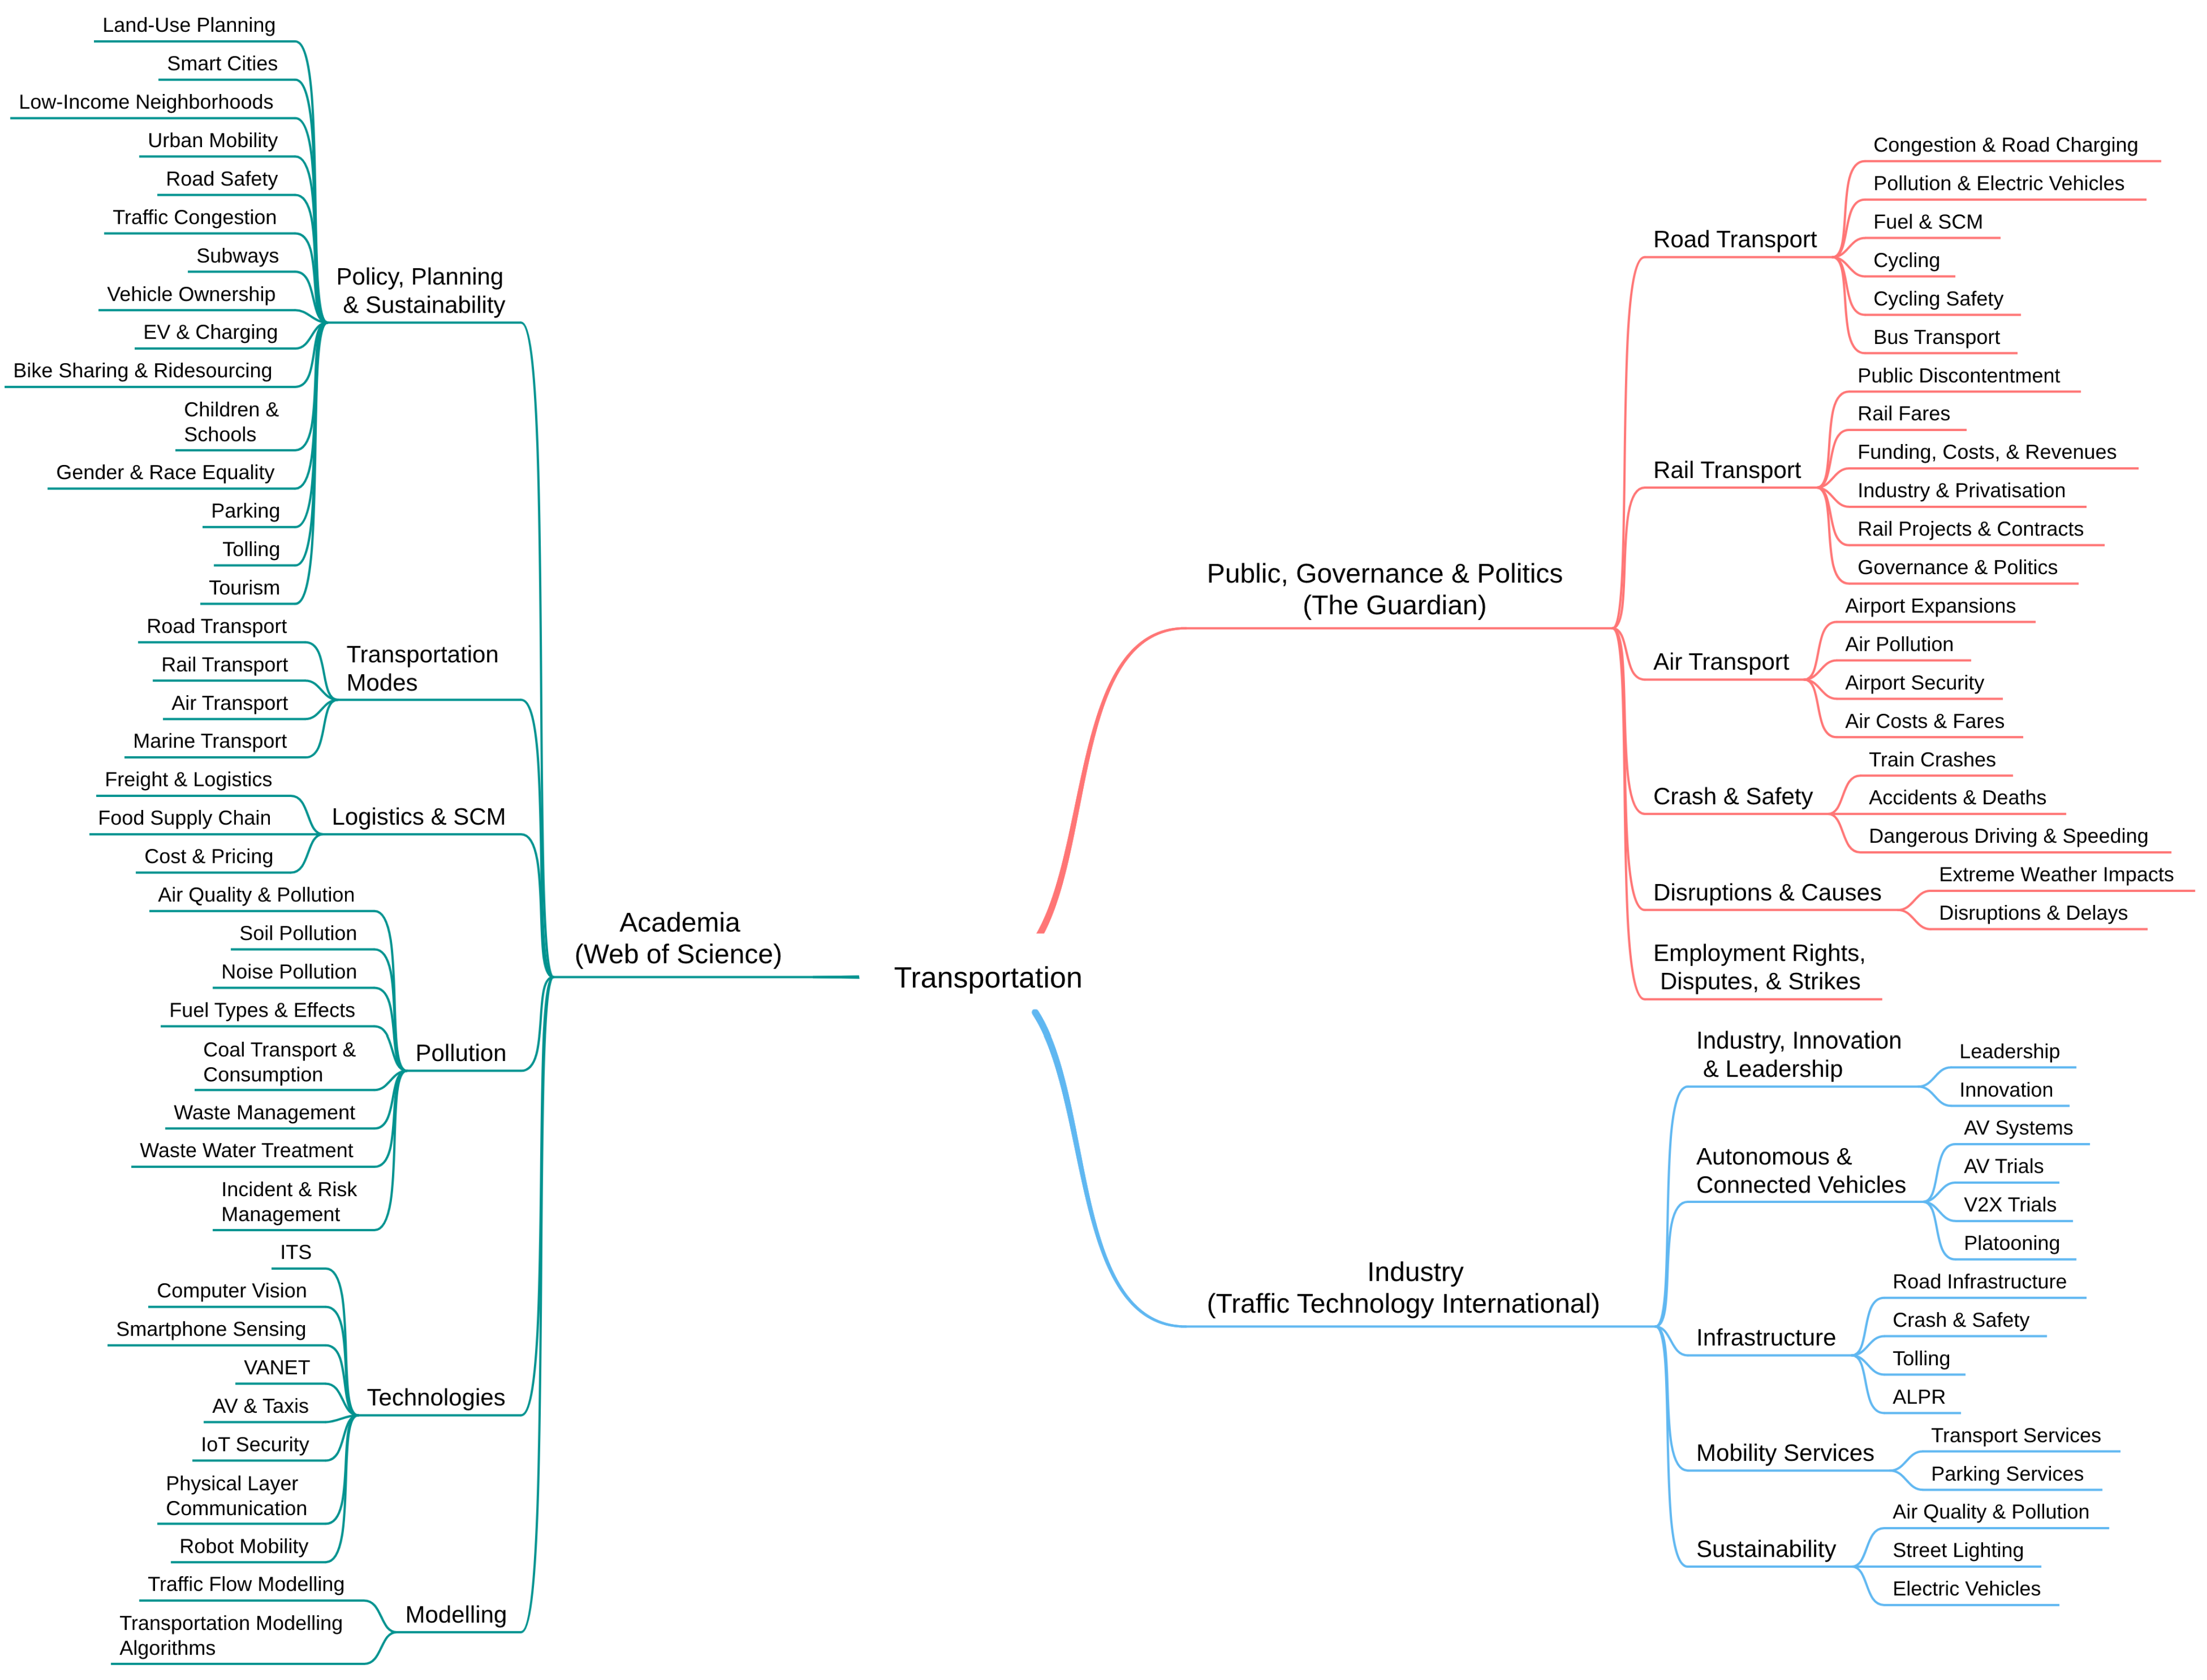
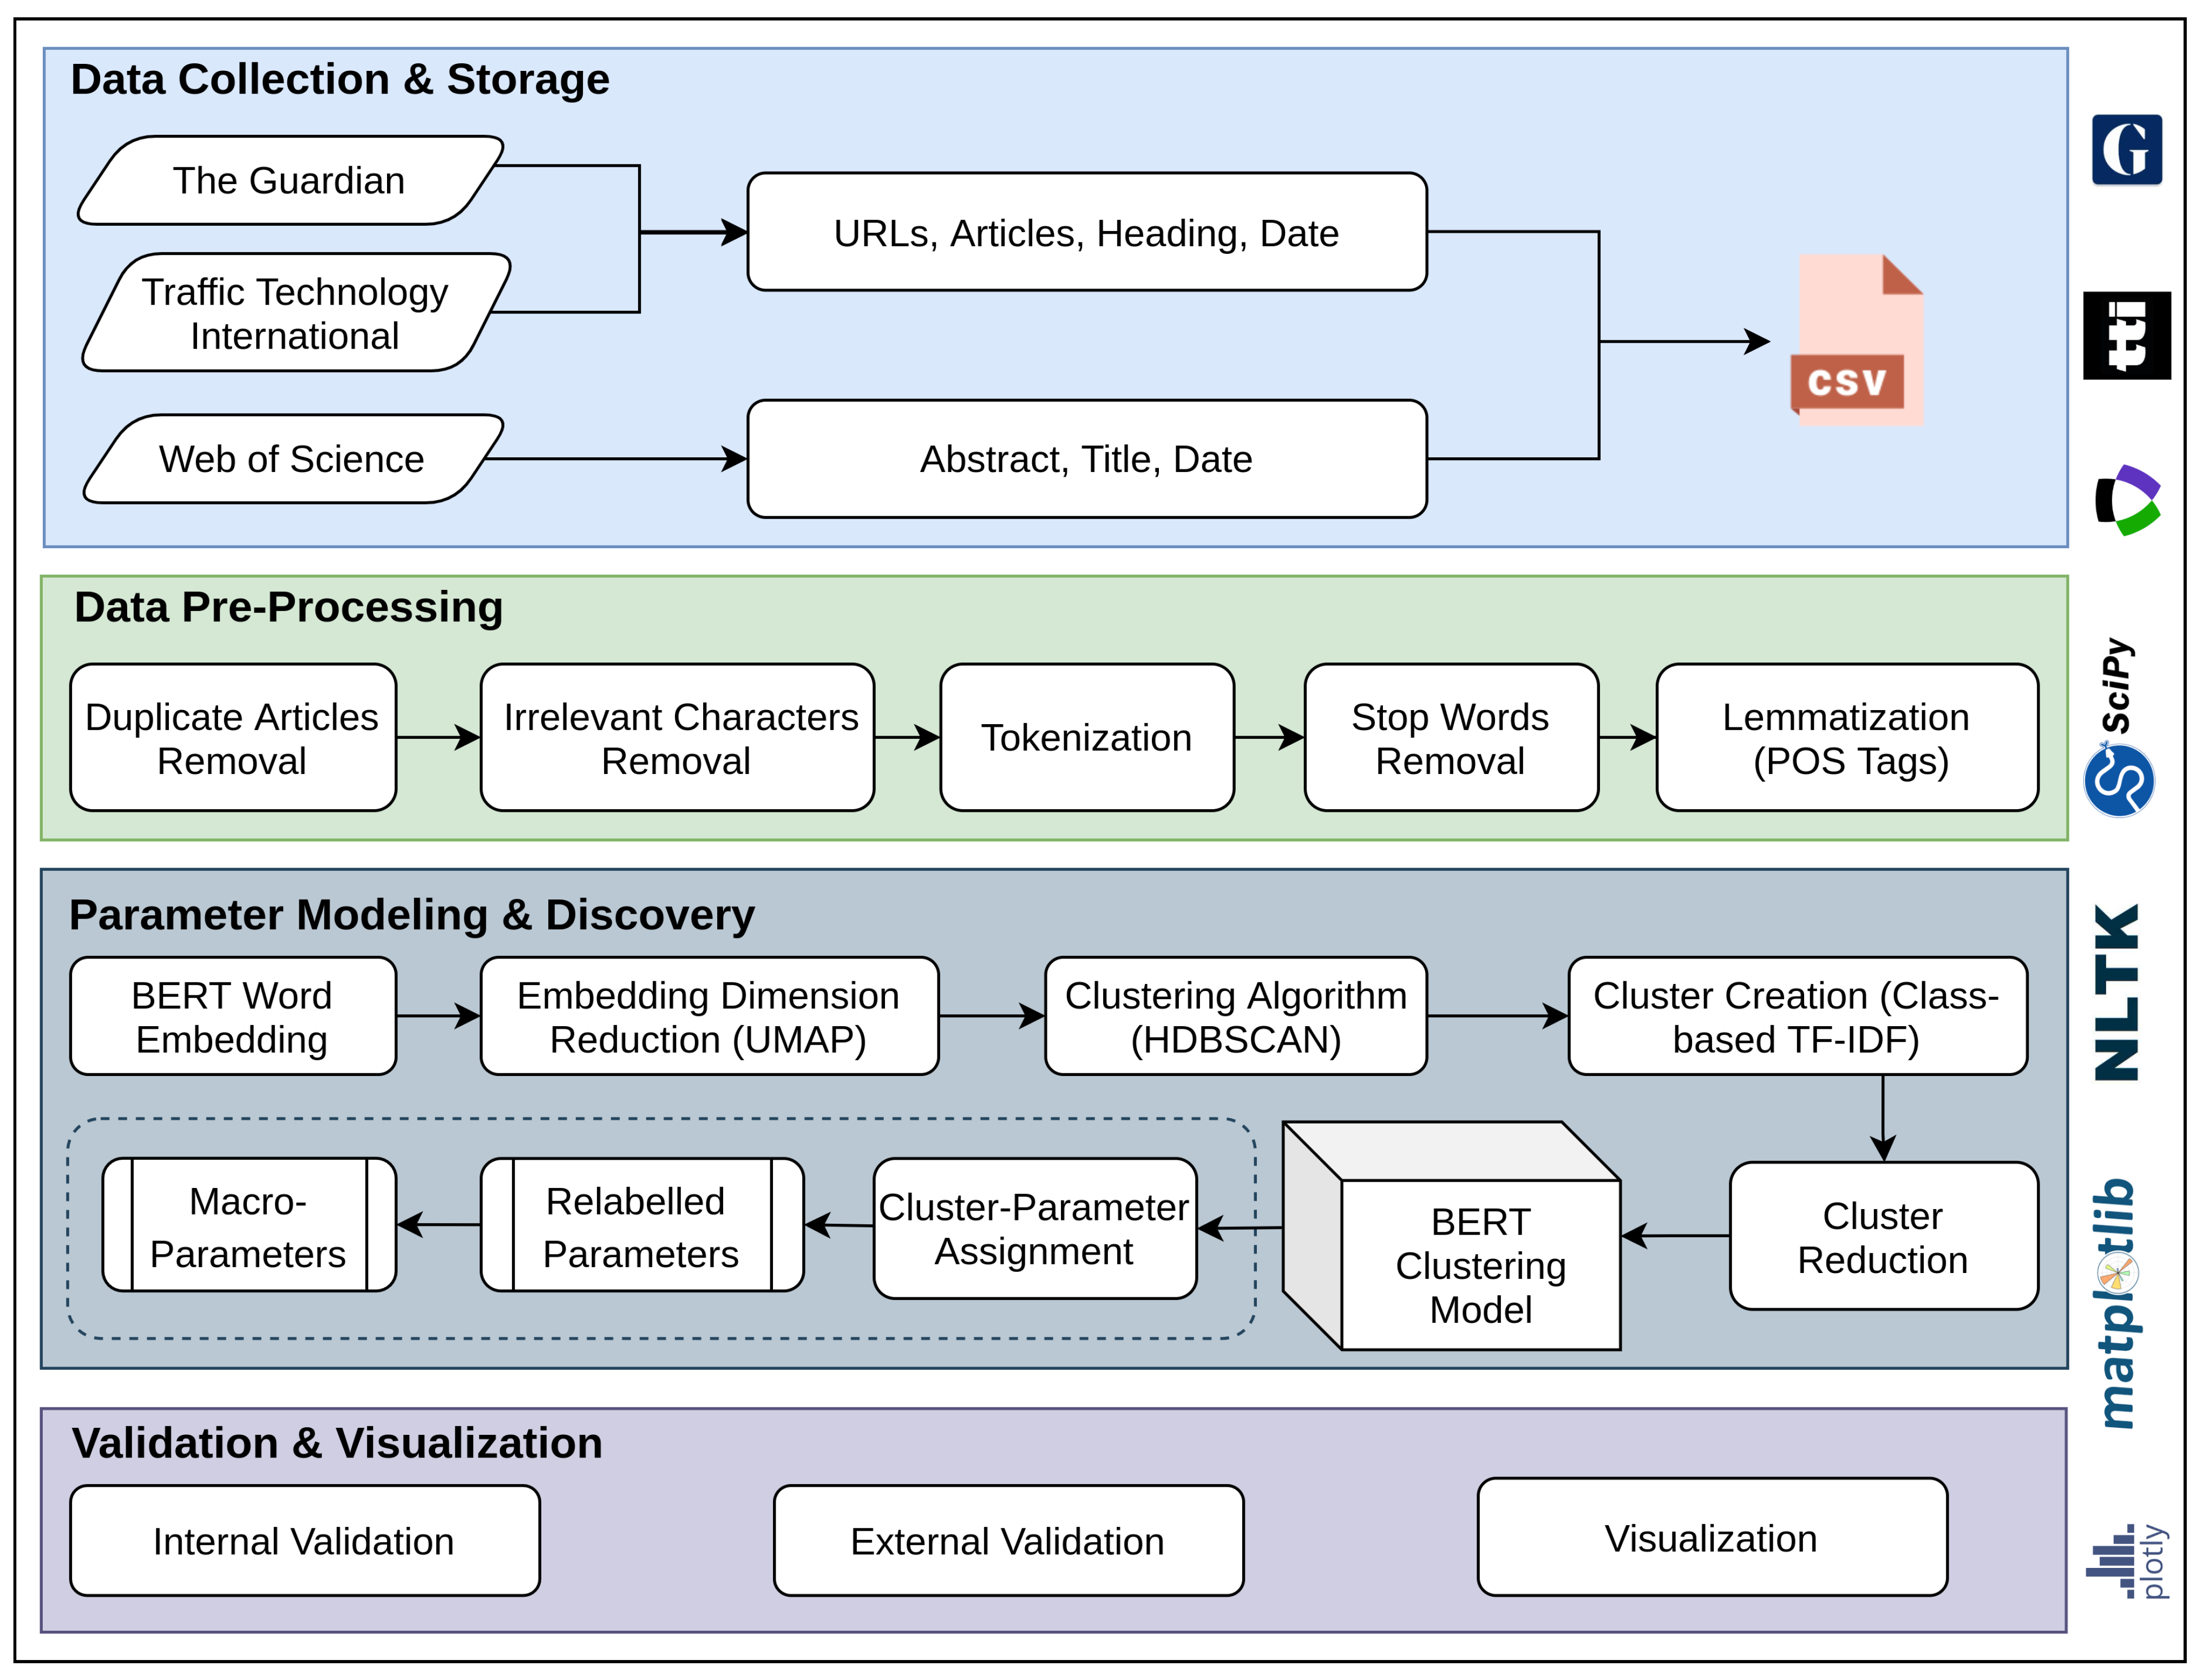
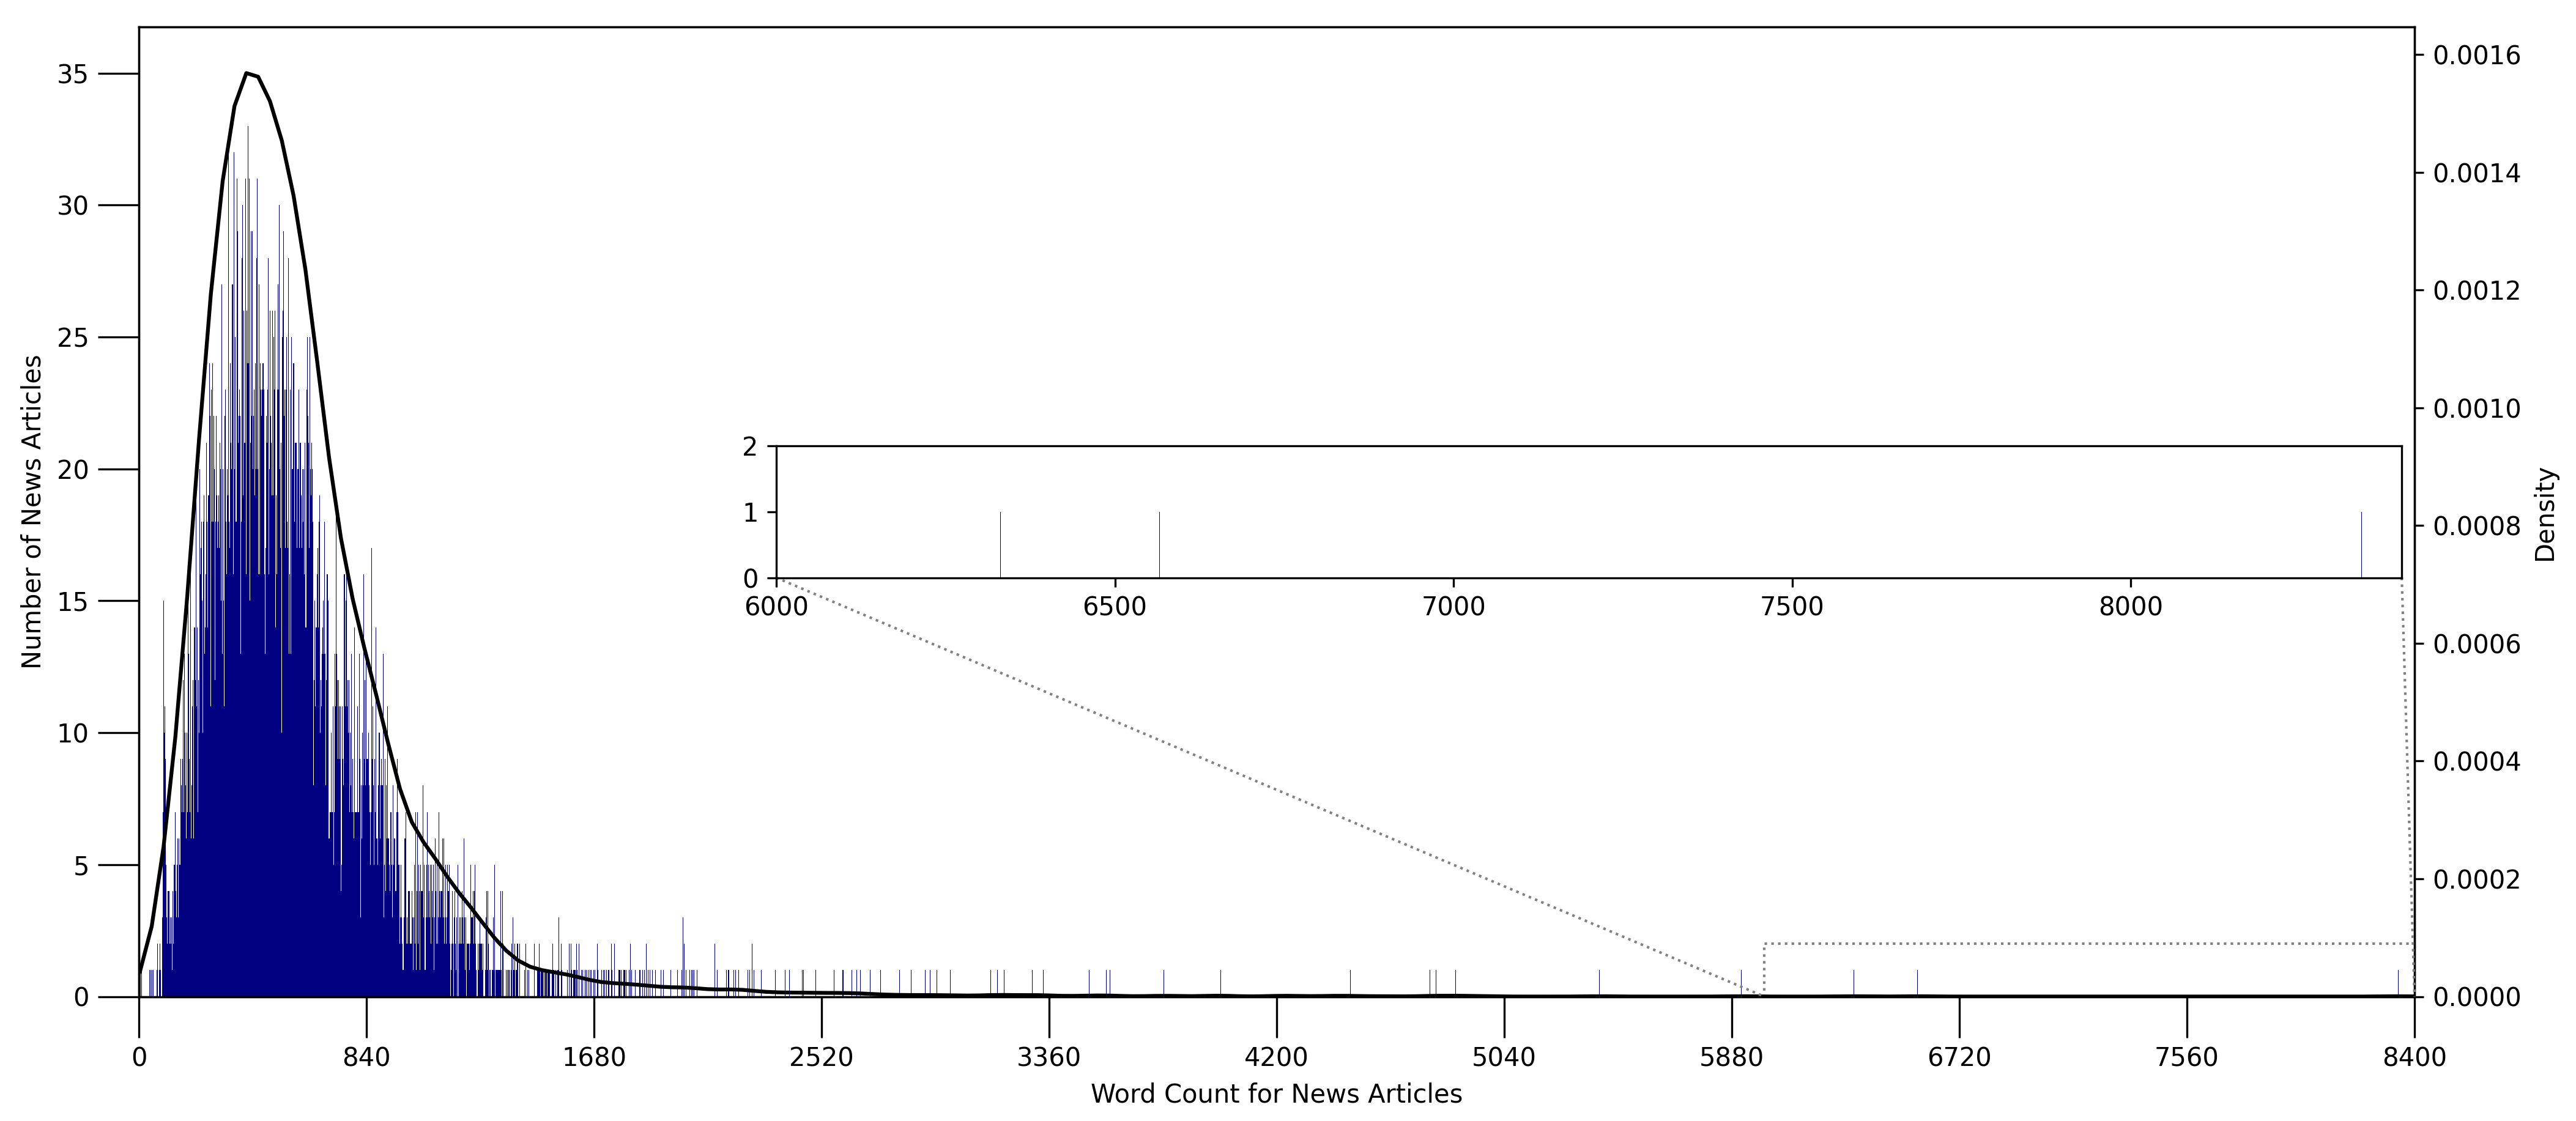
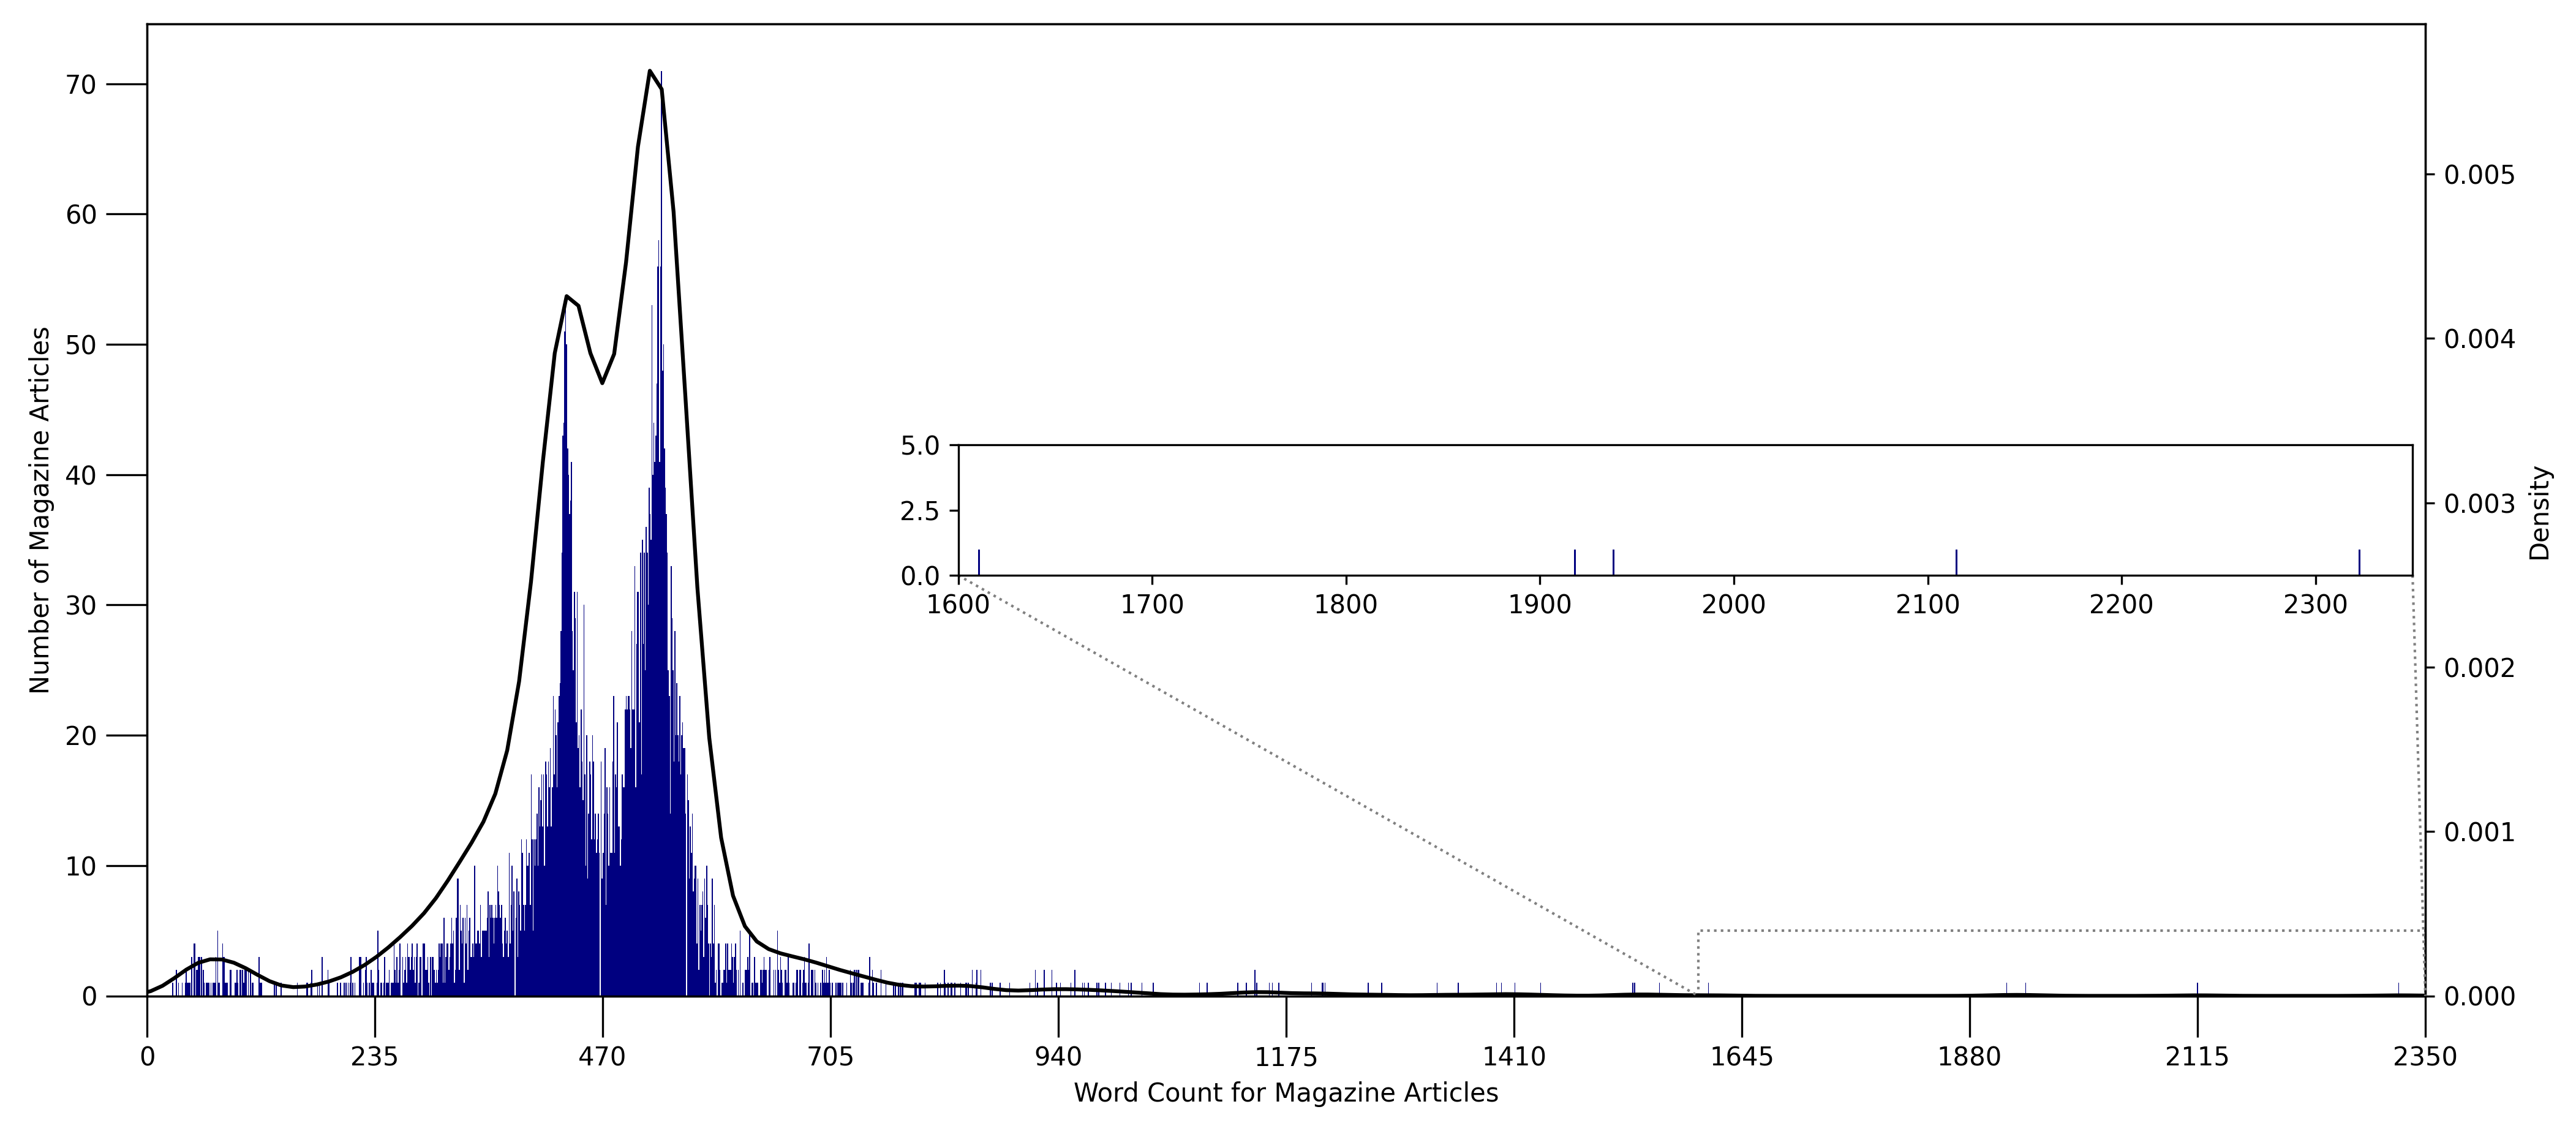
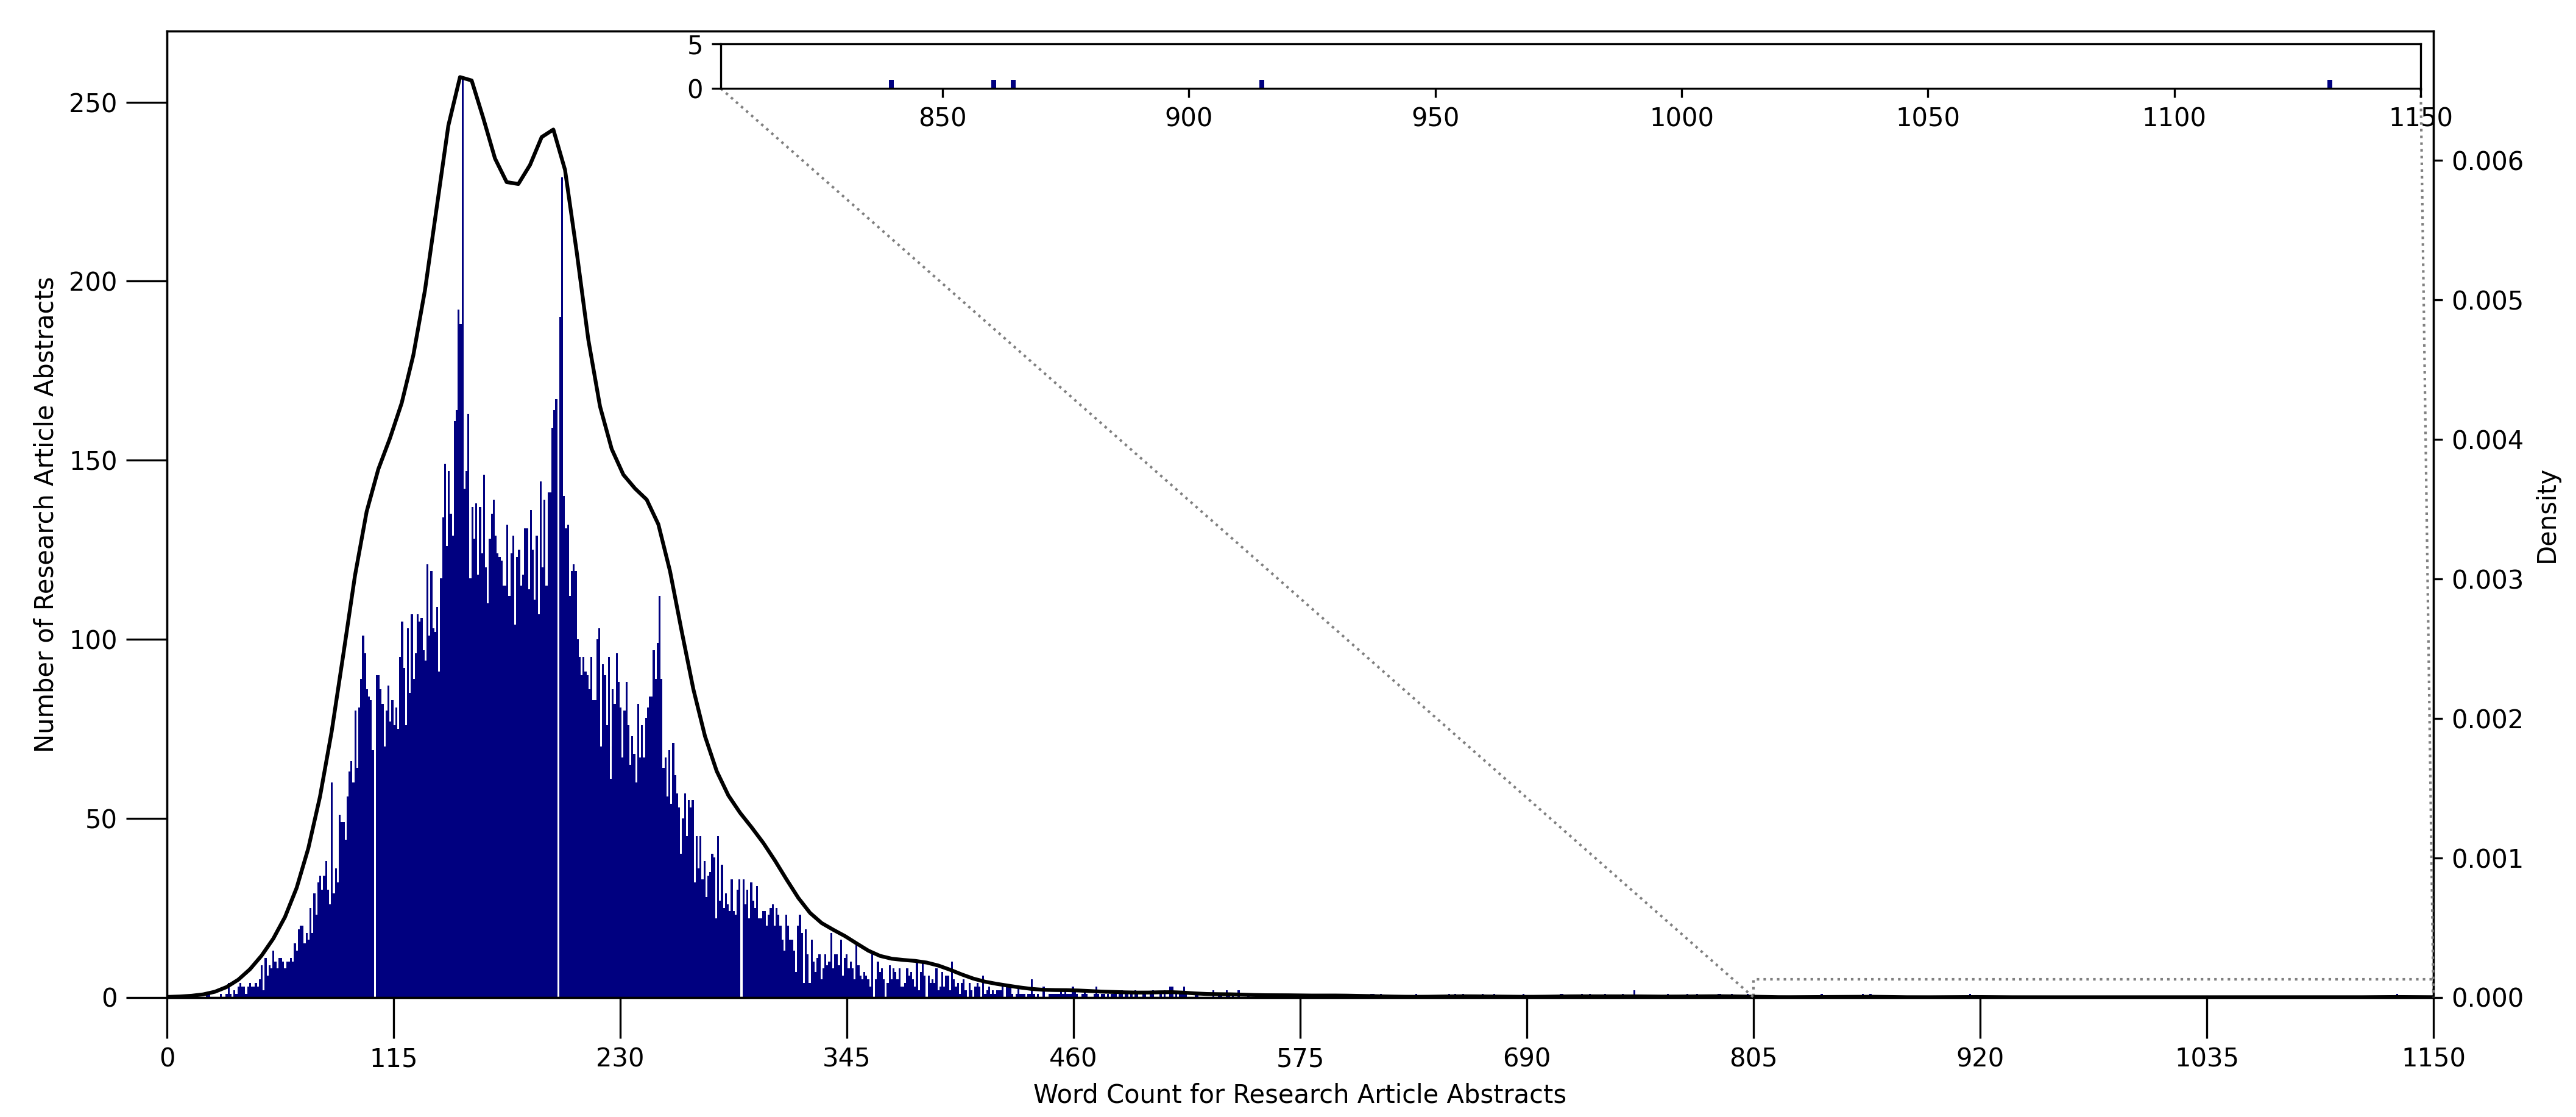
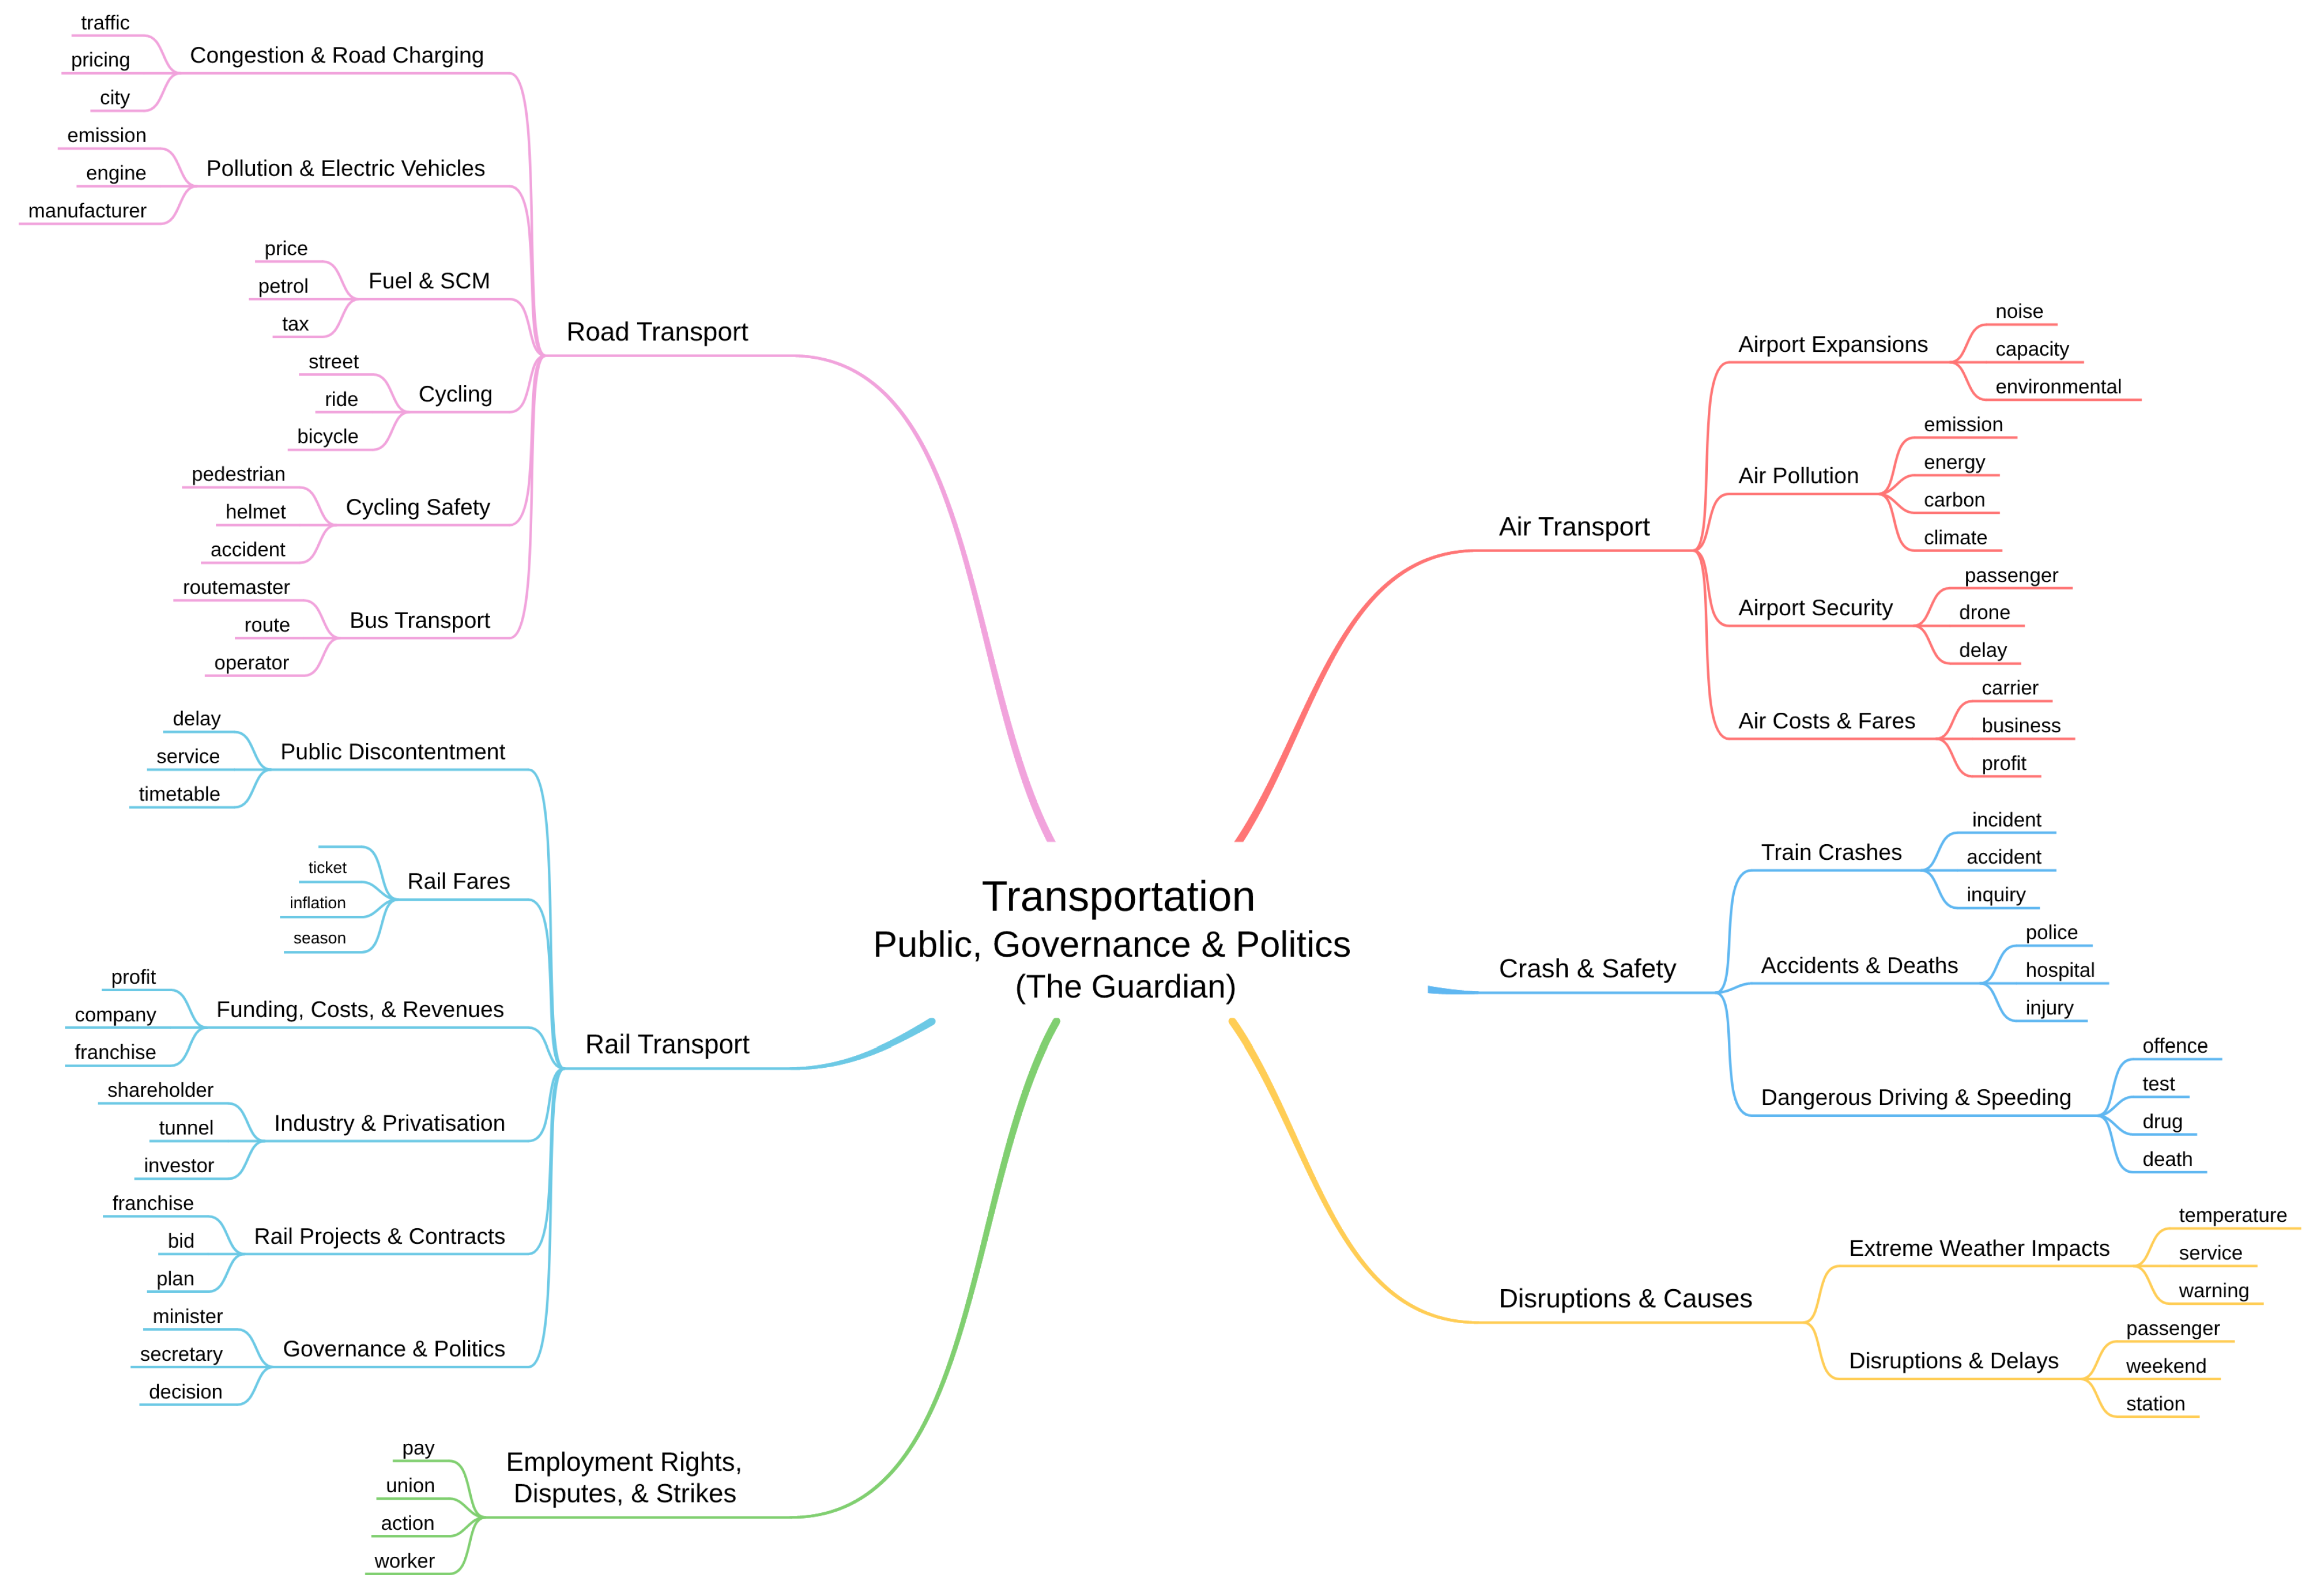
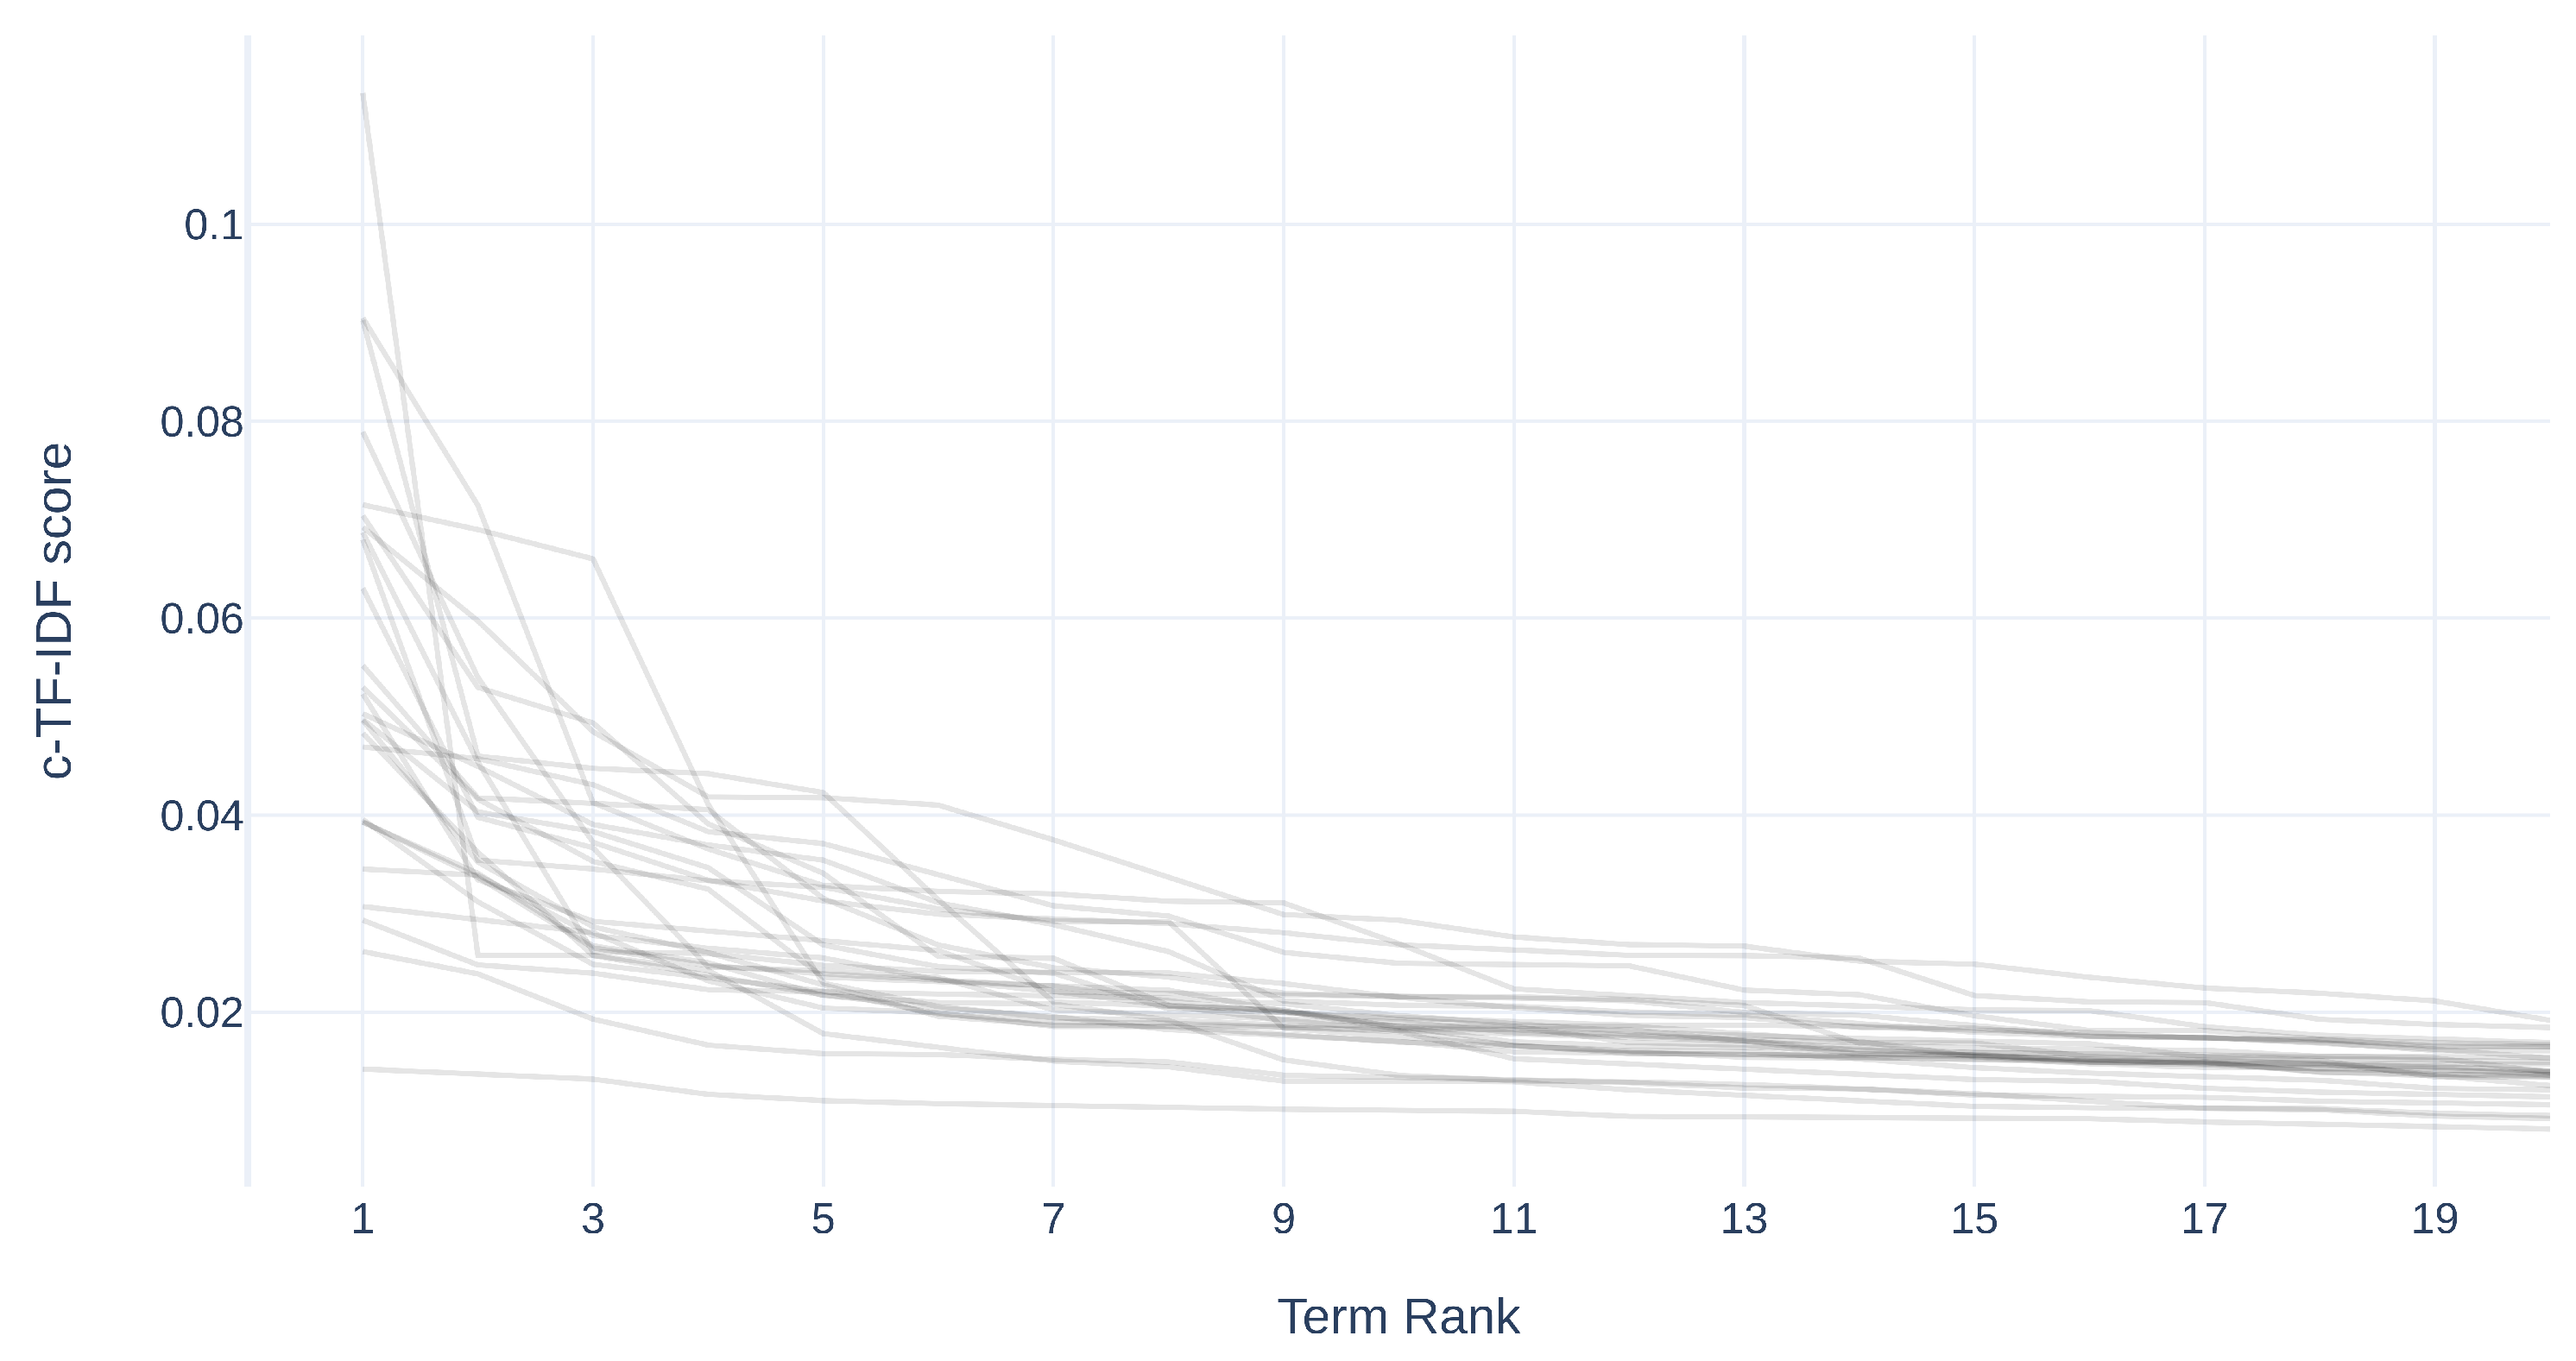
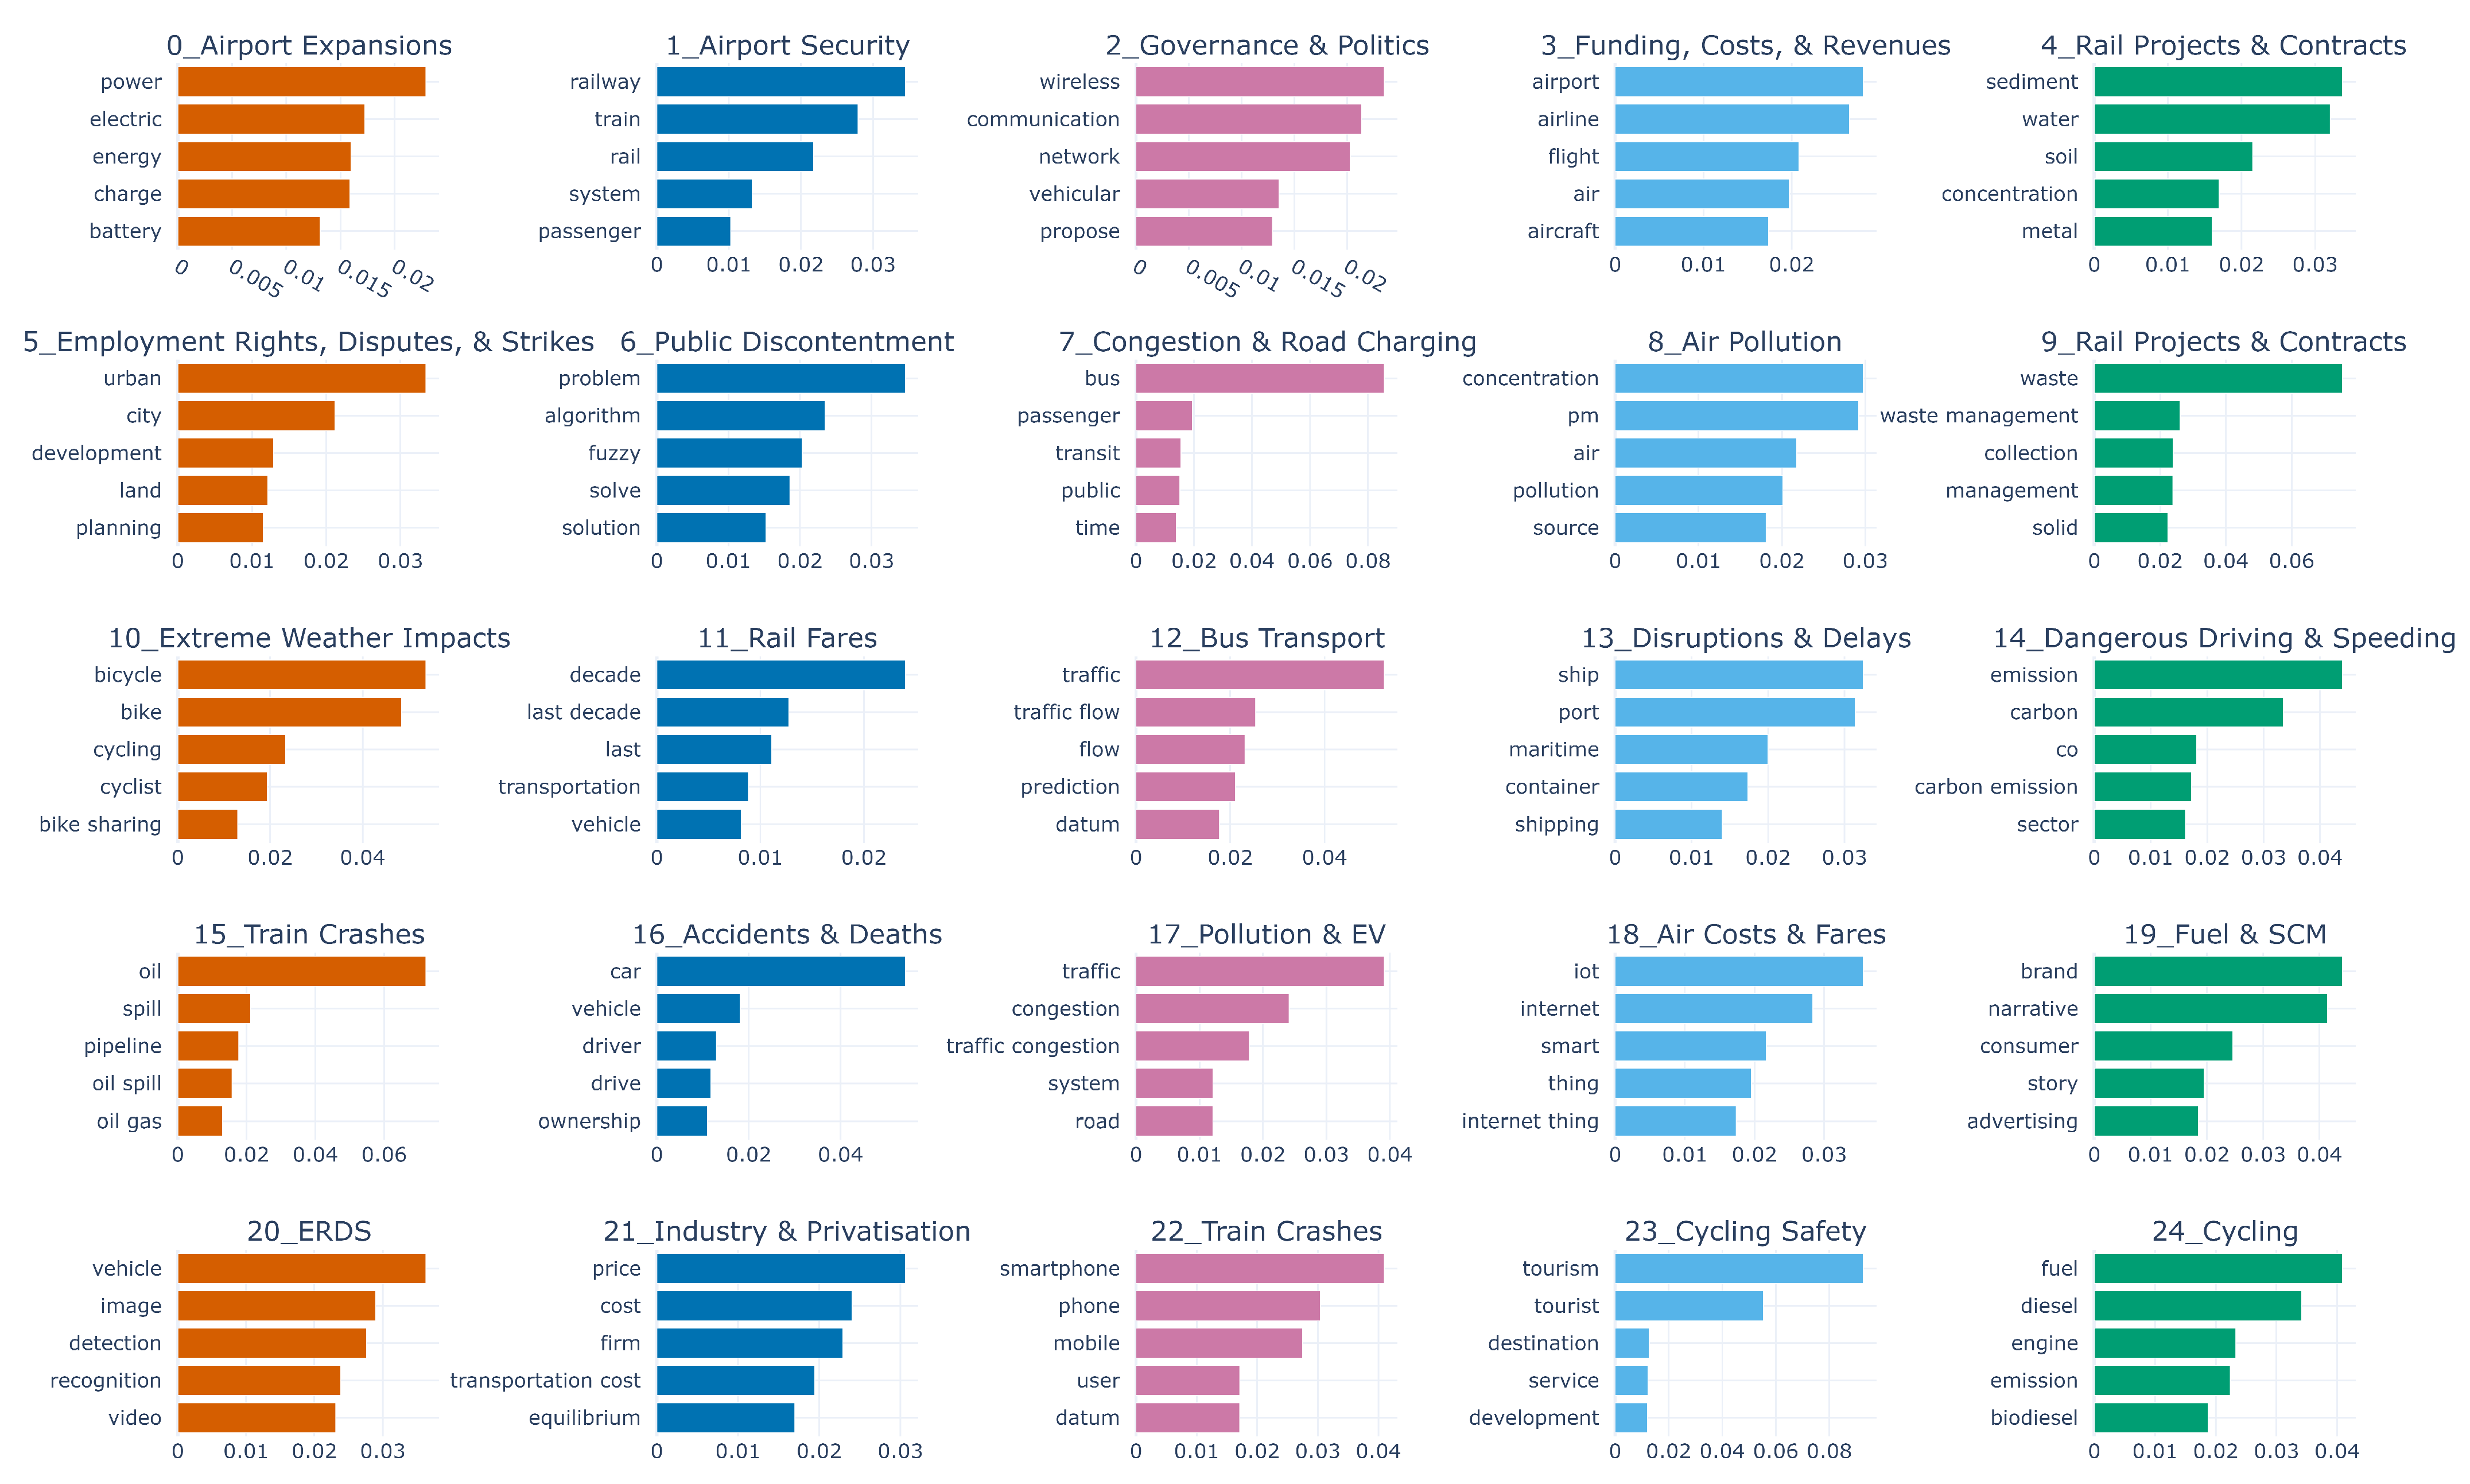
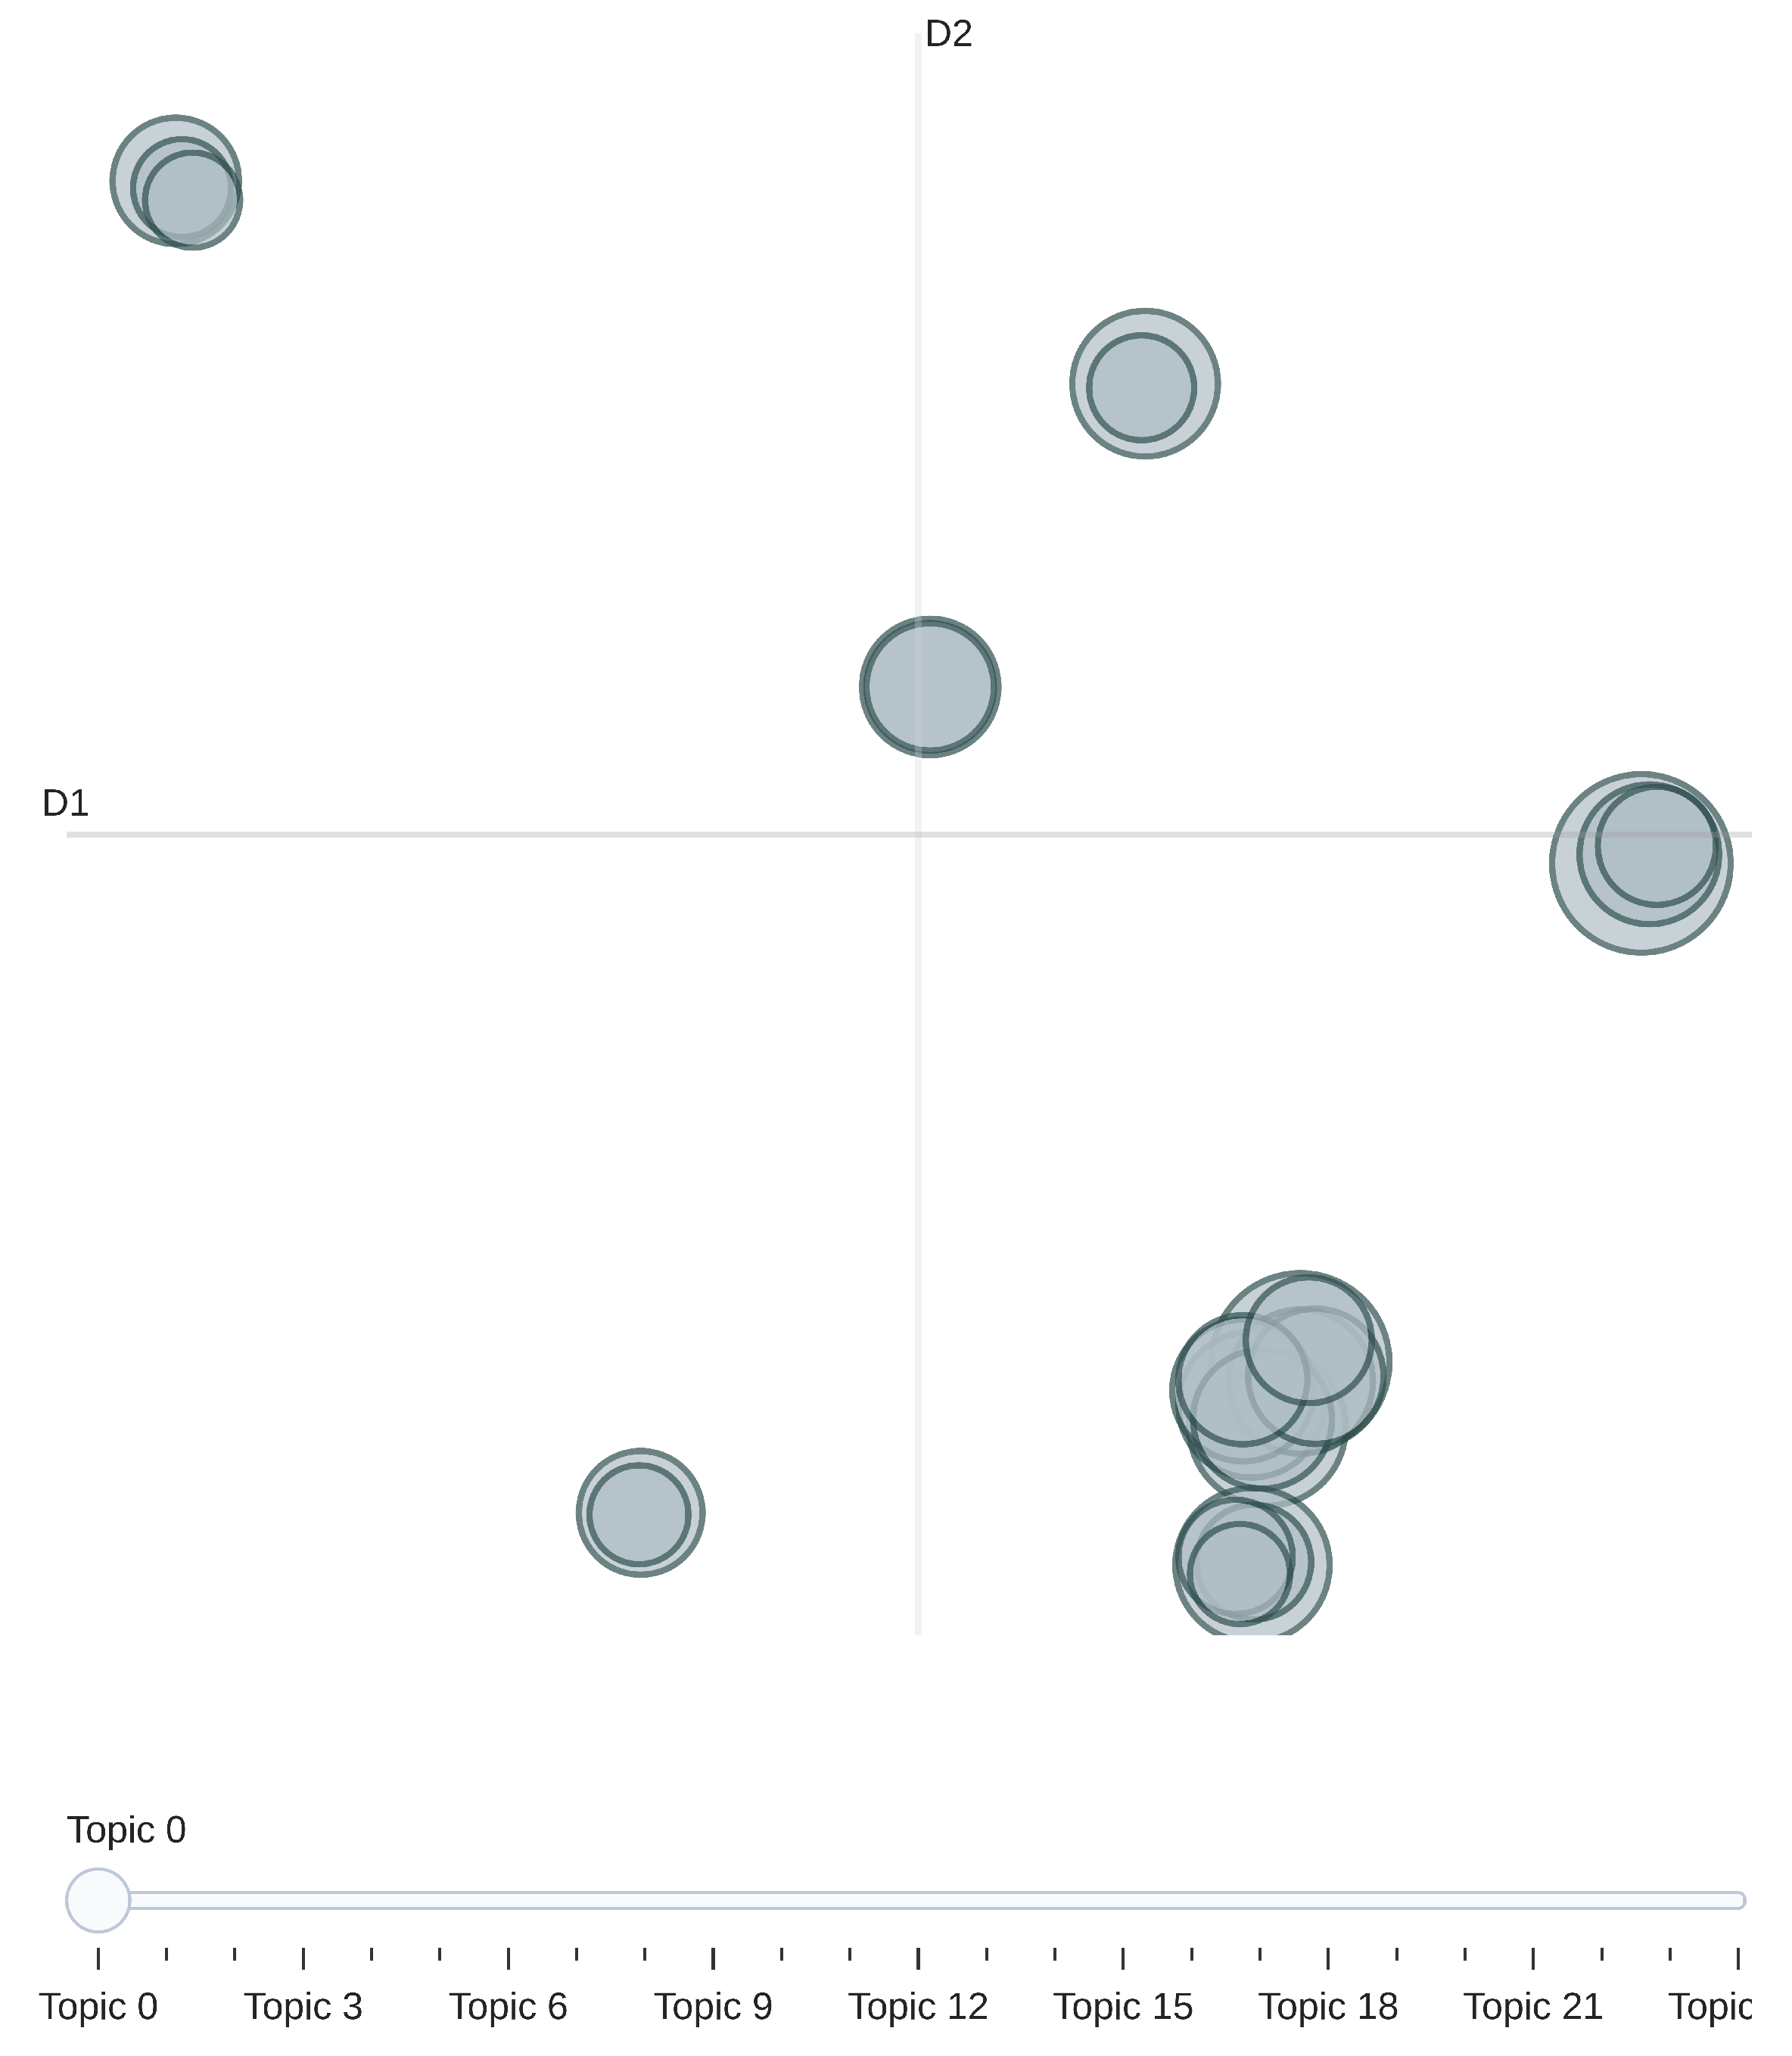
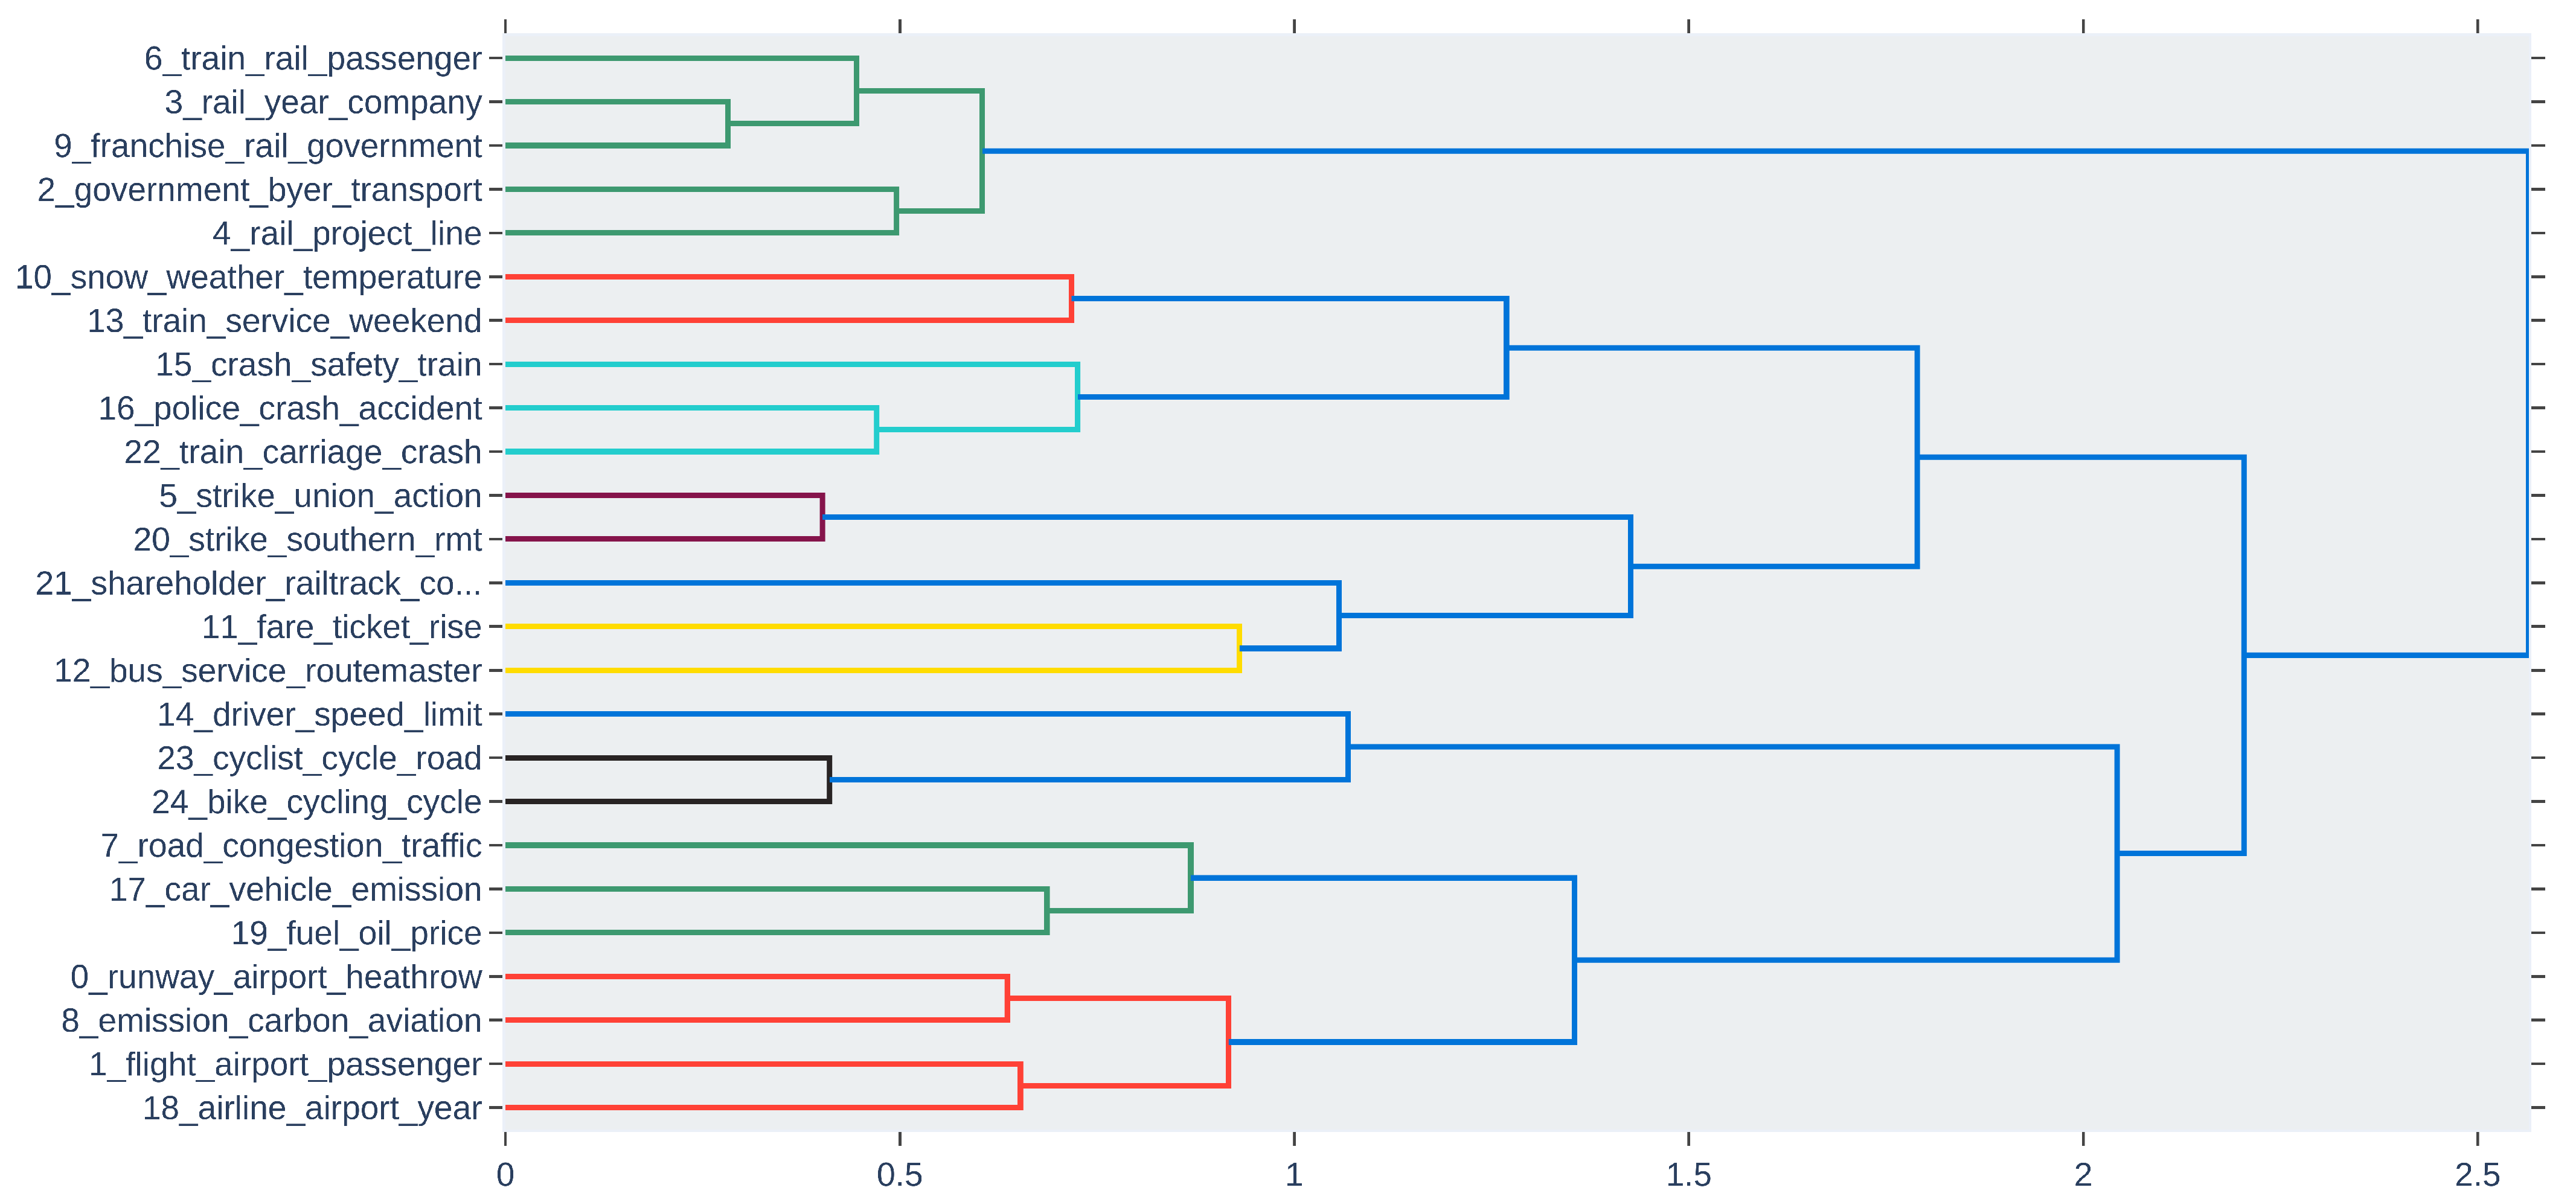
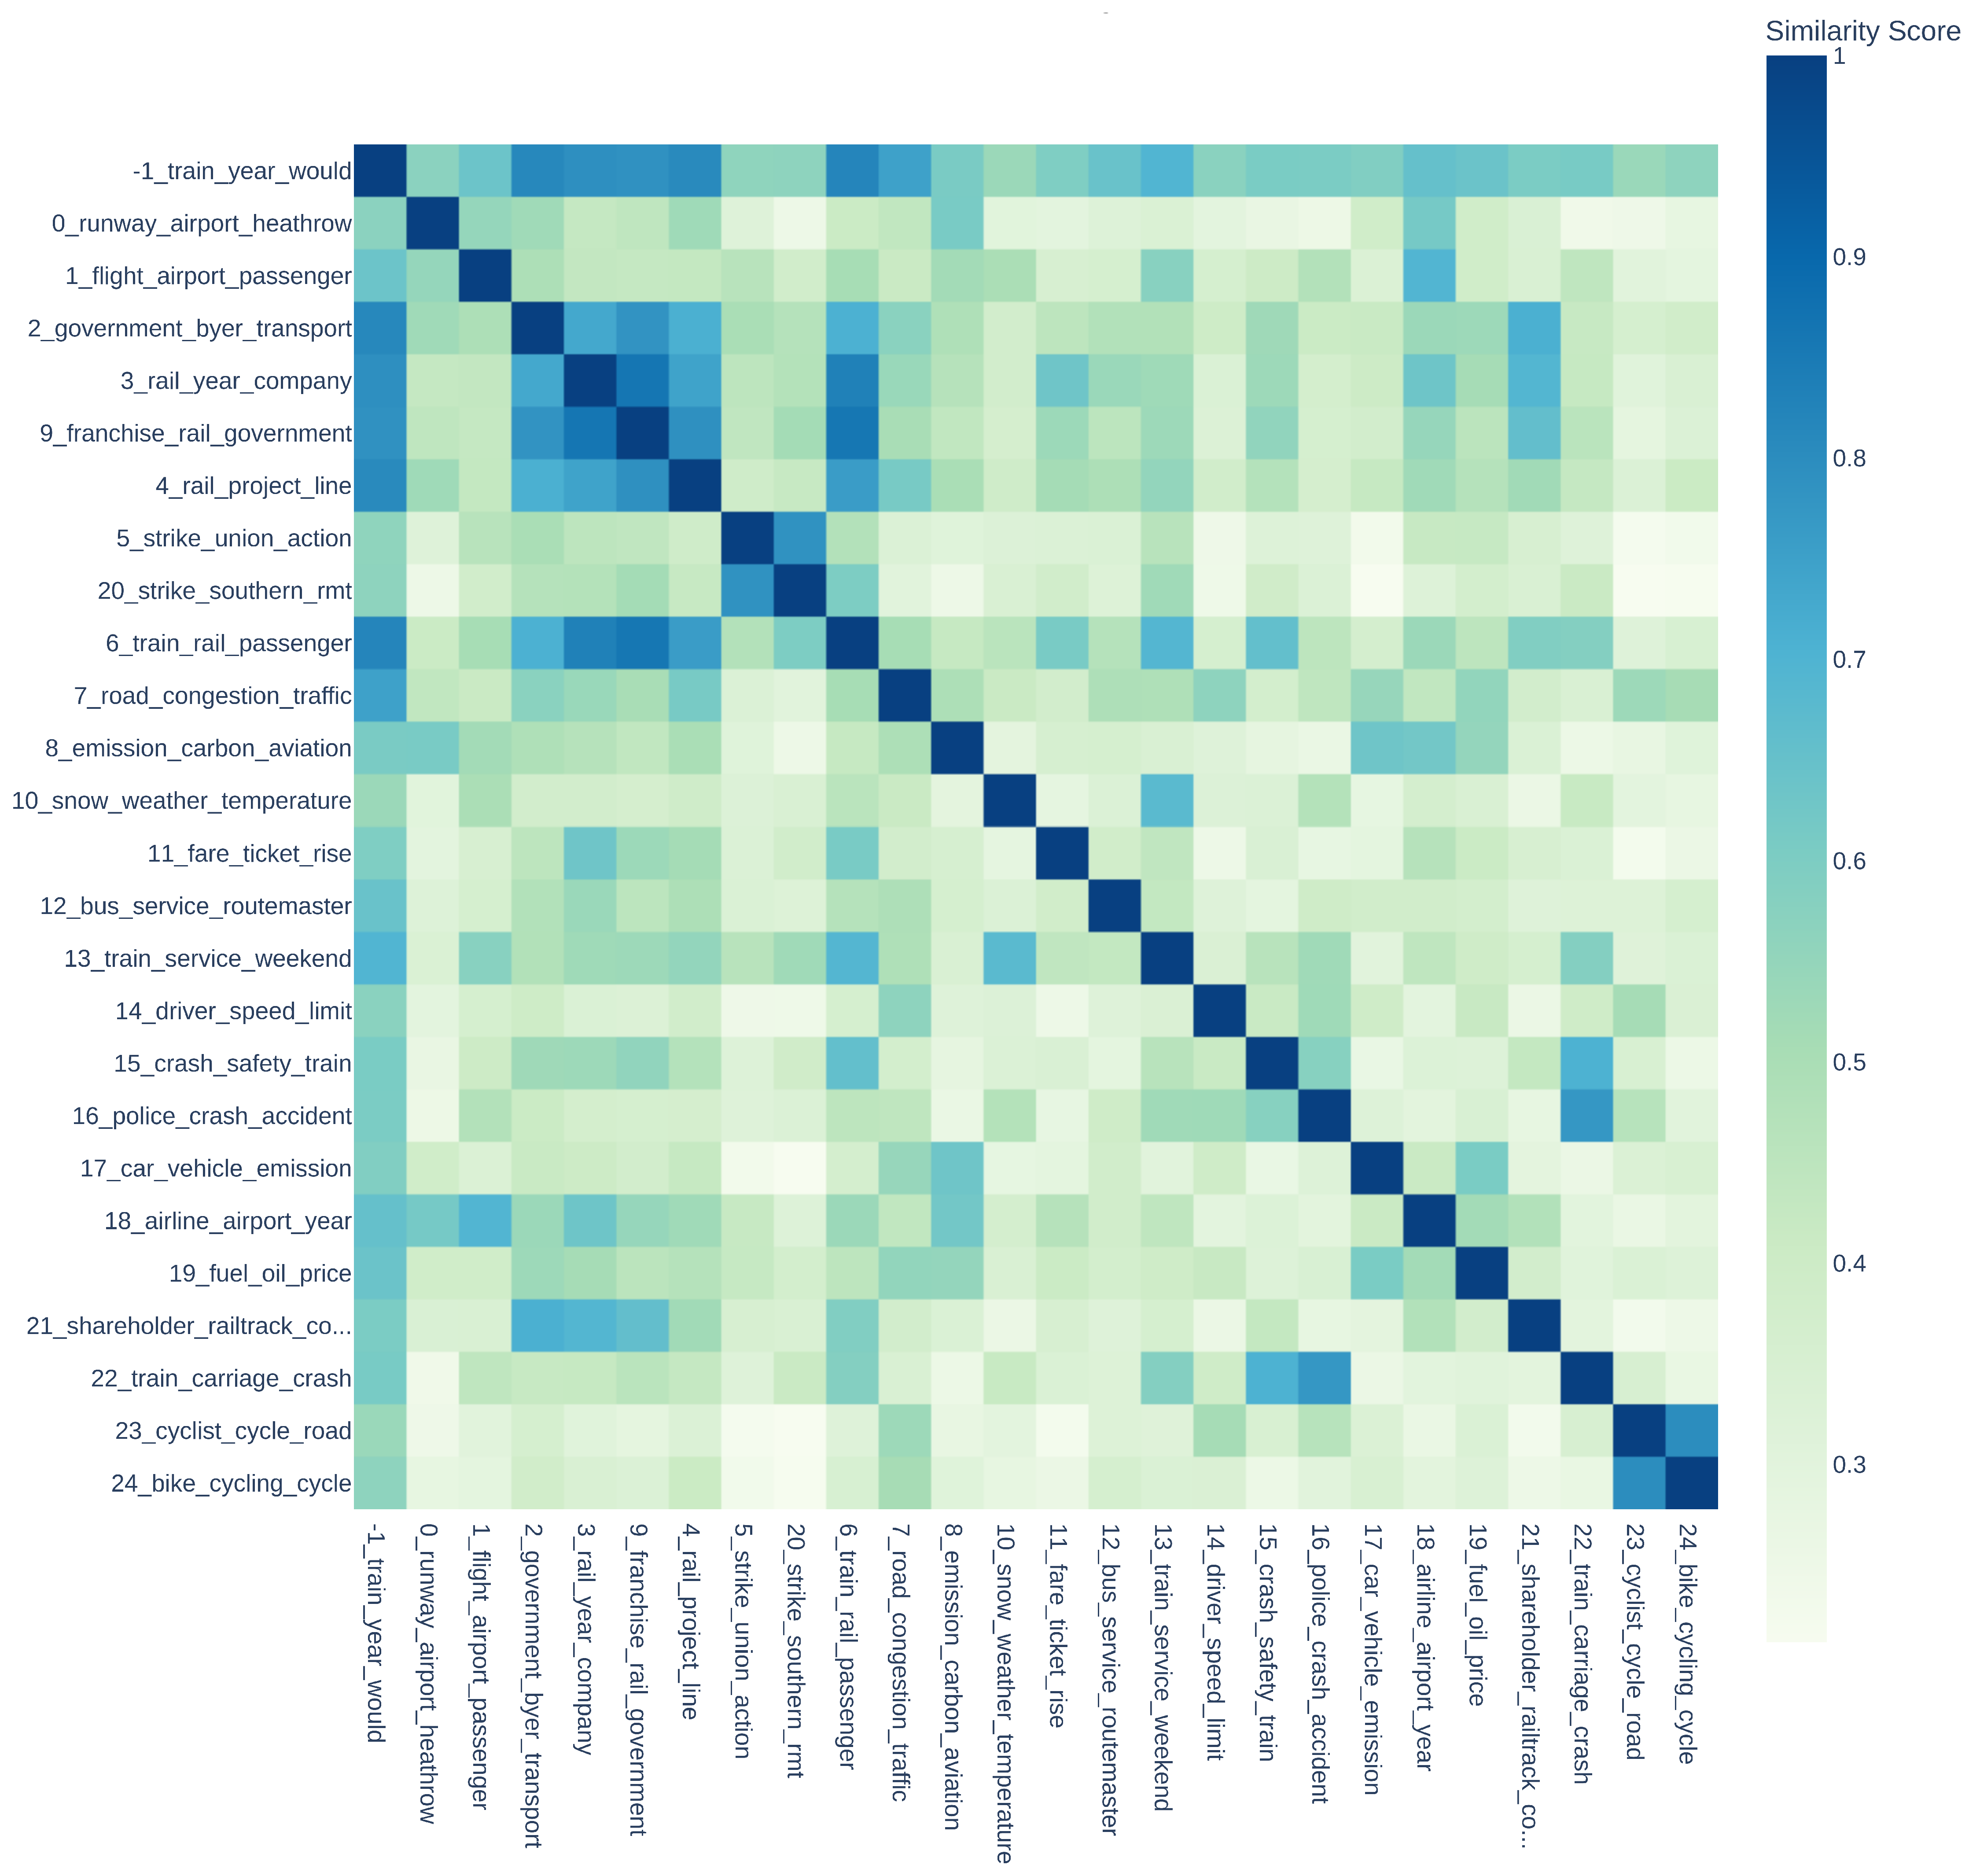
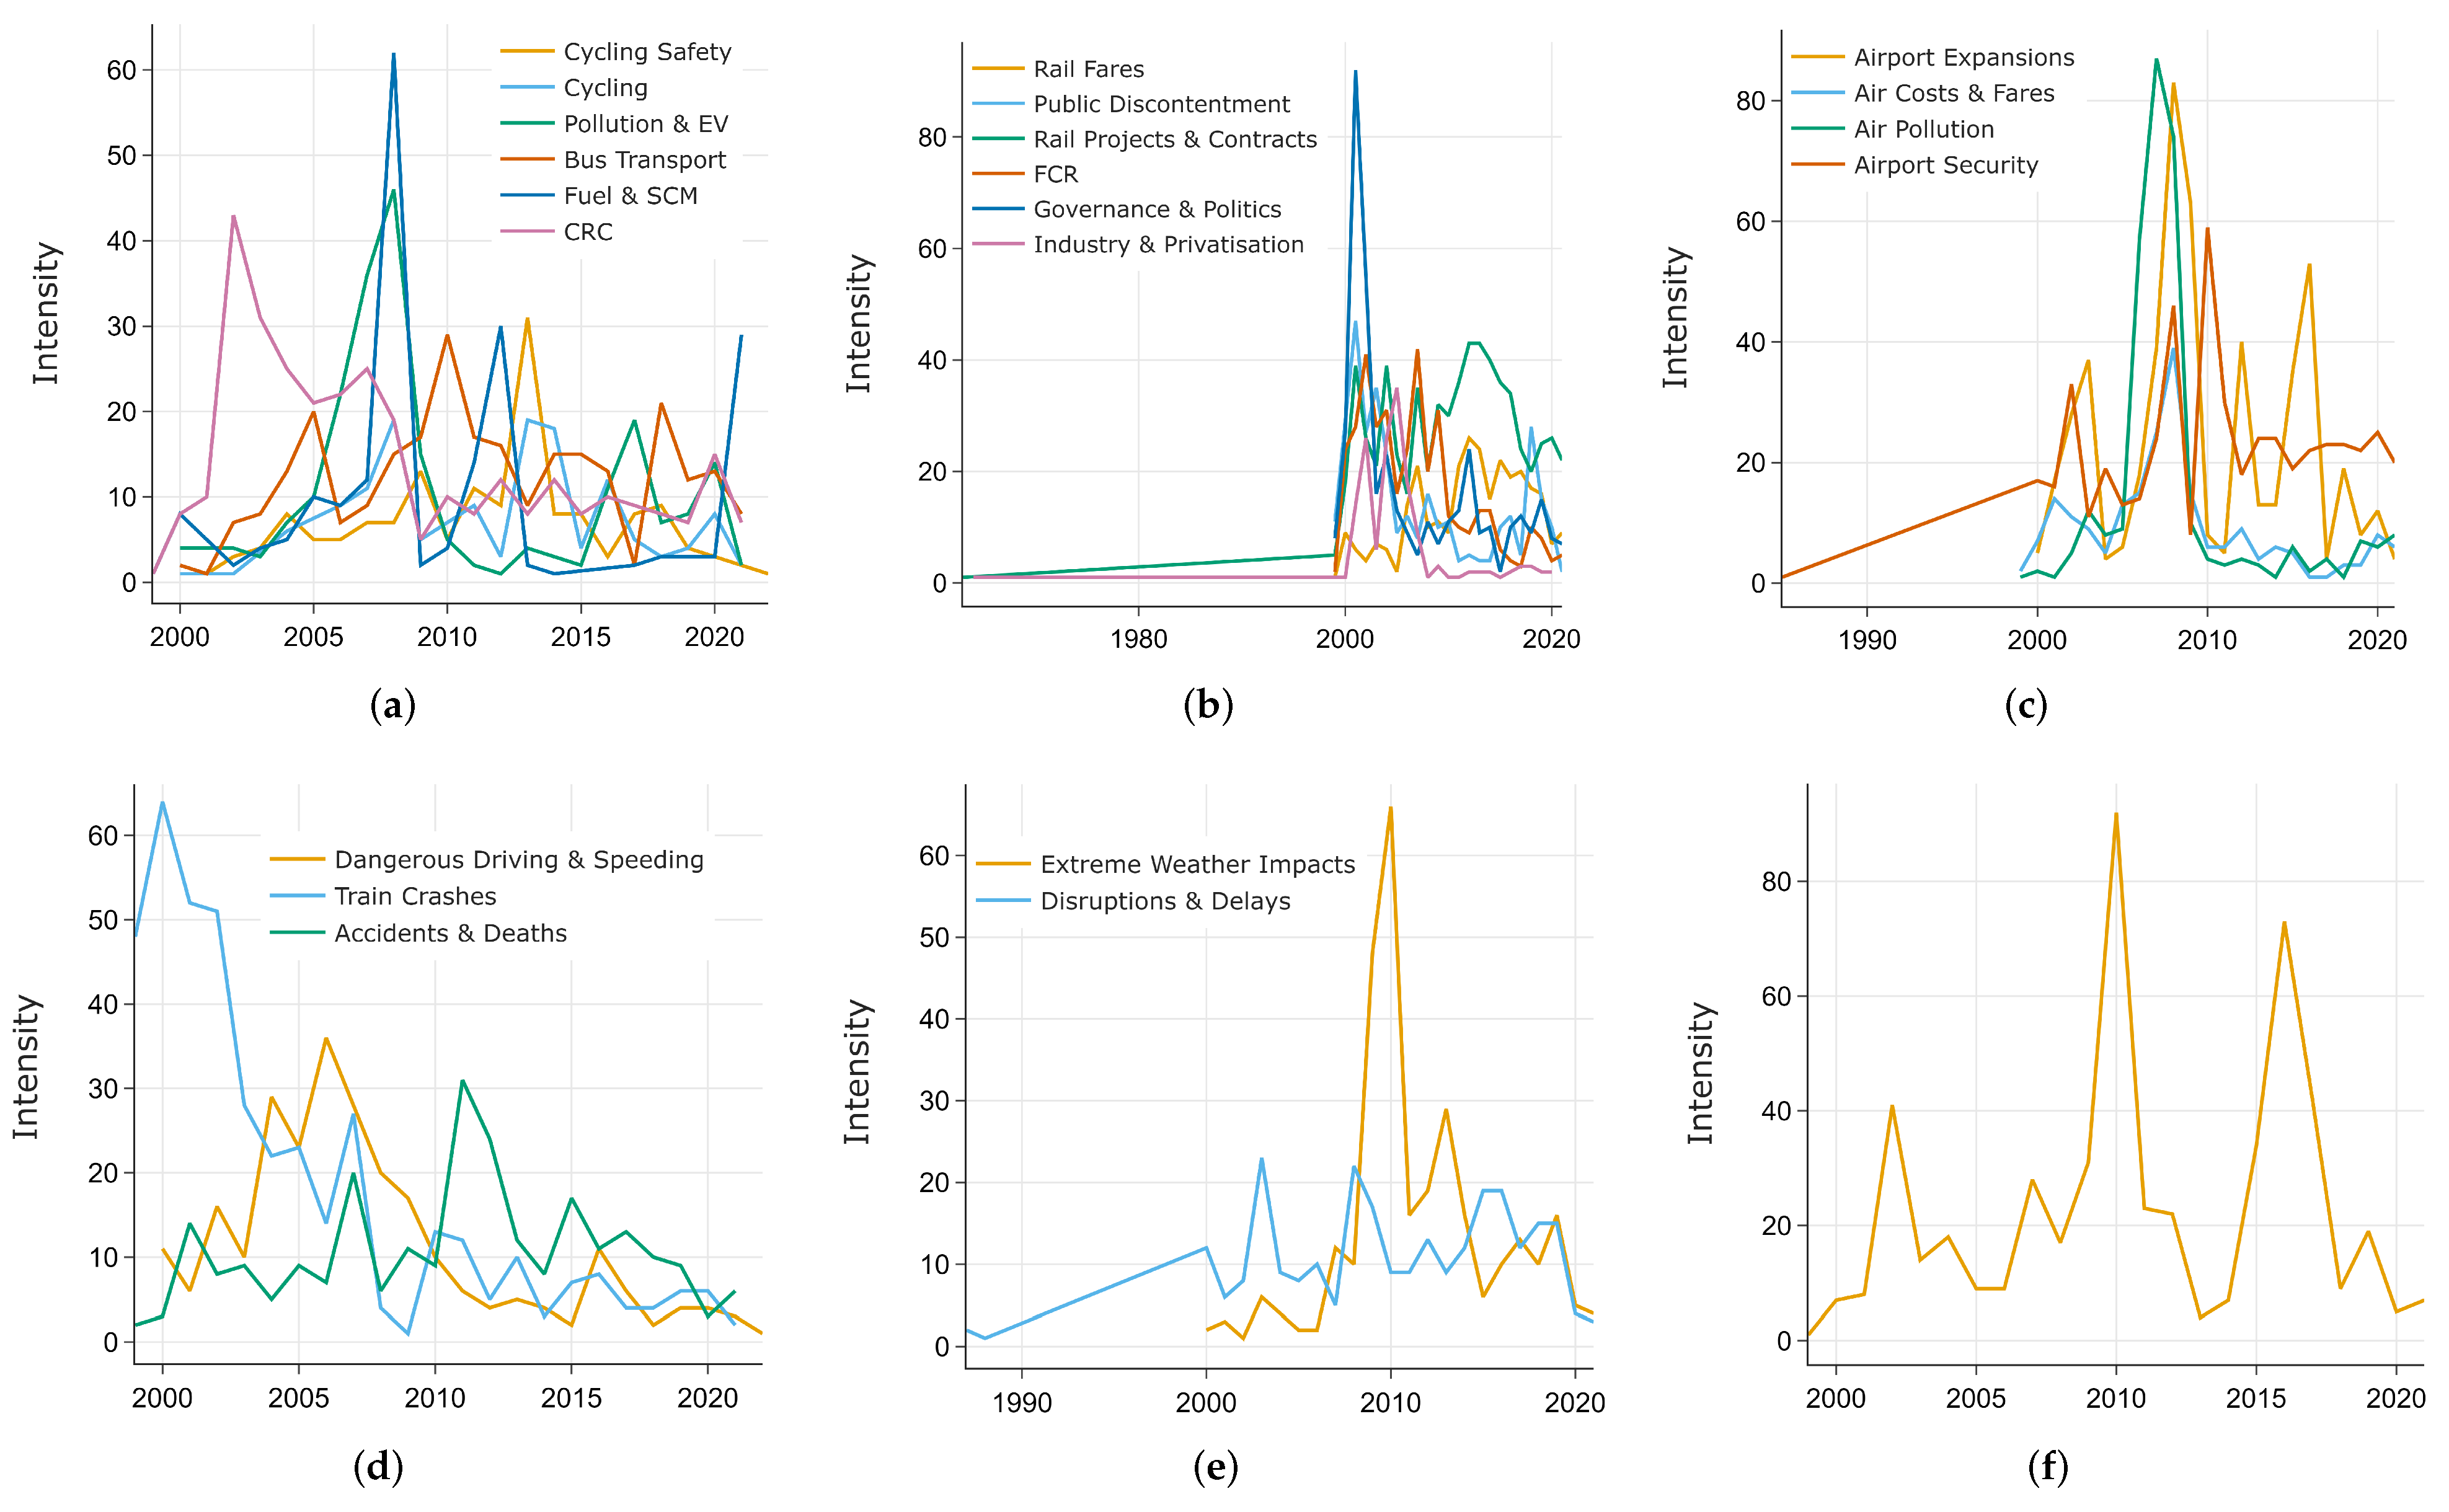
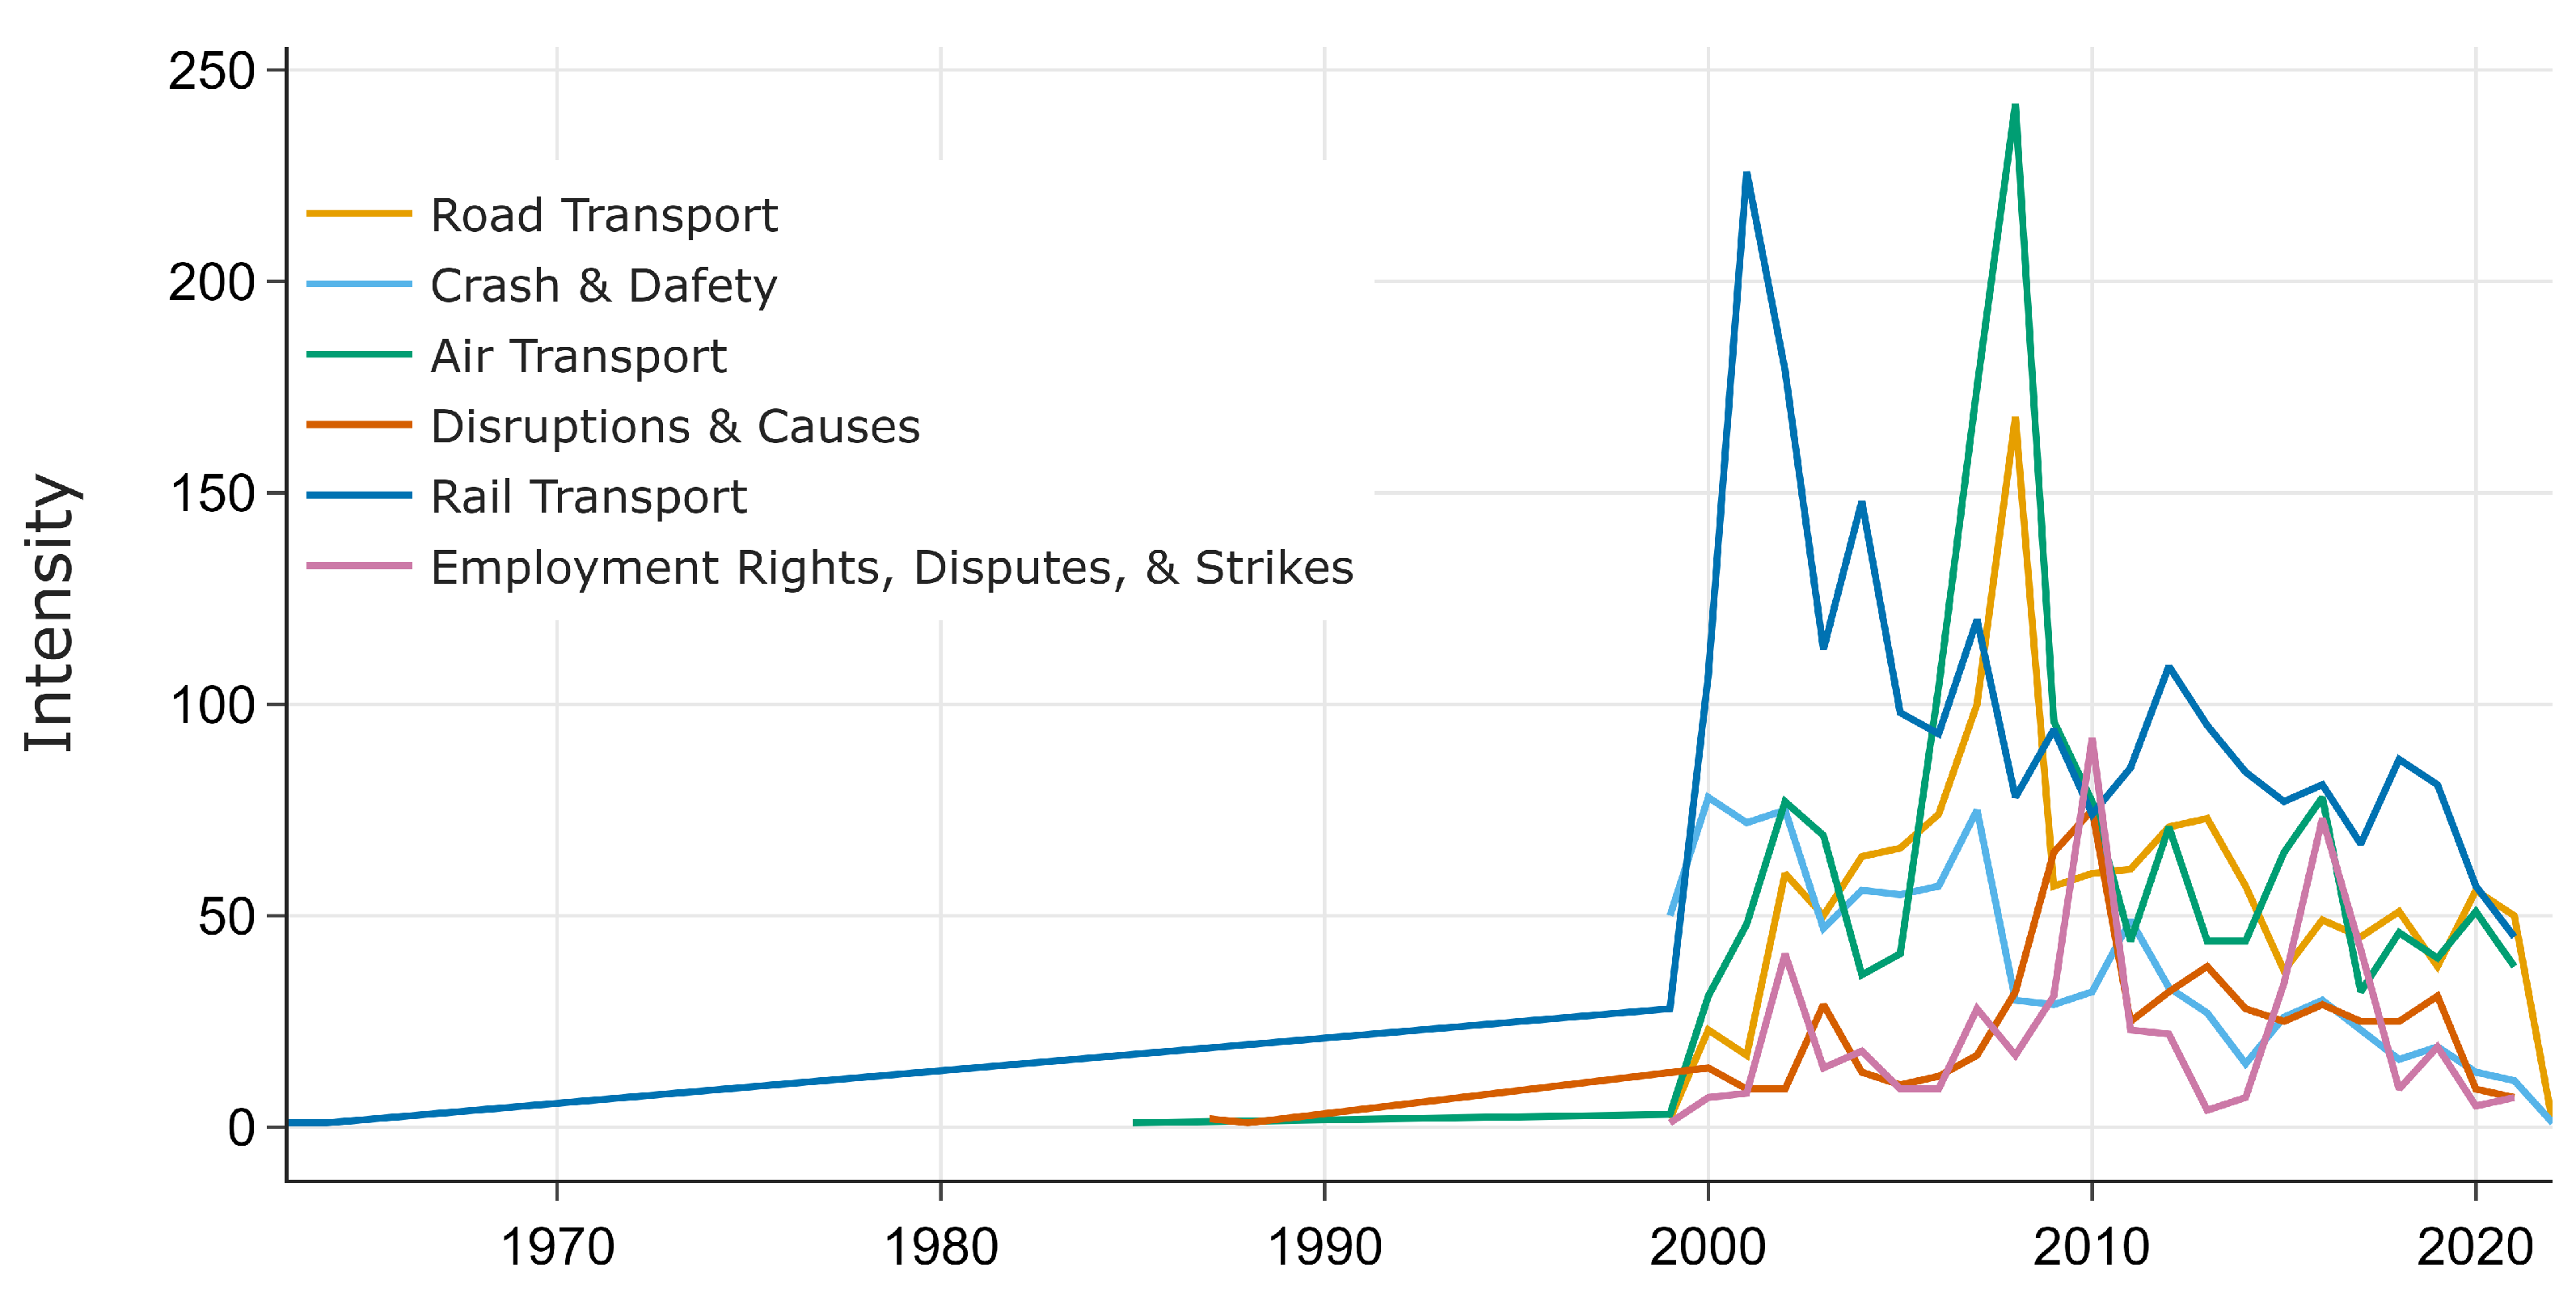
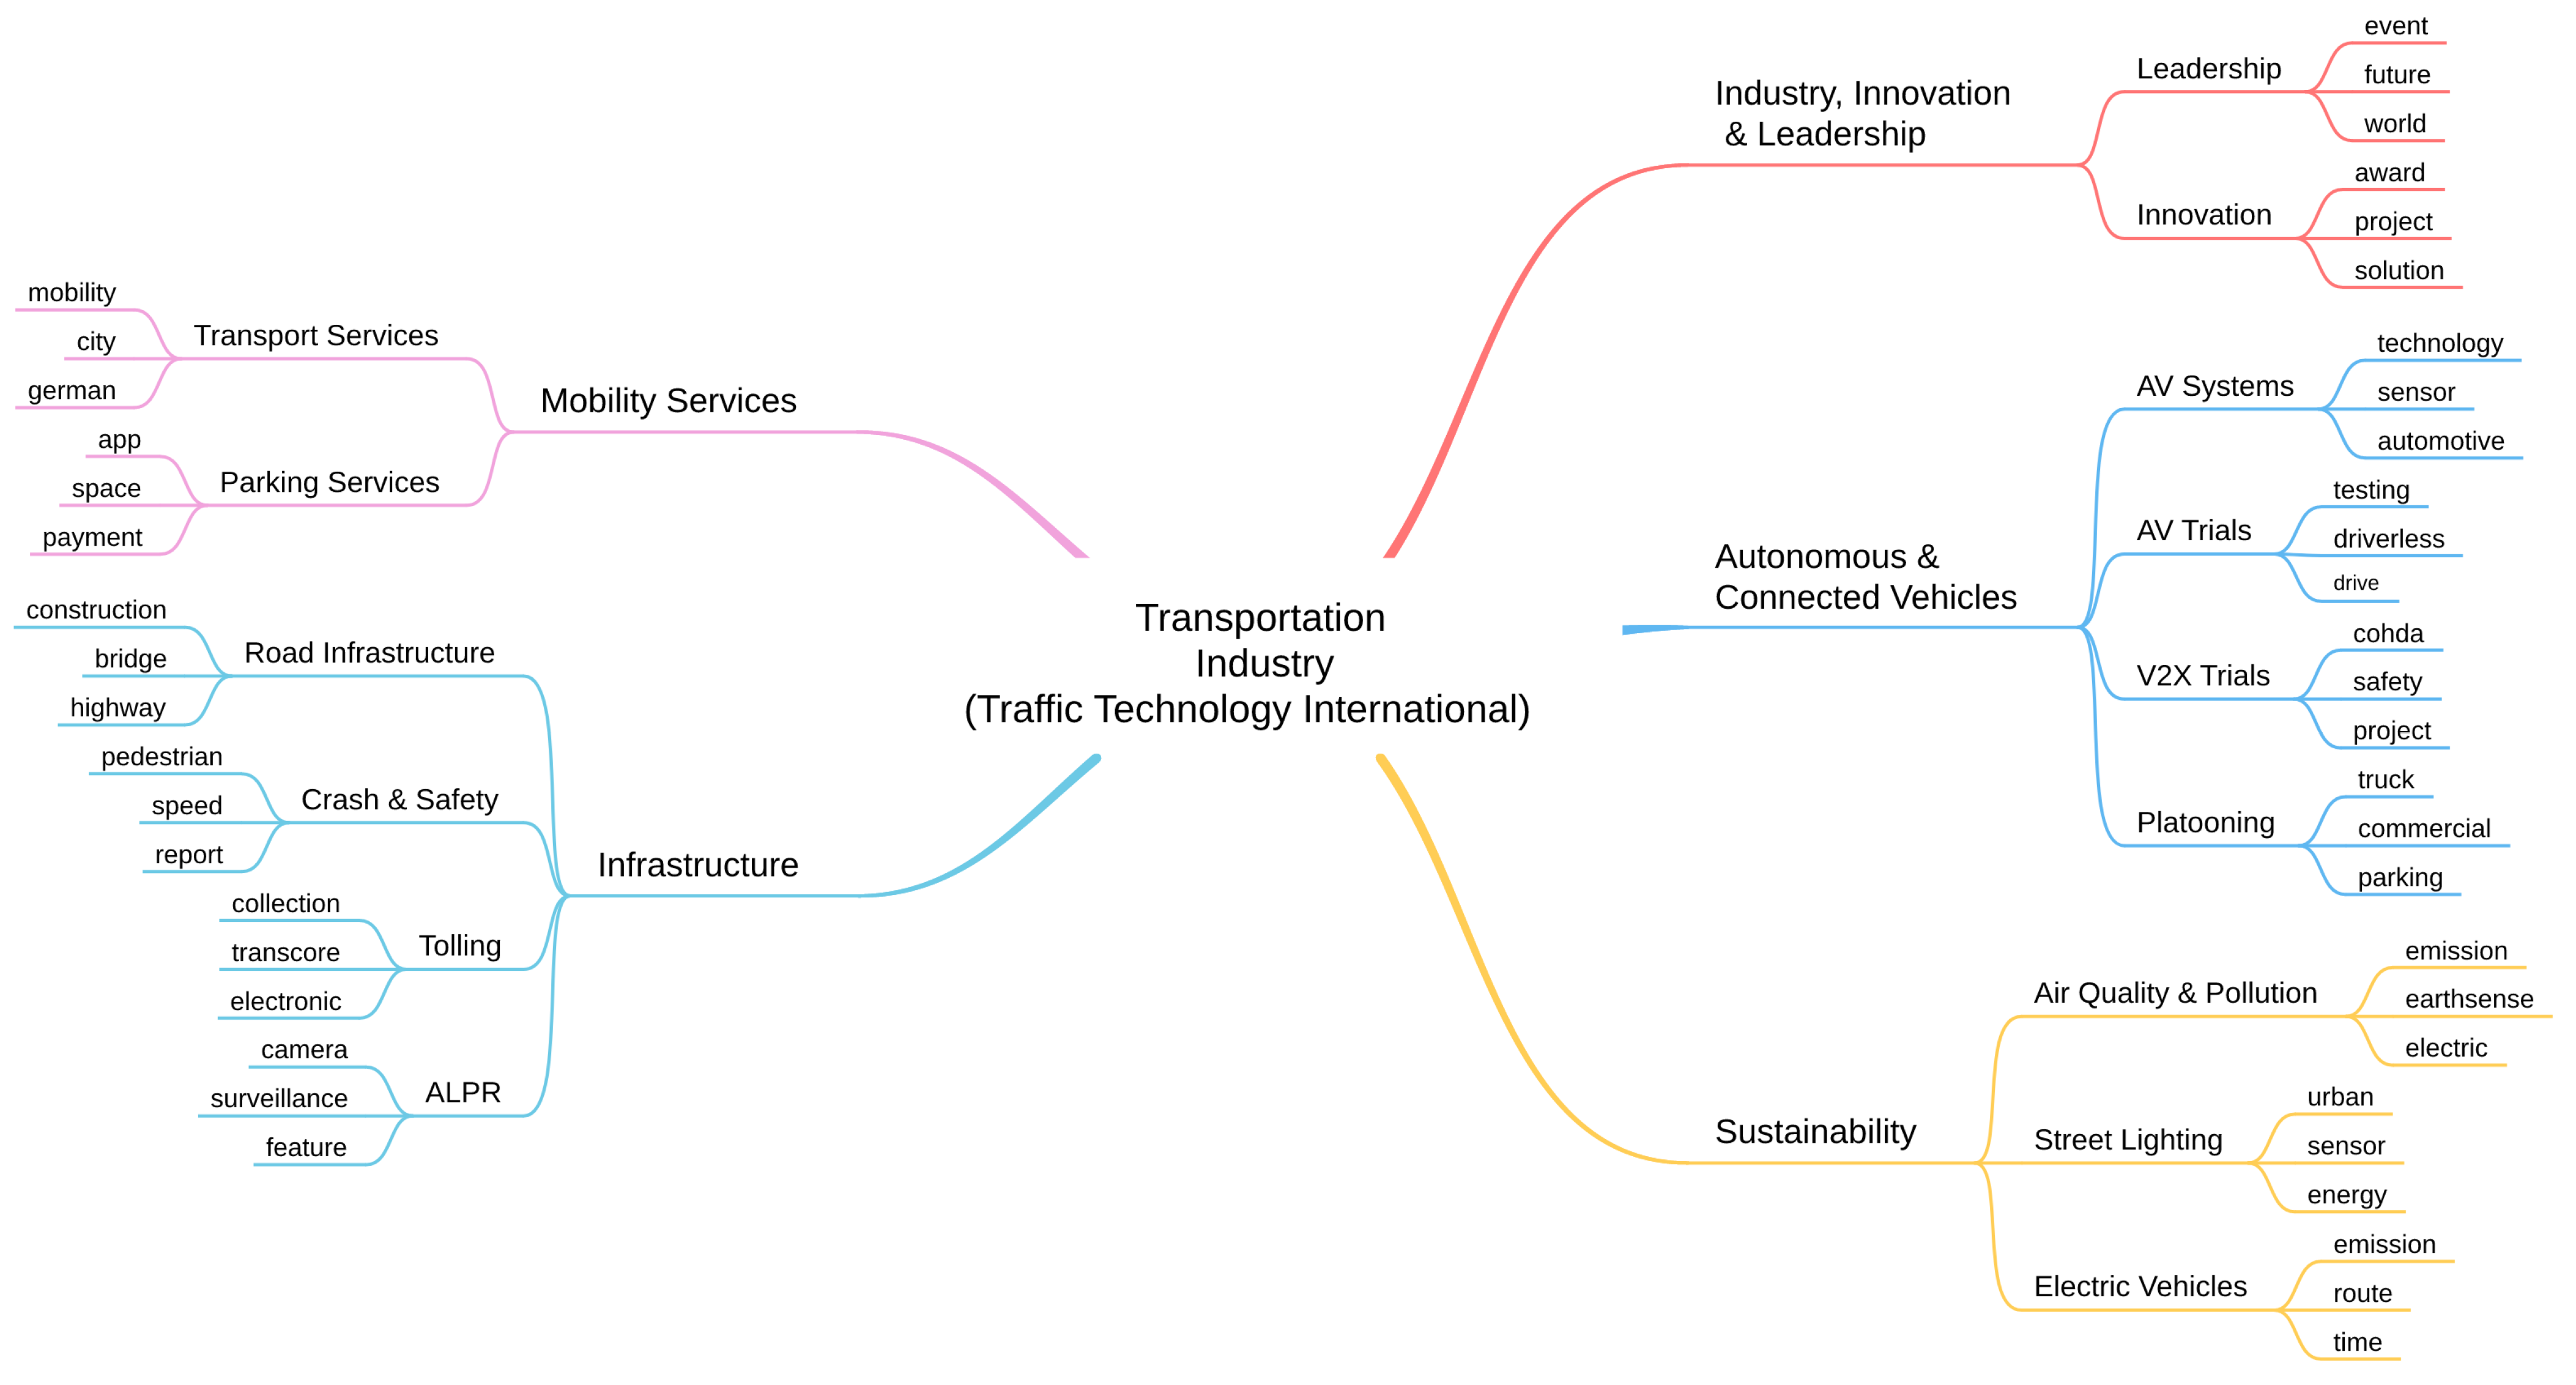
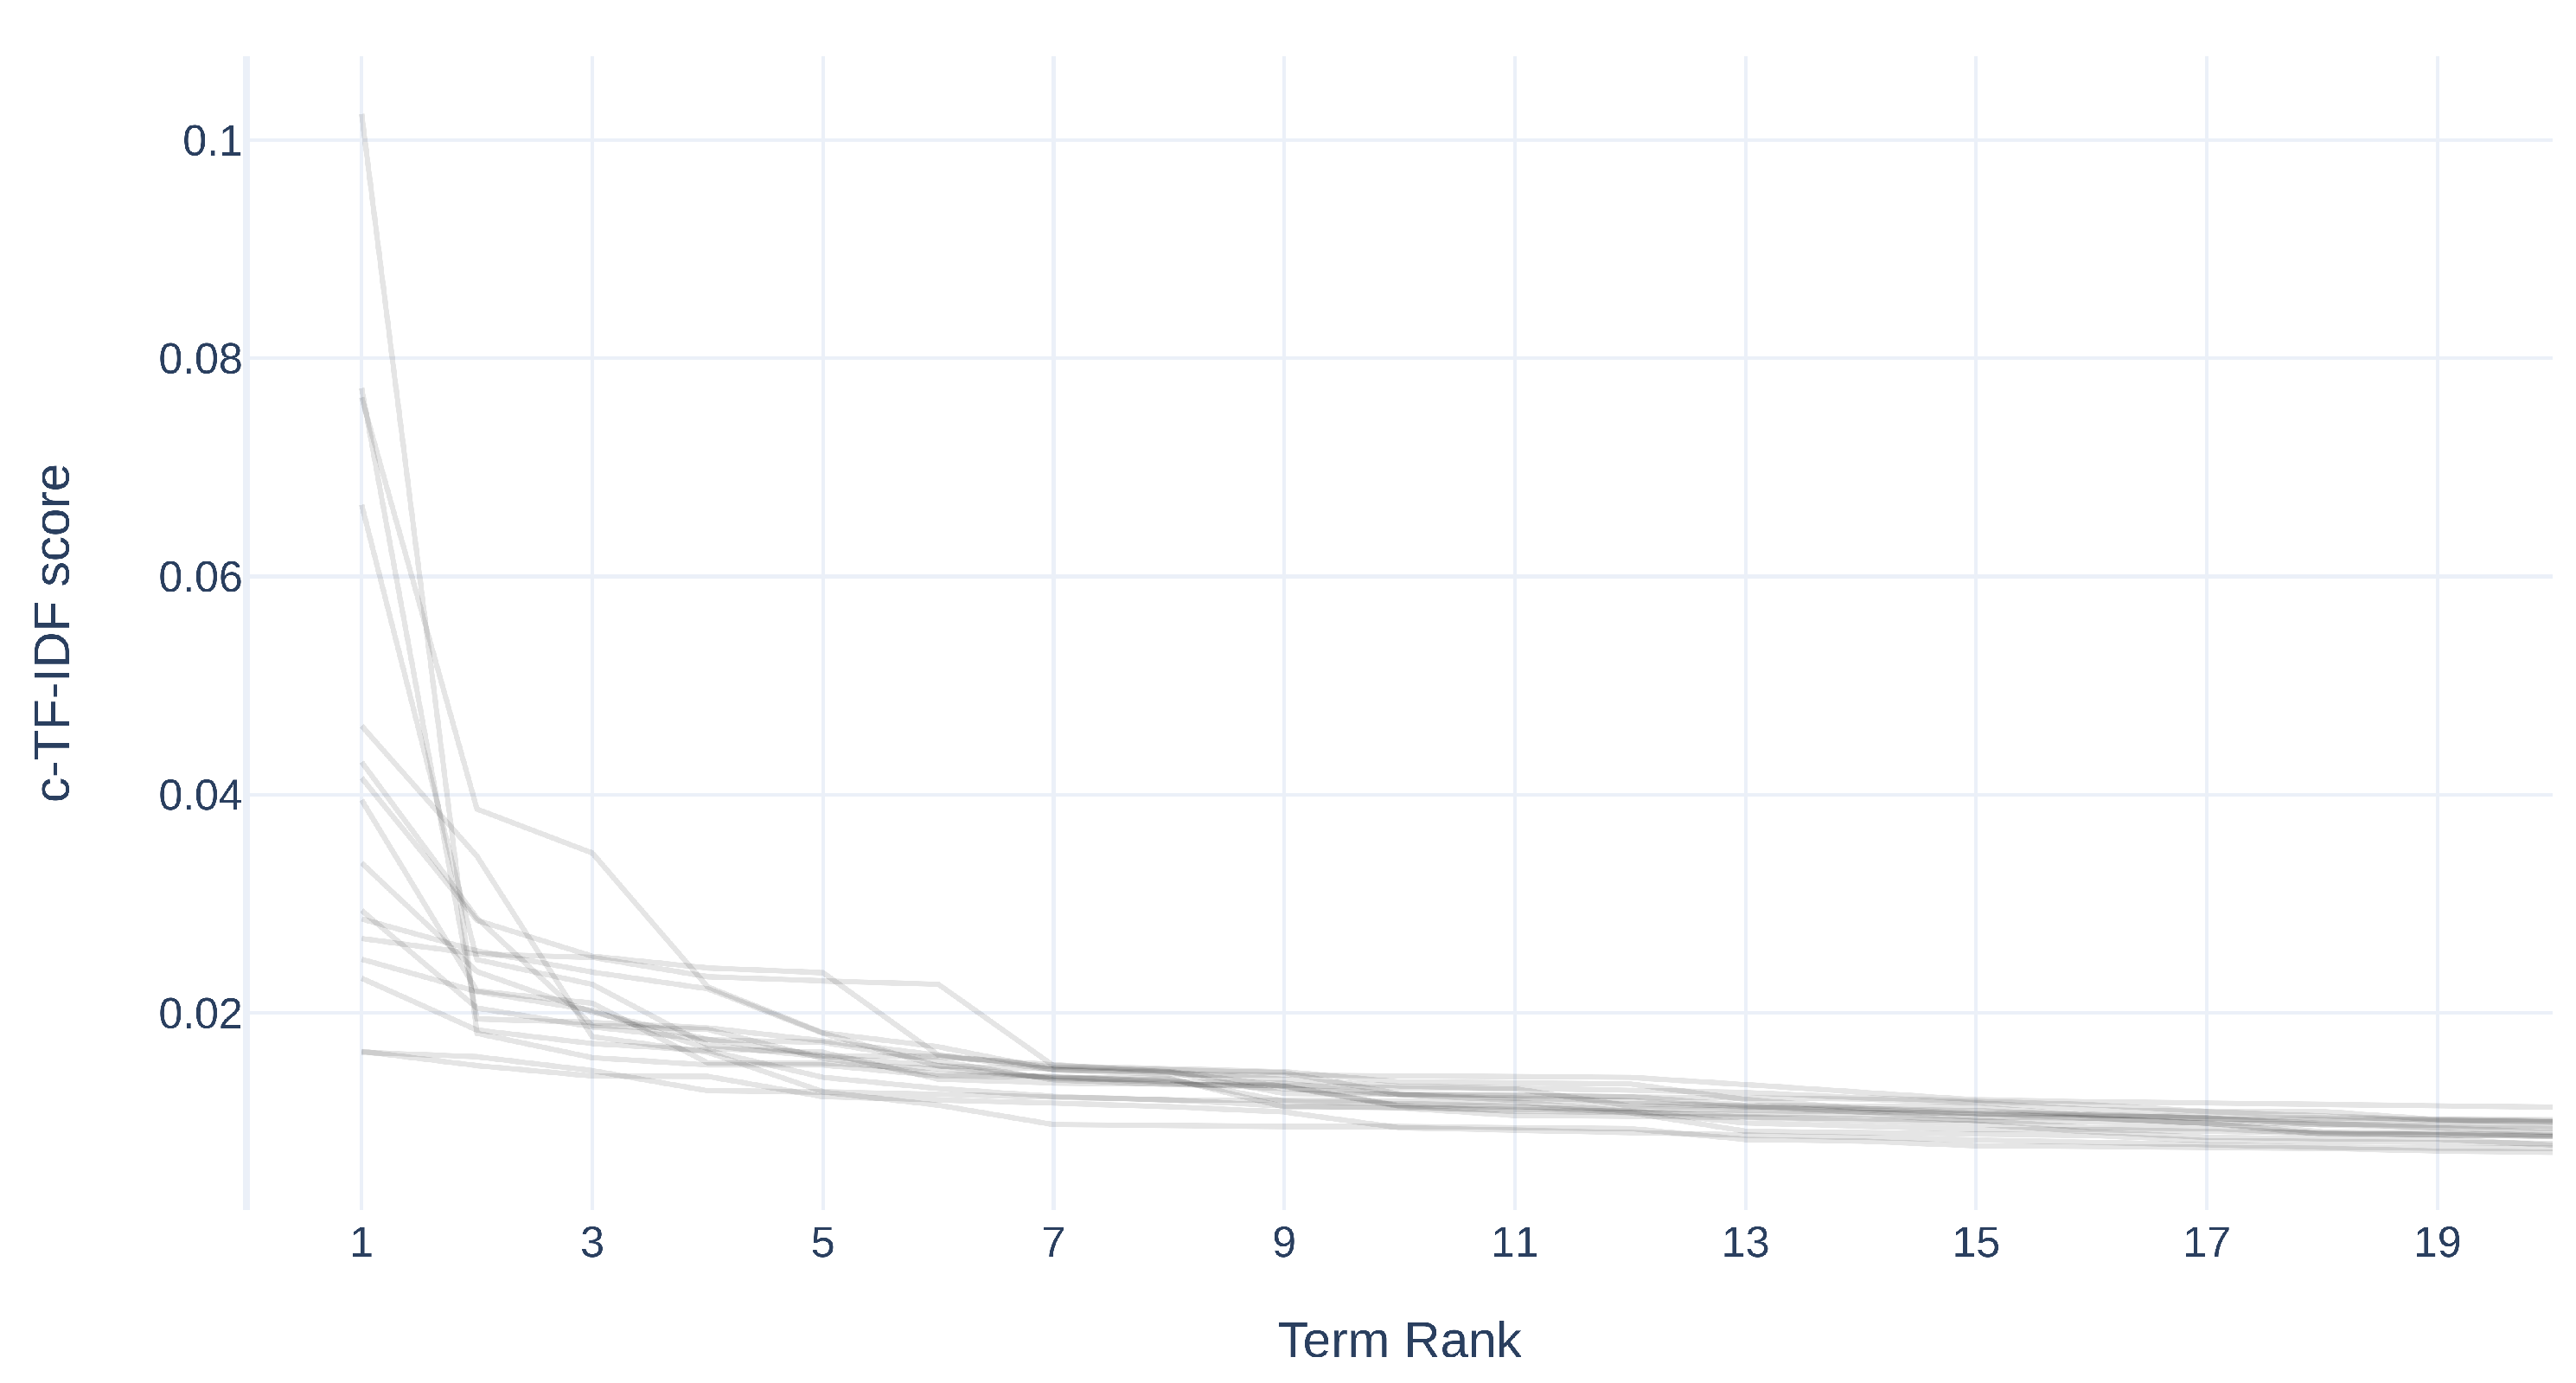
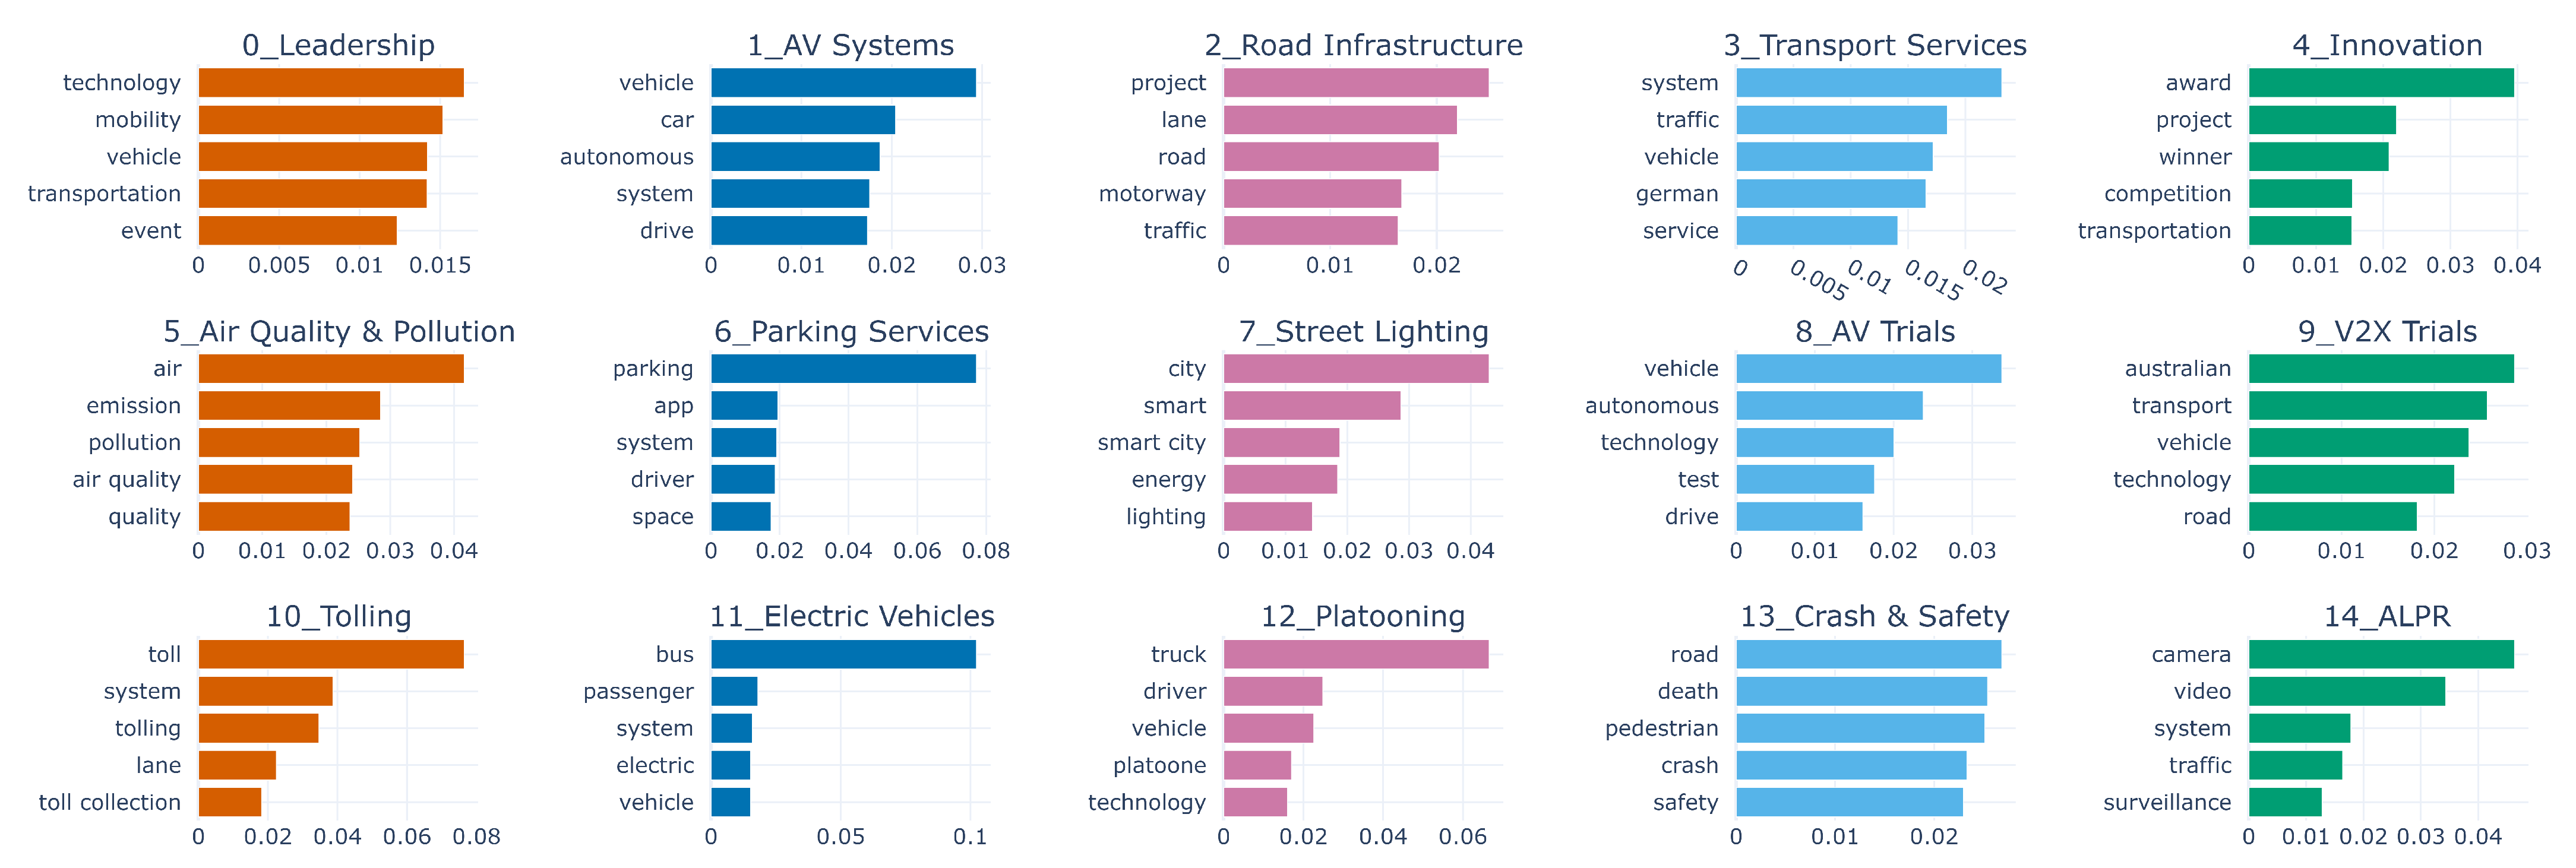
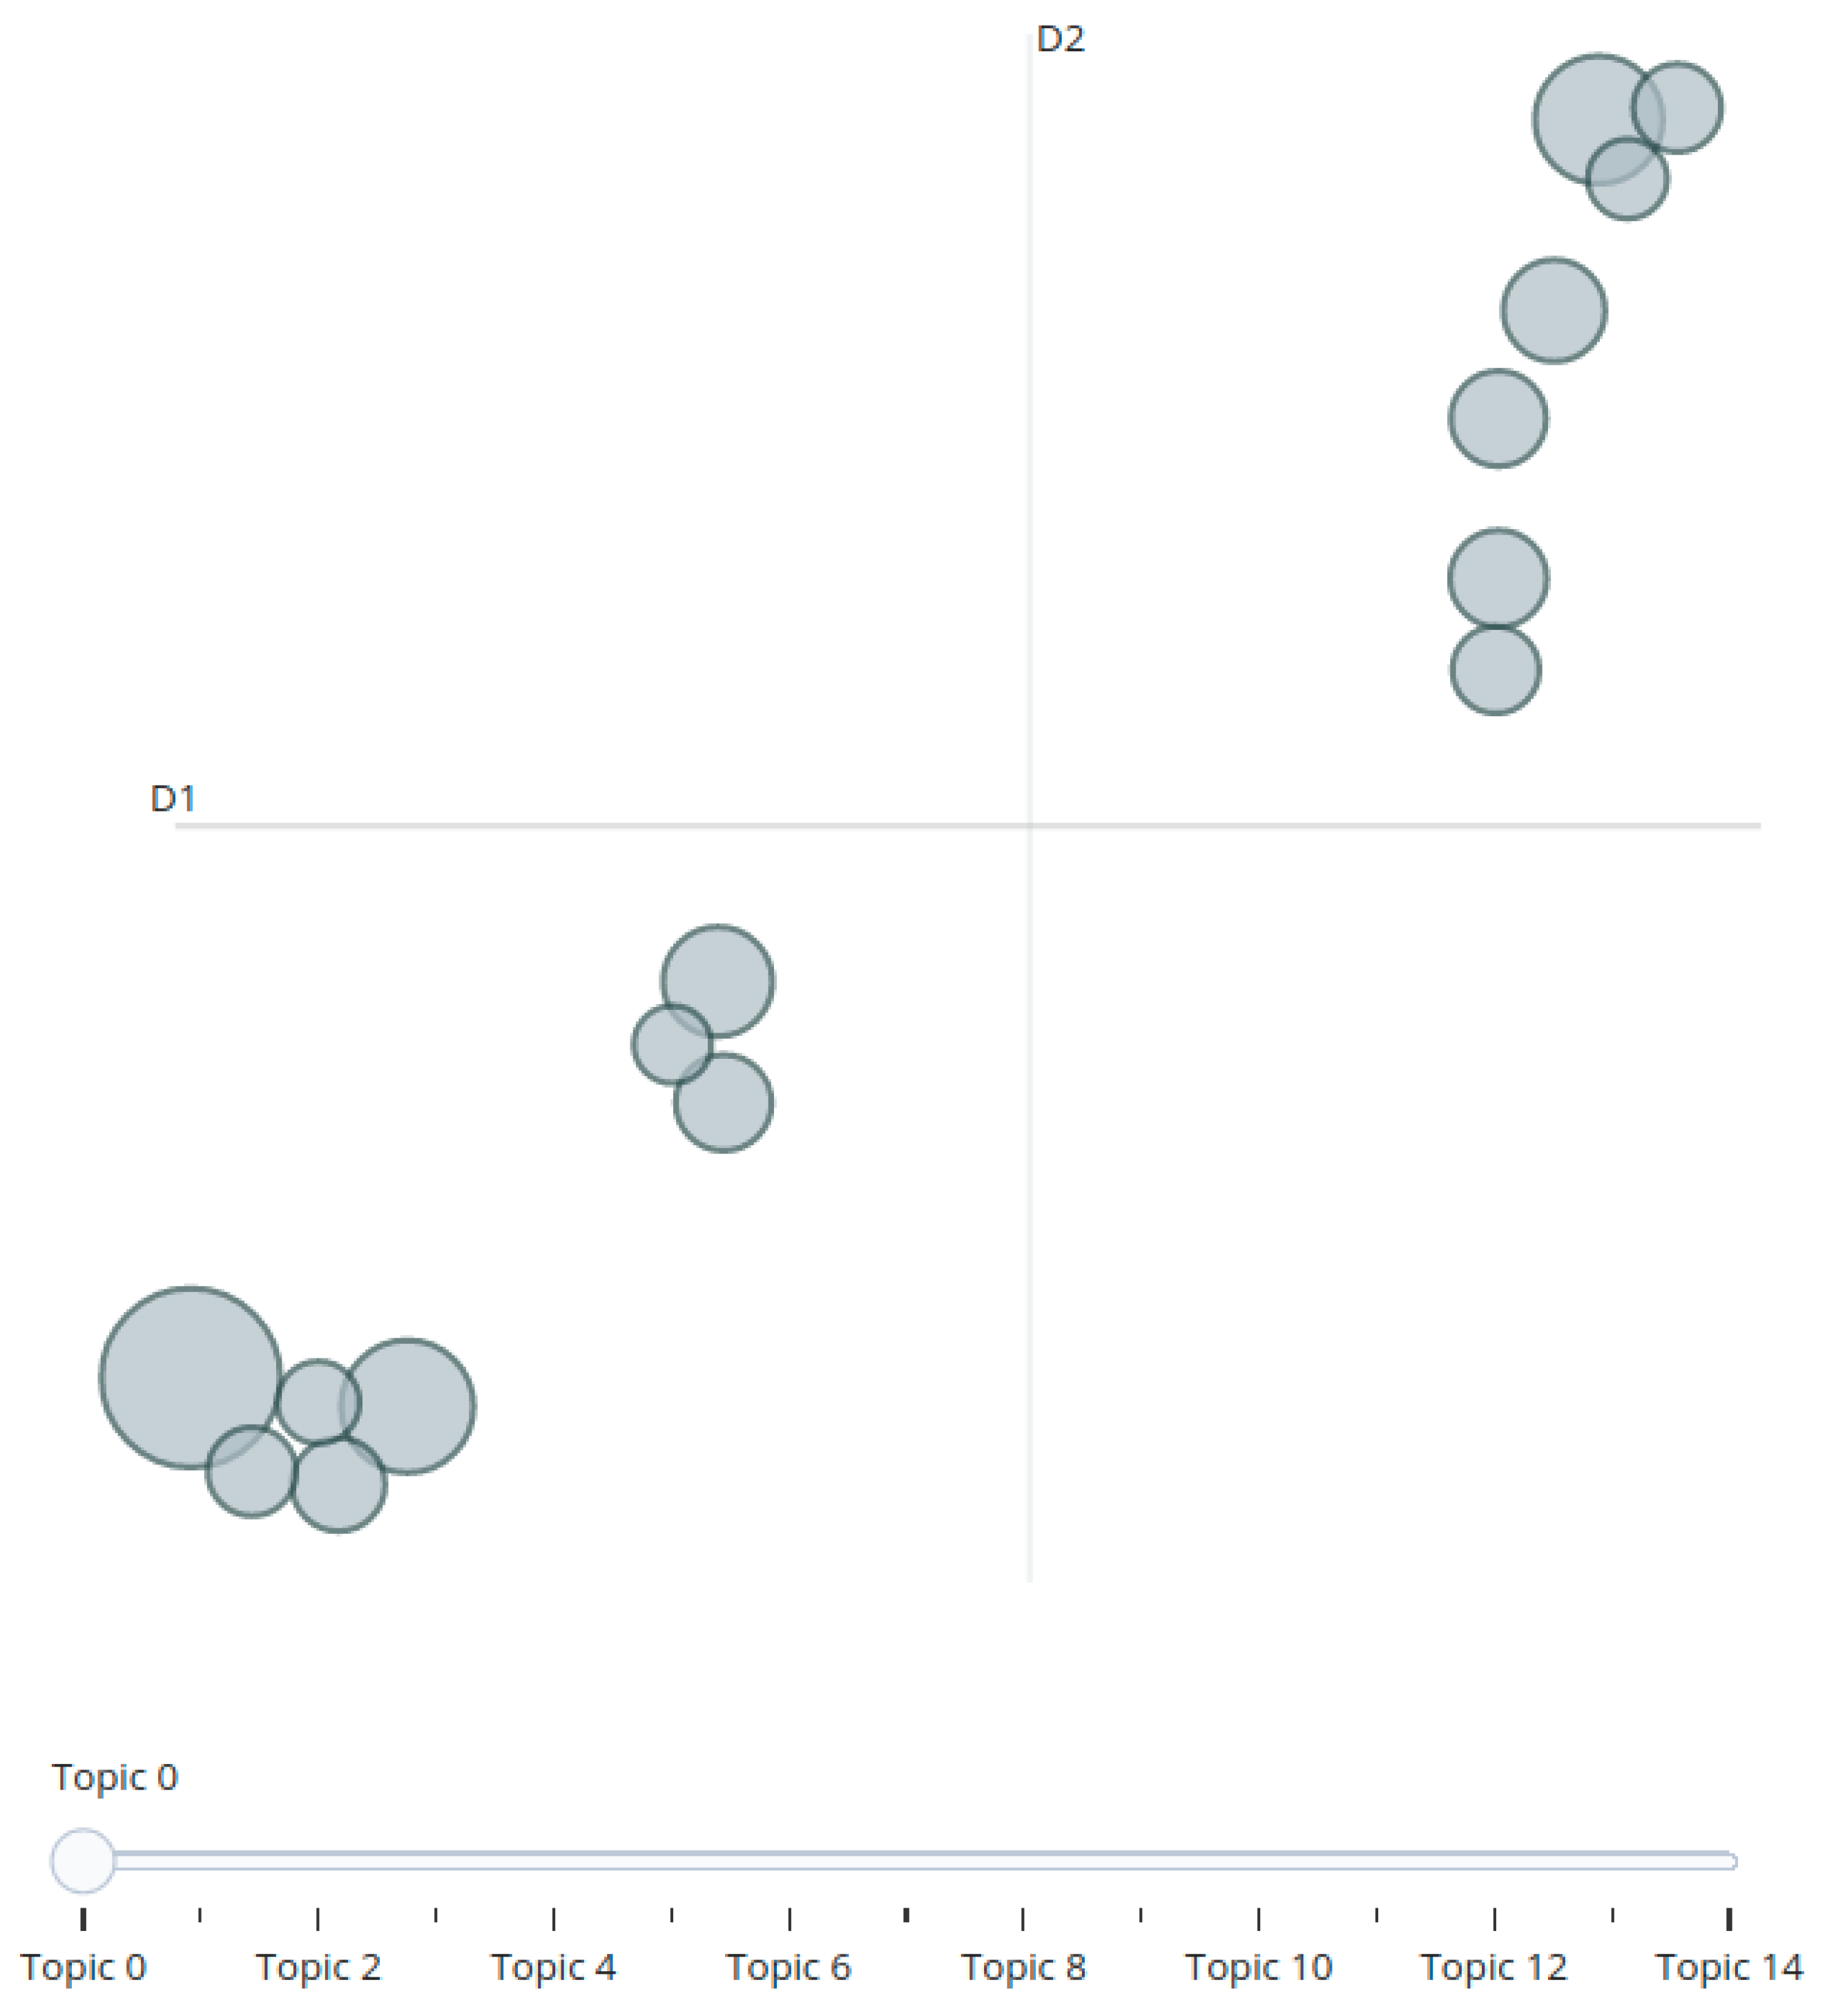
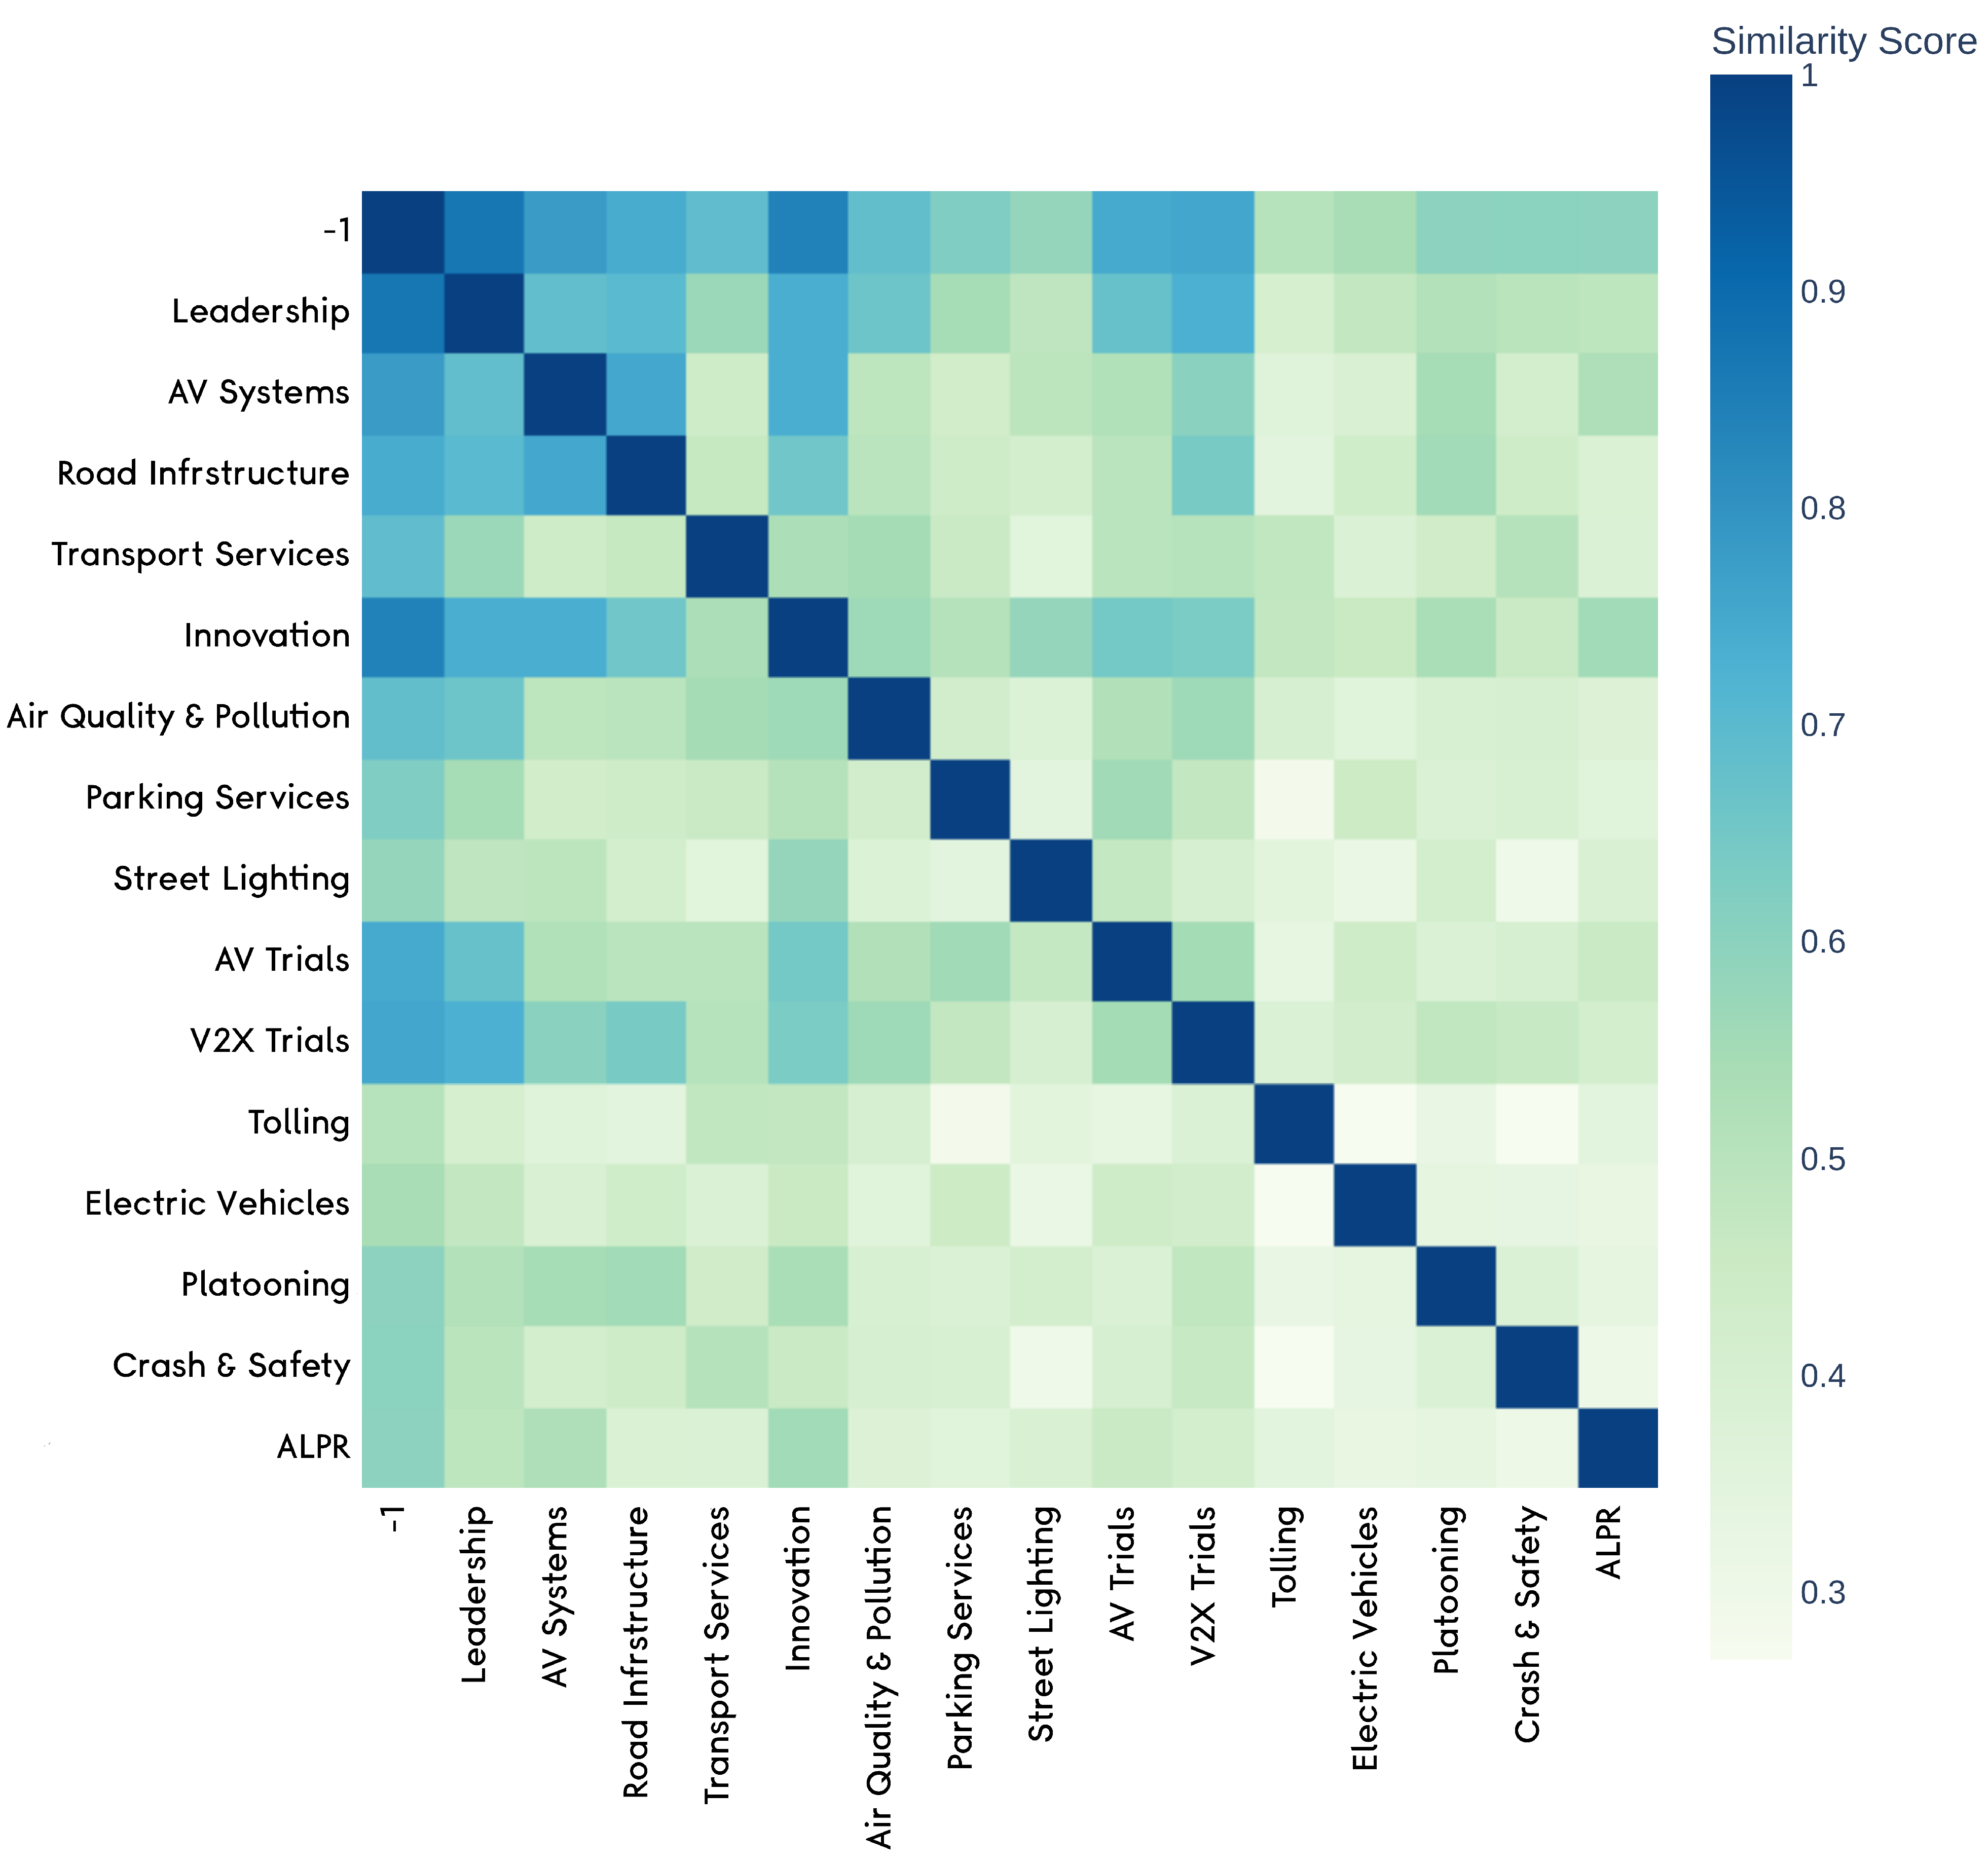
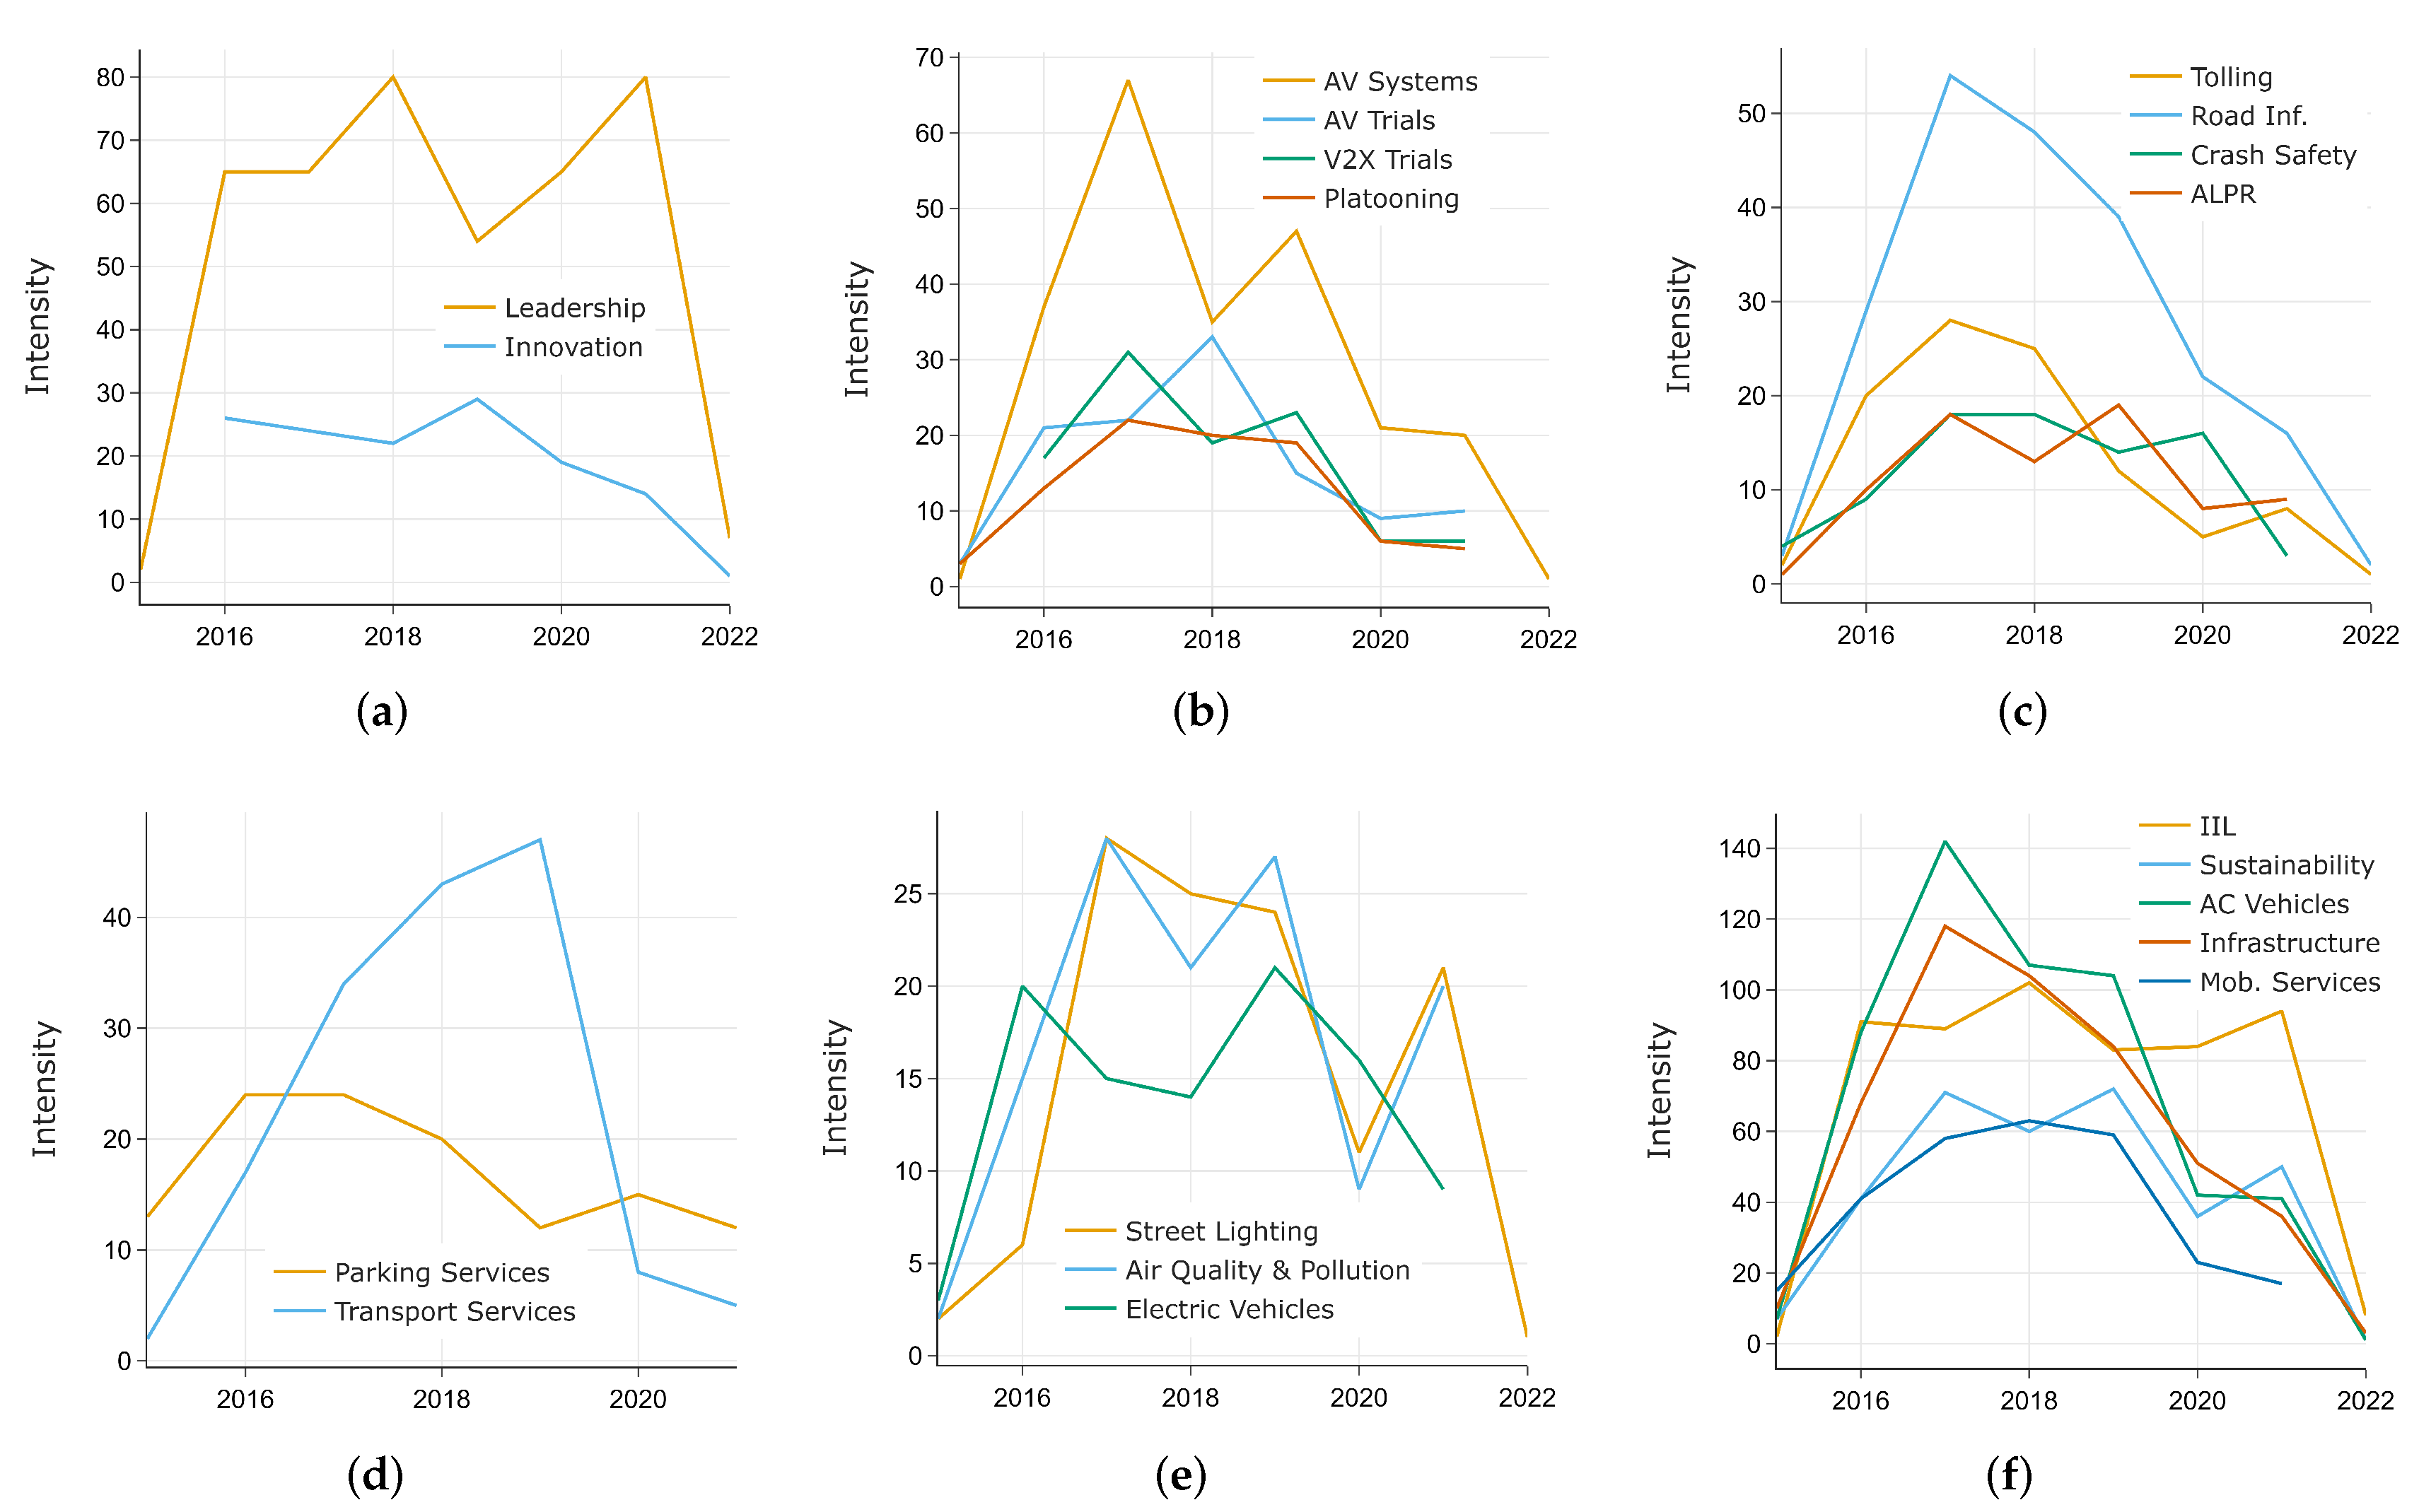
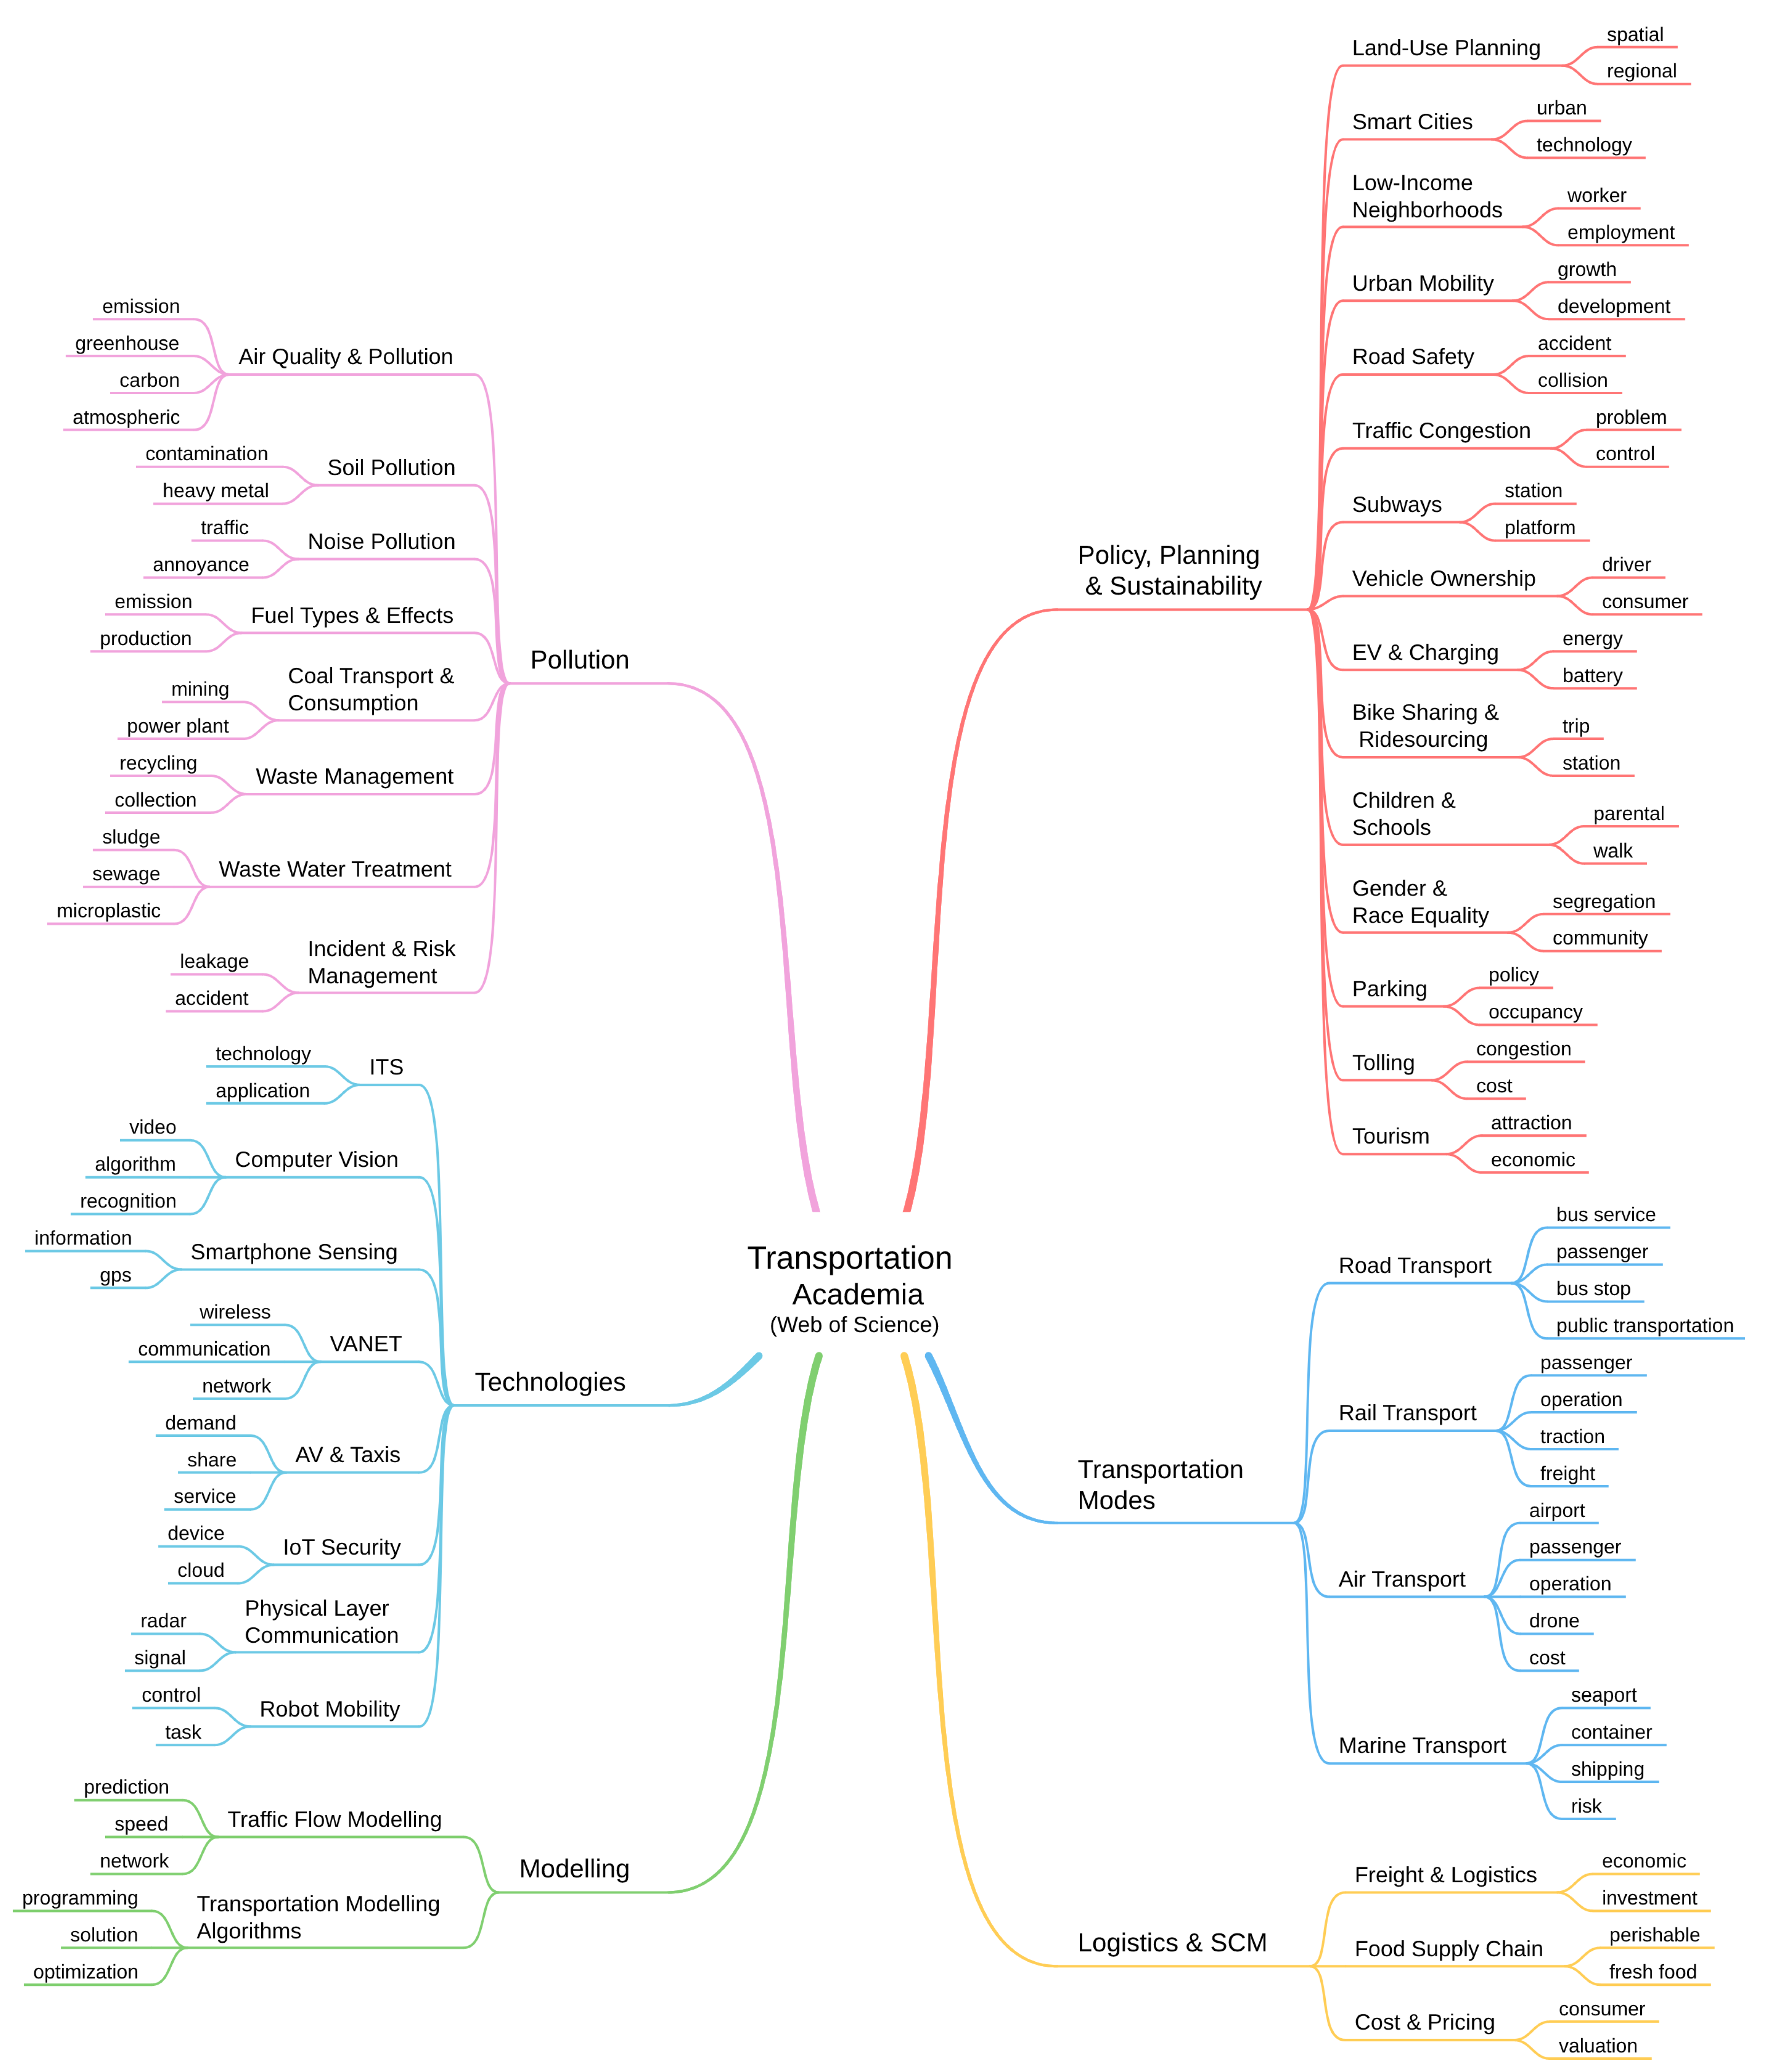
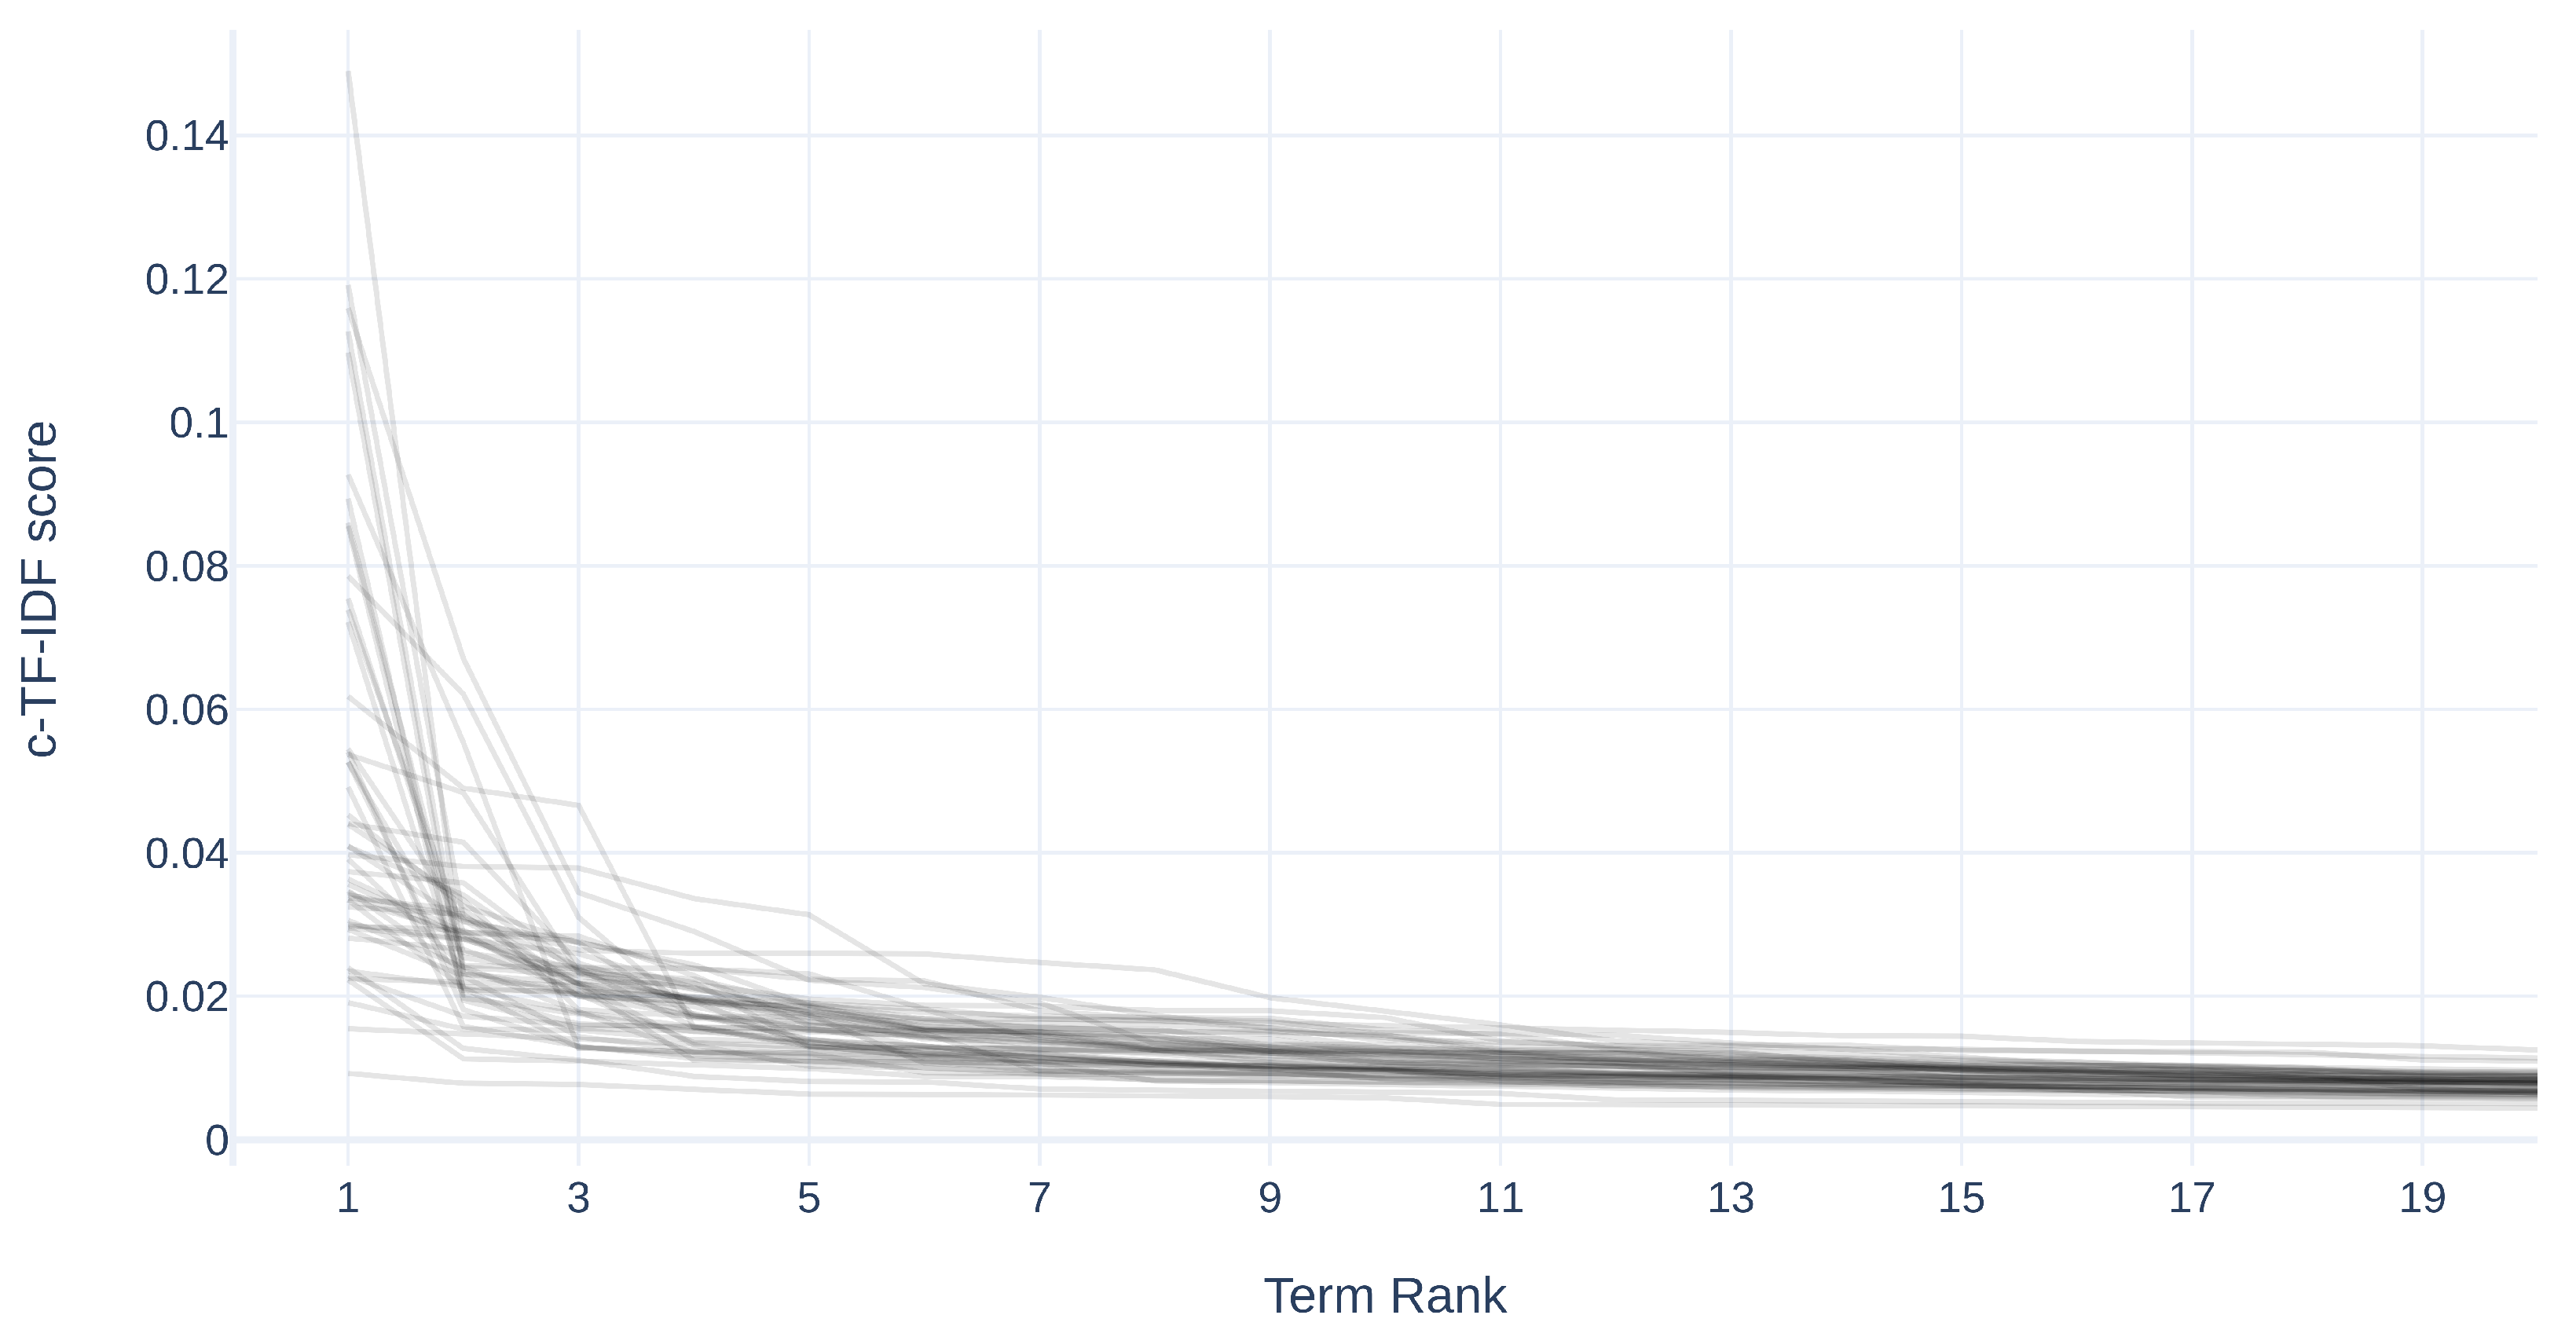
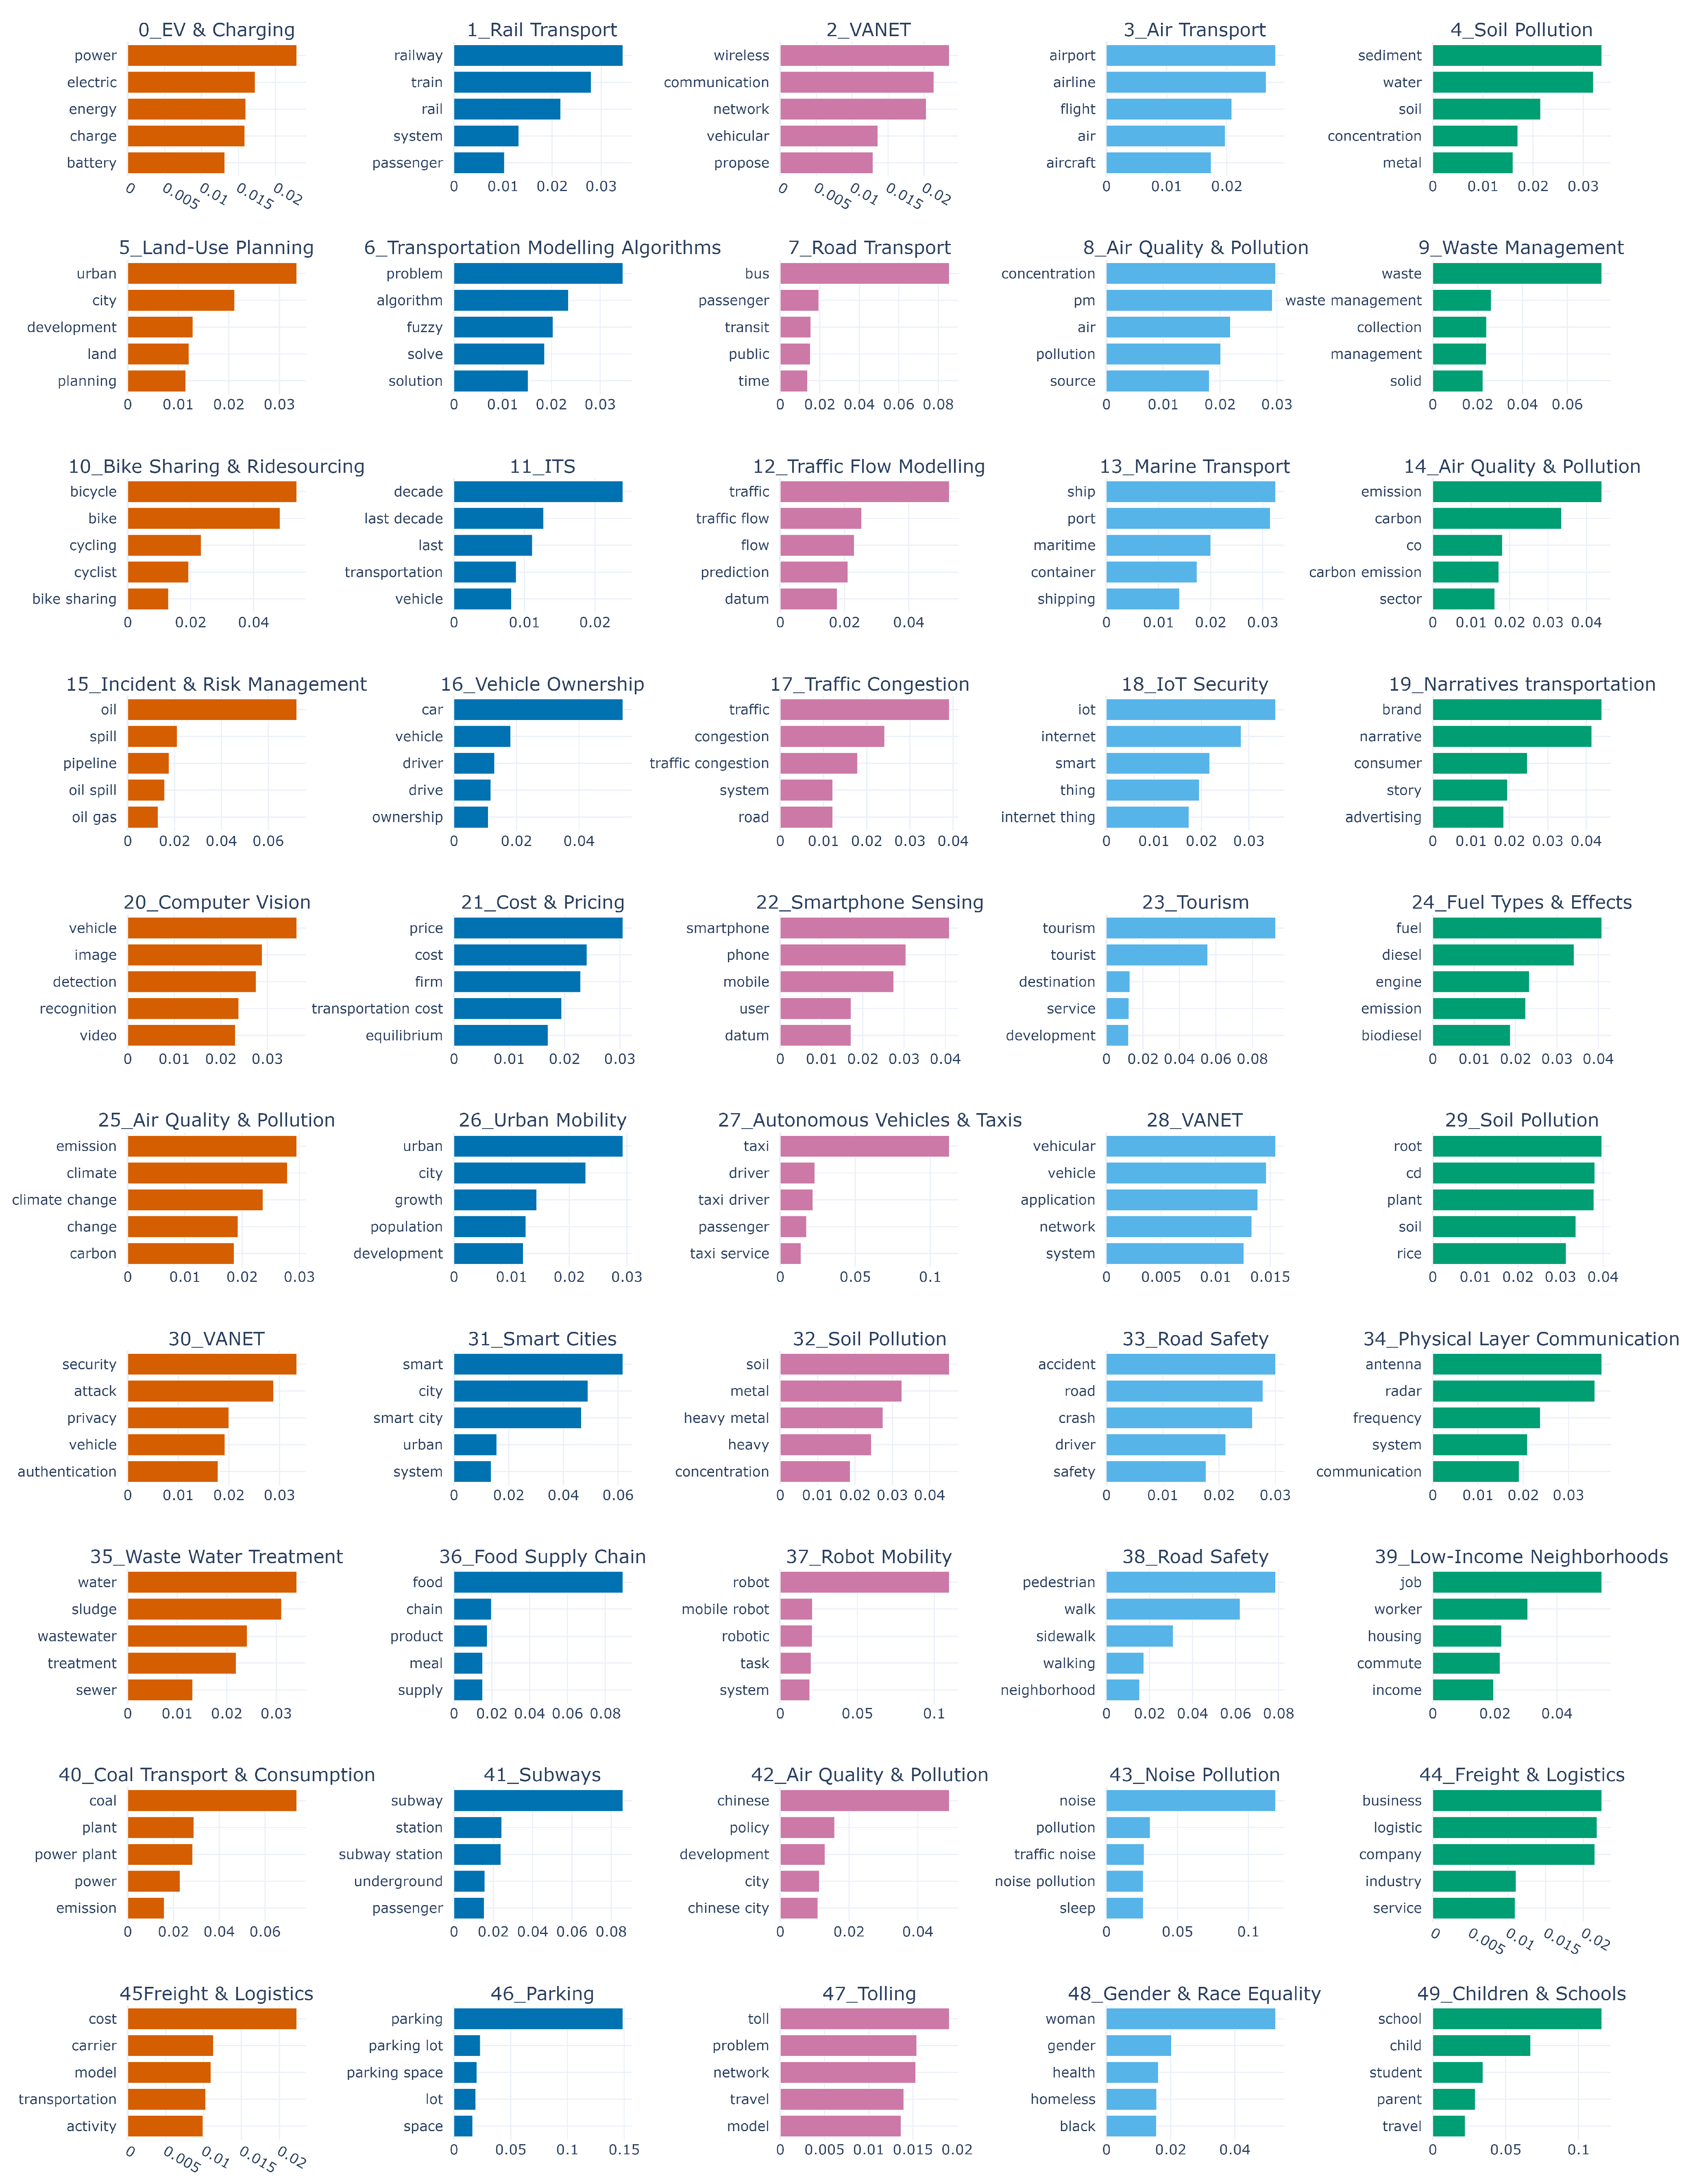
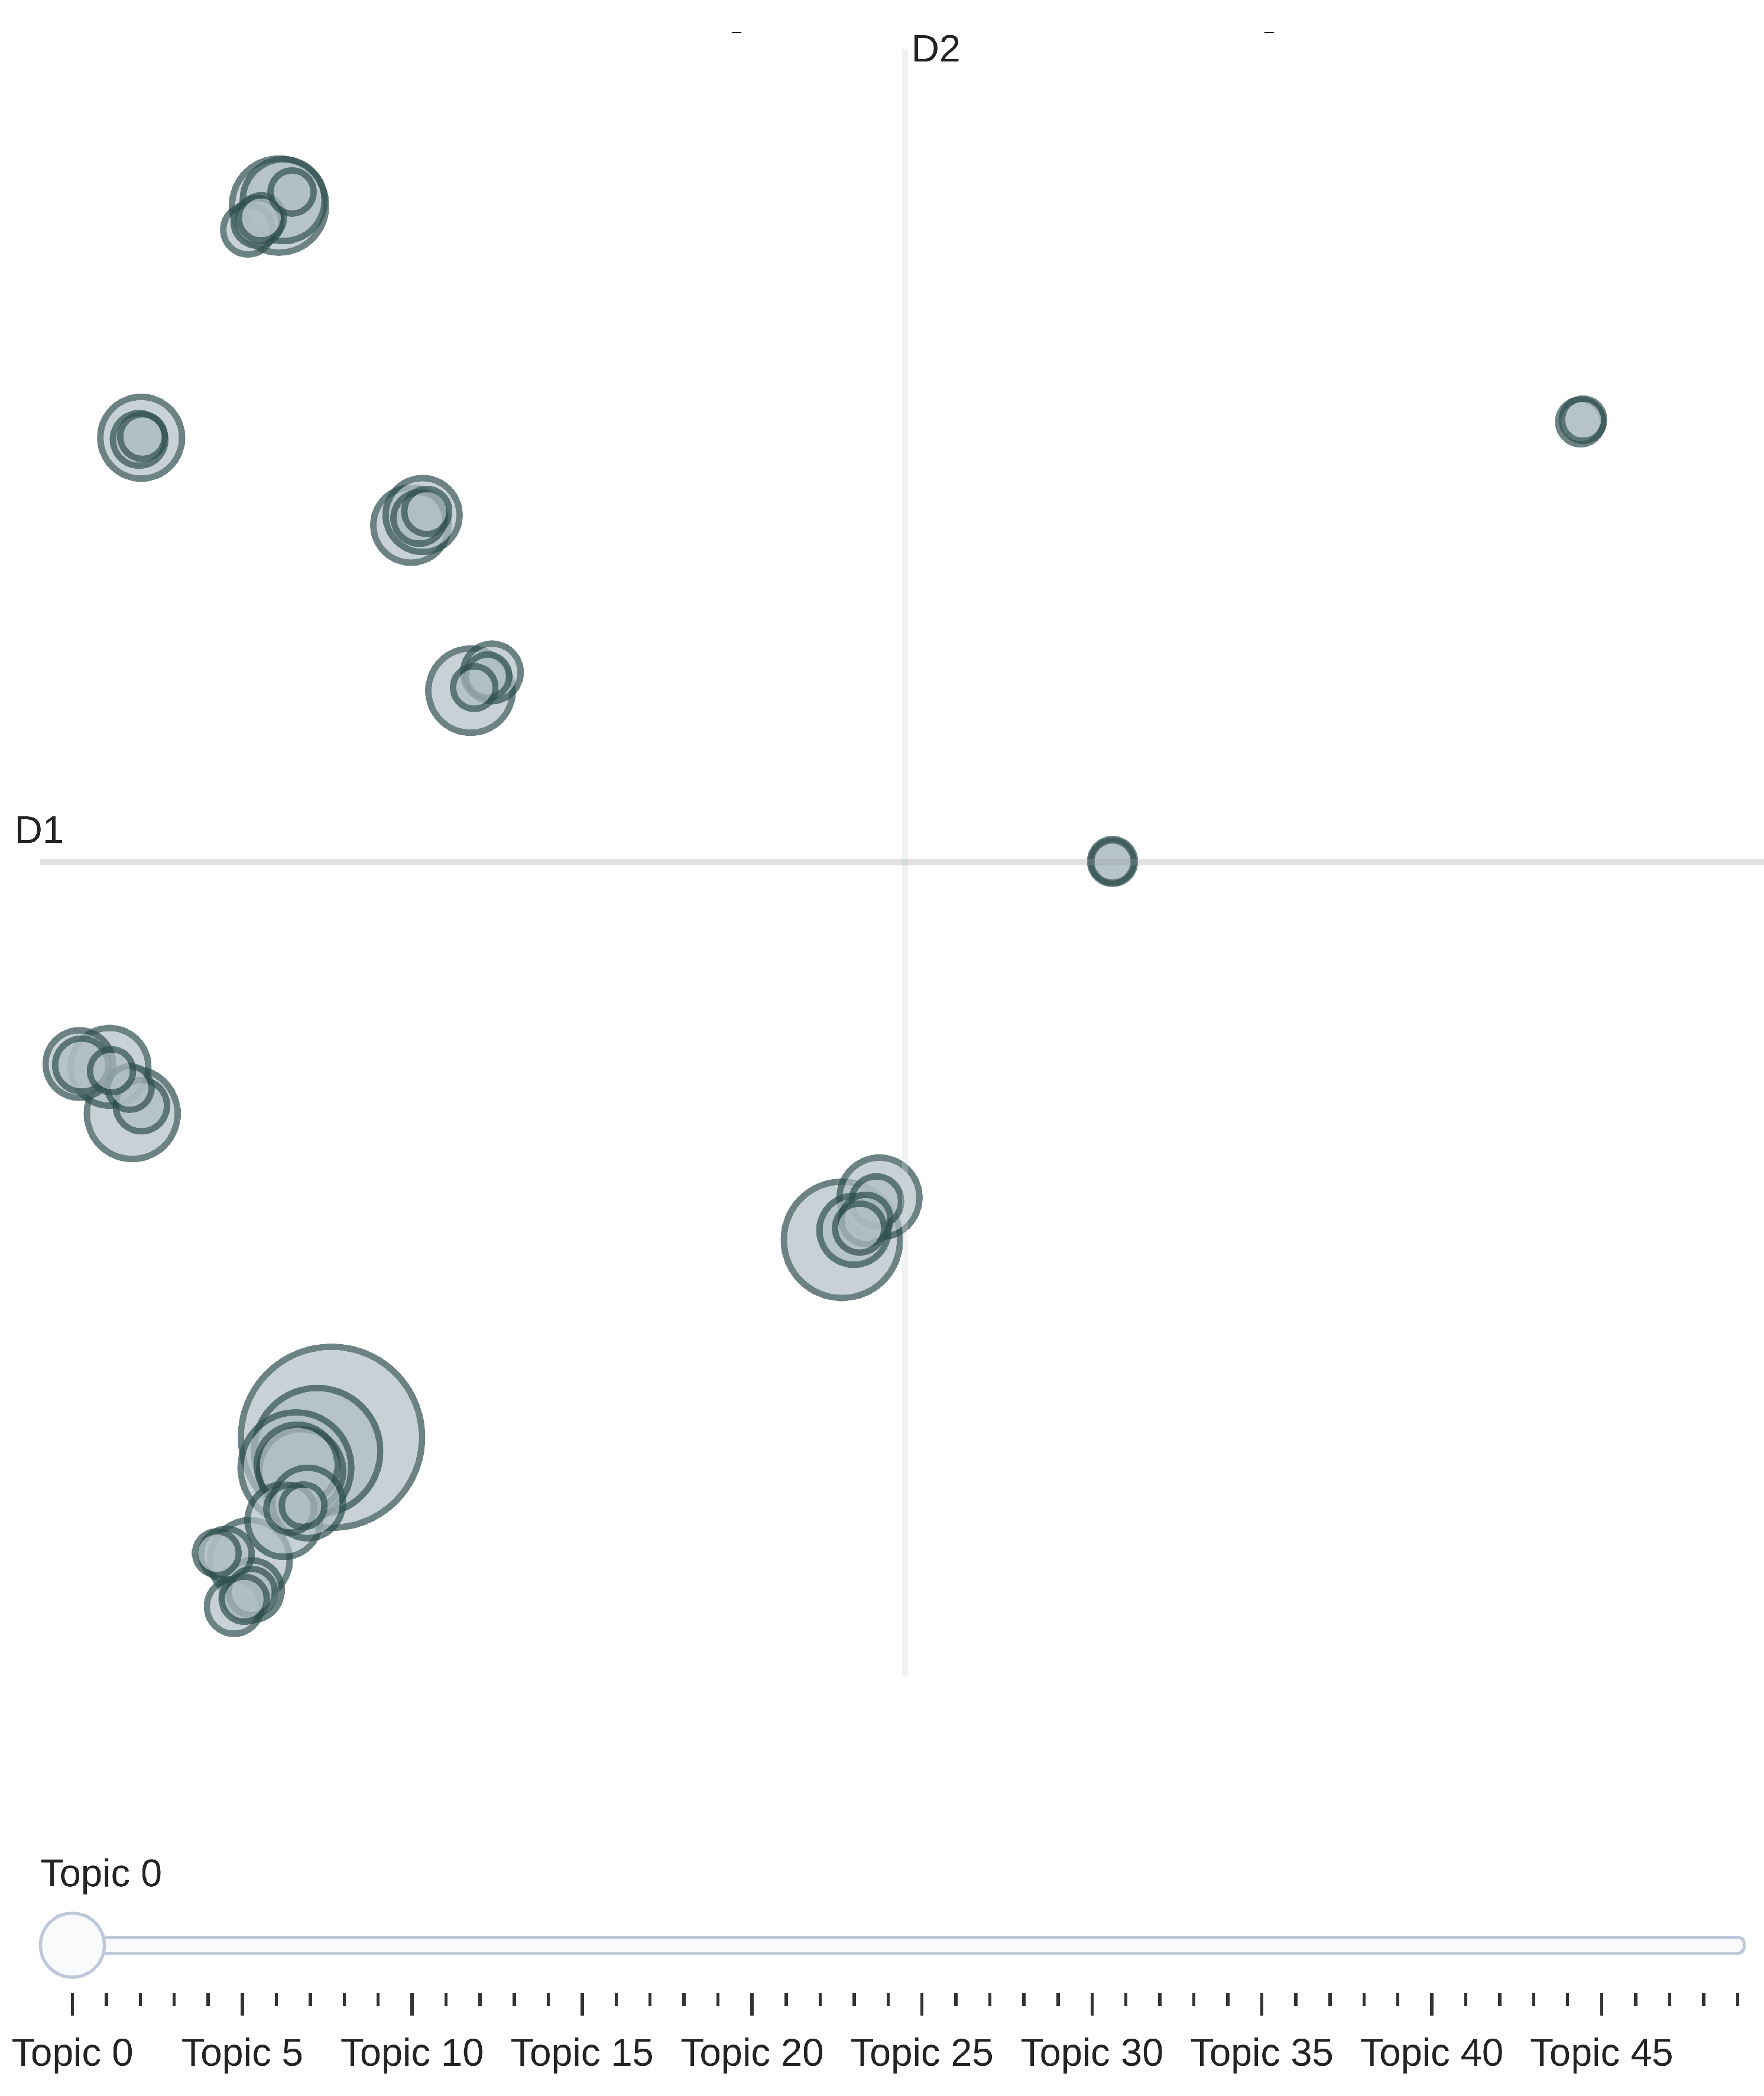
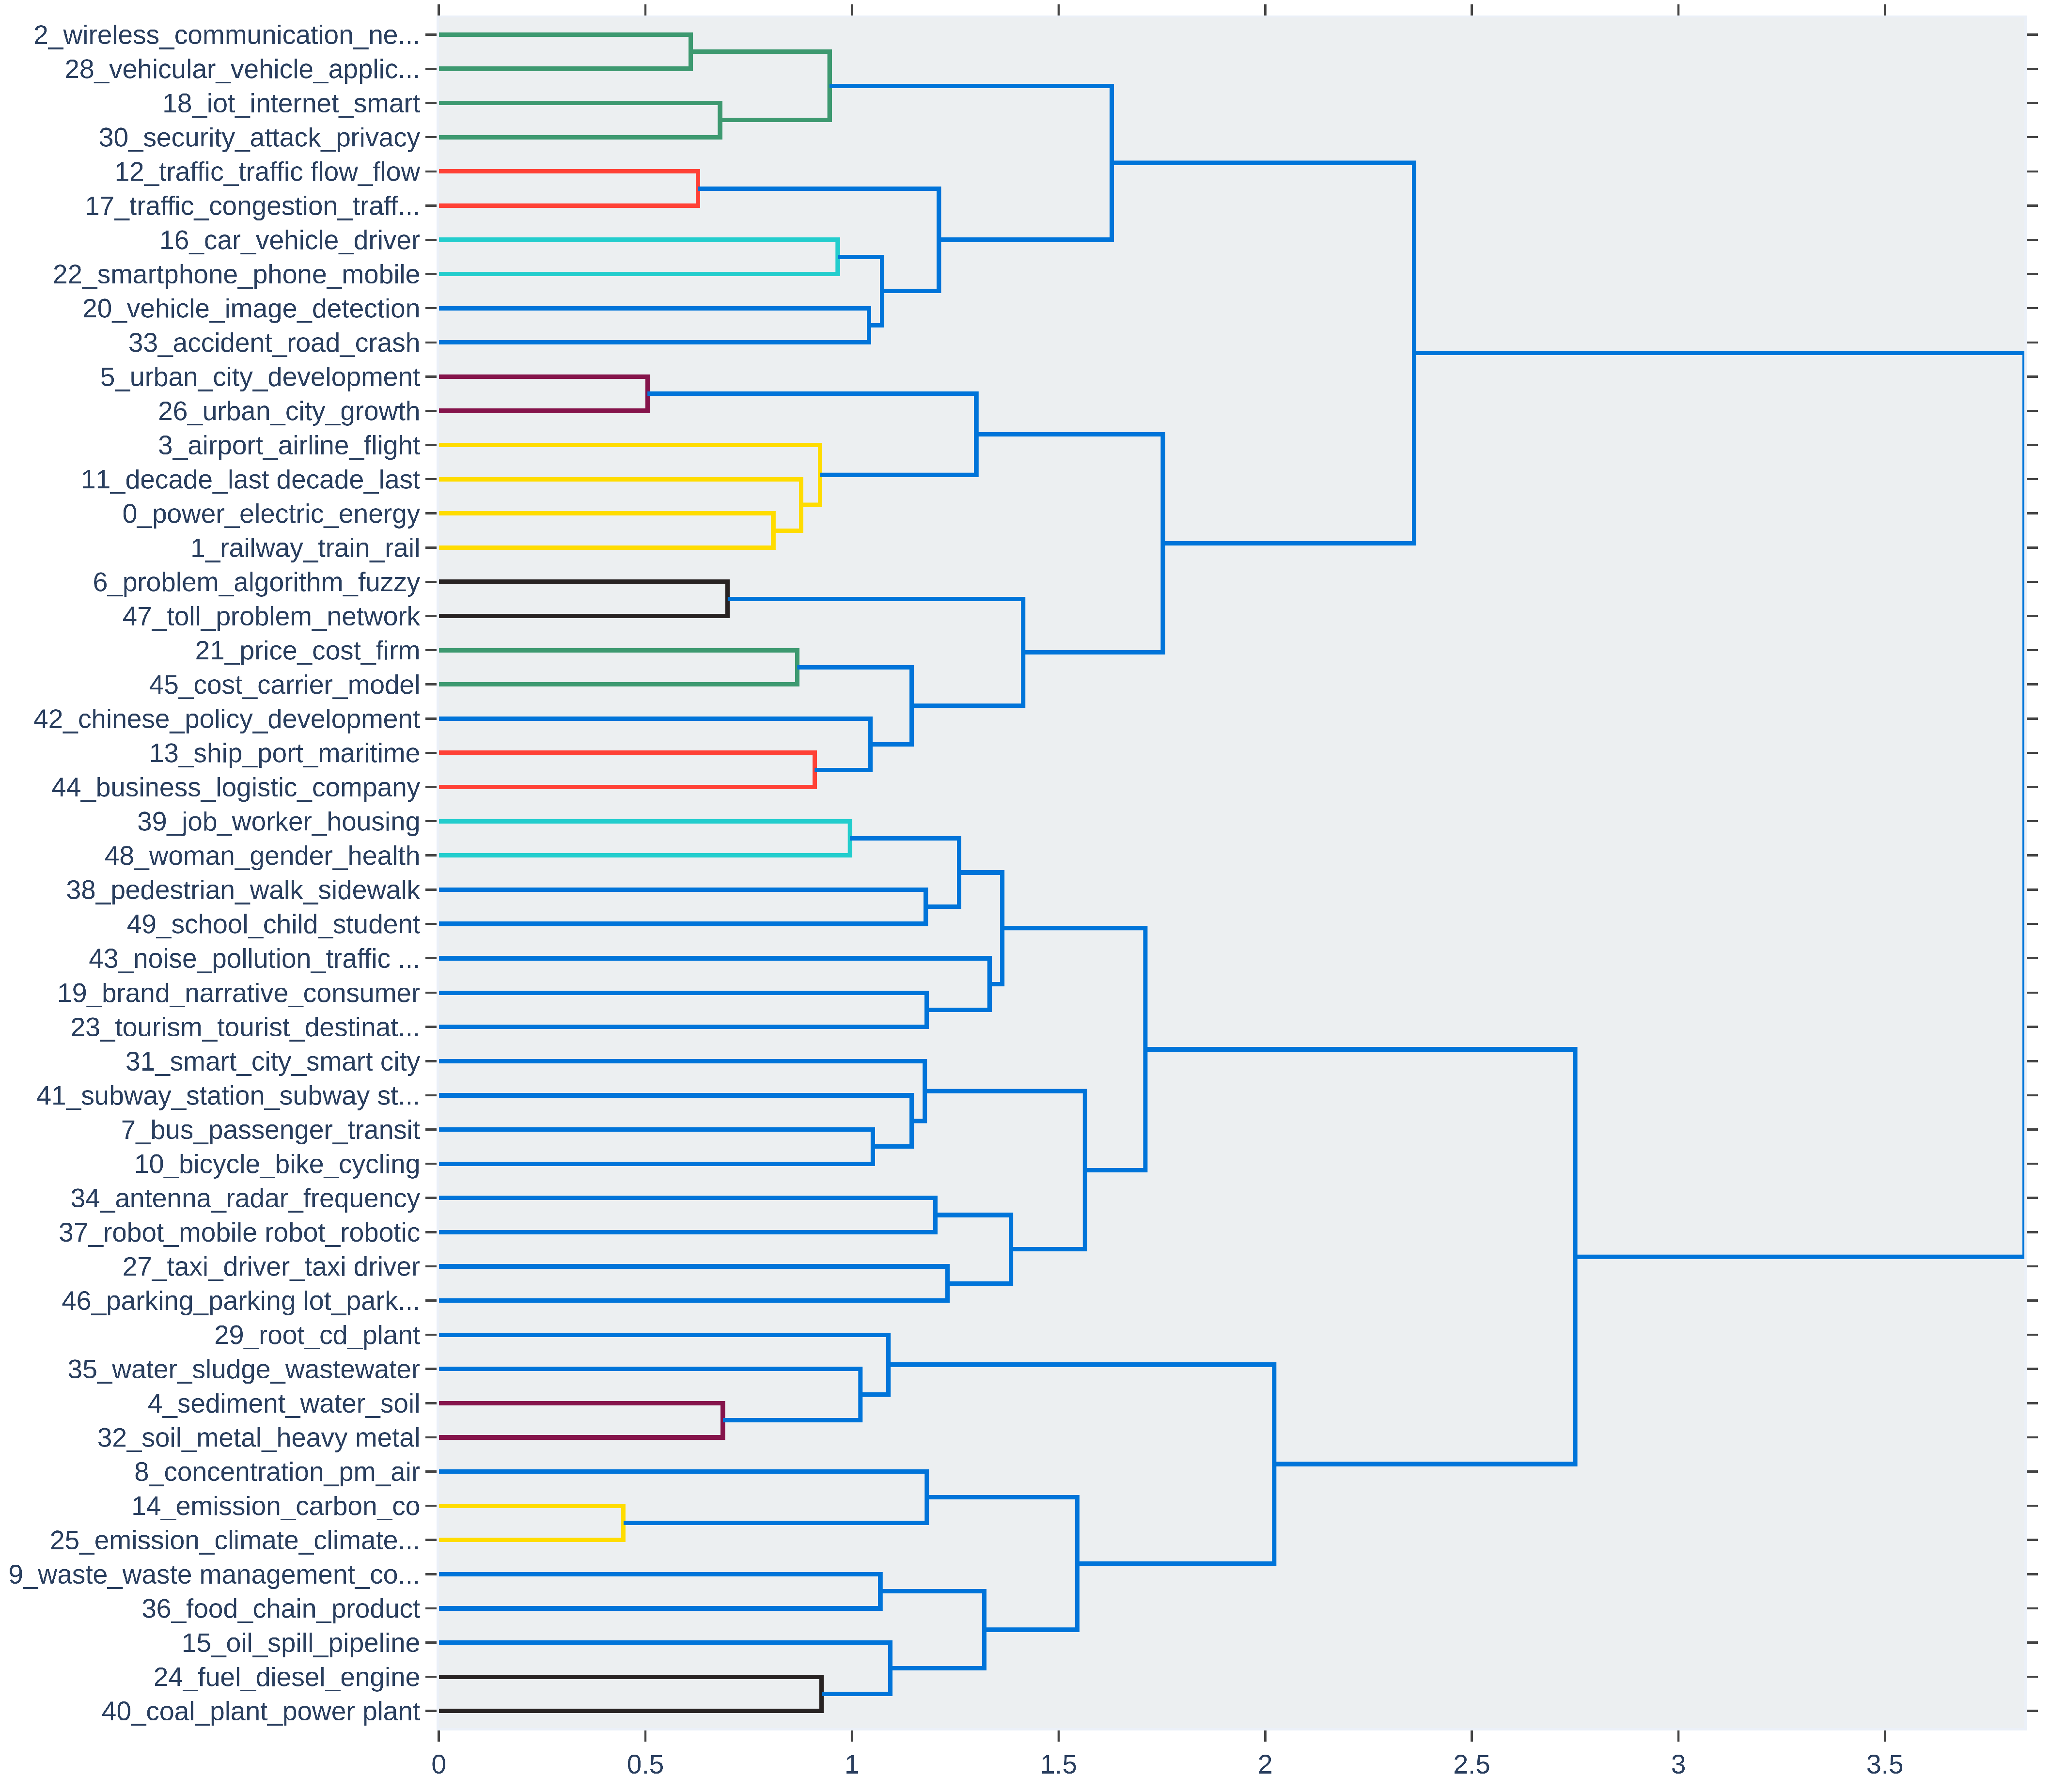
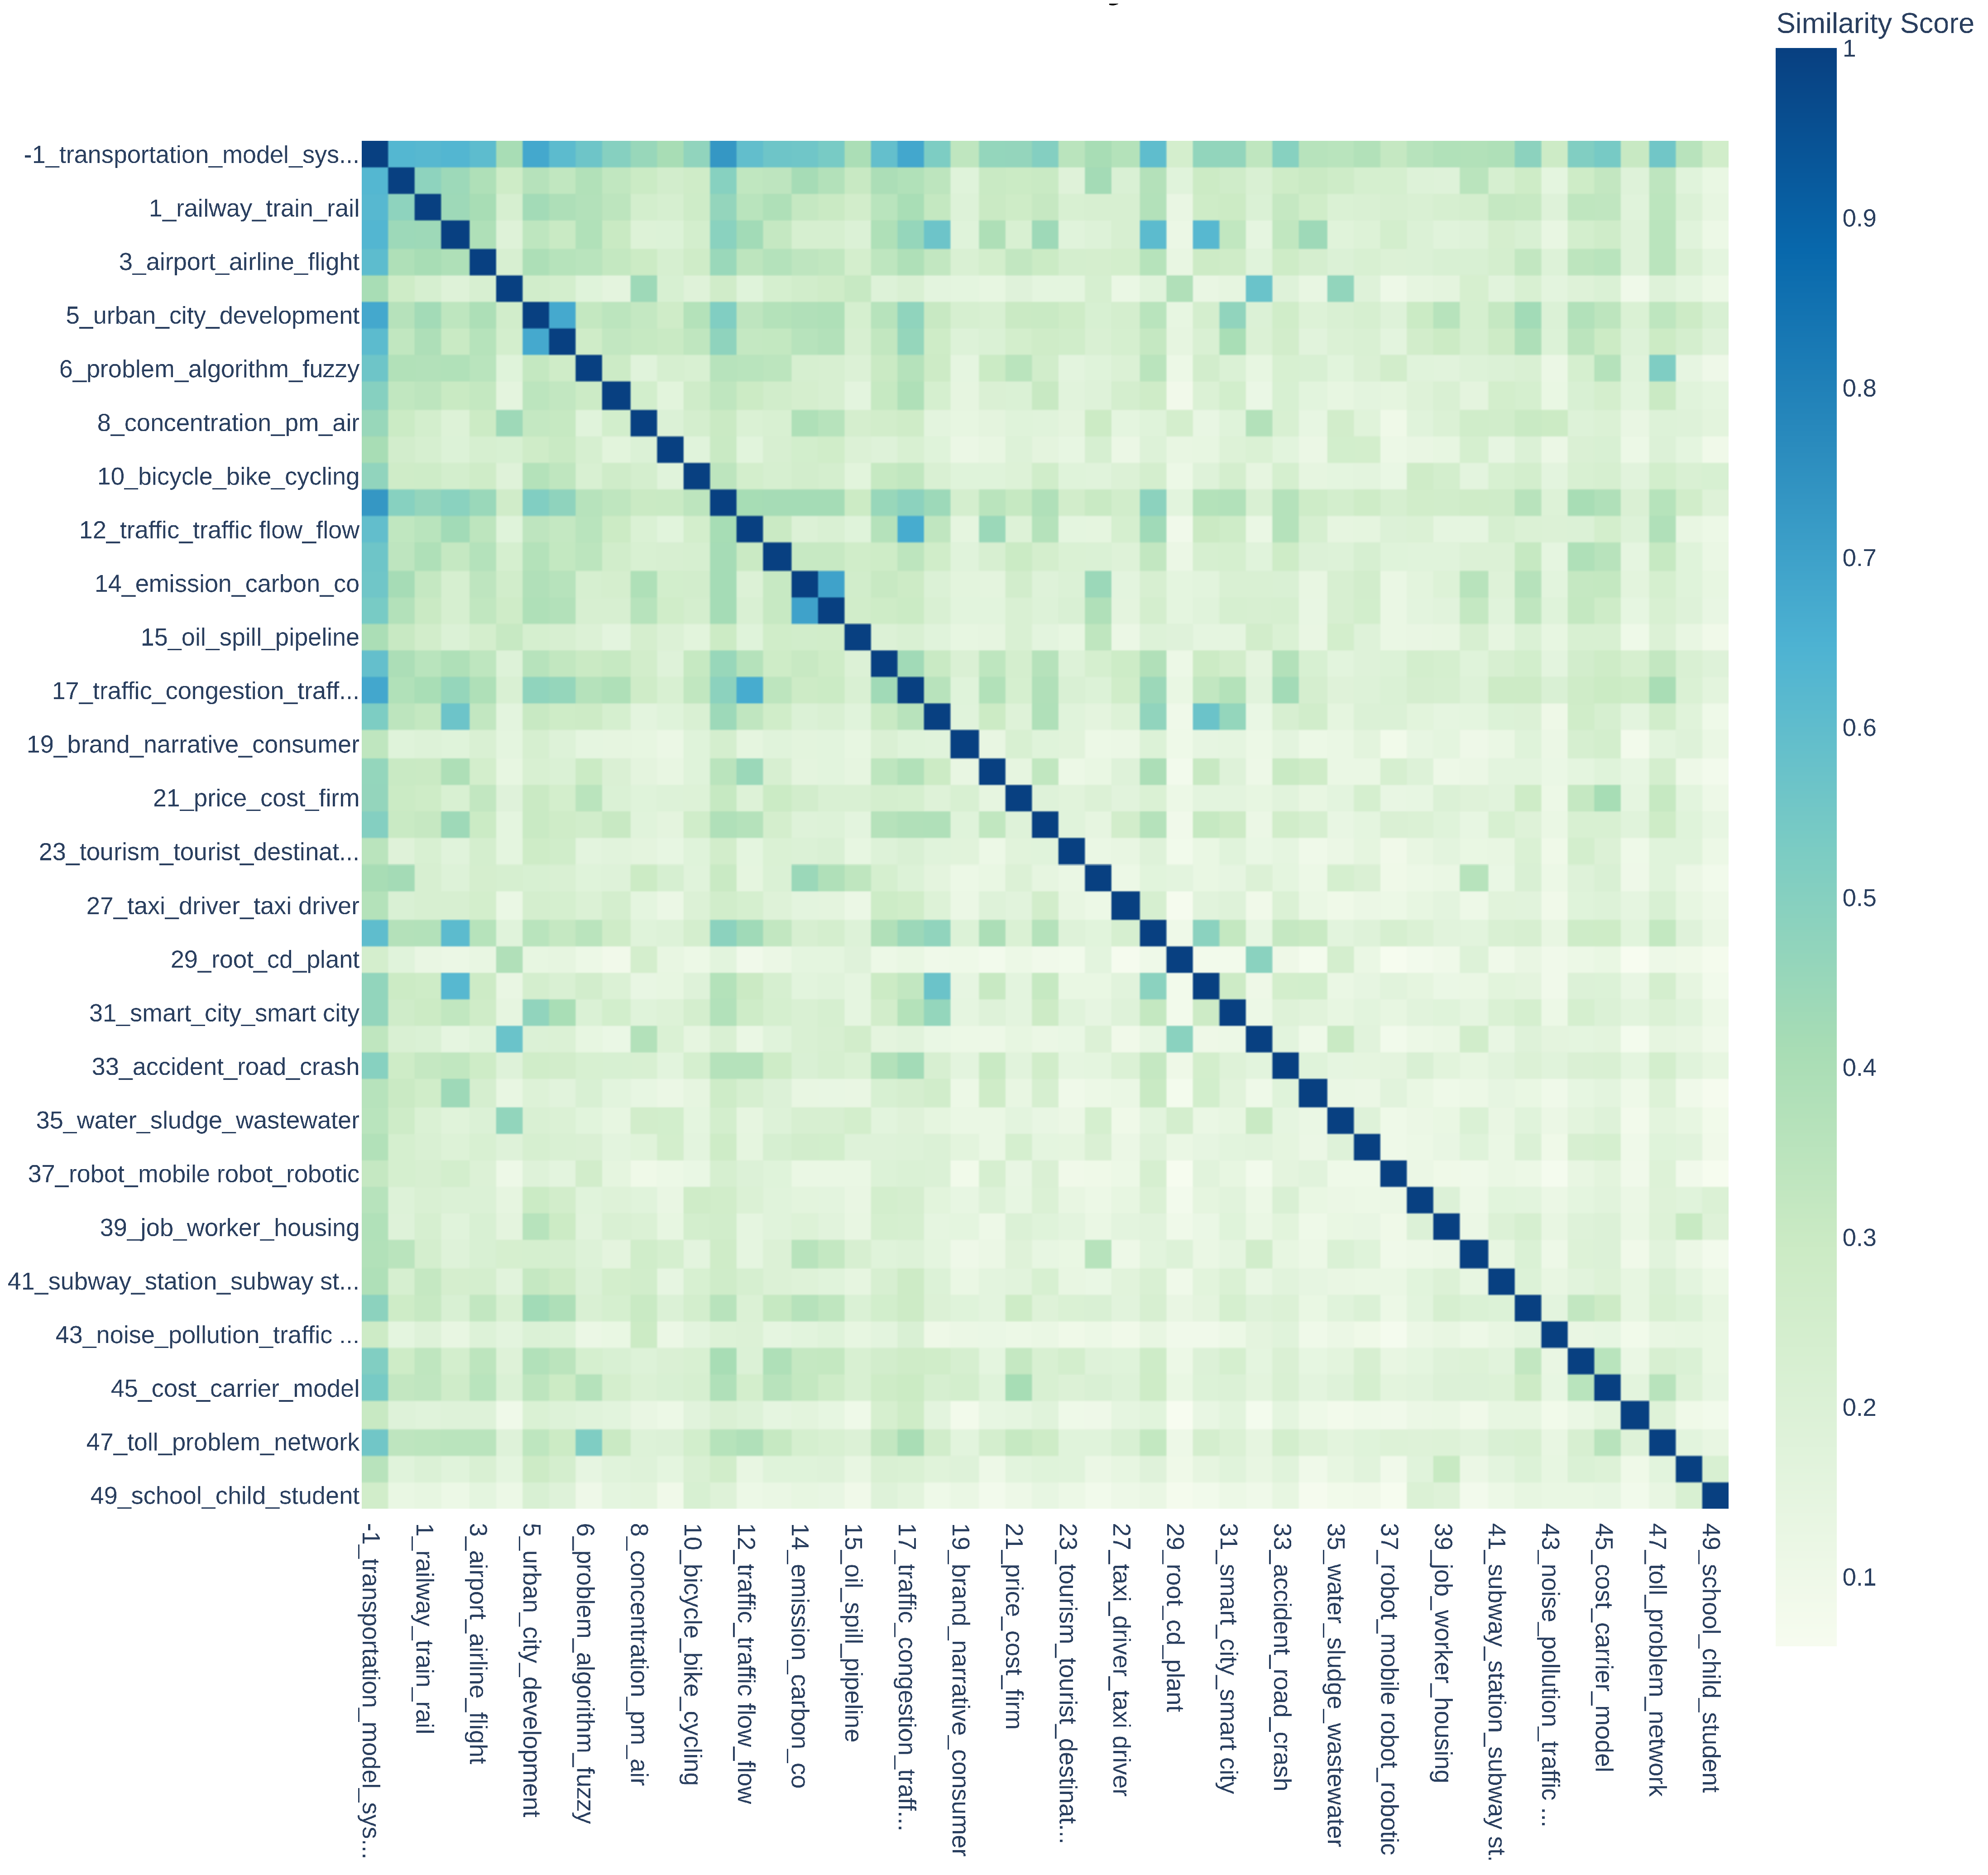
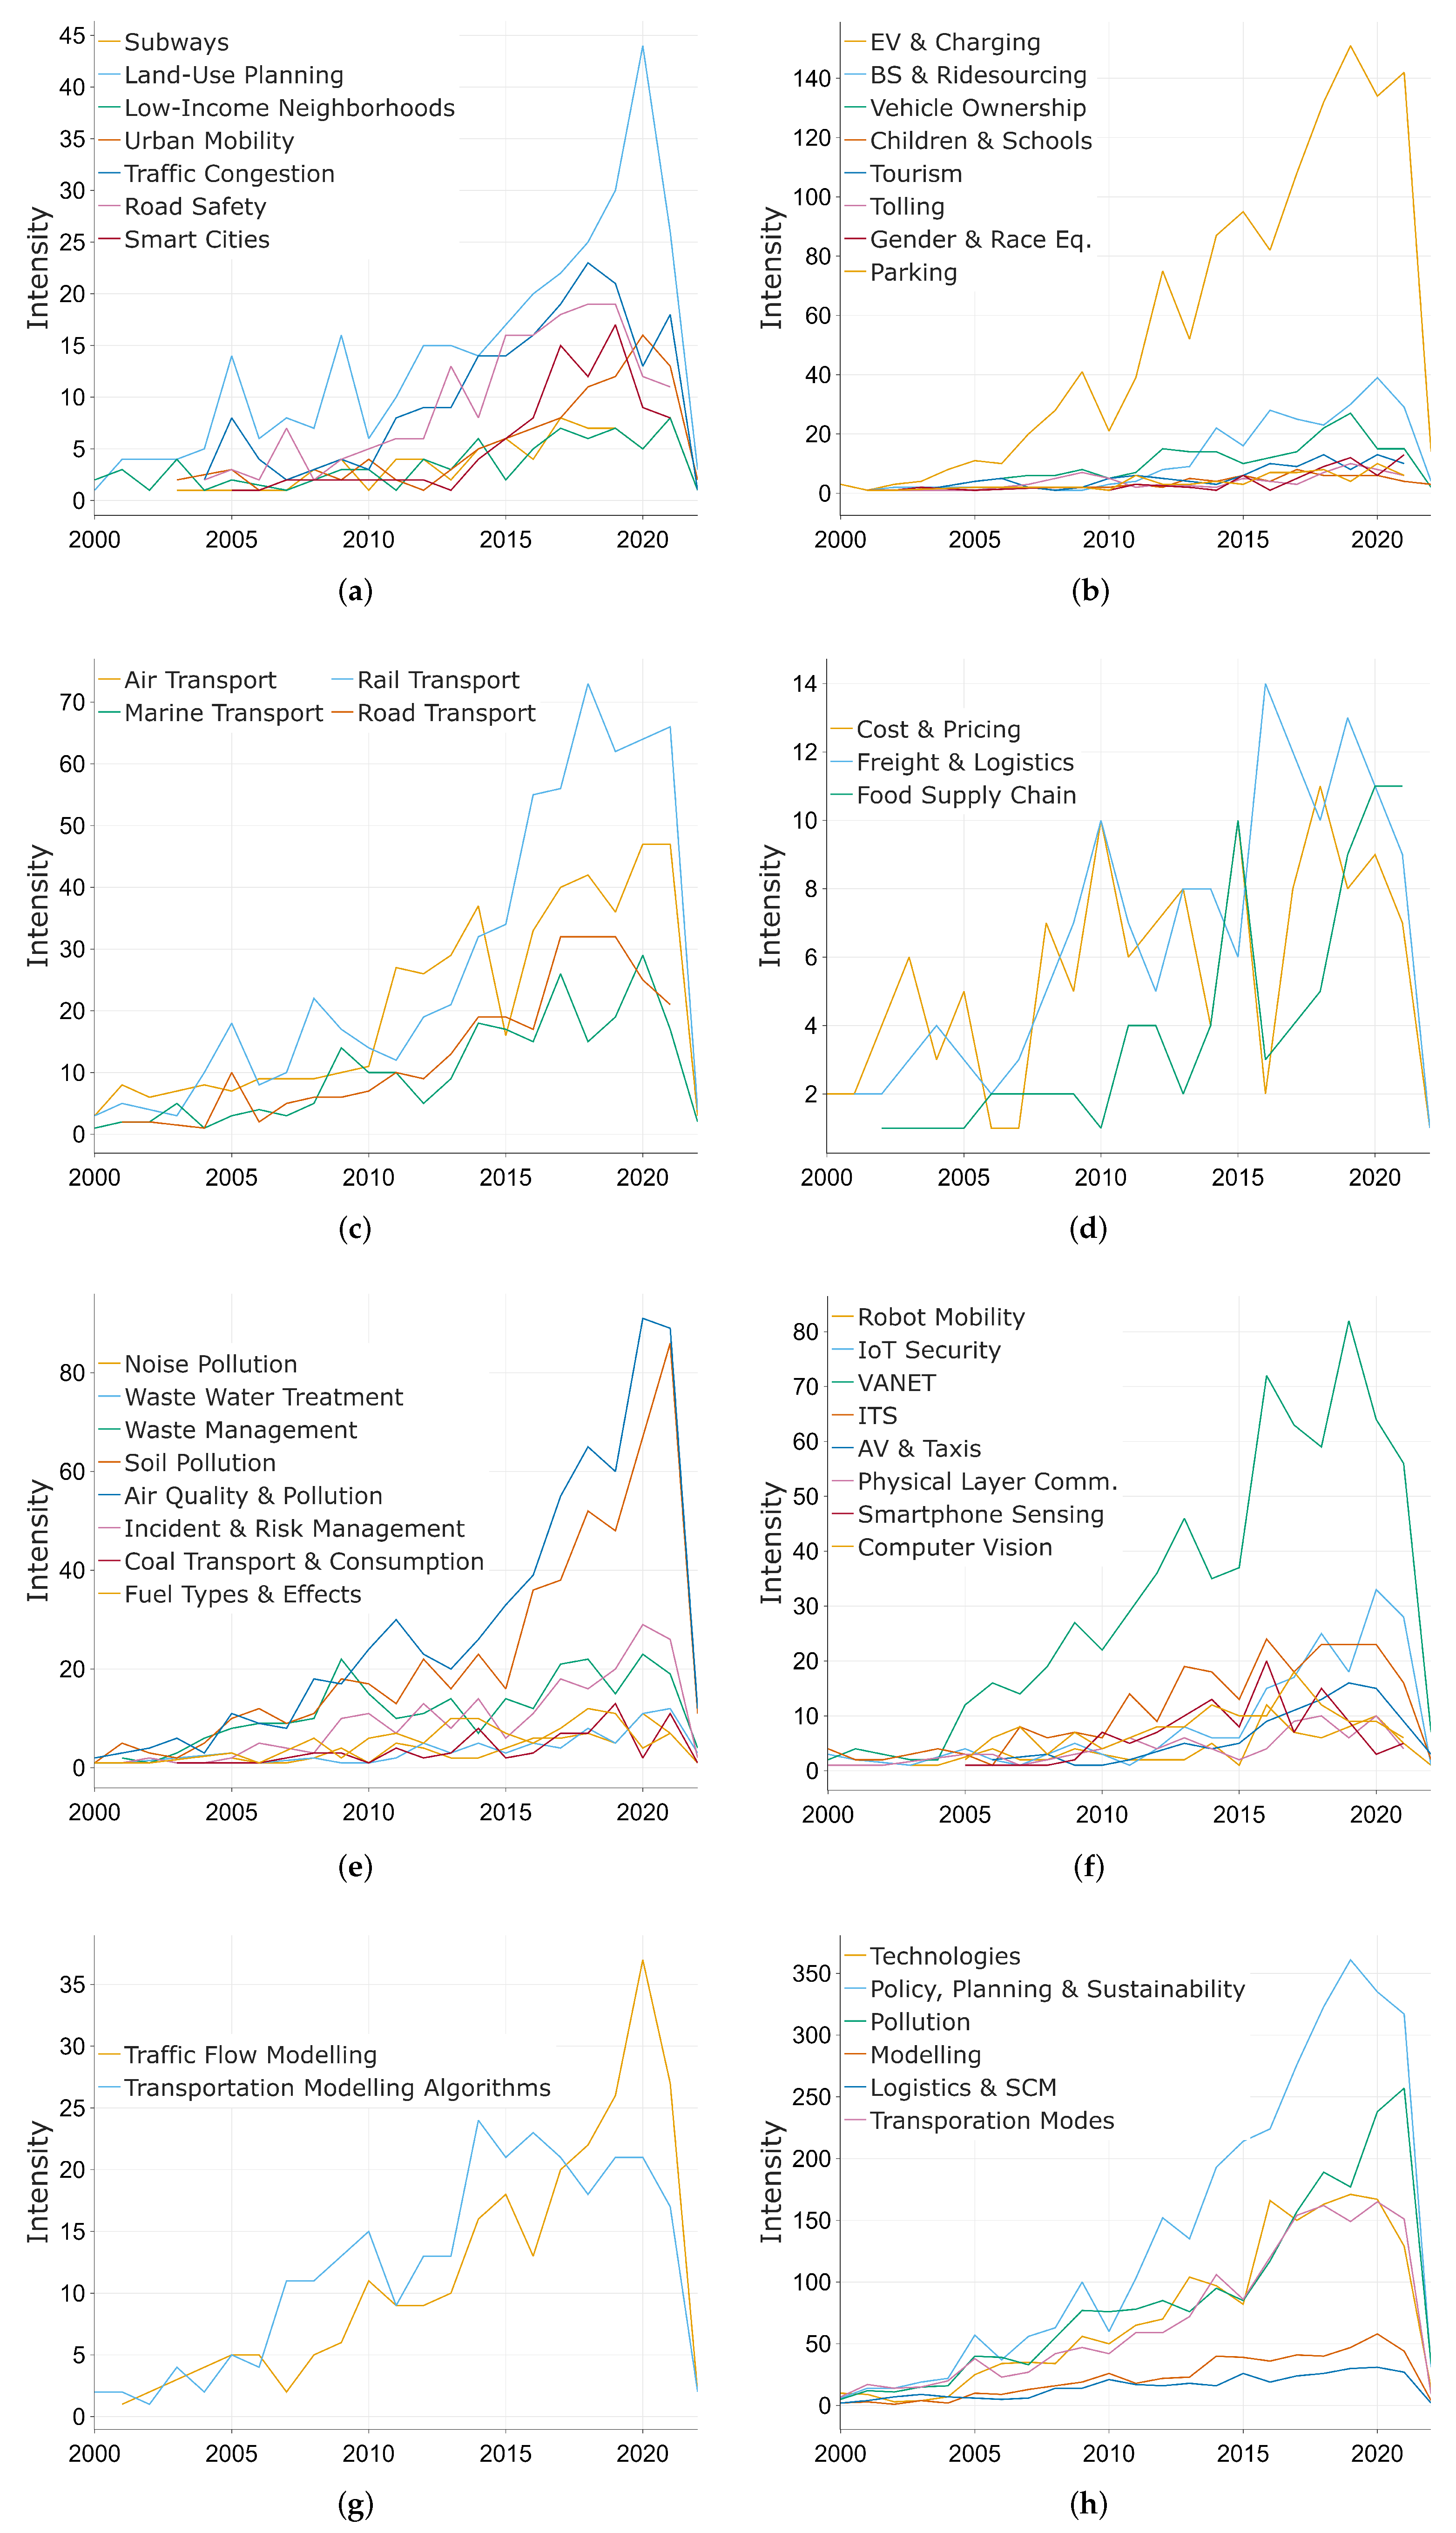
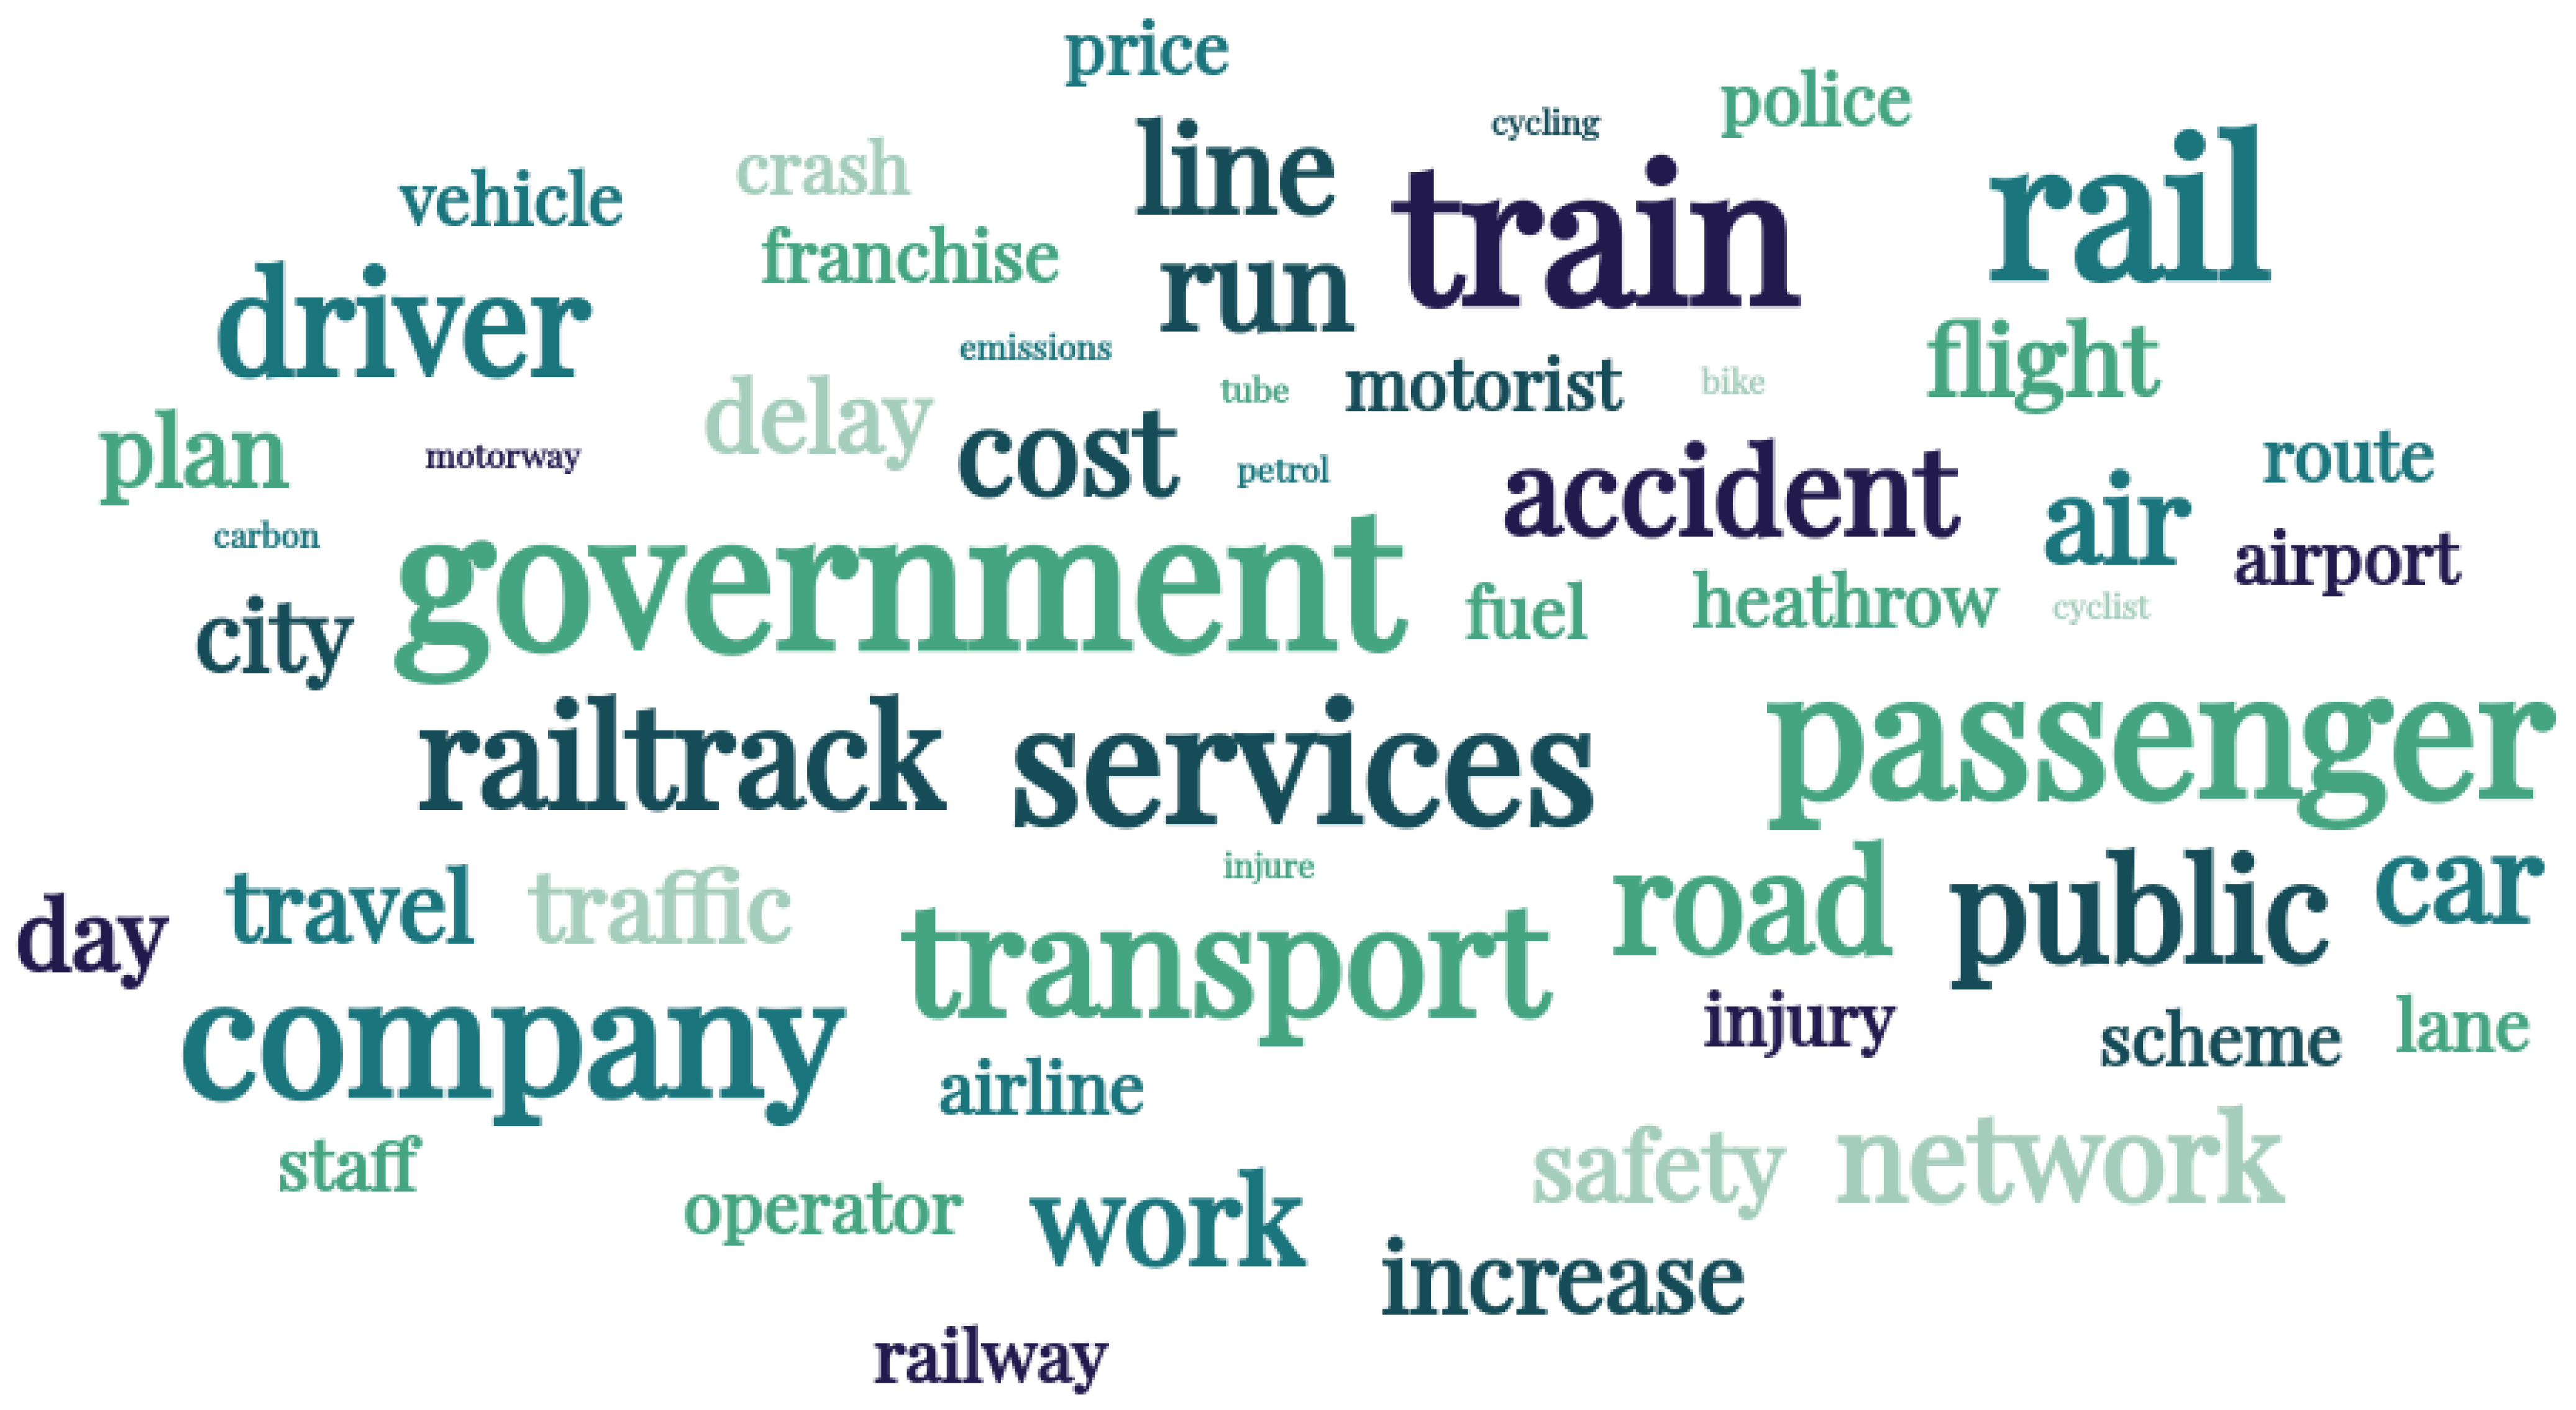
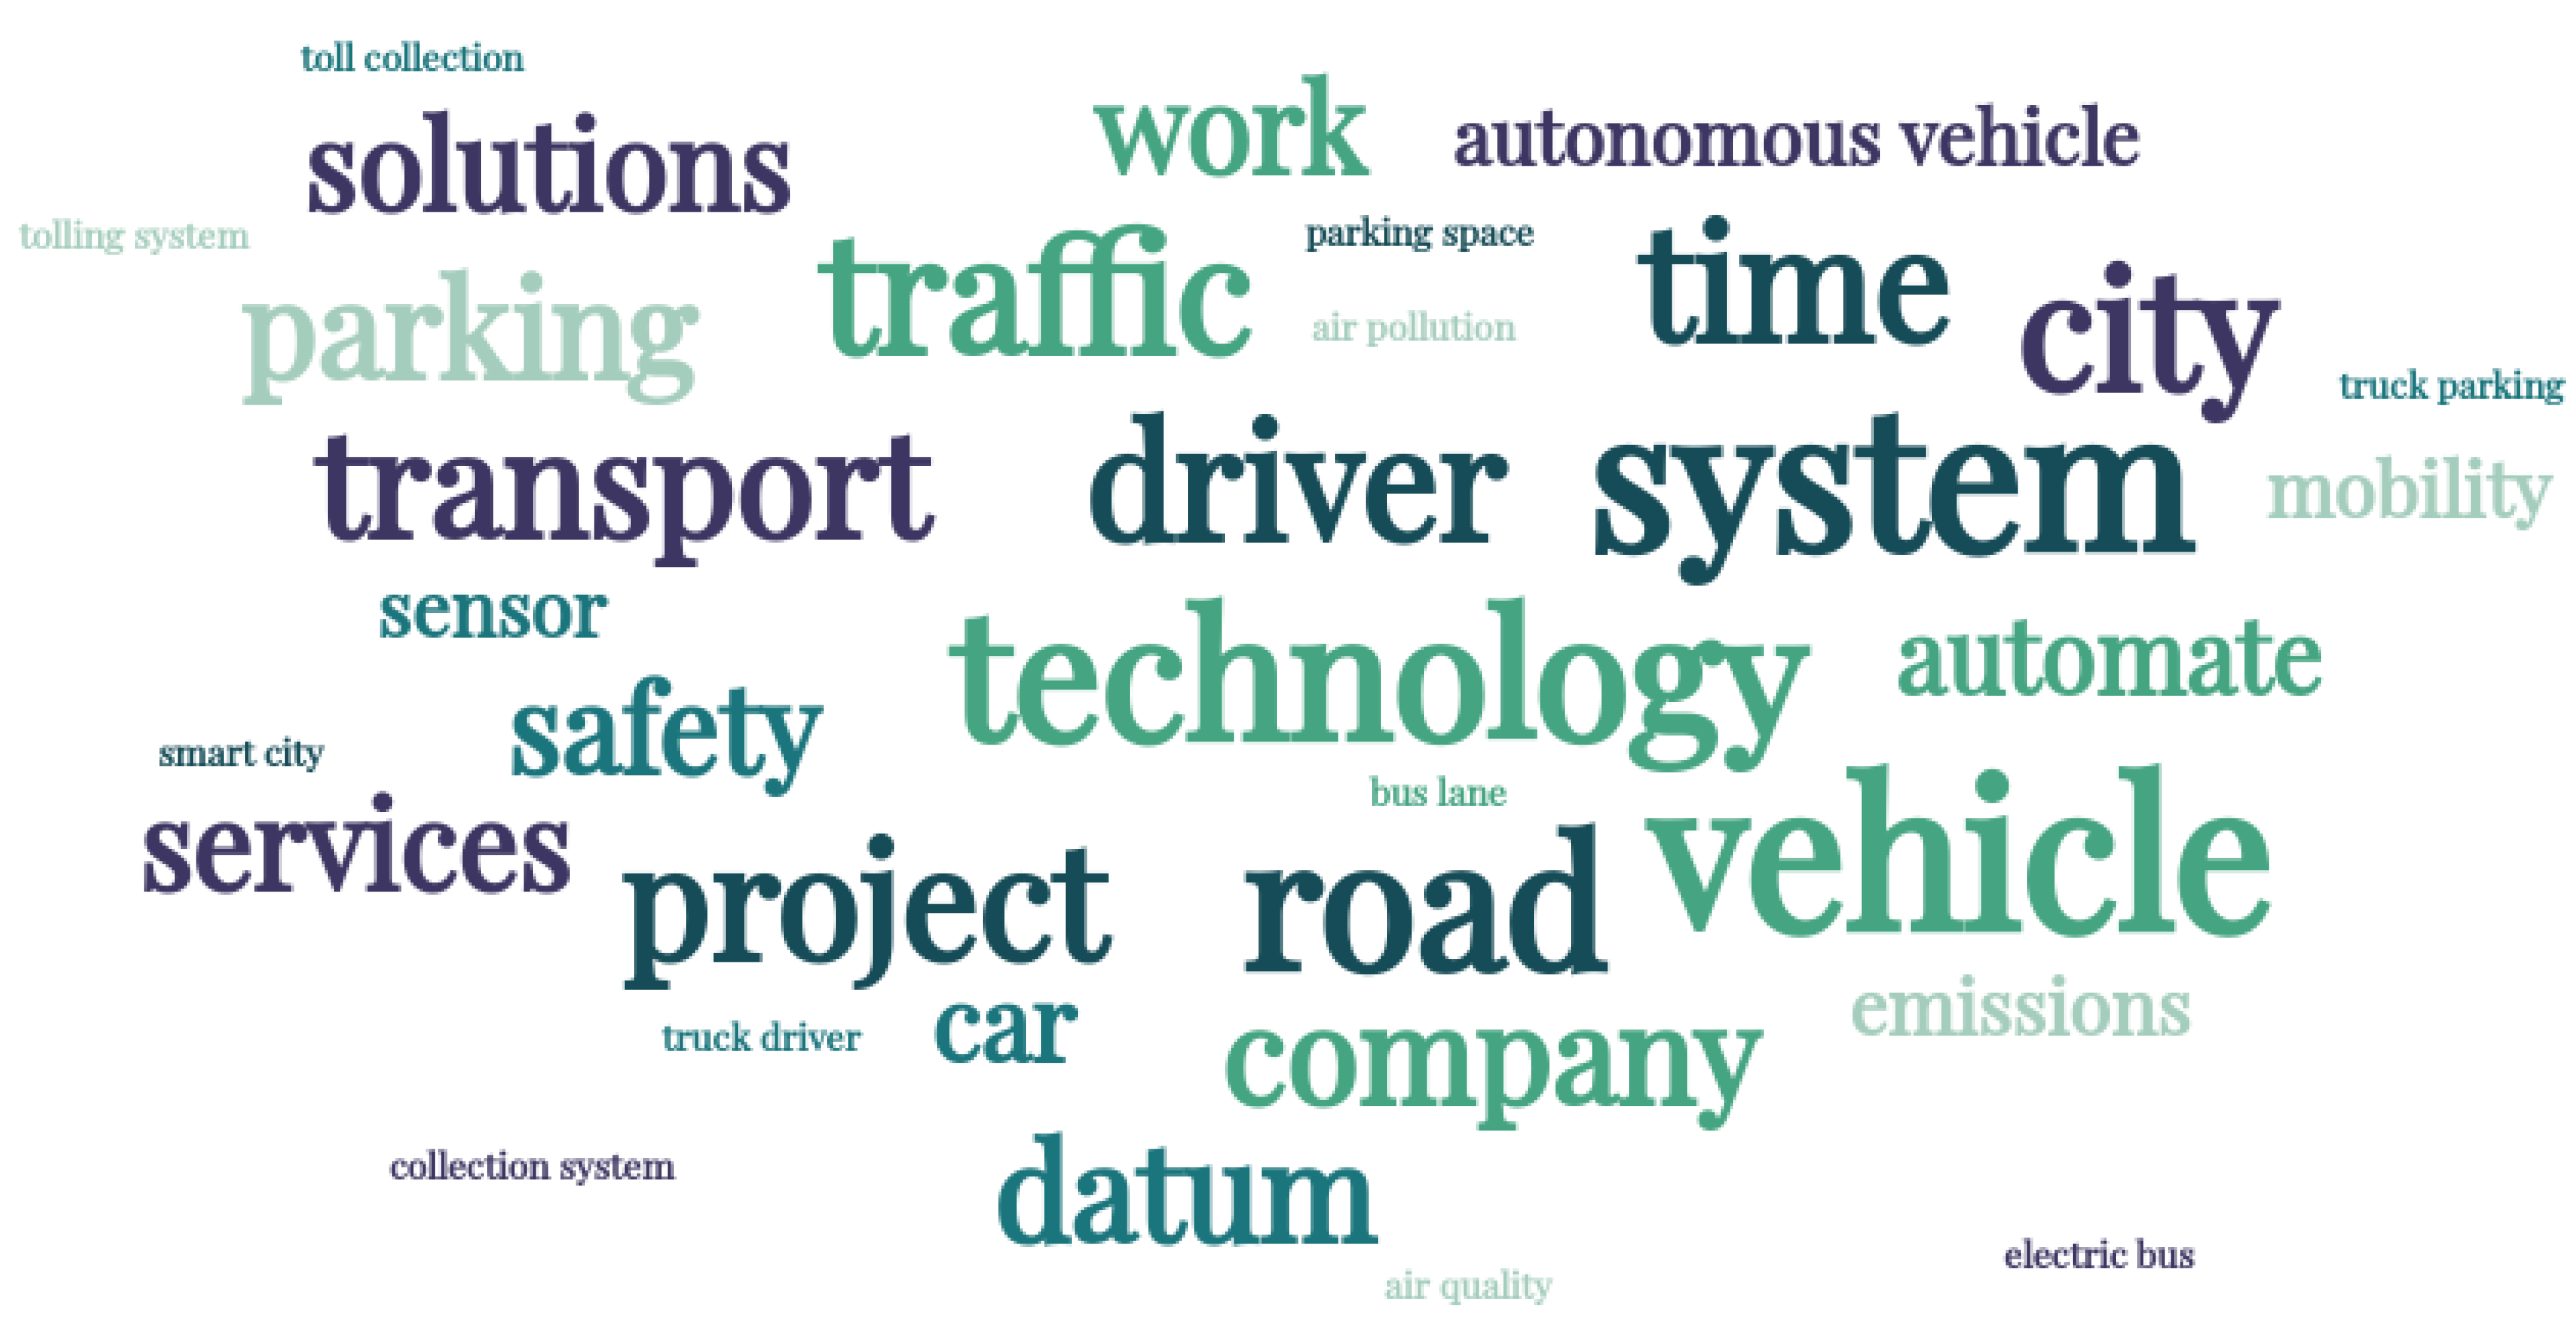
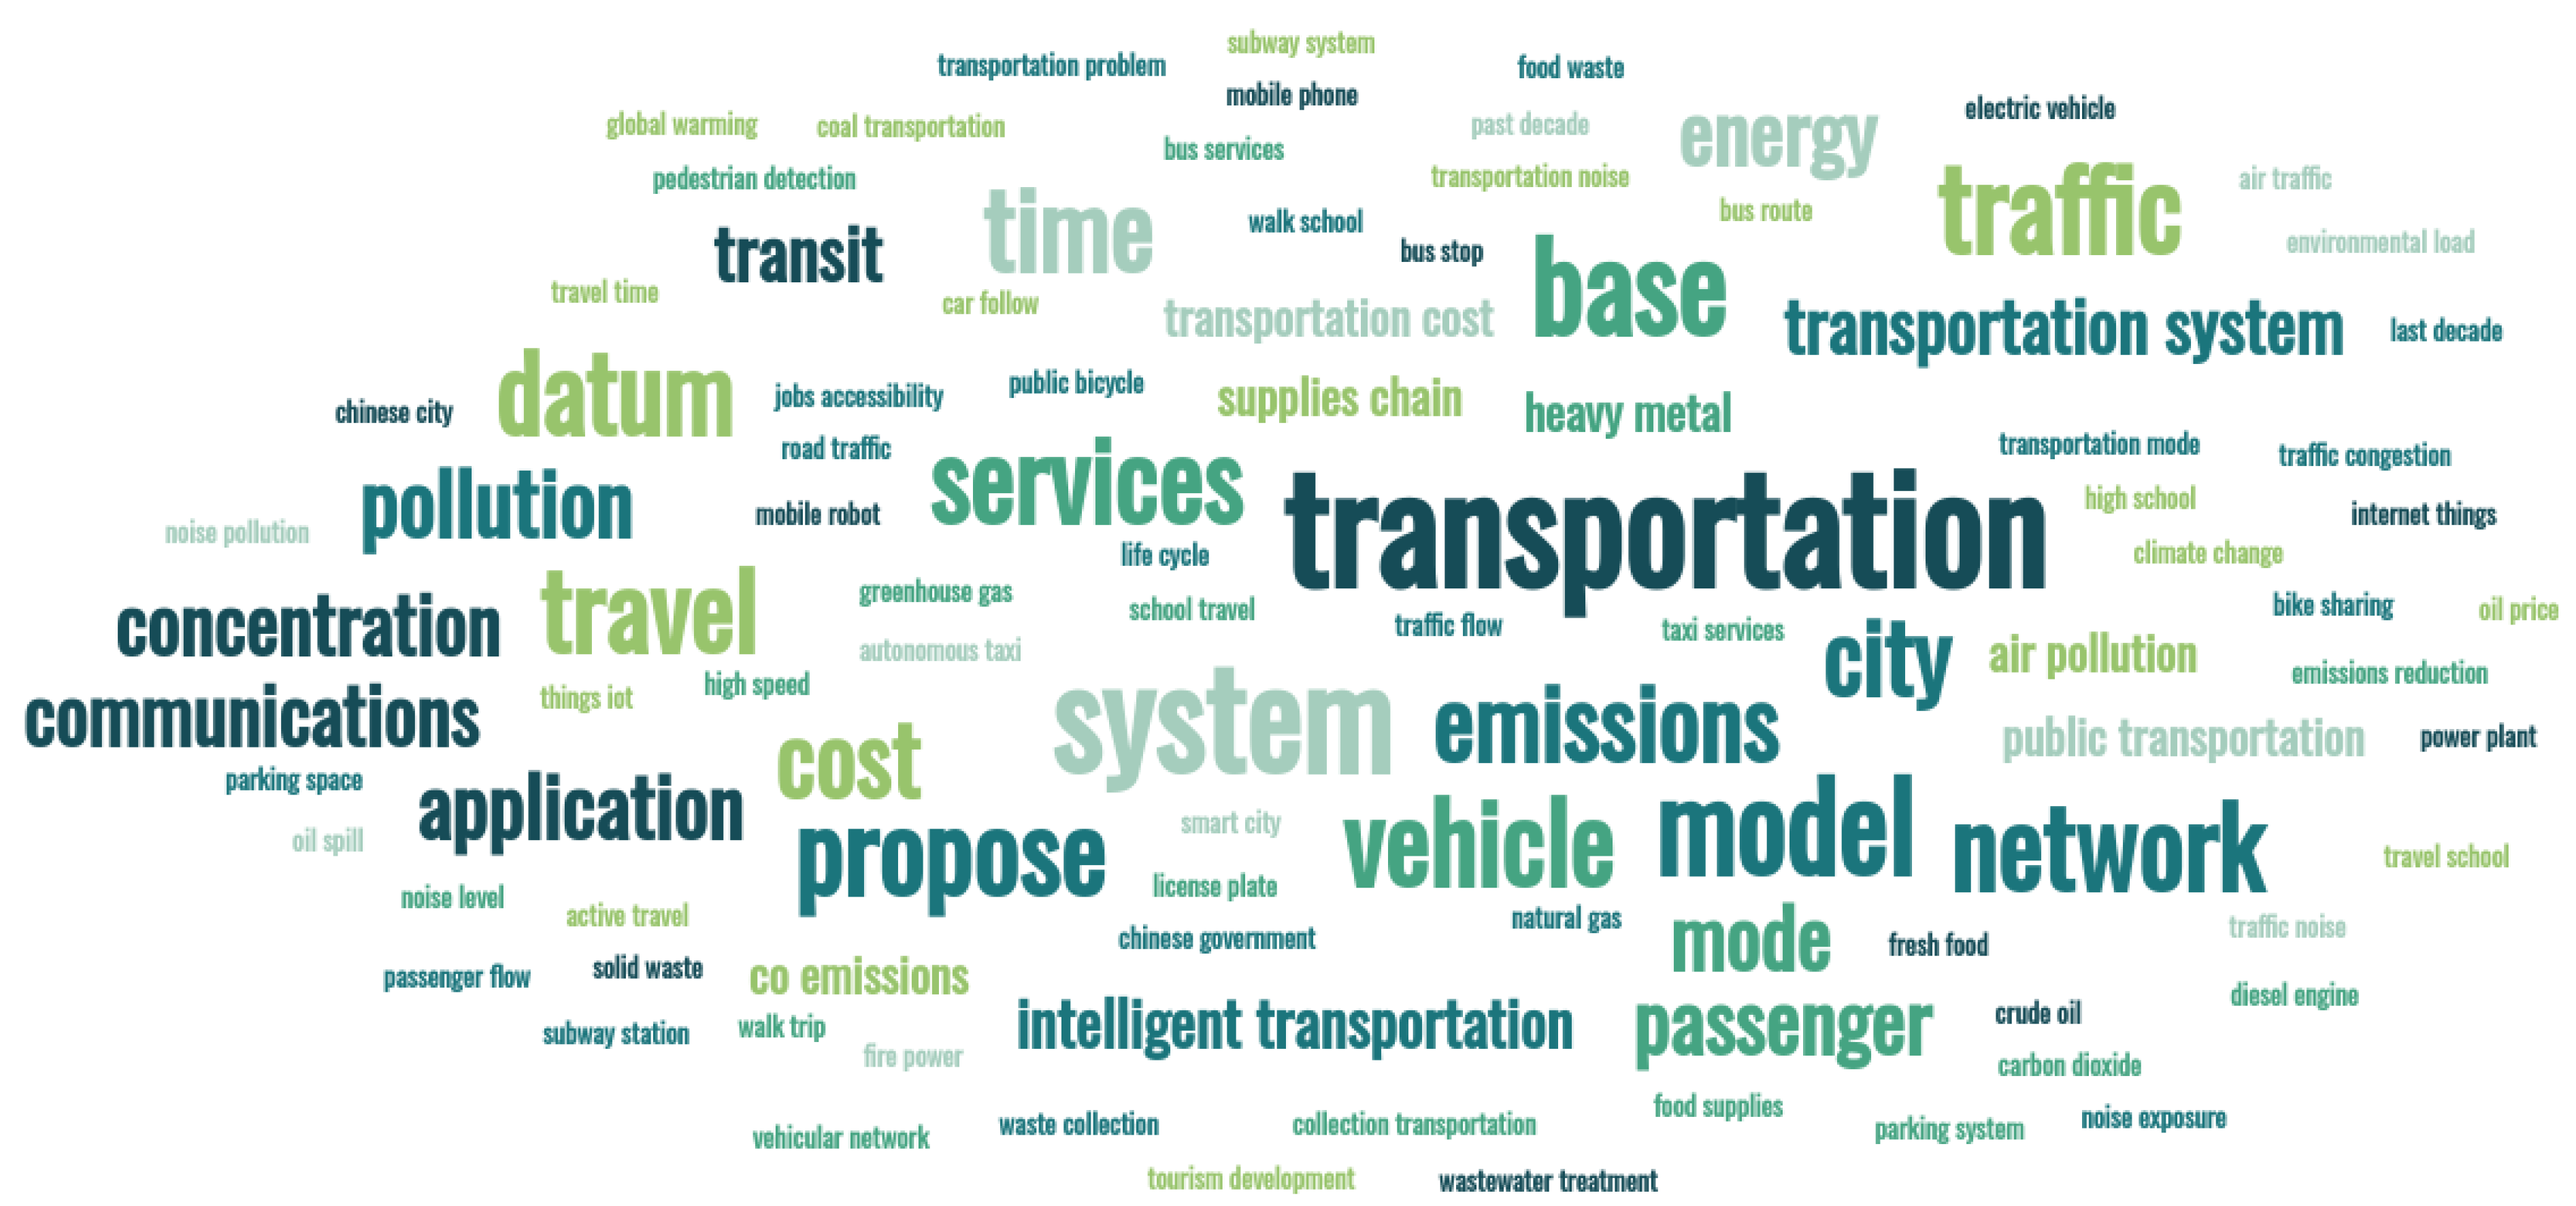
Figure 1. A multi-perspective taxonomy of transportation.
Sustainability 14 05711 g001
Figure 2. DeepJournal V1.0: the system architecture.
Sustainability 14 05711 g002
Figure 3. Histogram (The Guardian news articles).
Sustainability 14 05711 g003
Figure 4. Histogram (Traffic Technology International articles).
Sustainability 14 05711 g004
Figure 5. Histogram (Web of Science article abstracts).
Sustainability 14 05711 g005
Figure 6. A taxonomy of transportation extracted from The Guardian dataset.
Sustainability 14 05711 g006
Figure 7. Term score (The Guardian).
Sustainability 14 05711 g007
Figure 8. Newspaper article parameter with keywords c-TF–IDF score.
Sustainability 14 05711 g008
Figure 9. Intertopic distance map (The Guardian).
Sustainability 14 05711 g009
Figure 10. Hierarchical clustering (The Guardian).
Sustainability 14 05711 g010
Figure 11. Similarity matrix (The Guardian).
Sustainability 14 05711 g011
Figure 12. Temporal progression of parameters (The Guardian): (a) road transport; (b) rail transport; (c) air transport; (d) crash and safety; (e) disruptions and causes; (f) employment rights; disputes; and strikes.
Sustainability 14 05711 g012
Figure 13. Aggregated macro-parameters (The Guardian).
Sustainability 14 05711 g013
Figure 14. Taxonomy extracted from Traffic Technology International Magazine Dataset.
Sustainability 14 05711 g014
Figure 15. Term score (Traffic Technology International magazine).
Sustainability 14 05711 g015
Figure 16. Magazine article parameter with keywords c-TF–IDF Score.
Sustainability 14 05711 g016
Figure 17. Intertopic distance map (Traffic Technology International Magazine).
Sustainability 14 05711 g017
Figure 18. Hierarchical clustering (Traffic Technology International Magazine).
Sustainability 14 05711 g018
Figure 19. Similarity matrix (Traffic Technology International magazine).
Sustainability 14 05711 g019
Figure 20. Temporal progression of parameters (Traffic Technology International Magazine): (a) industry, innovation, and leadership; (b) autonomous and connected vehicles; (c) infrastructure; (d) mobility services; (e) sustainability; (f) macro-parameters.
Sustainability 14 05711 g020
Figure 21. Taxonomy extracted from Web of Science dataset.
Sustainability 14 05711 g021
Figure 22. Term score (Web of Science).
Sustainability 14 05711 g022
Figure 23. Academic article parameter with keywords c-TF–IDF score.
Sustainability 14 05711 g023
Figure 24. Intertopic distance map (Web of Science).
Sustainability 14 05711 g024
Figure 25. Hierarchical clustering (Web of Science).
Sustainability 14 05711 g025
Figure 26. Similarity matrix (Web of Science).
Sustainability 14 05711 g026
Figure 27. Temporal progression of parameters (Web of Science): (a) policy, planning and sustainability (i); (b) policy, planning and sustainability (ii); (c) transportation modes; (d) logistics and SCM; (e) pollution; (f) technologies; (g) modelling; (h) macro-parameters.
Sustainability 14 05711 g027
Figure 28. A word cloud generated from the transportation parameter keywords (The Guardian).
Sustainability 14 05711 g028
Figure 29. A word cloud generated from the transportation parameter keywords (TTI magazine).
Sustainability 14 05711 g029
Figure 30. A word cloud generated from the transportation parameter keywords (Web of Science).
Sustainability 14 05711 g030
Table 1. Parameter and Macro-Parameters for Transportation (Source: The Guardian).
Macro-ParametersParametersNo.%Keywords
Road TransportCRC72.25road, congestion, traffic, motorway, transport, charge, scheme, car, lane, motorist, toll, government, year, city, pricing, vehicle, public, need, increase
Pollution and EV171.56car, vehicle, emission, diesel, pollution, fuel, electric, air, petrol, clean, new, carbon, year, hydrogen, engine, power, government, manufacturer, hybrid, green
Fuel and SCM191.47fuel, oil, price, petrol, driver, duty, tax, government, shortage, car, rise, supply, motorist, increase, cost, road, high, tanker, year
Cycling241.02bike, cycling, cycle, cyclist, city, ride, road, bicycle, route, lane, scheme, year, car, traffic, transport, way, safe, work, street, day
Cycling Safety231.08cyclist, cycle, road, bike, cycling, death, kill, pedestrian, traffic, ride, safety, accident, driver, year, lorry, safe, helmet, injury, lane, number
Bus Transport121.87bus, service, routemaster, transport, route, local, public, new, passenger, year, cut, travel, run, operator, journey, city, old, work, time
Rail TransportPD62.34train, rail, passenger, service, company, network, year, railtrack, franchise, timetable, railway, new, delay, operator, line, run, work, industry, time
Rail Fares112.06fare, ticket, rise, rail, train, passenger, season, price, increase, inflation, travel, cost, year, commuter, cheap, pay, company, average, peak, buy
FCR32.67rail, year, company, network, profit, bn, government, franchise, bus, train, cost, railtrack, passenger, fare, rise, increase, revenue, transport, public
Industry and Privatisation211.13shareholder, railtrack, company, eurotunnel, byer, debt, government, tunnel, french, share, administration, creditor, investor, channel, group, year, bn, private, public
Rail Projects and Contracts92.16franchise, rail, government, train, contract, railway, company, year, railtrack, run, network, service, line, new, transport, operator, bid, public, plan
42.39rail, project, line, transport, north, high, speed, government, new, network, plan, train, link, route, bn, cost, year, build, city
Governance and Politics22.75government, byer, transport, labour, public, minister, private, railtrack, company, last, tory, year, plan, decision, tube, rail, political, privatisation, secretary
Air TransportAirport Expansions03.57runway, airport, heathrow, expansion, third, government, new, aviation, decision, noise, flight, build, stanste, plan, air, capacity, climate, expand, environmental
Air Pollution82.19emission, carbon, aviation, climate, airline, change, fuel, flight, air, environmental, government, biofuel, reduce, industry, offset, global, green, energy, scheme
Airport Security13.55flight, airport, passenger, airline, plane, drone, security, fly, pilot, aircraft, delay, air, cancel, travel, heathrow, check, ash, staff
Air Costs and Fares181.48airline, airport, year, flight, passenger, carrier, cost, price, baa, Easyjet, business, market, Ryanair, last, fly, profit, Heathrow, industry, air
Crash and SafetyTrain Crashes151.78crash, safety, train, railtrack, rail, signal, accident, report, inquiry, Paddington, track, health, company, bar, railway, manslaughter, network, potter, disaster, prosecution
221.10train, carriage, crash, track, passenger, accident, incident, injure, scene, driver, derail, service, rail, safety, police, emergency, line, fire, injury, come
Accidents and Deaths161.72police, crash, accident, incident, scene, woman, injure, die, man, injury, train, vehicle, driver, kill, hospital, car, family, motorway, death, cause
DDS141.79driver, speed, limit, drive, camera, road, police, driving, mph, drink, penalty, motorist, offence, test, accident, drug, fine, safety, year, death
Disruptions and CausesEWI102.09snow, weather, temperature, flood, road, cold, rain, heavy, condition, wind, service, warning, expect, ice, close, area, fall, cause, delay, morning
Disruptions and Delays131.82train, service, weekend, holiday, passenger, expect, delay, busy, work, station, line, travel, day, fire, hour, weather, rail, disruption, run, traffic
ERDSERDS52.38strike, union, action, unite, staff, dispute, rmt, member, tube, crew, industrial, pay, talk, worker, ballot, offer, day, cabin, service, work
201.24strike, southern, rmt, train, dispute, union, service, action, member, guard, talk, driver, rail, passenger, staff, conductor, company, day, run, aslef
CRC = Congestion and Road Charging; PD = Public Discontentment; FCR = Funding, Costs, and Revenues; DDS = Dangerous Driving and Speeding; EWI = Extreme Weather Impacts; ERDS = Employment Rights, Disputes, and Strikes.
Table 2. Parameter and Macro-Parameters for Transportation (Source: Traffic Technology International).
Macro-ParametersParametersNo.%Keywords
Industry, Innovation and LeadershipLeadership08.05technology, mobility, vehicle, transportation, event, transport, traffic, city, system, service, work, future, world, infrastructure, road, public, time, datum, smart, industry
Innovation42.60award, project, winner, competition, transportation, traffic, win, system, tsmo, technology, road, team, category, solution, work, vehicle, industry, transport, safety, innovation
Autonomous and Connected VehiclesAV Systems14.41vehicle, car, autonomous, system, drive, technology, datum, map, driving, driver, road, sensor, automate, company, software, autonomous vehicle, automotive, platform, self, time
AV Trials82.18vehicle, autonomous, technology, test, drive, trial, first, driverless, autonomous vehicle, driving, testing, self, driver, road, car, system, public, company, automate, shuttle
V2X Trials91.97australian, transport, vehicle, technology, road, government, trial, system, industry, project, infrastructure, world, safety, cohda, first, future, provide, state, automate, city
Platooning121.69truck, driver, vehicle, platoone, technology, system, parking, drive, freight, commercial, road, truck parking, project, truck driver, trucking, company, fuel, highway, autonomous, safety
InfrastructureRoad Infrast.24.10project, lane, road, motorway, traffic, construction, bridge, improve, scheme, work, design, tunnel, junction, improvement, highway, route, mile, time, provide, reduce
Crash and Safety131.58road, death, pedestrian, crash, safety, fatality, injury, speed, increase, report, vehicle, reduce, number, traffic, safe, kill, serious, driver, high, state
Tolling101.95toll, system, tolling, lane, toll collection, collection, electronic, bridge, tolling system, project, transponder, contract, customer, transcore, express, road, vehicle, company, state, collection system
ALPR141.50camera, video, system, traffic, surveillance, high, vehicle, application, technology, provide, solution, detection, plate, analytic, enforcement, range, datum, feature, capture, view
Mobility ServicesTransport Services33.01system, traffic, vehicle, german, service, datum, software, mobility, company, technology, city, road, base, time, speed, transport, parking, project, driver, solution
Parking Services62.31parking, app, system, driver, space, car, time, service, city, payment, parking space, park, available, information, smartphone, user, street, vehicle, provide, traffic
SustainabilityAir Quality and Pollution52.35air, emission, pollution, air quality, quality, vehicle, reduce, air pollution, transport, clean, city, government, local, earthsense, charge, work, help, electric, road, public
Street Lighting72.27city, smart, smart city, energy, datum, lighting, technology, traffic, system, project, street, urban, provide, solution, sensor, light, time, help, streetlight, network
Electric Vehicles111.89bus, passenger, system, electric, vehicle, technology, transport, public, emission, service, city, electric bus, operator, stop, route, school, help, time, bus lane, first
Table 3. Parameter and Macro-Parameters for Transportation (Source: Web of Science).
Macro-ParametersParametersNo.%Keywords
Policy, Planning and SustainabilityLand-Use Planning51.47urban, city, development, land, planning, transportation, public, sustainable, model, area, transport, spatial, system, transit, policy, economic, infrastructure, accessibility, regional, sustainability
Smart Cities310.43smart, city, smart city, urban, system, datum, technology, citizen, transportation, service, public, concept, management, transport, energy, framework, transportation system, privacy, information, iot
Low-Income Neighborhoods390.36job, worker, housing, commute, income, low income, low, transit, accessibility, employment, work, access, wage, job accessibility, poor, job seeker, seeker, live, area, household
Urban Mobility260.47urban, city, growth, population, development, area, model, transportation, increase, transport, transit, demand, urban growth, network, new, land, agglomeration, spatial, build, urbanisation
Road Safety330.41accident, road, crash, driver, safety, vehicle, collision, traffic, fatality, weather, speed, risk, traffic accident, truck, cause, system, injury, drive, road accident, death
380.36pedestrian, walk, sidewalk, walking, neighborhood, environment, walk trip, trip, build environment, household, build, walkability, walkable, behavior, model, residential, pedestrian detection, safety, crossing, street
Traffic Congestion170.89traffic, congestion, traffic congestion, system, road, urban, time, vehicle, city, transportation, problem, propose, network, datum, base, transportation system, control, model, travel, become
Subways410.34subway, station, subway station, underground, passenger, subway system, line, subway line, system, pm, public, passenger flow, flow, transportation, network, public transportation, platform, urban, time, city
Vehicle Ownership160.95car, vehicle, driver, drive, ownership, model, car ownership, car follow, datum, system, transportation, base, travel, consumer, traffic, follow, household, mode, driving, information
EV and Charging05.88power, electric, energy, charge, battery, system, electric vehicle, vehicle, voltage, grid, control, fuel, propose, high, transportation, load, motor, current, model, converter
Bike Sharing and Ridesourcing101.17bicycle, bike, cycling, cyclist, bike sharing, sharing, share, mode, public, trip, motorcycle, city, user, station, cycle, system, travel, public bicycle, transportation, sharing system
Children and Schools490.32school, child, student, parent, travel, active, walk, parental, school travel, travel school, mode, active travel, youth, high school, distance, walk school, choice, influence, activity, factor
Gender and Race Equality480.32woman, gender, health, homeless, black, care, man, barrier, need, transportation, service, social, treatment, segregation, individual, community, female, child, racial, lack
Parking460.33parking, parking lot, parking space, lot, space, parking policy, congestion, driver, policy, traffic, time, cost, car, pricing, occupancy, system, parking system, model, area, park
Tolling470.32toll, problem, network, travel, model, travel time, time, congestion, optimal, propose, traveler, method, objective, cost, transportation, approach, path, mode, uncertainty, base
Tourism230.50tourism, tourist, destination, service, development, travel, tourism industry, accommodation, transportation, industry, tourism development, visitor, attraction, activity, village, economic, information, tour, resource, country
Transportation ModesRoad Transport71.26bus, passenger, transit, public, time, service, stop, public transportation, route, system, model, bus stop, travel, transportation, bus service, base, transport, vehicle, datum, bus route
Rail Transport12.85railway, train, rail, system, passenger, hsr, speed, line, high speed, transportation, operation, model, high, transport, track, traction, method, freight, propose, base
Air Transport32.19airport, airline, flight, air, aircraft, passenger, aviation, air transportation, drone, service, model, system, market, transportation, network, air traffic, operation, datum, cost, time
Marine Transport131.08ship, port, maritime, container, shipping, sea, vessel, ferry, model, cargo, risk, transportation, inland, system, seaport, terminal, operation, analysis, transport, base
Logistics and SCMFreight and Logistics440.33business, logistic, company, industry, service, market, international, transportation, customer, growth, factor, sector, important, port, datum, transport, economic, investment, process, development
450.33cost, carrier, model, transportation, activity, freight, service, ltl, reduce, approach, less, analysis, transportation cost, inventory, base, process, customer, total, supply chain, implication
Food Supply Chain360.36food, chain, product, meal, supply, supply chain, food supply, waste, food waste, temperature, production, fresh, environmental, perishable, consumer, impact, food production, store, transportation, fresh food
Cost and Pricing210.59price, cost, firm, transportation cost, equilibrium, consumer, market, profit, auction, product, transportation, model, competition, location, valuation, segment, good, game, low, shipper
Table 4. Parameter and Macro-Parameters for Transportation (Source: Web of Science).
Macro-ParametersParametersNo.%Keywords
PollutionAir Quality and Pollution81.20concentration, pm, air, pollution, source, emission, high, particle, pollutant, dust, winter, exposure, air pollution, contribution, summer, ozone, period, particulate, level, atmospheric
141.01emission, carbon, co, carbon emission, sector, energy, reduction, co emission, reduce, policy, transportation, climate, emission reduction, transport, low carbon, gas, greenhouse, greenhouse gas, industry, change
250.47emission, climate, climate change, change, carbon, co, sector, global, energy, environmental, co emission, warming, adaptation, global warming, carbon dioxide, dioxide, impact, transportation, policy, mitigation
420.34chinese, policy, development, city, chinese city, transportation, government, port, industry, quality, chinese government, economic, urban, air, air quality, level, emission, factor, market, pollution
Soil Pollution290.44root, cd, plant, soil, rice, concentration, accumulation, shoot, metal, content, stress, gene, uptake, seedling, treatment, cadmium, high, decrease, increase, leave
320.41soil, metal, heavy metal, heavy, concentration, sample, plant, pollution, risk, cd, high, contamination, mining, area, water, source, environmental, dust, health, human
41.59sediment, water, soil, concentration, metal, river, high, surface, heavy metal, sample, heavy, source, pah, lake, distribution, organic, fish, erosion, area, process
Noise Pollution430.33noise, pollution, traffic noise, noise pollution, sleep, noise level, exposure, annoyance, level, traffic, night, transportation noise, road traffic, air, health, air pollution, hour, road, cancer, noise exposure
Fuel Types and Effects240.49fuel, diesel, engine, emission, biodiesel, production, biomass, energy, gasoline, oil, ethanol, biofuel, gas, renewable, blend, produce, cycle, diesel engine, life cycle, feedstock
Coal Transport and Consumption400.35coal, plant, power plant, power, emission, electricity, gas, mine, mining, energy, production, fire power, coal fire, coal transportation, co, fire, transportation, fuel, thermal, natural gas
Waste Management91.19waste, waste management, collection, management, solid, solid waste, disposal, landfill, recycling, municipal, environmental, treatment, cost, municipal solid, waste collection, collection transportation, impact, facility, material, hospital
Waste Water Treatment350.36water, sludge, wastewater, treatment, sewer, sewage, removal, microplastic, process, pipe, environmental, wastewater treatment, desalination, concentration, environmental load, sample, reduce, high, effluent, oxygen
Incident and Risk Management150.97oil, spill, pipeline, oil spill, oil gas, crude, crude oil, gas, petroleum, price, oil price, accident, hydrocarbon, corrosion, water, refinery, leakage, process, risk, transportation
TechnologiesITS111.14decade, last decade, last, transportation, vehicle, system, datum, past, past decade, base, technology, application, traffic, network, new, model, review, development, logistic, impact
Computer Vision200.64vehicle, image, detection, recognition, video, plate, system, license plate, license, method, propose, object, detect, traffic, color, tracking, feature, intelligent, algorithm, base
Smartphone Sensing220.53smartphone, phone, mobile, user, datum, mobile phone, application, sensor, information, system, mode, device, transportation, gps, time, location, base, transportation mode, service, mobility
VANET22.42wireless, communication, network, vehicular, propose, system, vehicle, node, scheme, base, application, vanet, intelligent, mobile, protocol, sensor, intelligent transportation, access, transmission, transportation system
280.44vehicular, vehicle, application, network, system, transportation, communication, transportation system, base, protocol, intelligent, attract, vanet, intelligent transportation, researcher, propose, route, vehicular network, performance, service
300.43security, attack, privacy, vehicle, authentication, protocol, communication, network, secure, scheme, internet, propose, vanet, base, vehicular, system, iot, node, user, intelligent
Autonomous Vehicles and Taxis270.46taxi, driver, taxi driver, passenger, taxi service, service, time, travel, share, demand, datum, taxi demand, trip, ride, autonomous taxi, autonomous, model, system, base, vehicle
IoT Security180.85iot, internet, smart, thing, internet thing, device, security, network, application, datum, cloud, system, technology, service, thing iot, propose, intelligent, information, base, communication
Physical Layer Communication340.38antenna, radar, frequency, system, communication, band, signal, radio, range, design, intelligent, intelligent transportation, propose, bandwidth, target, application, propose antenna, light, modulation, gain
Robot Mobility370.36robot, mobile robot, robotic, task, system, mobile, control, approach, object, environment, problem, propose, transportation, sensor, present, base, motion, swarm, obstacle, time
ModellingTraffic Flow Modelling121.14traffic, traffic flow, flow, prediction, datum, model, time, method, propose, network, road, system, real, forecasting, speed, traffic datum, base, intelligent, vehicle, accuracy
Transportation Modelling Algorithms61.27problem, algorithm, fuzzy, solve, solution, propose, optimisation, method, model, objective, transportation problem, optimal, cost, genetic, programming, time, transportation, multi, network, base
Publisher’s Note: MDPI stays neutral with regard to jurisdictional claims in published maps and institutional affiliations.

