Article

Methodology for Determining Sustainable Water Consumption Indicators for Buildings

by
Luciana Teixeira Batista
1,*,
José Ricardo Queiroz Franco
1,
Ricardo Hall Fakury
1,
Marcelo Franco Porto
2 and
Carmela Maria Polito Braga
3
1
Department of Structural Engineering, Universidade Federal de Minas Gerais, Belo Horizonte 31270-901, Brazil
2
Department of Transport Engineering and Geotechnics, Universidade Federal de Minas Gerais, Belo Horizonte 31270-901, Brazil
3
Department of Electronic Engineering, Universidade Federal de Minas Gerais, Belo Horizonte 31270-901, Brazil
*
Author to whom correspondence should be addressed.
Sustainability 2022, 14(9), 5695; https://doi.org/10.3390/su14095695
Submission received: 5 April 2022 / Revised: 2 May 2022 / Accepted: 4 May 2022 / Published: 9 May 2022

Abstract

:
The objective of this study was the definition and determination of sustainable water consumption indicators for activity categories, as well as the evolution of water consumption in commercial buildings. These indicators were determined through statistical analyses using Shewhart charts. Within a broader scope, the research proposed a methodology to automate sustainable management of water consumption in building operation using BIM–IoT–FM integration. The scientific rigor of the methodology was based on the precepts of design science research. The methods proposed for the construction of functionalities and the application of the reference indicators provided an optimized analysis of water consumption and the detection of excess consumption and leaks. The methodology, implemented in an online prototype, AquaBIM, could deliver a significant advance for building management. A conceptual test of AquaBIM evaluated the consumption indicators and validated our methodology through its application in a commercial building. The building consumption analyses showed a potential for approximately 15% savings. In addition, five requirements of the international sustainability certification AQUAHQE were met. The results of our research provide an innovative approach for the automation of sustainable building management and could be expanded to monitor and report on the consumption of other critical resources such as electricity and gas.

1. Introduction

Water scarcity due to factors such as global warming, population increase, and urban growth rate is an increasing concern worldwide [1,2]. Water scarcity is becoming a critical problem, and it will require innovative solutions for the efficient use of water. Researchers, organizations, and governments have been engaged in the search for innovations for the rational use of water to achieve a more equitable distribution among those in need. Studies have indicated the essential need to adopt principles of sustainability in water management for all sectors of society, including residential and commercial. The architecture, engineering, construction, and operation (AEC/O) industry has become one of the main protagonists of this new paradigm and has played an important role in the global environmental balance, especially in mitigating the impact in building operations.
Urban water consumption has consistently affected the global water cycle, making water resource management crucial [3,4]. The problems arising from contemporary challenges and the need to build new paradigms for urban water management have required new consumption proposals [5]. A new management paradigm should include the complete urban hydrological cycle, considering, for example, the improvement of productivity and efficiency of water use [6], the adoption of incentives for the reuse of gray water, and the use of natural systems for sewage treatment [7].
Facility management (FM) has become an important operational process to improve the performance and sustainability of a building, especially when integrated with Building Information Modeling (BIM) and Internet of Things (IoT) sourced data. IoT devices, such as smart meters, provide new opportunities for research in various fields.
The application of facilities management (FM) in building operation and maintenance has been identified as a promising method to satisfy the current requirements for sustainable water consumption [8]. Recently, the integration of building information modeling (BIM) with Internet-of-things (IoT) resources in FM has gained importance in the construction of practical applications and has opened new frontiers of research in this field [9,10].
The objective of this study was to develop a methodology for the management of sustainable water consumption in the microenvironment of commercial buildings. Therefore, we needed to identify and describe sustainable indicators of water consumption for different activities. These indicators were determined by applying Shewhart’s control charts, a statistical method applied to the digital data collected during building operations. The automation of this sustainable management methodology has become an important goal to encourage and facilitate the adoption of sustainable practices during operation. To this end, the methodology was implemented in a prototype for the web, through which it would be possible to automate the generation of information for the analysis and comparative review of the building consumption. The proposed solution investigated the impact of this automation on water management using the integration of information from the BIM and the smart meter database to monitor water consumption in real-time during building operation.

2. Literature Review

2.1. Importance of Water Management

The current compromise of urban water security has created an urgent need for more effective water management. Nika et al. [11] stated that water was the natural resource that had suffered the most damage from urban growth. Brears [4] warned about the need to change urban water management paradigms. One premise was the realization that water has a limited quantity, and all these factors must be considered for effective water management. Several researchers have highlighted the need to adopt new approaches to long-term water management, including sustainability and equity measures [12]. Brears [13] added that actions must be designed in an integrated and coordinated way to conduct an effective management of urban water and water in nature with institutional policies at individual scales. Antzoulatos et al. [14] argued that traditional water management was inadequate as new technologies were available to revolutionize the management of urban water systems. A sustainable urban water system must privilege contemporary socio-economic development without compromising the future supply [15].
All sectors of society must contribute to the success of this new paradigm. A small improvement in water-use efficiency can result in a significant reduction in consumption over time. Therefore, traditionally ignored sectors, such as residential and commercial sectors, should be considered [16]. The commercial sector accounts for approximately 20% of urban water consumption in the European Union and Australia, indicating considerable savings potential [17,18].

2.2. The Use of Digital Technologies in Water Management

New advances in information technologies (IT), such as the Internet of Things (IoT), offer important opportunities for urban water management. Simultaneously, the data processing and storage capacity increased substantially, resulting in the generation of more comprehensive databases, which allows new types of analysis [19]. Technological resources play an important role in achieving sustainable water management and can also provide the necessary data for the development of new water management methods [20]. Researchers are motivated to investigate new solutions for sustainable water management. Hering et al. [21] reported the importance of seeking new sustainability solutions to improve the use of already available resources. Among other actions, these advancements can occur through improving the efficiency of existing water supply systems, effectively using information to manage demand, desalination, and post-treatment inclusion of wastewater.
Smart meters (SM) are innovative devices used to remotely capture readings of building water consumption. Data collection can take place in very short time intervals, which are then stored on servers or in a cloud database [22,23]. Data from smart meters have encouraged the emergence of new lines of research, including recent studies on water consumption [24].
Boyle et al. [25] stated that the continuous monitoring of water consumption using smart meters constitutes an information feedback system and an auxiliary procedure for strategic planning. Studies in Australia, the United States, and some European countries have increasingly employed smart meter data since the 2000s [22]. Willis et al. [26] analyzed the water consumption of 150 households in Australia using smart meters to establish a relationship between socioeconomic status and water consumption. Liu and Mukheibir [27] conducted a literature review surveying the consumption of residential buildings using smart meters, and they concluded that the smart meters led to an average reduction of 5.5% in water consumption.

2.3. BIM–IoT Integration in Facility Management (FM)

There has not been a consensus on the definition of facilities management (FM) [28]. Initially, the foundations of facilities management were developed in the United States to organize people, processes, and spaces in corporate environments [29]. Chotipanich [30] advocated a holistic approach to FM fundamentals, balancing the internal and external factors that structure decision-making. According to the recent ISO 41001 [31], the following principles must be considered for the improvement of FM systems: leadership, planning, support, operations, performance evaluation, and improvement.
In the life cycle of a building, the operation and maintenance stages are the longest for the application of this concept [29]. Traditional building operation and maintenance can involve many management skills [29]. In addition, the concept was expanded to cover other aspects, including sustainability. Specifically, facility management can support goals for the reduction in water and energy consumption in new and existing buildings [8,9].
Building information modeling (BIM) is a methodology used to automate and modernize the civil construction sector [32]. BIM is used to build 3D digital models to capture, organize, and share information at all stages of a building’s life cycle [33]. Succar [34] argued that BIM integrated the spheres of technology, policies, and processes. According to Gao and Pishdad-Bozorgi [35], investments in the development of BIM applications could transform FM in the operational phase. Gürsel [36] noted that for buildings to achieve sustainability and high performance during their life cycles, their functionality must be monitored over time.
FM–BIM integration gained relevance by combining information from external sources with geometric data from BIM to visually analyze and identify the investigated elements [37]. BIM provided a suitable platform to update the information needed for FM [38]. Kelly et al. [39] demonstrated that FM–BIM integration has renewed the debate on how to improve the performance of buildings. Furthermore, Pärn et al. [28] observed that FM–BIM integration promoted data recovery through BIM in project integration and construction, maintenance, and operation activities, which results in better FM solutions.
FM, which encompasses water consumption management, has been impacted by the development of emerging digital technologies such as IoT, especially when integrated with BIM [40,41]. IoT systems allow smart devices to establish a connection via the internet to provide data in real time, thus allowing the control of the physical parameters of the environment [42]. The integration of these three technologies have allowed the construction of a new paradigm to establish sustainability criteria for buildings with a significant reduction in energy and water consumption [43].

2.4. Sustainable FM

The AEC/O industry significantly influences the global environmental imbalance. Developed countries consume 40% of energy and emit 30% of greenhouse gases [44]. These rates are not acceptable for sustainable development, and the sector is under pressure to reduce their negative impacts. When the entire life cycle of a building is considered, 80% of building costs are related to operations [45]. These factors have encouraged studies on more efficient buildings and improved FM [46].
Reducing the environmental impacts caused by the construction industry has led to FM as a field of knowledge. Sustainable FM is part of a broader concept of development. The evolution of this field of research has accompanied the growth of environmental concerns [47,48]. Maximizing the performance of buildings [46], optimizing energy consumption [49,50], and minimizing negative impacts are covered by green maintenance [47]. Market competition, government requirements, technological advances, and cultural changes are the main factors influencing the construction industry to adopt sustainable management [51].
The way buildings are operated affects their consumption of natural resources and can impact the sustainability of the planet in the near future [9]. Roper [52] noted that companies that pursue environmental sustainability through the design, construction, and operation of sustainable buildings have a better reputation and greater success in the global economy. Elmualim et al. [53] argued that sustainable FM can contribute to reducing the environmental impacts caused by buildings. The initial construction and the subsequent building operation and maintenance must be managed in a sustainable society [9,54].

2.5. Shewhart Control Charts

Statistical process control (SPC) was proposed in the 1920s but only became popular in the 1960s due to the work of Deming and Juran [55]. One of the main tools of SPC is control charts. Control charts have three fundamental objectives: reduce variability, monitor, and estimate process quality parameters. Figure 1 shows the control lines in one of these graphs: the control line (CL) represents the mean value of the sample between a lower control line (LCL) and an upper control line (UCL), respectively, the minimum and maximum limits. Control limits indicate the allowable variation in a process. If the plotted points are within these limits, the process is in statistical control and, therefore, not caused by random events. Otherwise, the process is considered out of control and needs to be revised [55].
Building a Shewhart control chart involves two steps. The first is to establish the control limits and determine the characteristics of the studied parameters. In the second step, the determined parameters are used to monitor the process over time [55].
Traditionally, SPC has been used to monitor industrial processes; however, its range of applications has expanded over time [56,57].
Recent studies have shown that control charts have been used at three levels of water management. At the macro level, studies have generally monitored water quality parameters [58,59,60,61]. At the urban level, studies have been conducted to identify pipe leaks and assess repair response times [62,63]. At the building level, Freitas et al. [64] studied water consumption in a university building using water-saving devices. However, studies at the micro-level are scarce.

2.6. Corelated Works

Innovative contributions to this research include the proposed methods for defining and determining sustainable indicators of water consumption to support management decisions. These indicators have been used to automate the management of facilities in commercial buildings to reduce the environmental impacts of water use, in line with the arguments of Hörisch et al., 2015 [65].
The following studies, including the present research, have presented similar approaches for the development of environmental strategies, using tools and indicators for sustainability management. Although developed using different perspectives, these studies corroborate the objectives of this research.
In 2015, Hörisch et al. analyzed the application of different sustainable management tools used by large companies to reduce their environmental impact. The issue of water, for example, was considered from an economic perspective that related water use to company sales and revenues. The authors use an ASSET4 database to analyze these parameters against a global dataset, as opposed the building-scale approach proposed in this paper.
The work by Zhongming et al. [66] presented tools to determine the sustainable indicators for complex systems. They suggested that sustainable indicators were important tools to support decision-making, as they could provide an accurate assessment of the issue and identify its virtues and limitations. This work had a theoretical connotation and presented extensive bibliographic research. Nika et al. [11] developed a conceptual framework to assess indicators of water circulation across multiple sectors (e.g., energy, agriculture, urban, and industrial water). They investigated feedback loops between socio-economic and environmental sectors. The methodology of Nika et al. [11] selected and specified the sectors involved, performed data collection, calculated indicators, analyzed their impacts, and presented the results. The authors used an Excel spreadsheet to analyze the data and calculate the indicators.
Although the study investigated the use of water more broadly and with different objectives, the basic principles of this methodology were similar to those of the present research. The comparison of the two studies indicated an important difference in this research, due to the integrated use of BIM, IoT, and FM technologies for the development of a methodology and its implementation in a computational online prototype to automate building management.
The following works also examined BIM–FM–IoT integrations, and the authors developed systems to exchange information between BIM and digital data collected in real time.
Hu et al. [67] created a hybrid system (BIM + RFID database + energy management software), which used a database to generate analysis parameters to improve the performance of a building during operation. Bonci et al. [68] used multiple types of BIM as data centralizers, which allowed them to conduct customized simulations. The study determined performance indicators from industrial management metrics called overall throughput effectiveness (OTE), where the platform monitored multiple systems together. In the approach investigated by Tagliabue et al. [69], a mobile application was developed that monitored sustainability parameters in real time. The methodology used BIM parameterized by existing sustainability parameters Leadership in Energy and Environmental Design (LEED) for online monitoring of the subject building. In addition, the methodology encouraged users to improve behaviors and updated the sustainability rating score.
These studies applied FM using technological and methodological principles similar to those proposed in this paper; however, their applications involved different types of consumption sources, predominantly the management of electricity consumption.
Some research has focused on sustainability in the use of water. For example, studies have investigated municipal water management [65,66] and residential consumption [22,25,26,27]. In the literature, however, there has been little research on the treatment of sustainability in FM for commercial buildings.
Our innovative proposal provides a solution using the BIM–IoT–FM integration associated with sustainable indicators of water consumption for activities in commercial buildings. The present work used Shewhart control charts as a statistical model. Procedures similar to those applied in this research were used in the work by Braga et al. [70], which proposed a system to monitor real-time energy consumption in buildings. Statistical process control techniques were applied to analyze periods of energy consumption, using a cumulative sum control (CUSUM) chart. The system identified unusual demands and failures and generated reports for management. In the work by Braga et al. [70], the energy consumption readings were considered individually while the use of BIM analyzed the data while integrating the geometric and non-geometric information of the building with the water consumption data.
The automation of building water management, including the definition of parameters and the reference consumption ranges, represents an improvement over traditional management. It provides new instruments to detail water consumption in a building in a clear and accessible way. These highlights show the progress achieved in improving the performance of buildings by reducing the consumption of natural resources and achieving sustainability over time.

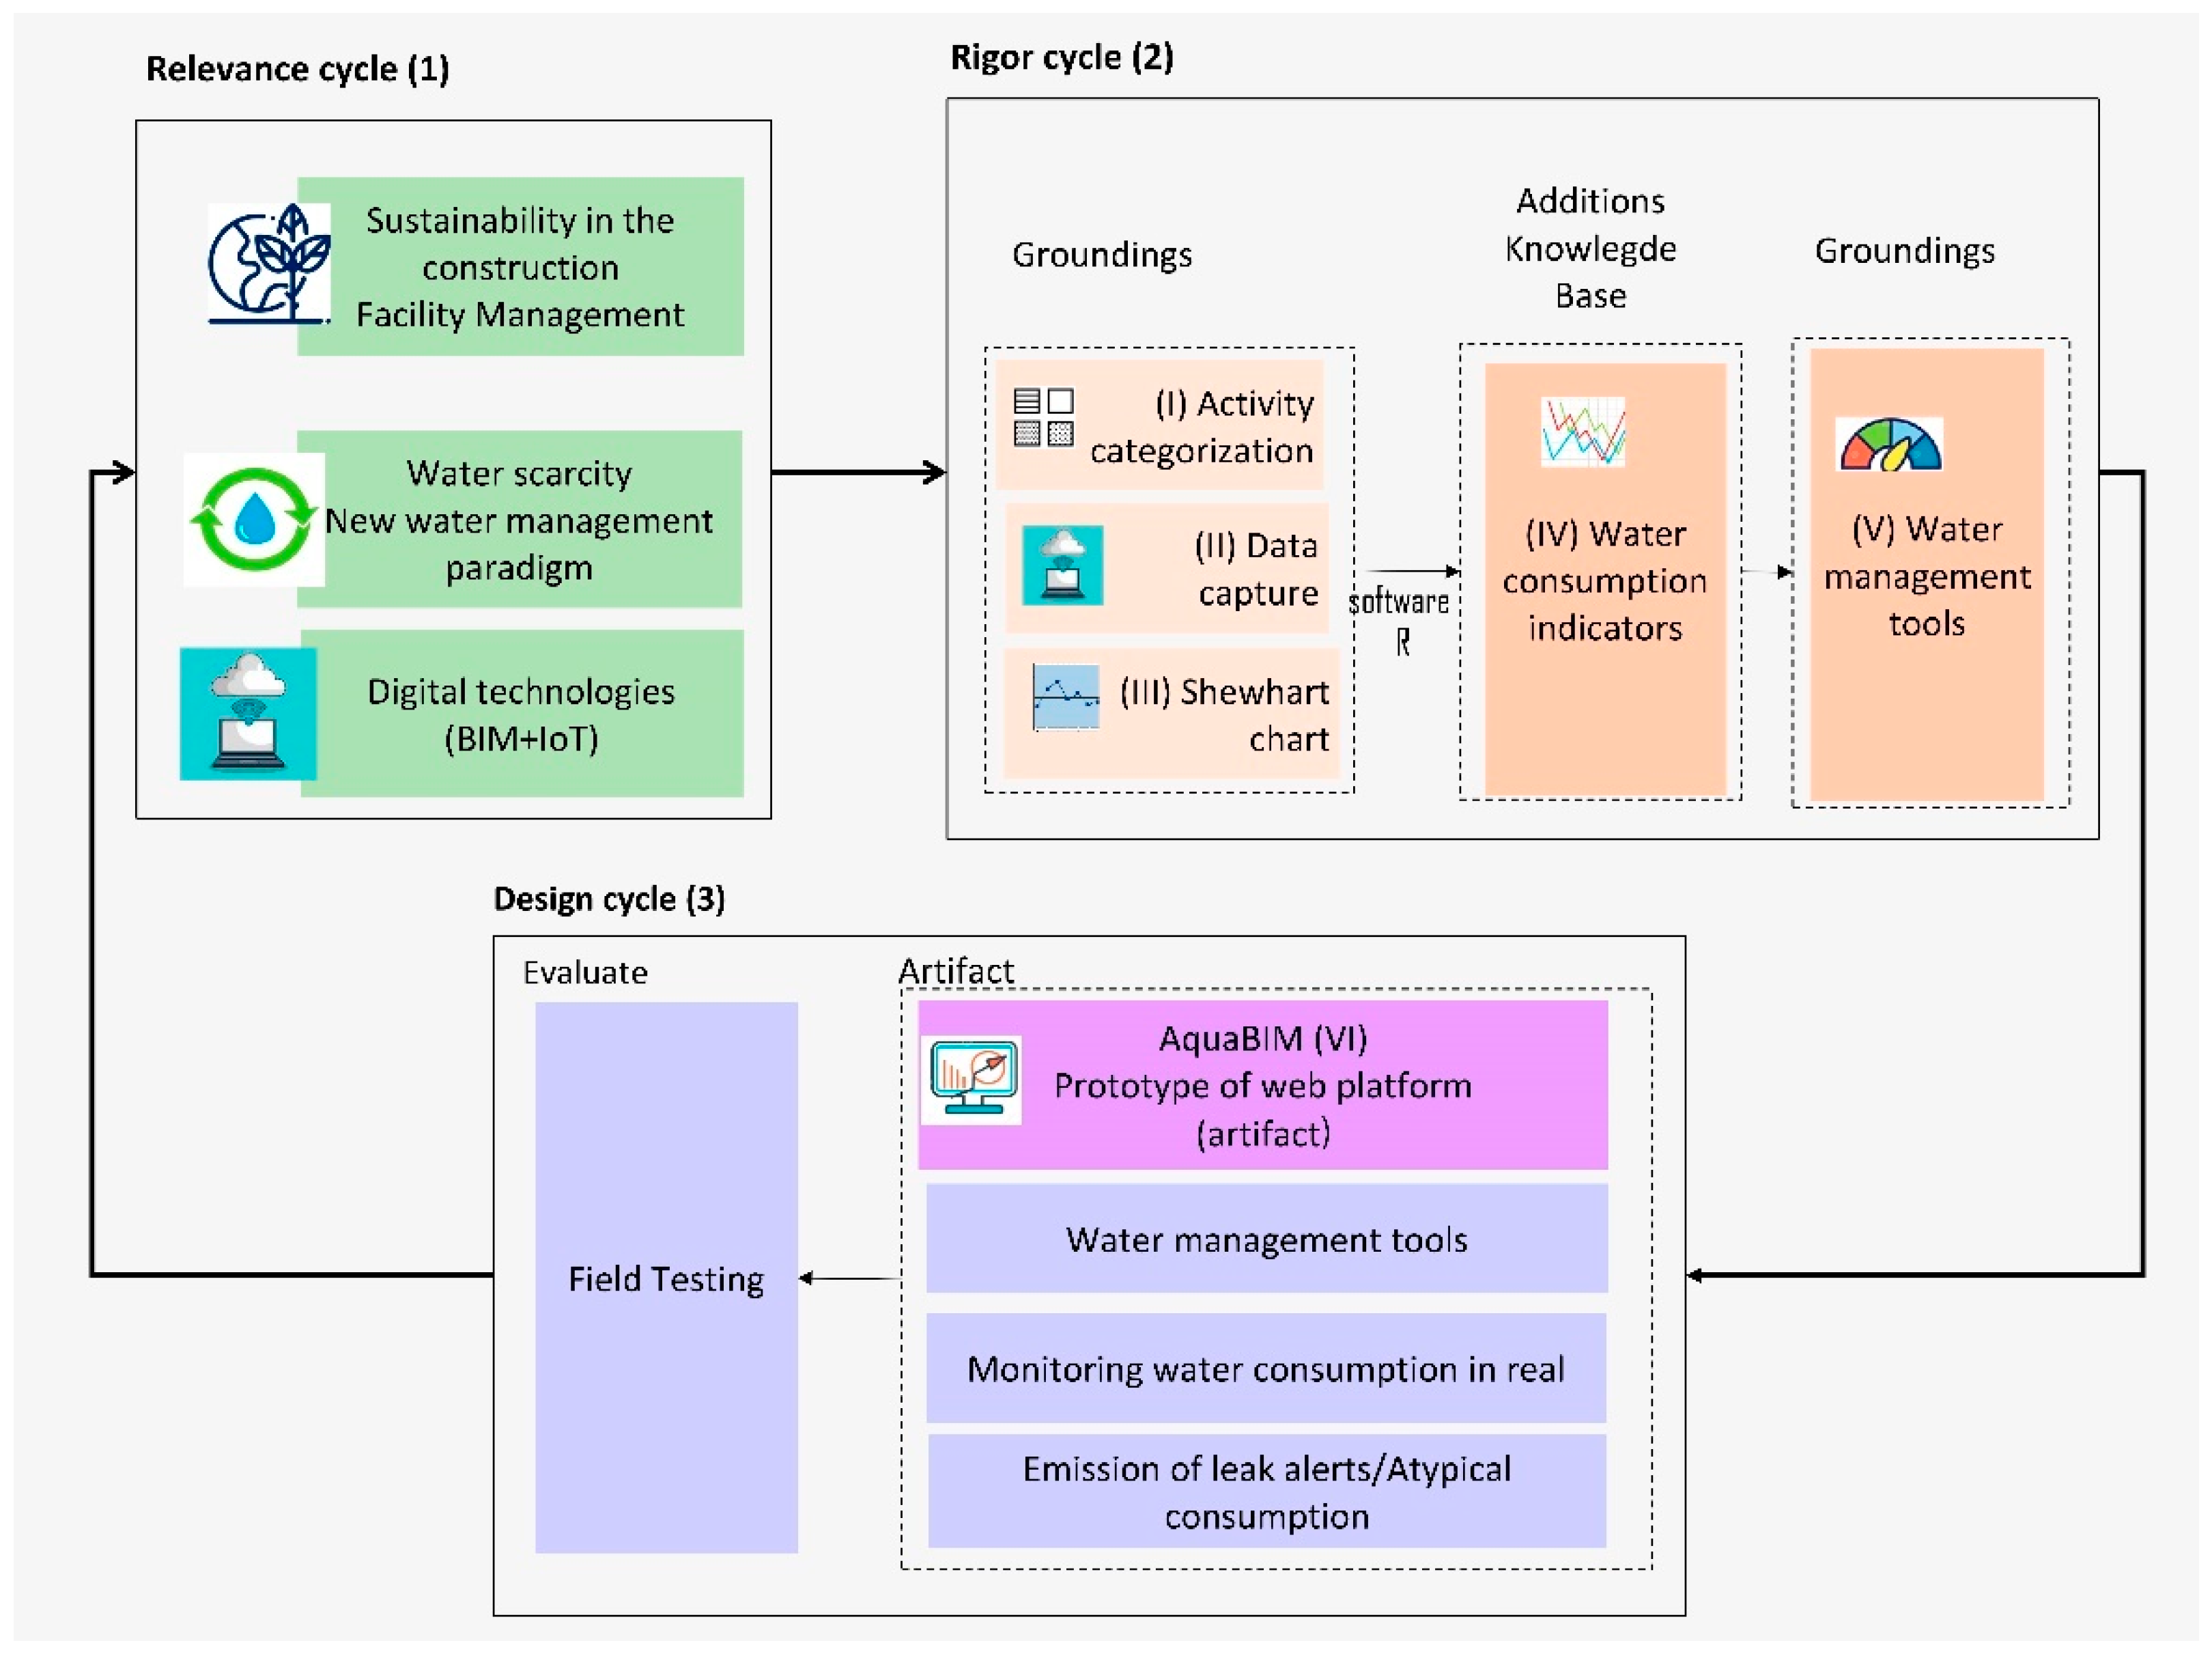
3. Research Methodology

The scientific methodology of design science (DS) serves to develop technological research that employs artifacts as a means of investigation. Design science research (DSR) describes the methodological processes for the researcher to achieve the necessary scientific rigor [71].
The determination of sustainable consumption indicators, within the scope of this research, is a fundamental step in automating water management in buildings.
Hevner [72] describes a three-step DRS cycle (relevance, rigor, and design). Figure 2 shows the research framework of defining indicators based on these principles. In the relevance cycle (1), the fundamental concepts, problems, and opportunities of the investigated areas of knowledge were raised, as presented in the literature review. In the rigor cycle (2), the scientific methods are presented to define the water consumption indicators proposed in this work. These references were used in the construction of a computational online prototype developed in the design cycle (3), where its evaluation is also presented. The indicators were applied to assess the water consumption of an existing building presented in Section 4. The results provide the feedback cycle, validate the scientific contributions, and provide support for new research.

3.1. Rigor Cycle

The rigor cycle can be divided into five steps, as described below.

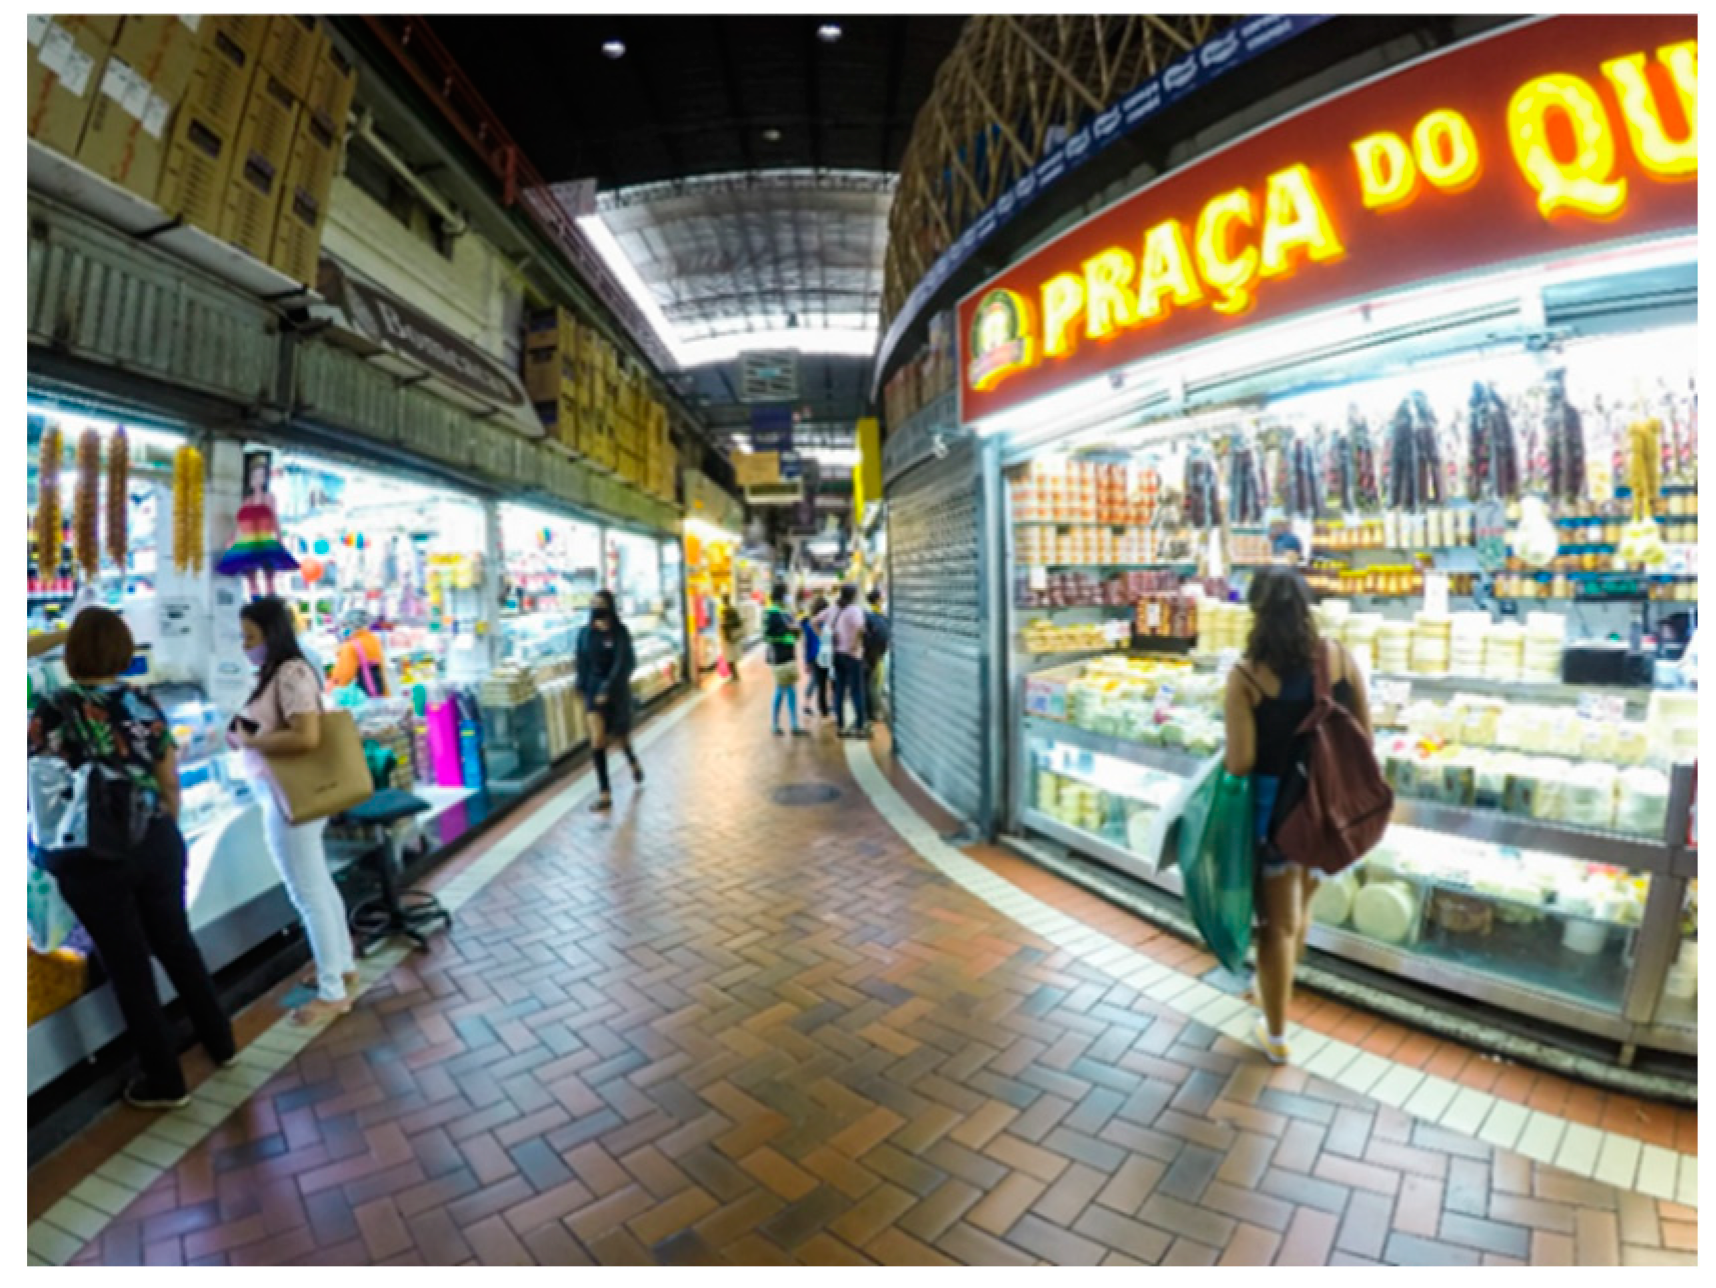
3.1.1. Activity Categorization (I)

To measure sustainable water consumption in a building, it was necessary to categorize the activities that contribute to this consumption. The categories were defined according to two criteria. The first considered the use of water. In this case, two sub-categories were defined. Some activities were categorized by establishments, which use water as an essential input for their operation. Other uses were grouped into activity categories, which use water as an input to perform secondary tasks, such as cleaning. The second criterion defined the category sample by the number of establishments with the same activity. According to Montgomery [55], the samples were required to have 20–25 elements to estimate the quality parameters using control charts. The minimum sample for carrying out a statistical study was at least four units. The categories of activities defined in this step were part of the BIM to classify establishments.

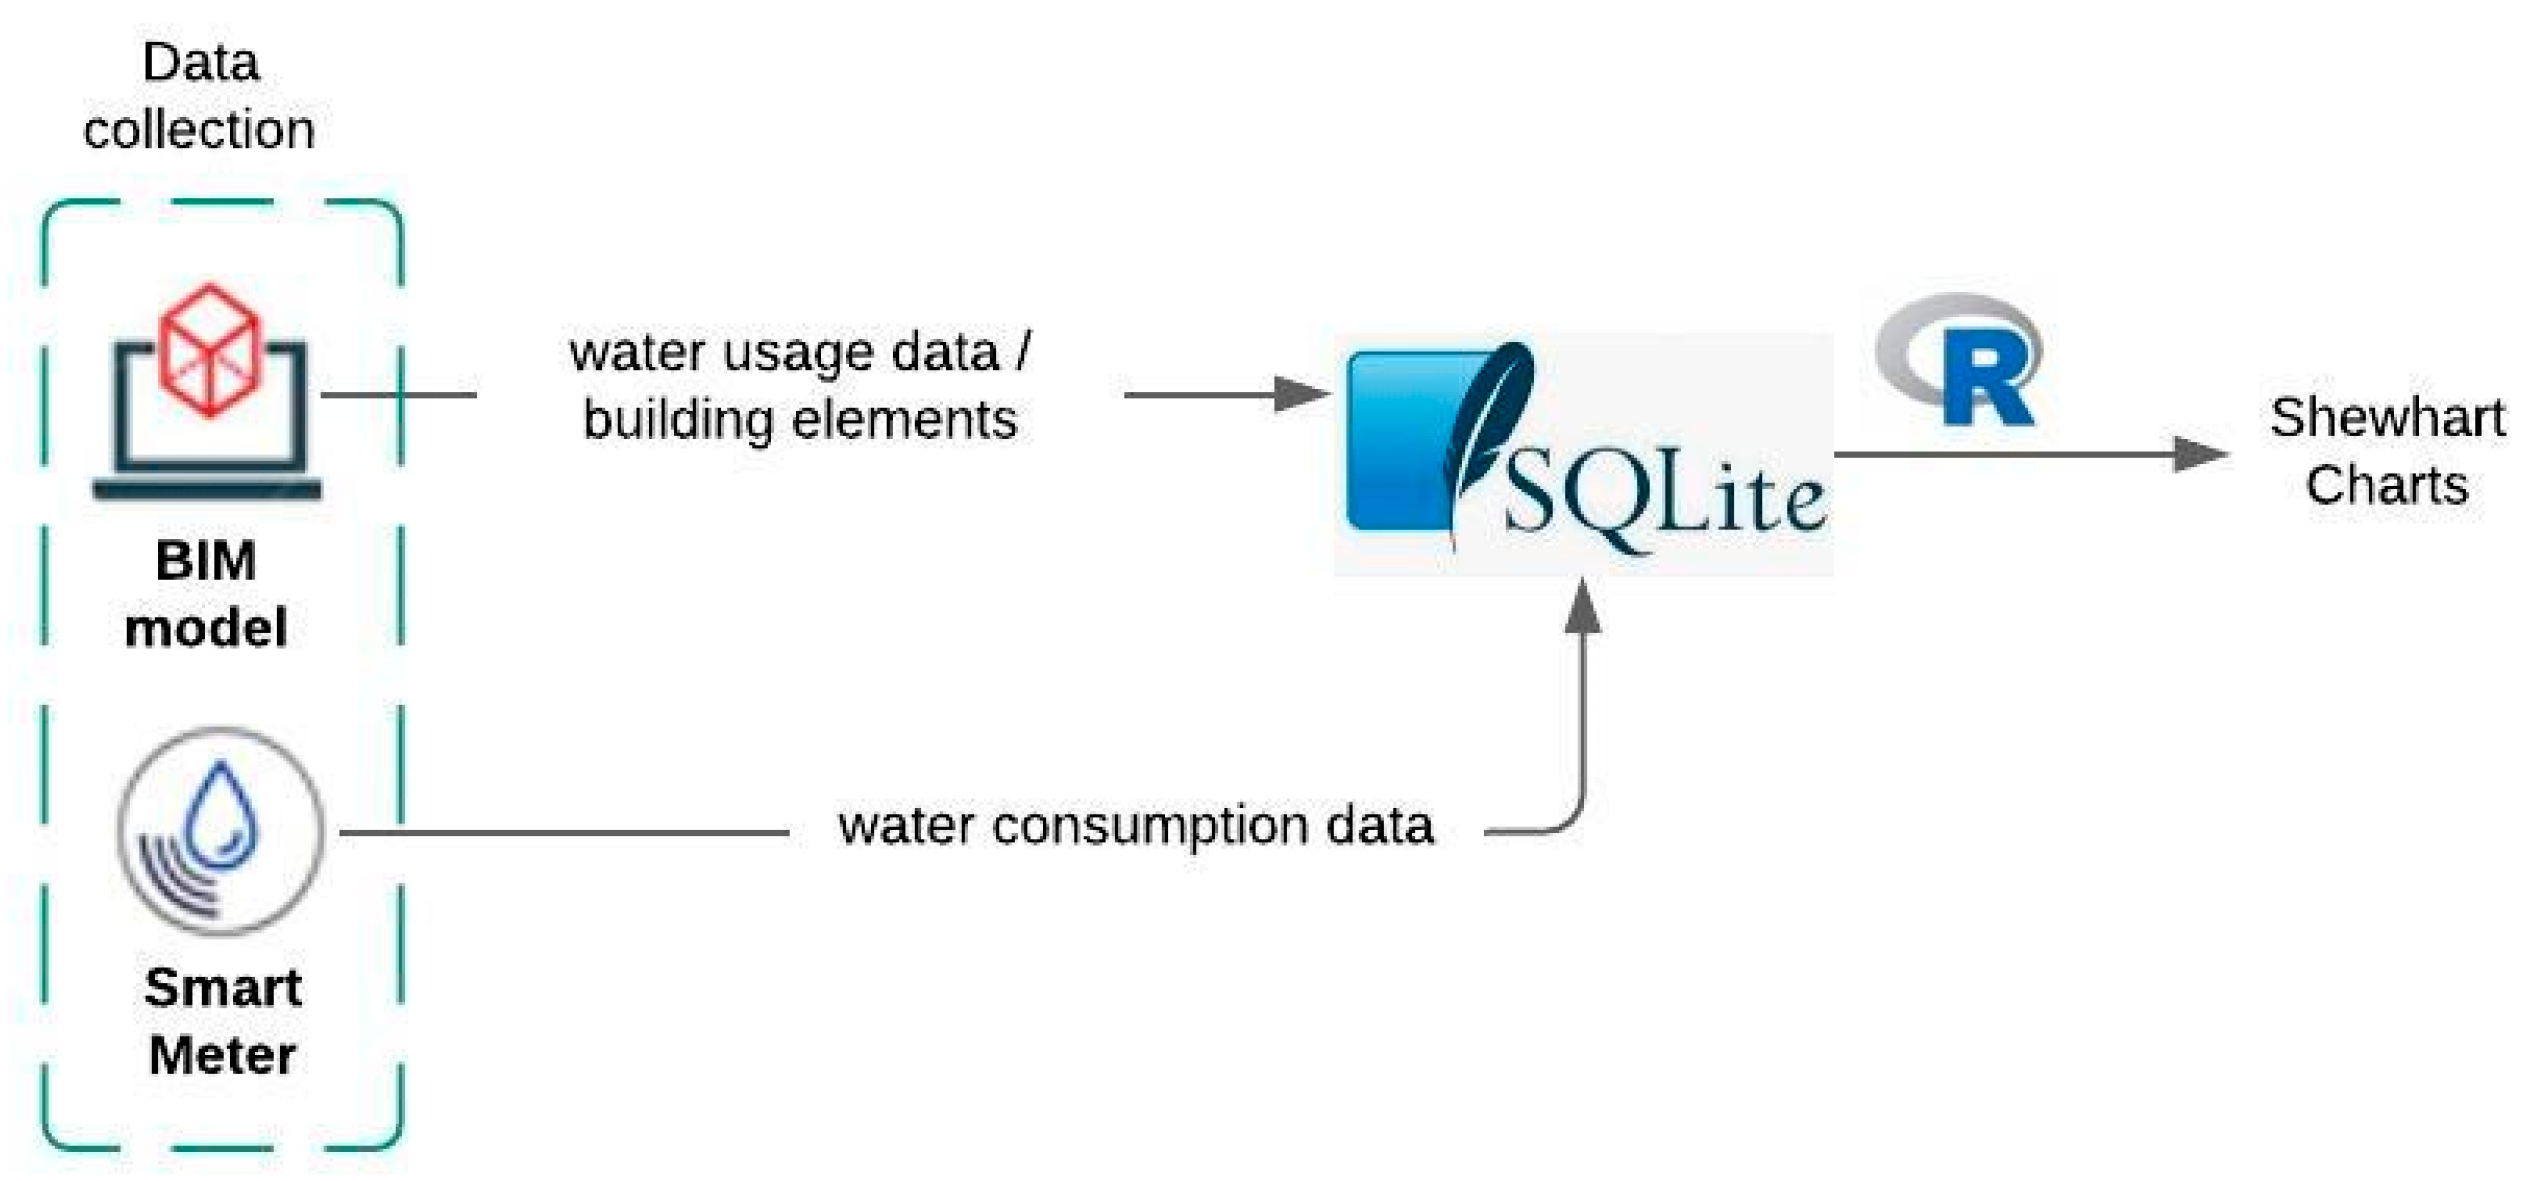
3.1.2. Data Capture (II)

The information necessary for the calculation of sustainable consumption indicators was captured by smart meters (SM) and had to be integrated and treated in BIM for subsequent use.
Figure 3 shows the information flow, which was modeled in a database to allow its reuse in the operation phase using the BIM methodology [33,34]. This research was conducted using Autodesk Revit platform to build the BIM. Consumption data were measured and stored in a cloud database, from which they could be collected and associated with BIM information.
Consumption data were accessed through a programming interface (API) provided by the smart meter (SM) manufacturer and stored in an SQLite database for easy manipulation. This database was chosen due to its ease of use and its suitability for simple operations. Furthermore, SQlite is open-source and allows the execution of operations using the SQL programming language [73]. Smart meters provided the following real-time data: consumption readings stored in liters, meter ID, and the date/time of reading.
Graphs for analyzing the results required access to and the use of data from two available sources. The integration of these data was performed using the information modeled in the SQlite database. The smart meter consumption data were associated with BIM information for each registered store. A specific function was developed to sort the data by date, activity category, name, and store area. The results were exported to a free software environment called “R” for statistical computing, which then plotted control charts.

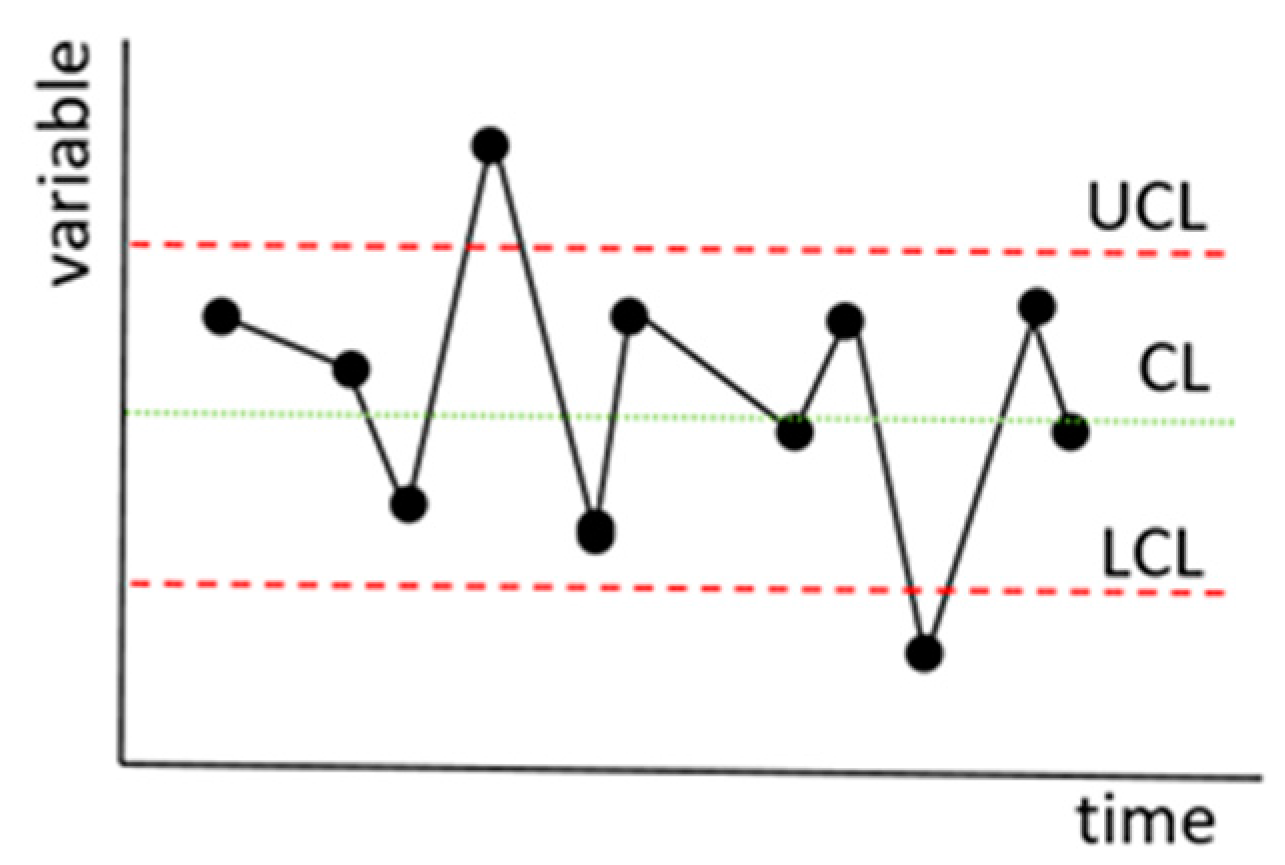
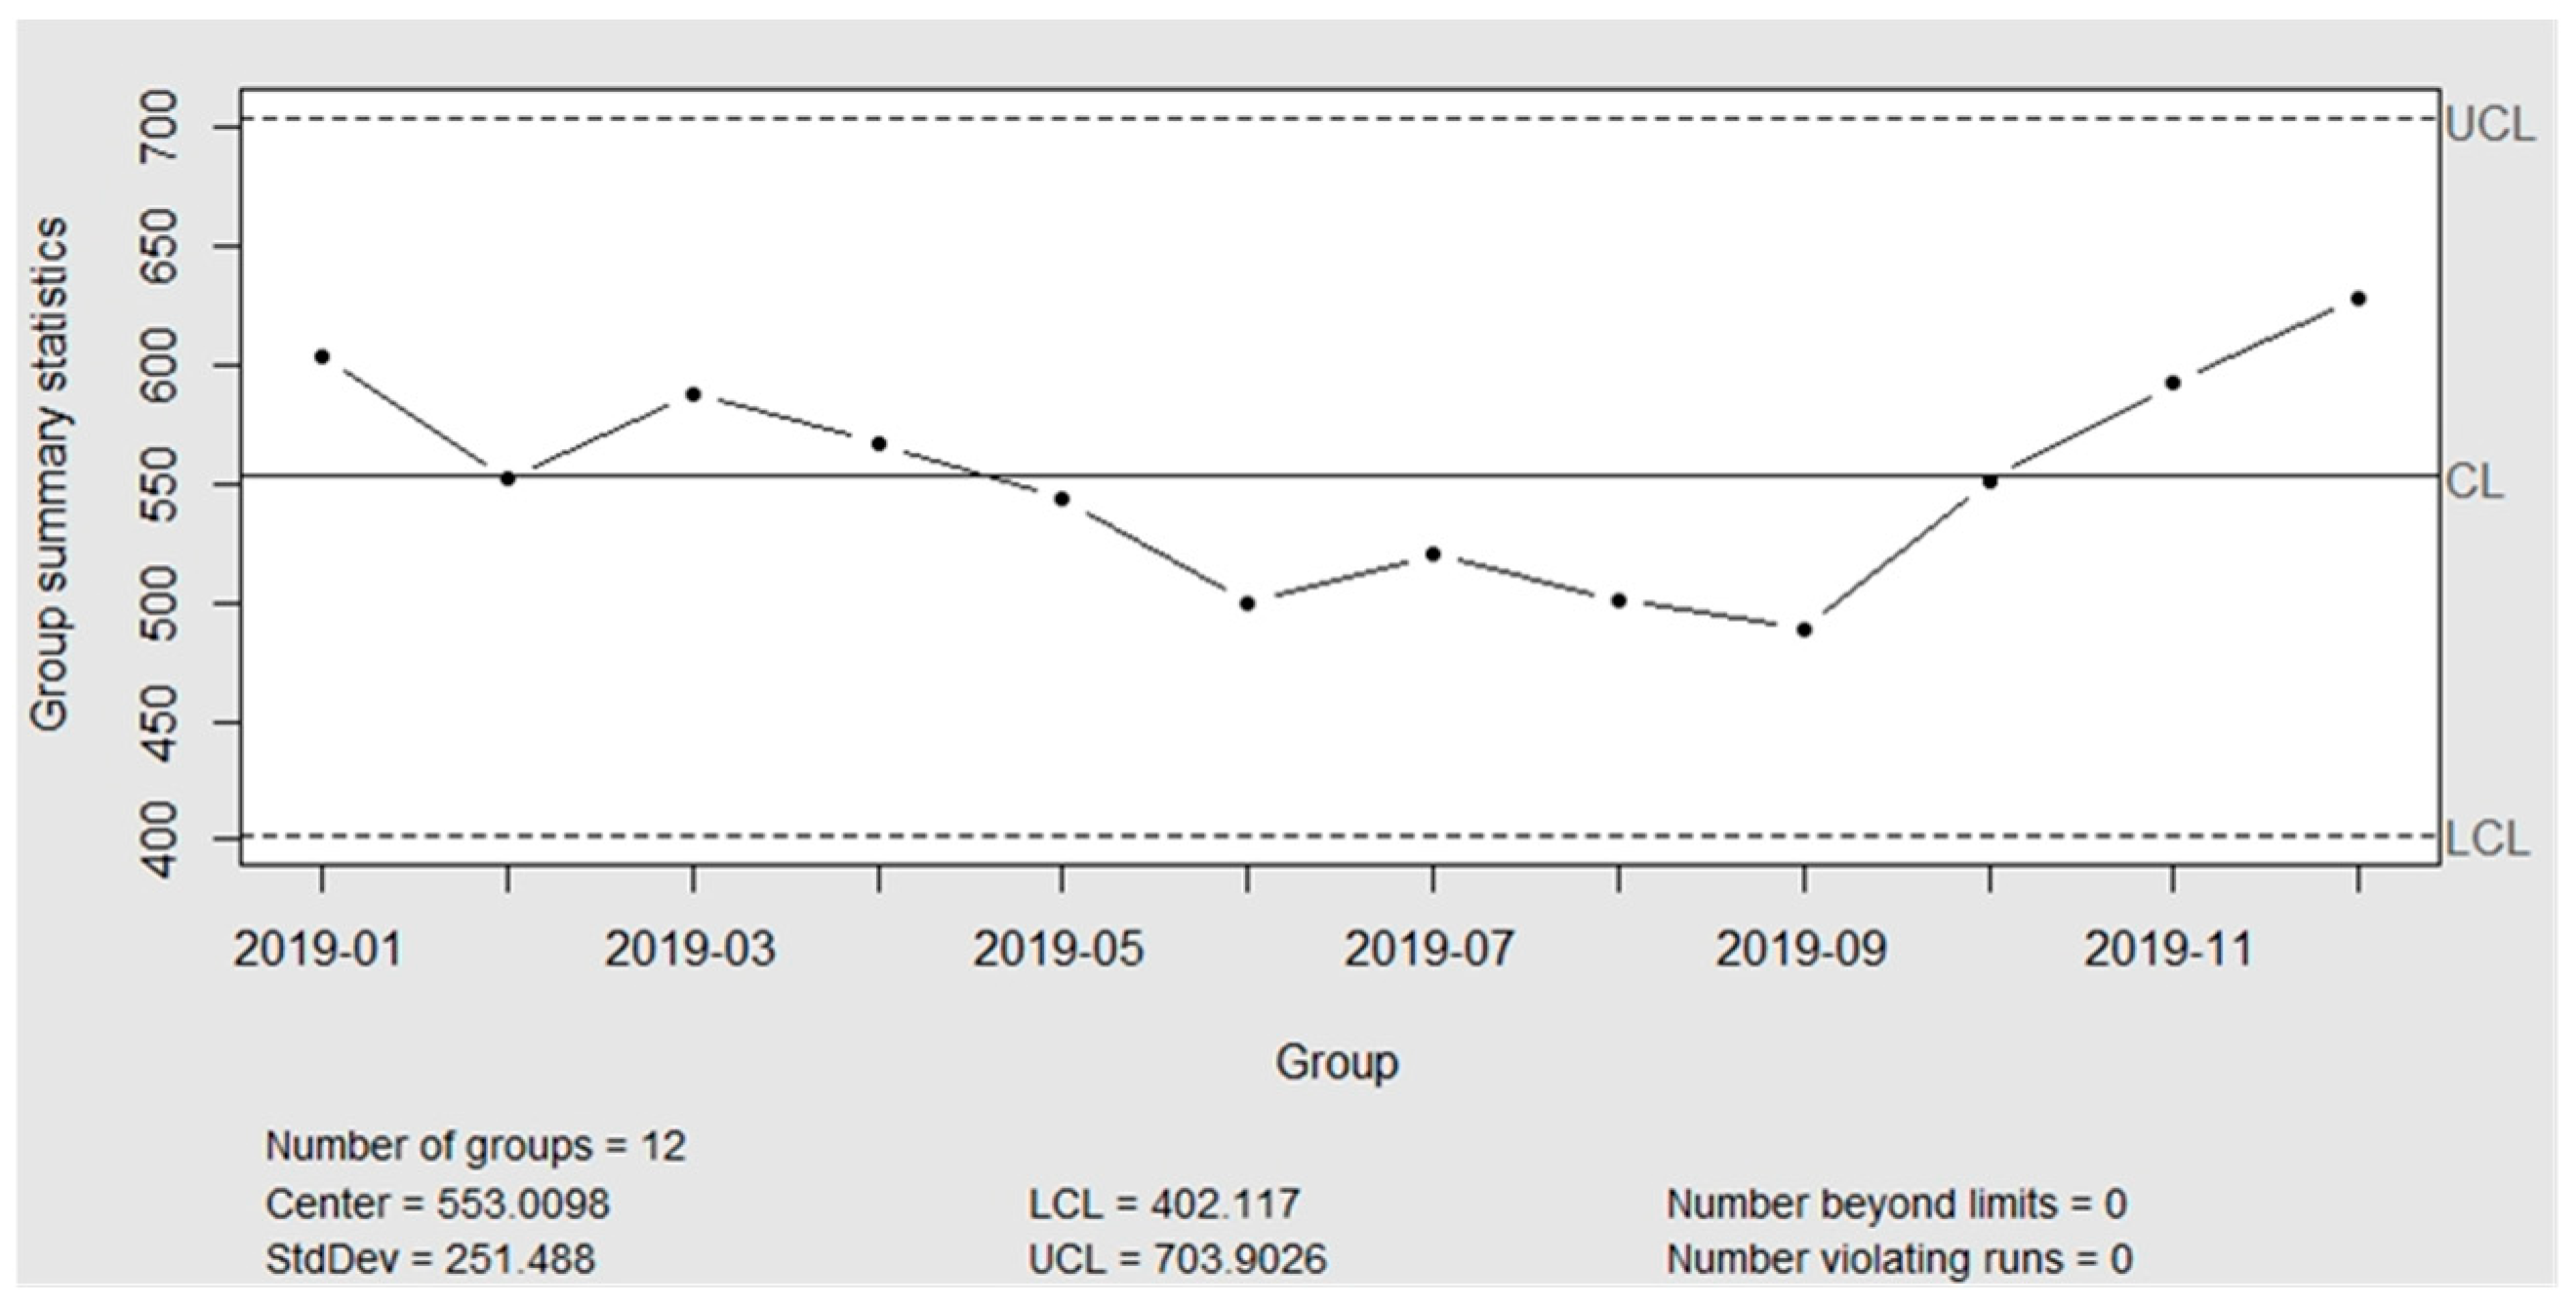
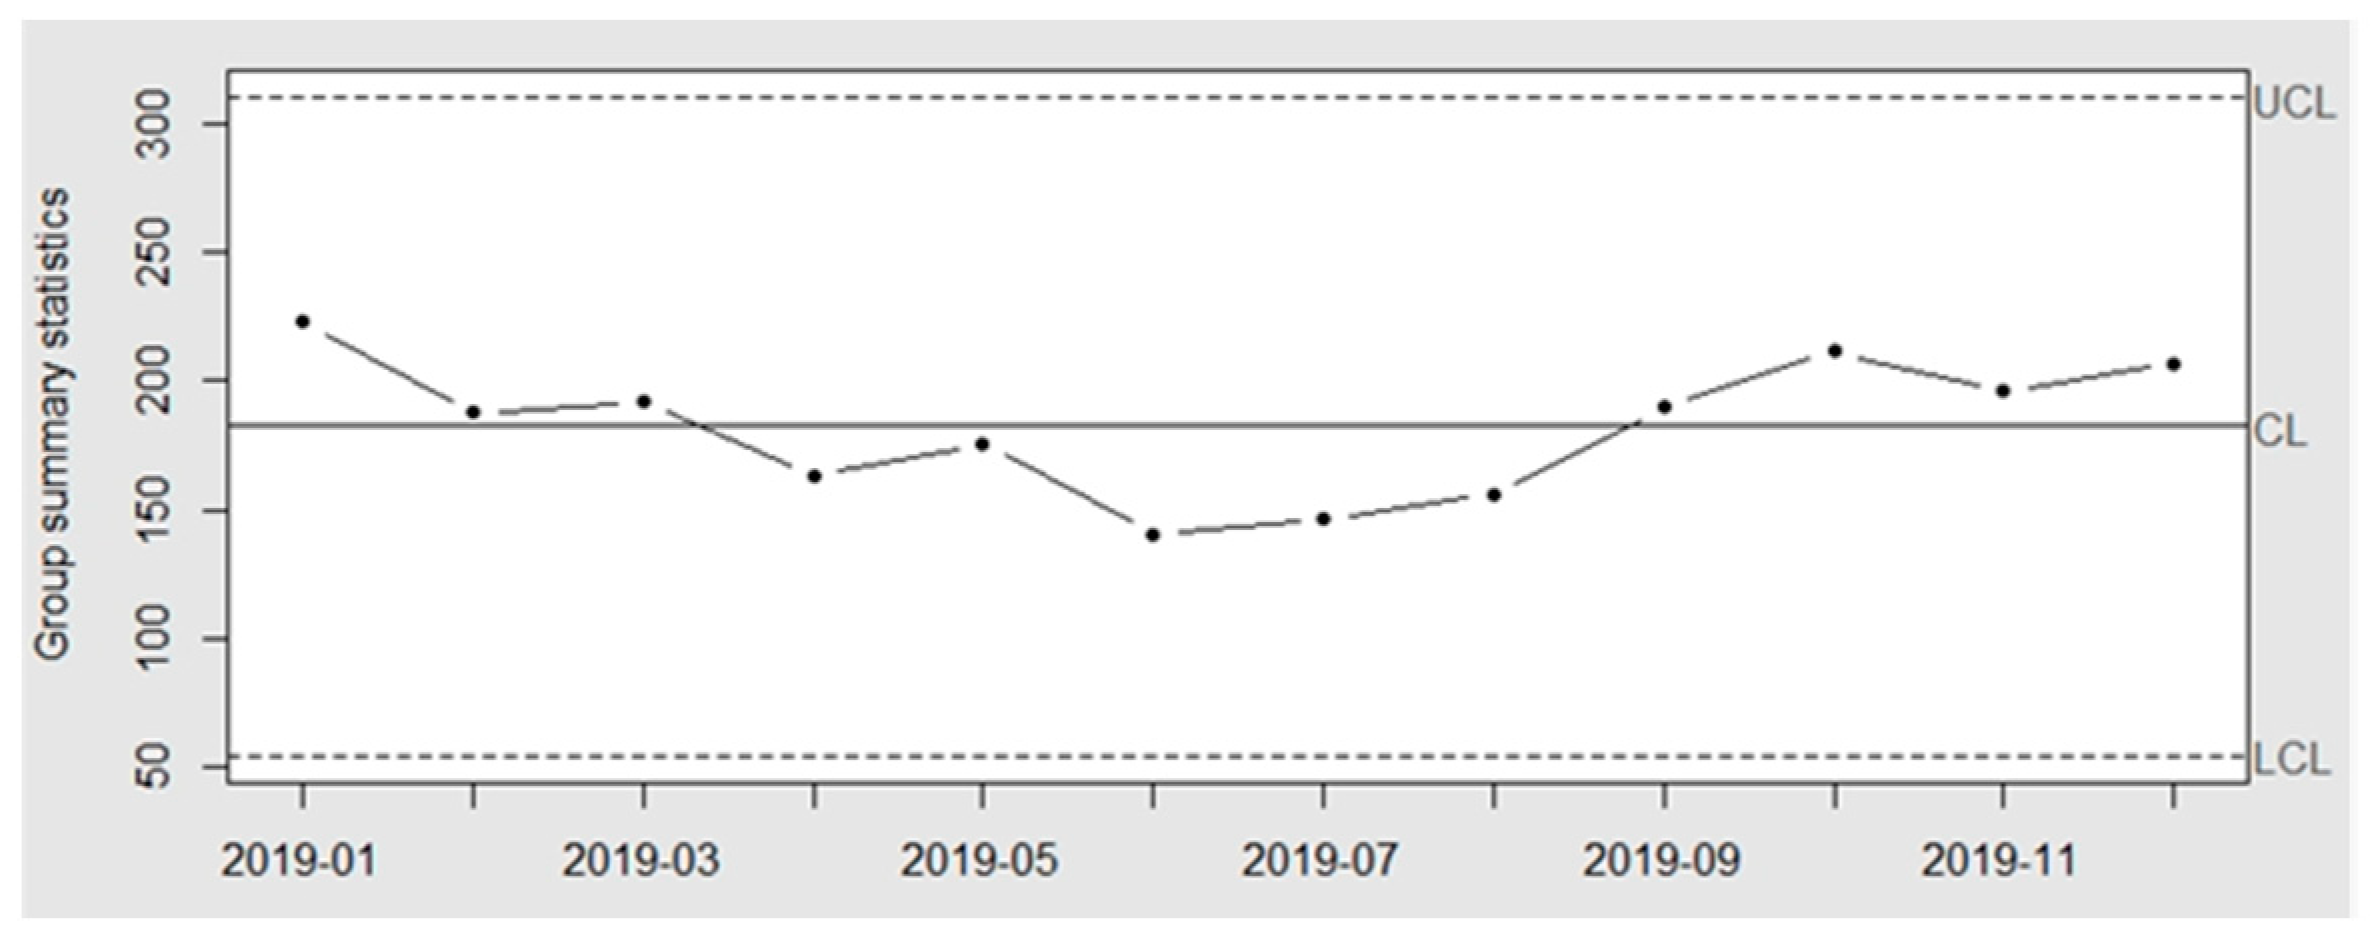
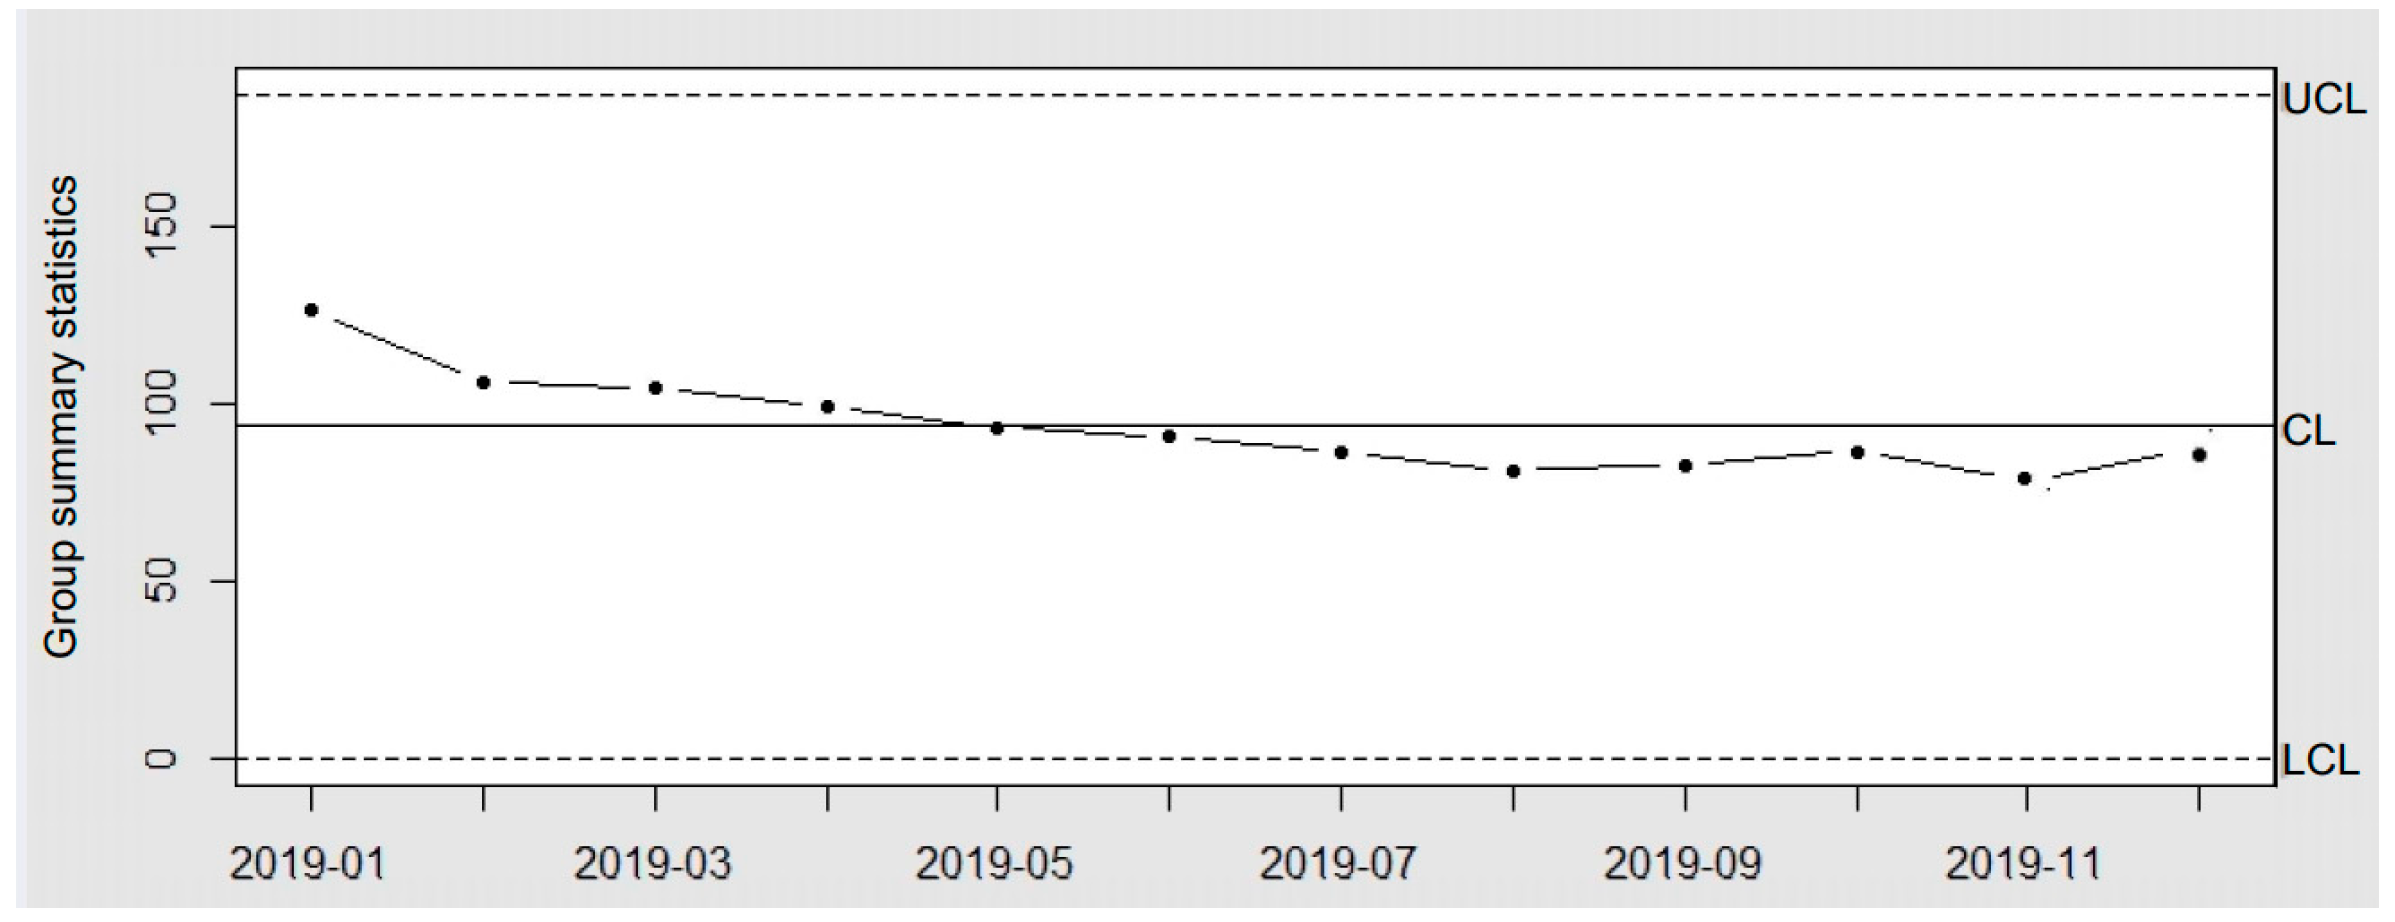
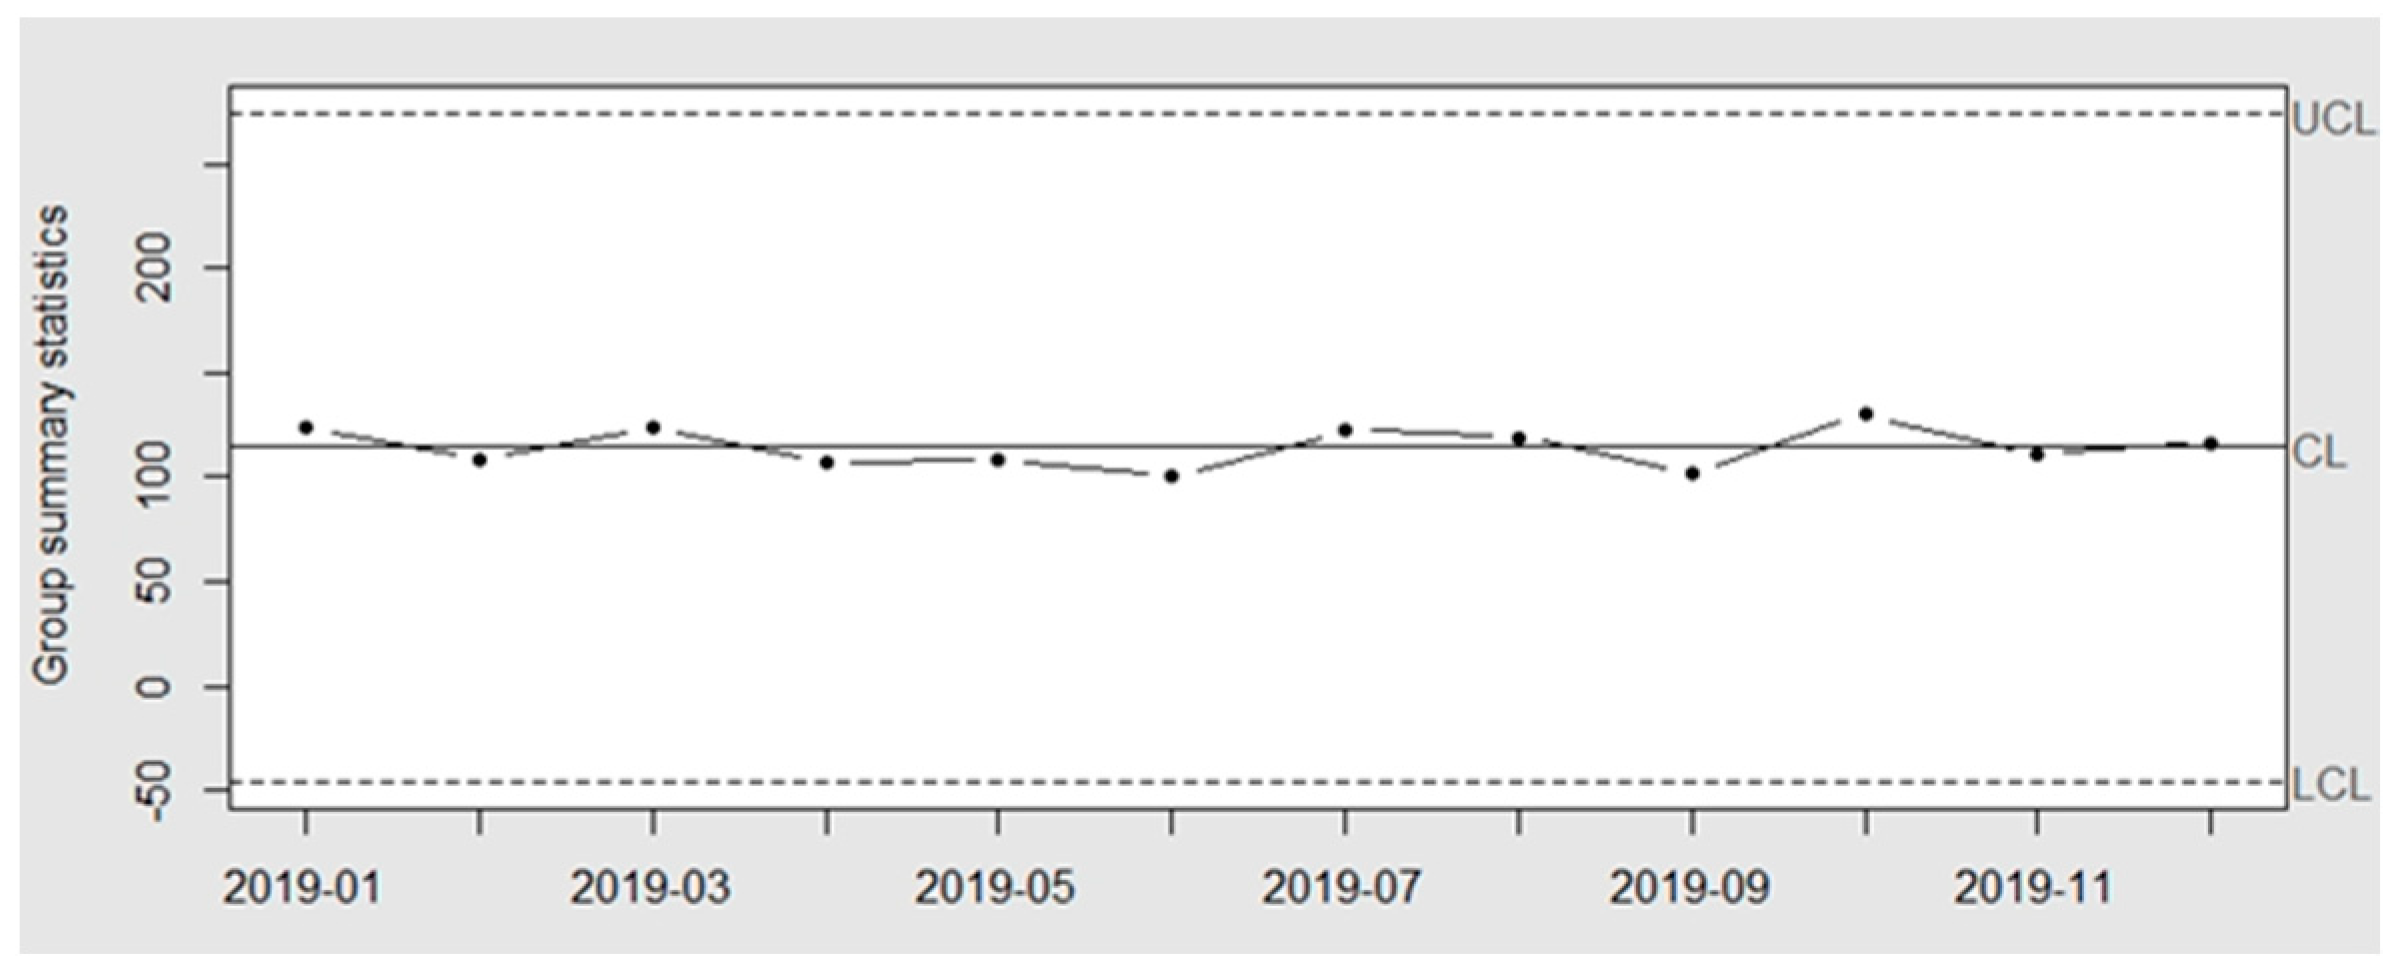
3.1.3. Shewhart Chart (III)

Control charts were plotted based on the CL, LCL, and UCL, as shown in Figure 1. The amplitude of the limits varied according to the standard deviation value used in the calculations. The present research used the three-sigma value (3σ) of amplitude, which is the default value used for practical applications and scientific research [74].
The consumption data used for the analyses corresponded to the period of one year. The graphs were plotted using the R statistical software environment. The R software environment is an integrated package for data manipulation, calculation, and graphical display tools. It included open-source code and package libraries that offered different functionality and had a simple programming language that allowed customization using scripts [75]. R has been a popular tool in the scientific community [76] and has been commonly used in academic studies [77]. In this research, the quality control charts (qcc) package from the R environment [78] was used to perform the statistical process control (SPC) functions, draw Shewhart charts, and to determine sustainable consumption indicators.
The reference unit L/m2 was adopted to standardize the analyses and reduce the number of variables involved. The sustainable consumption indicators calculated were proportional to the area of the stores, enabling comparisons between stores of different sizes within the same activity category. The database was analyzed by an SQLite script. This script divided each store’s water consumption (L) by its area (m2), identified and removed outliers in the variability graph, and then generated X ¯ graphs based on the calculated values of the CL, UCL, and LCL. Figure 4 shows an X ¯ chart model. The x-axis represents the analyzed months, and the y-axis represents the average water consumption corresponding to samples of stores in certain categories.

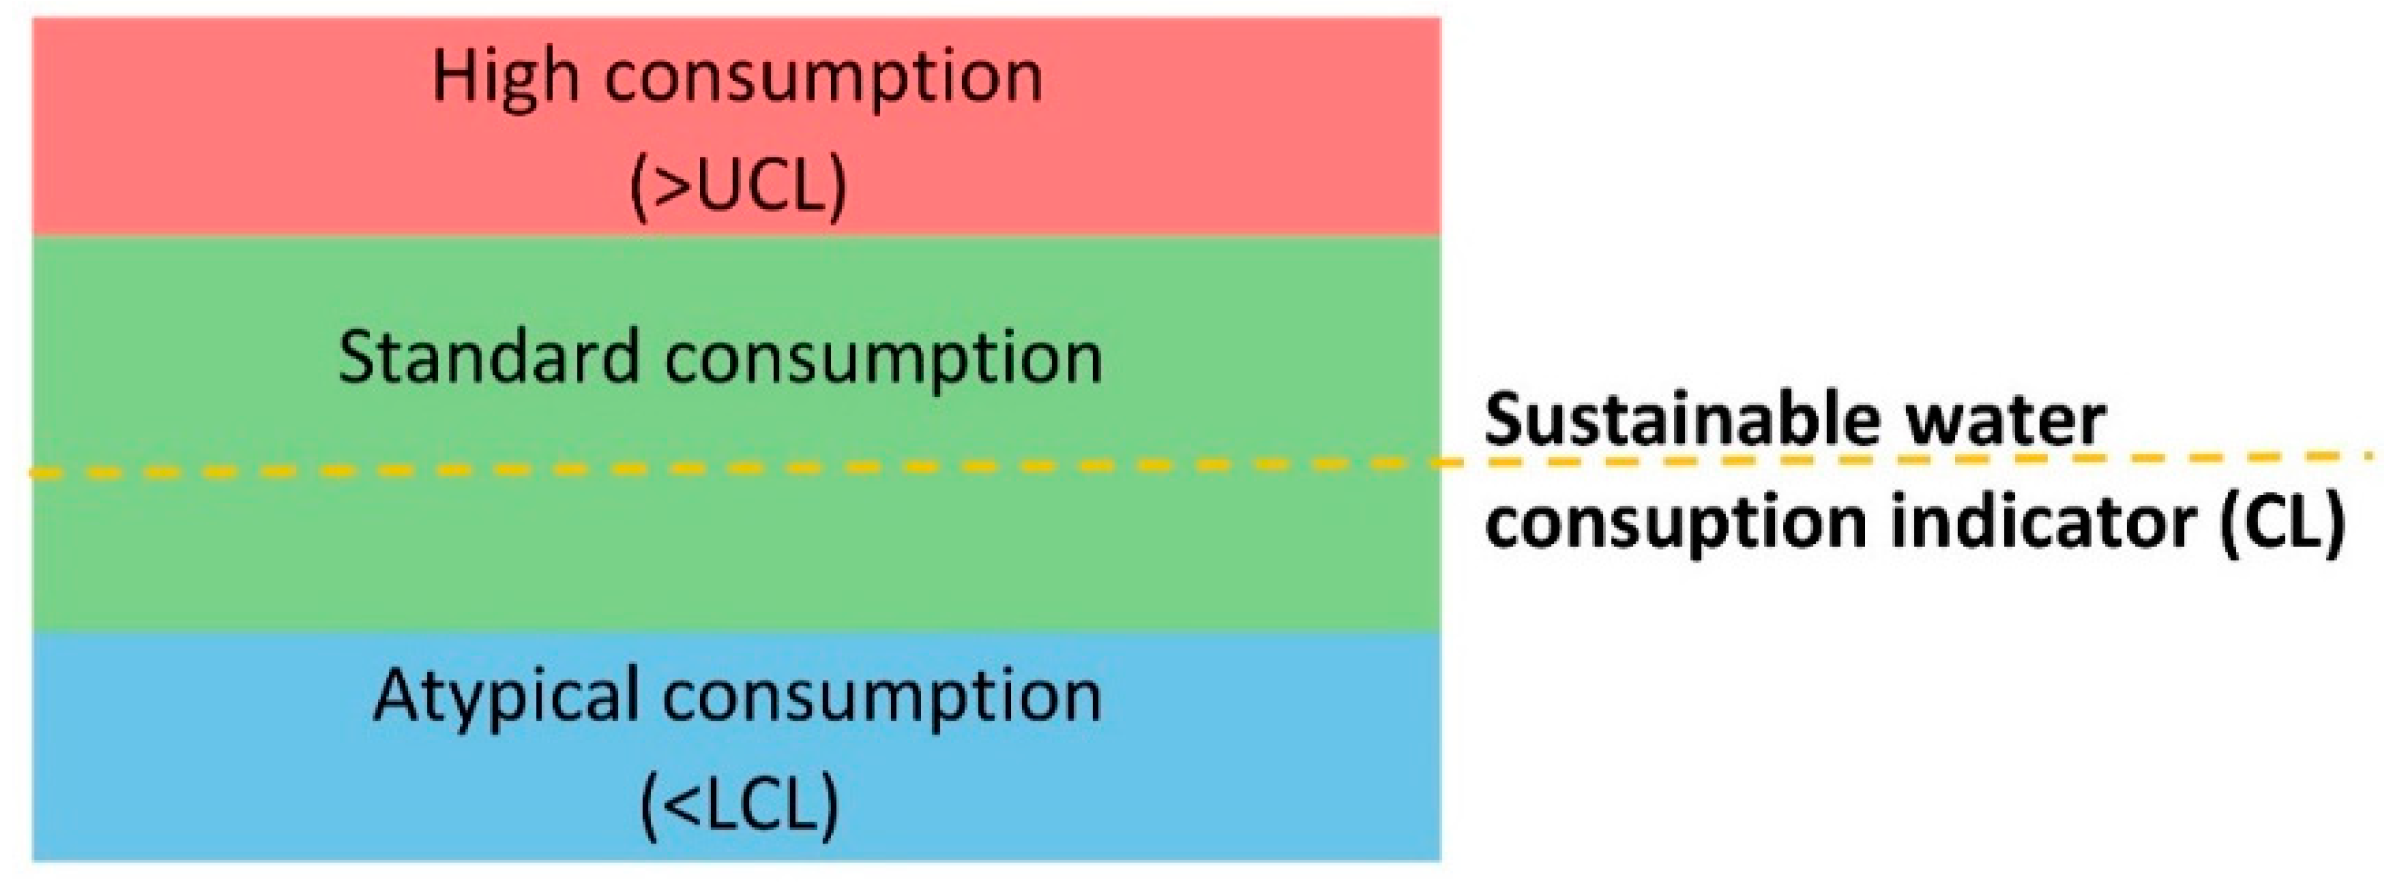
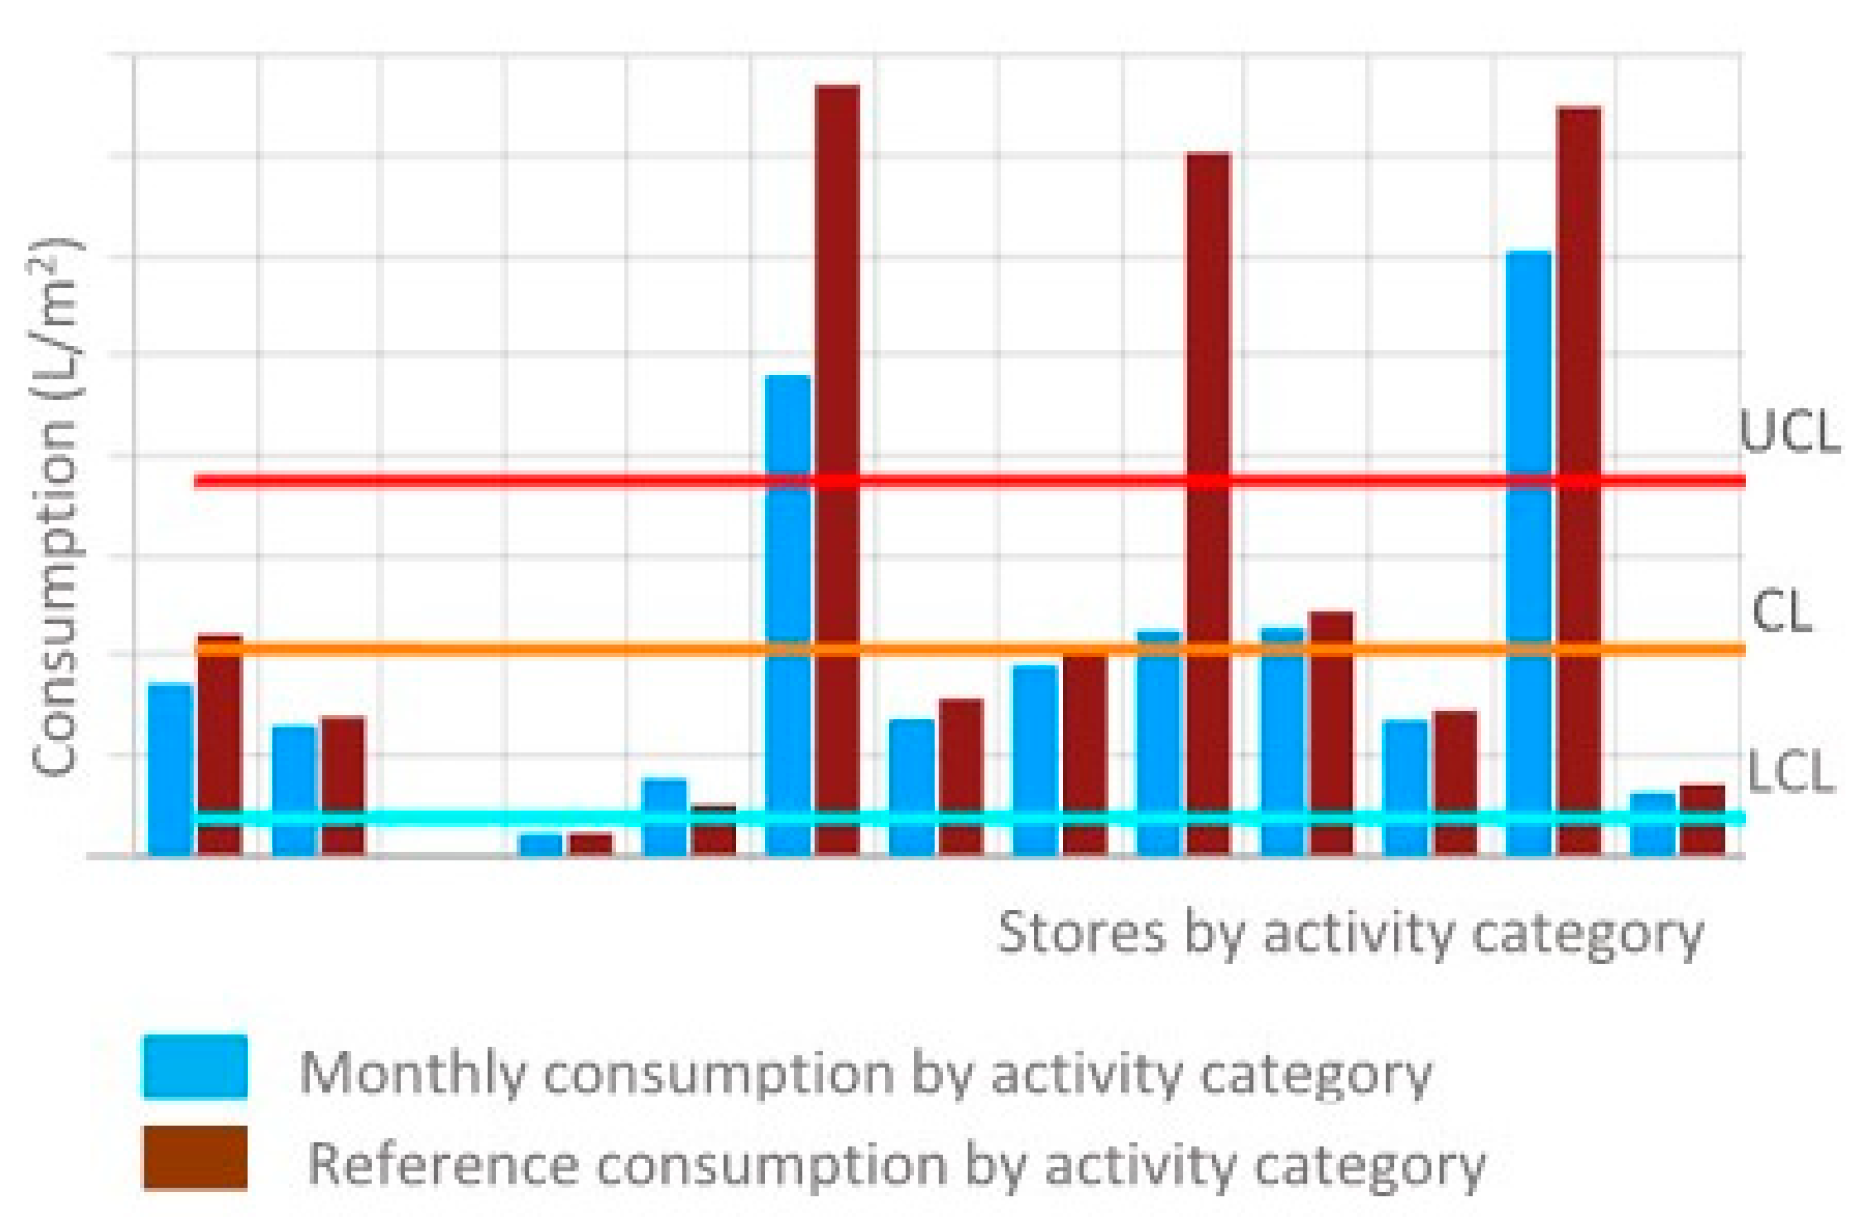
3.1.4. Sustainable Water Consumption Indicators (IV)

For this research, the CL in Figure 5 determined the reference value, which was used as the sustainable consumption indicator for each category. The control limit values defined the consumption ranges: high, standard, and atypical.
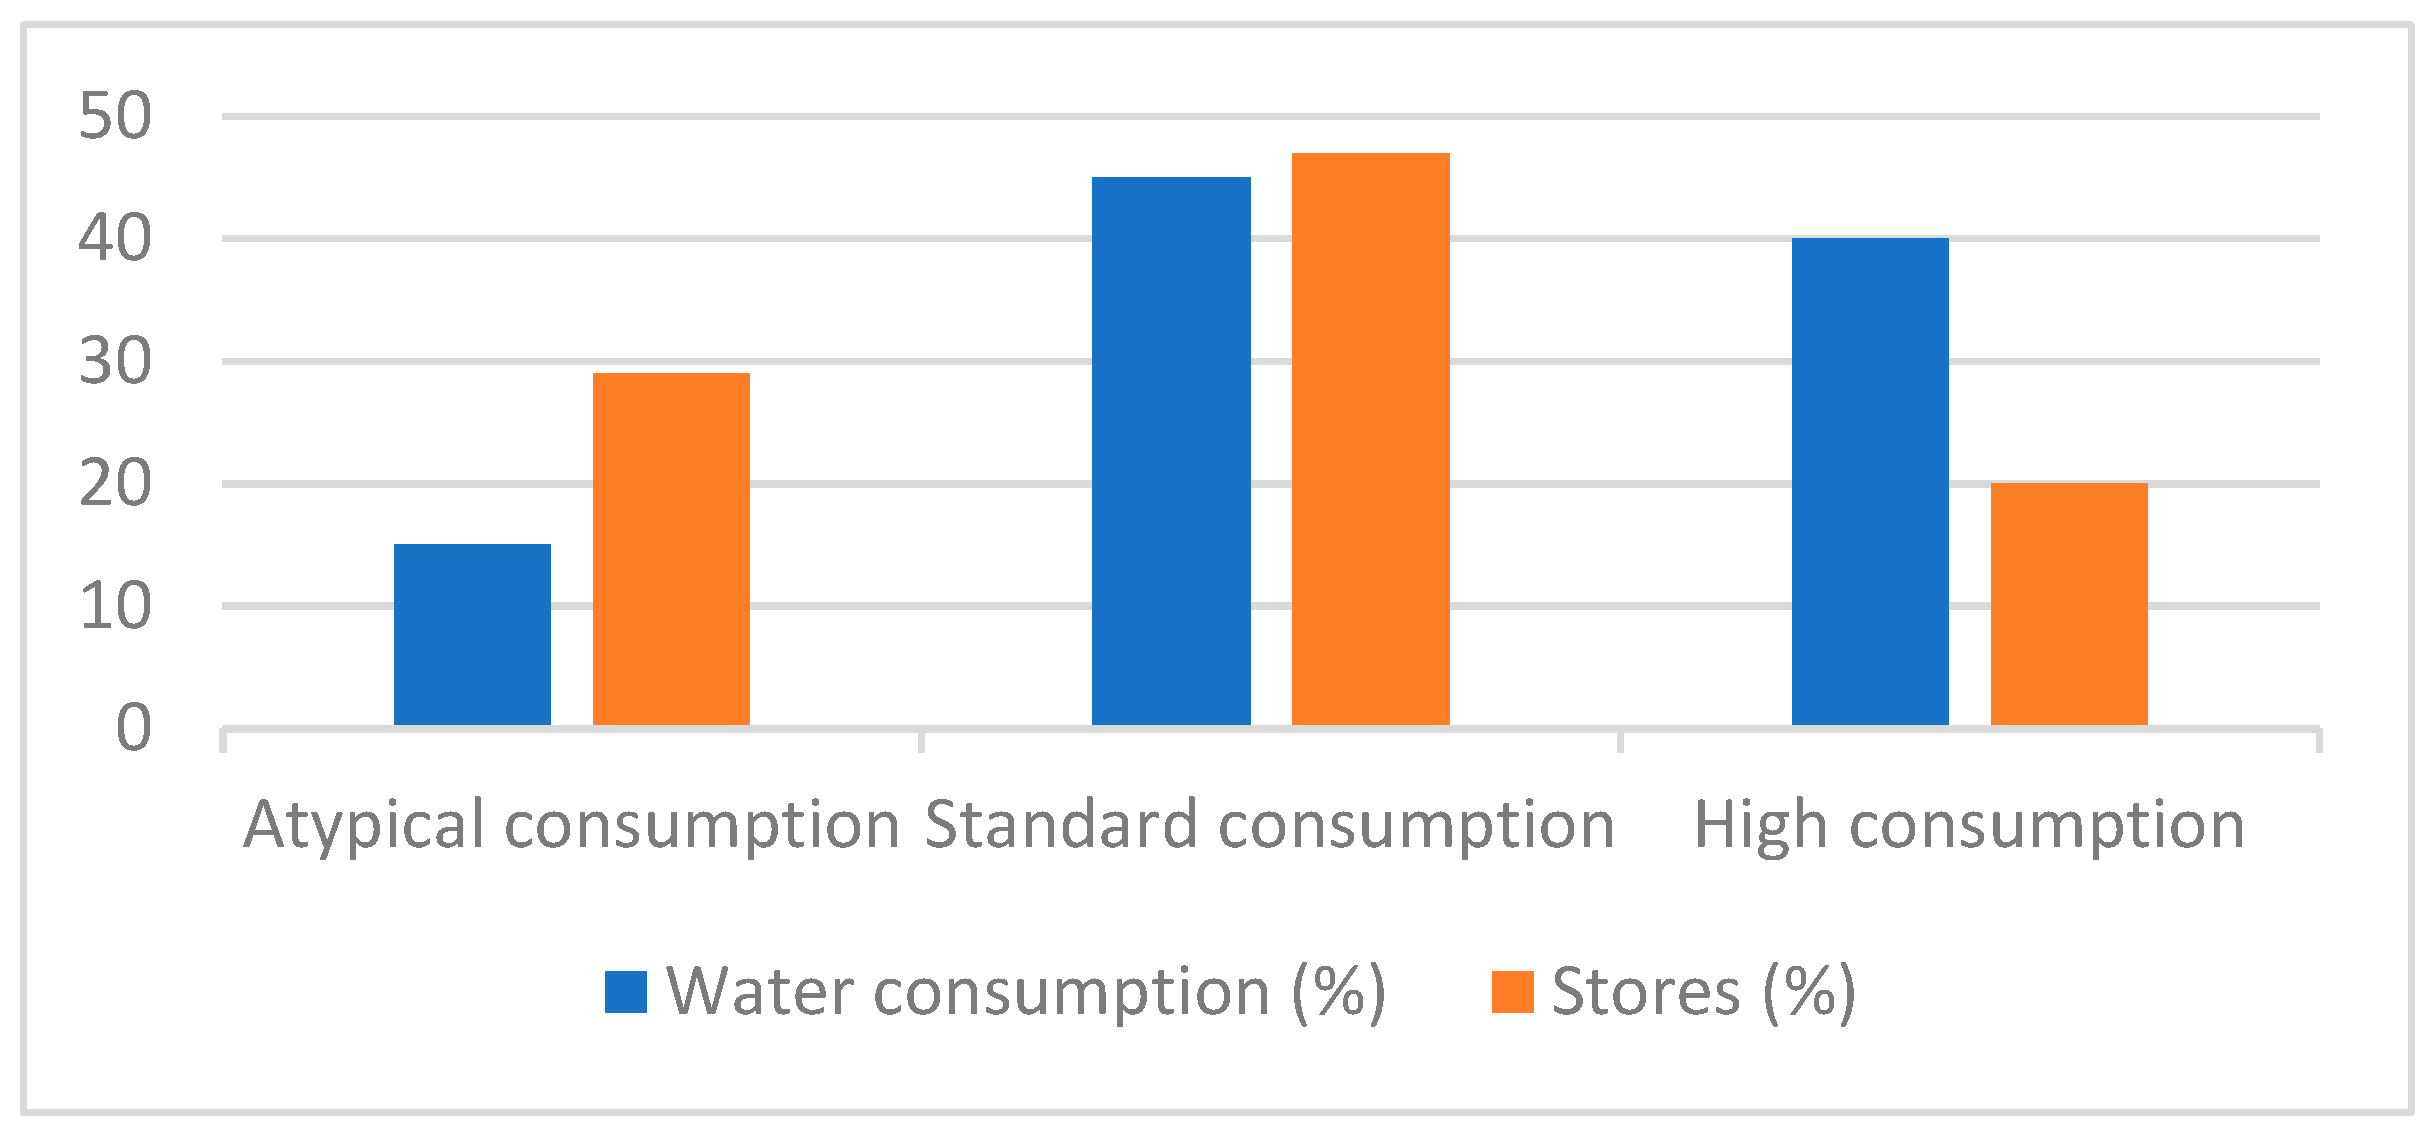
  • High-consumption range—values above the UCL indicated excessive water consumption.
  • Standard-consumption range—values between the UCL and the LCL indicated consumption within the standard range.
  • Atypical-consumption range—values below the LCL indicated unexpectedly low consumption, which should be analyzed (e.g., closed store).
The definition of these bands and the determination of sustainable consumption indicators allowed the development of graphic functionalities to automate and facilitate water management. Specifically, these functionalities were designed to produce, analyze, and interpret consumption information associated with each store and activity category. The analyses used the color pattern, as shown in Figure 5, to facilitate data interpretation. The red, green, and blue colors represent the high-, standard-, and atypical-consumption ranges, respectively.

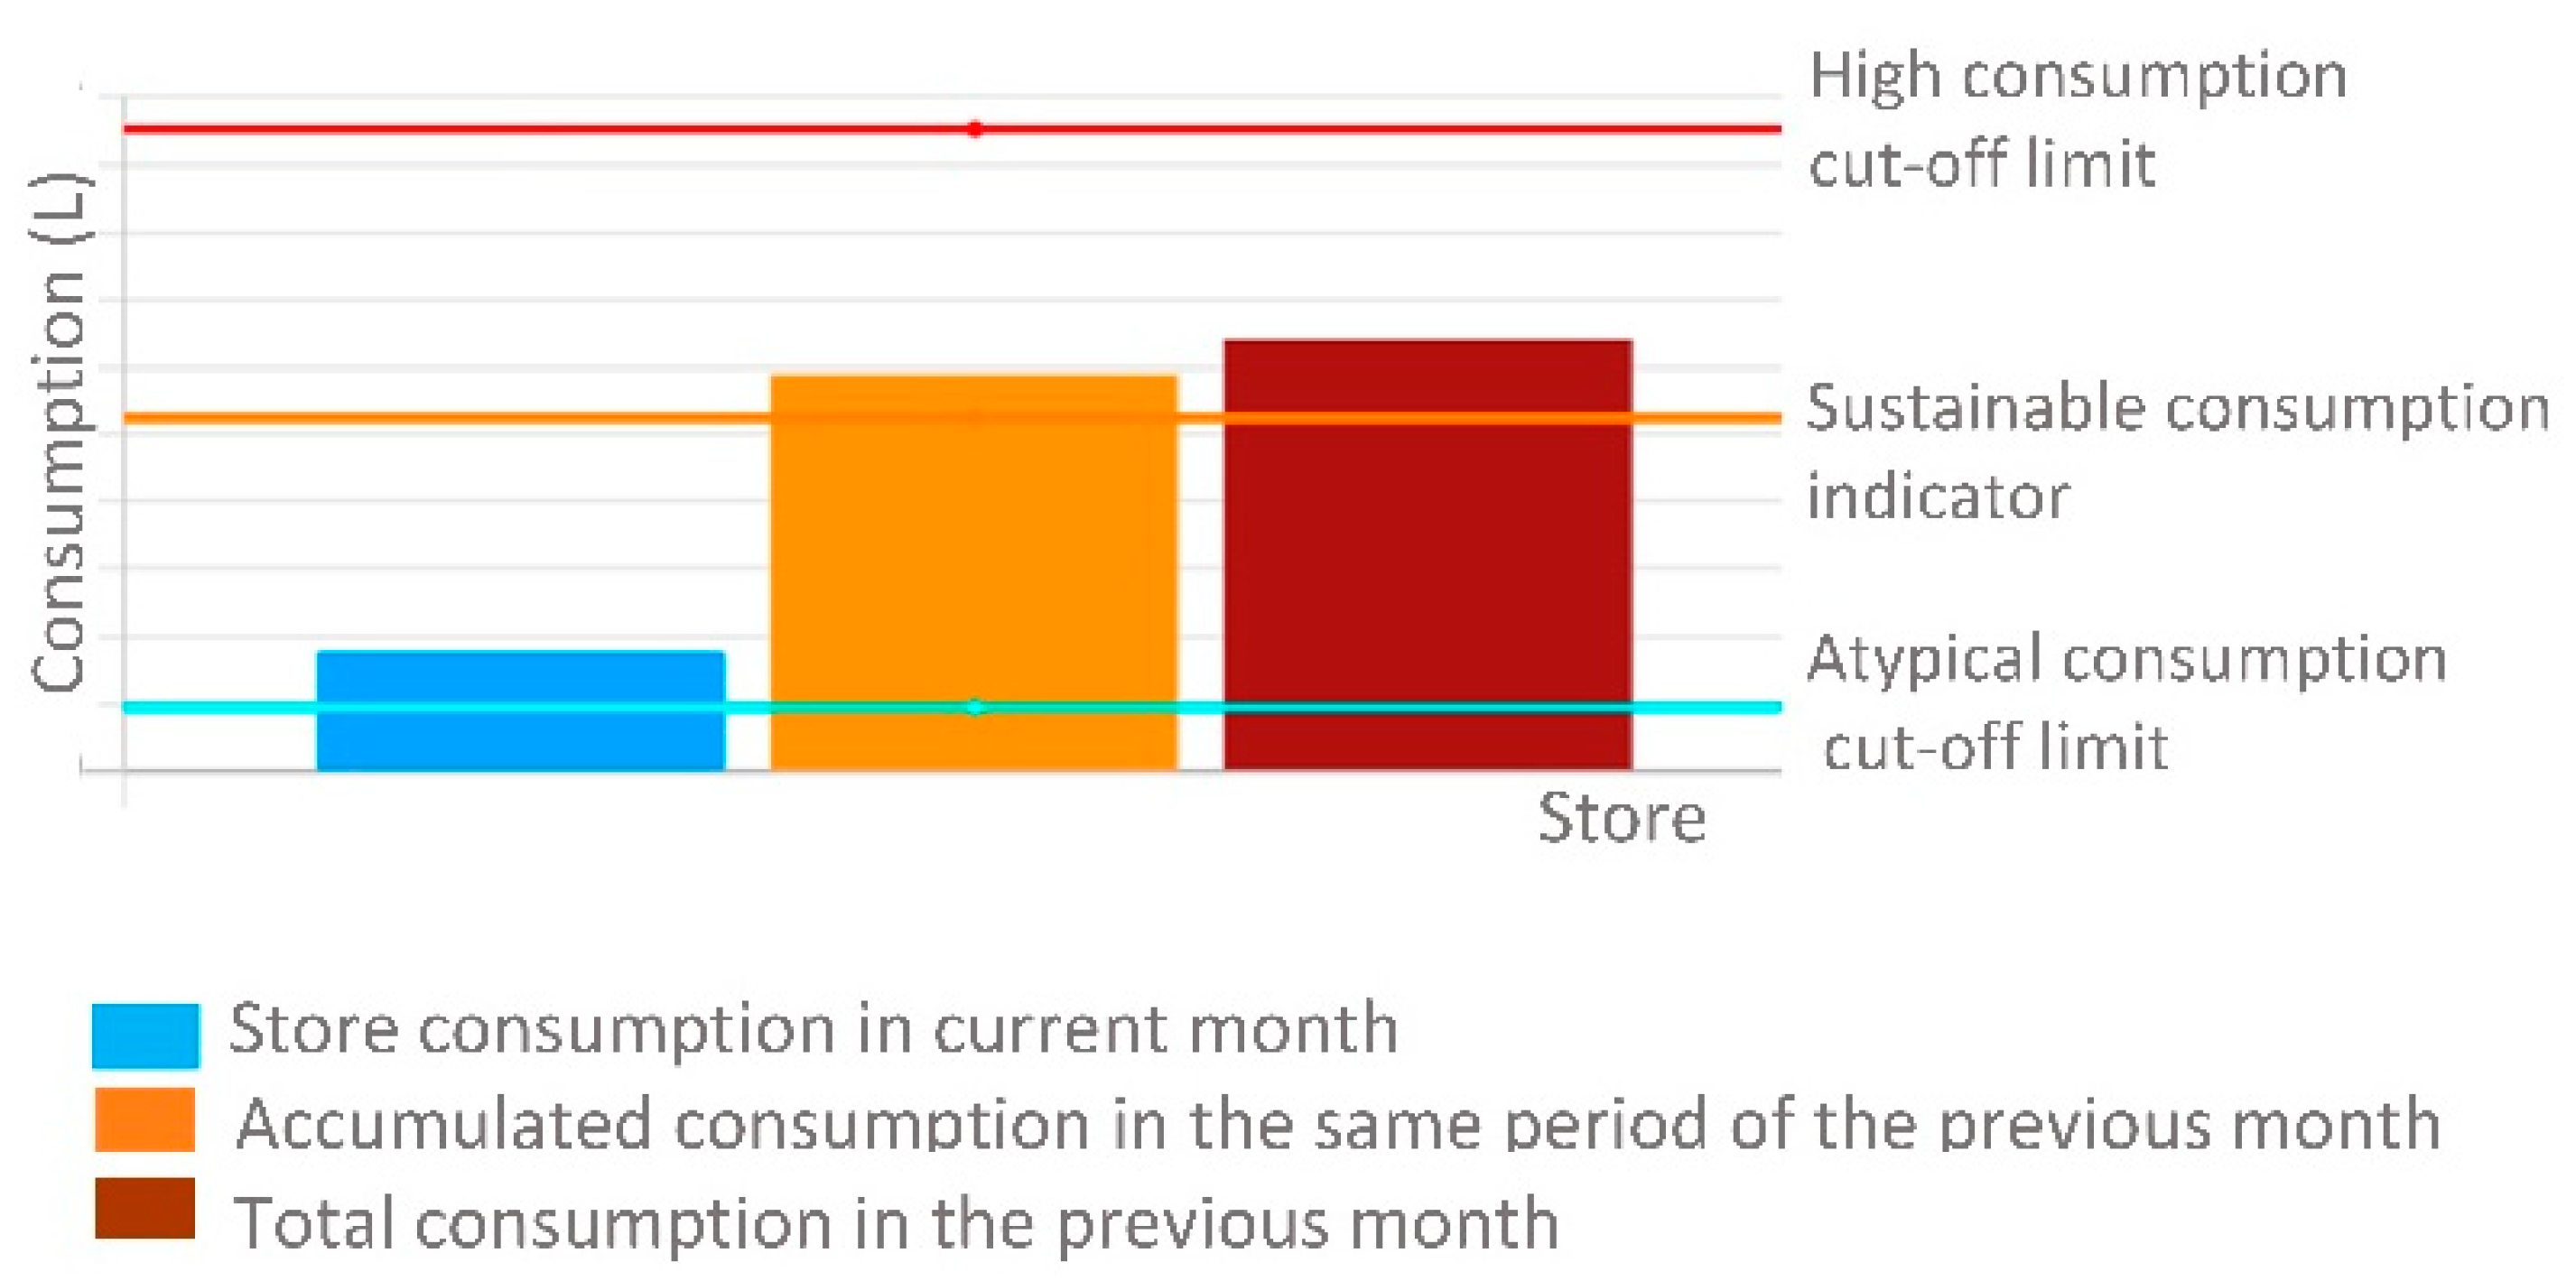
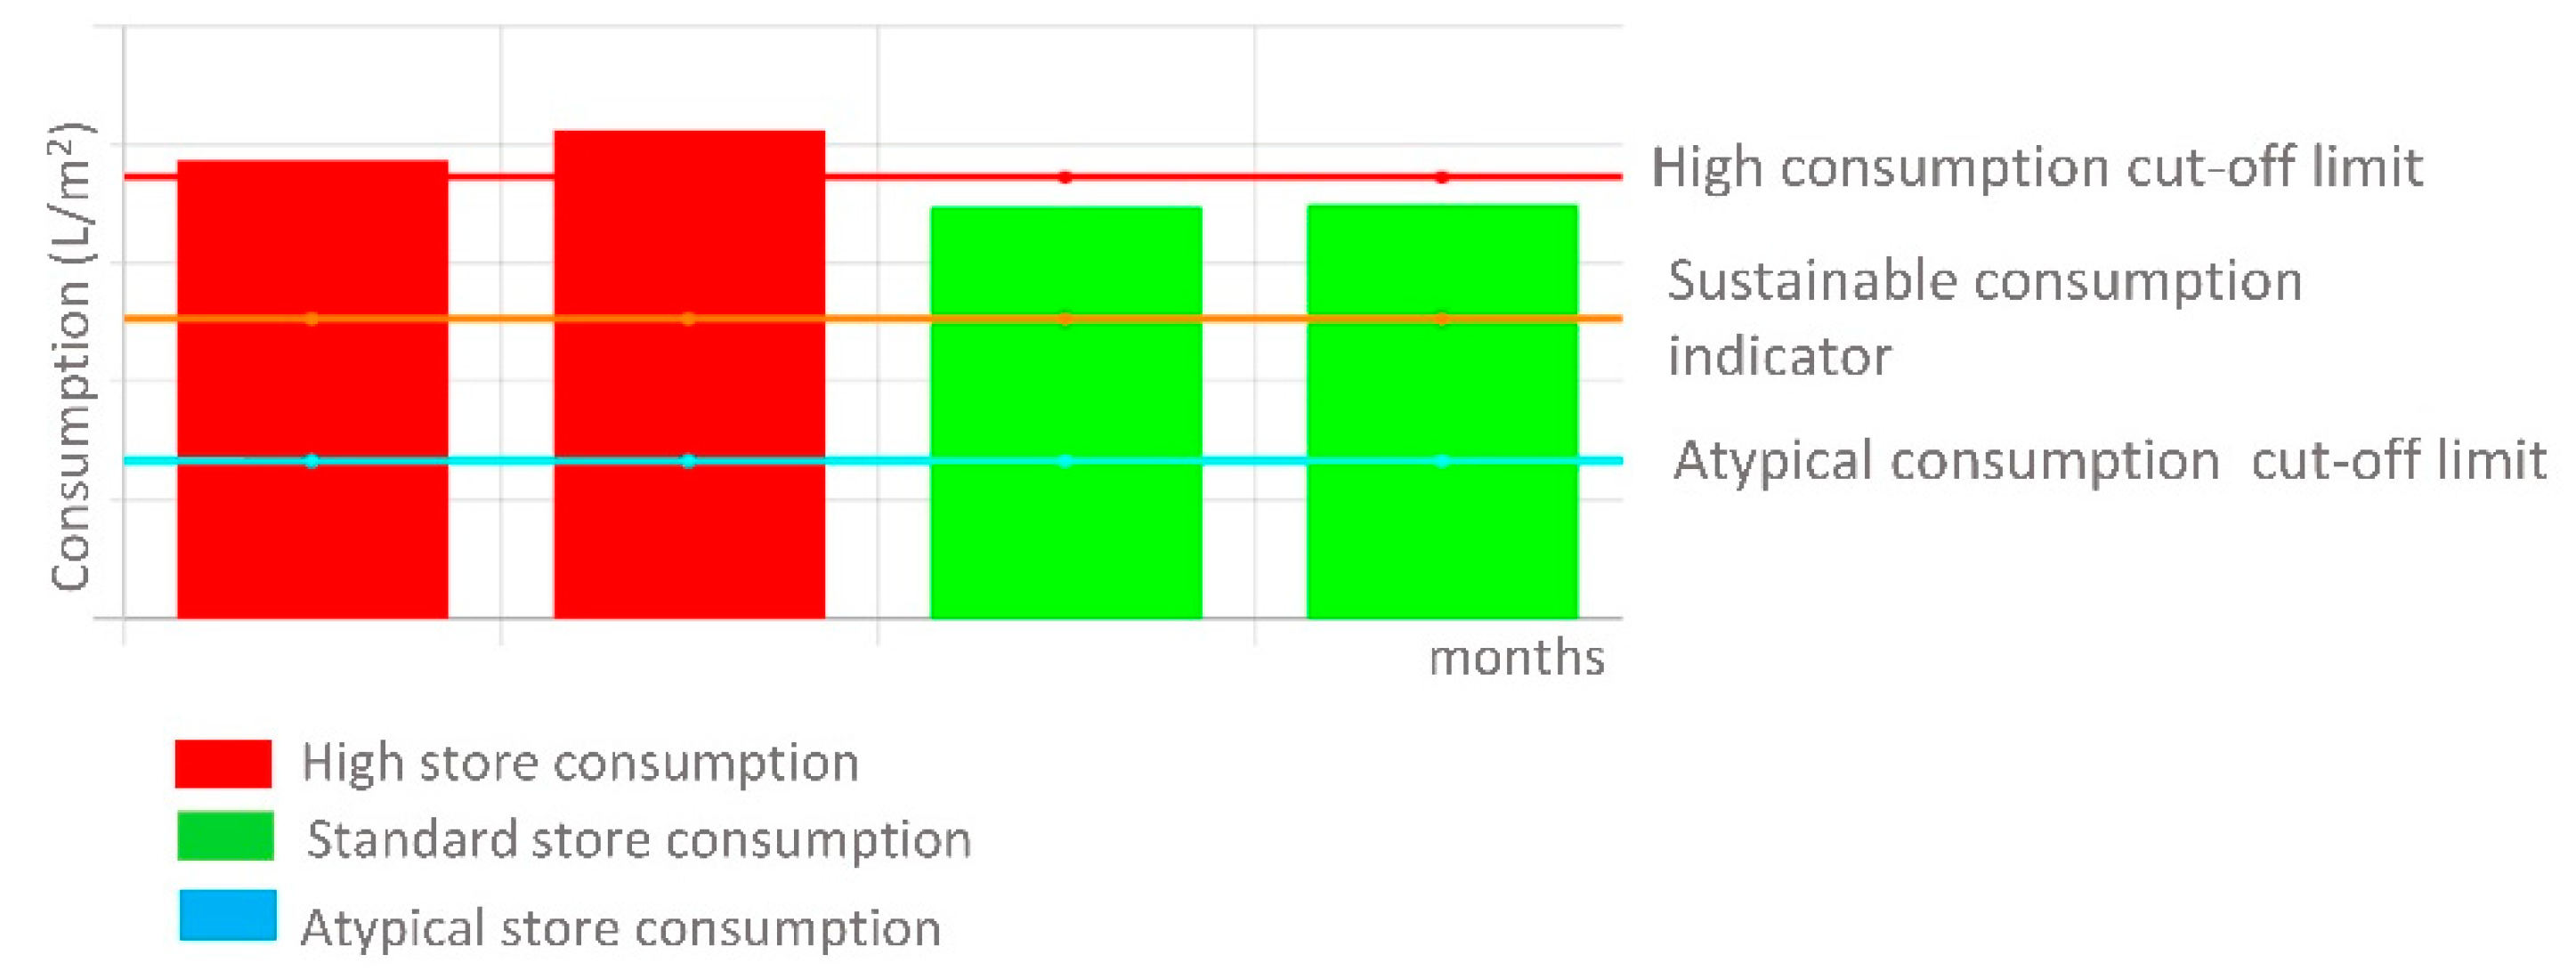
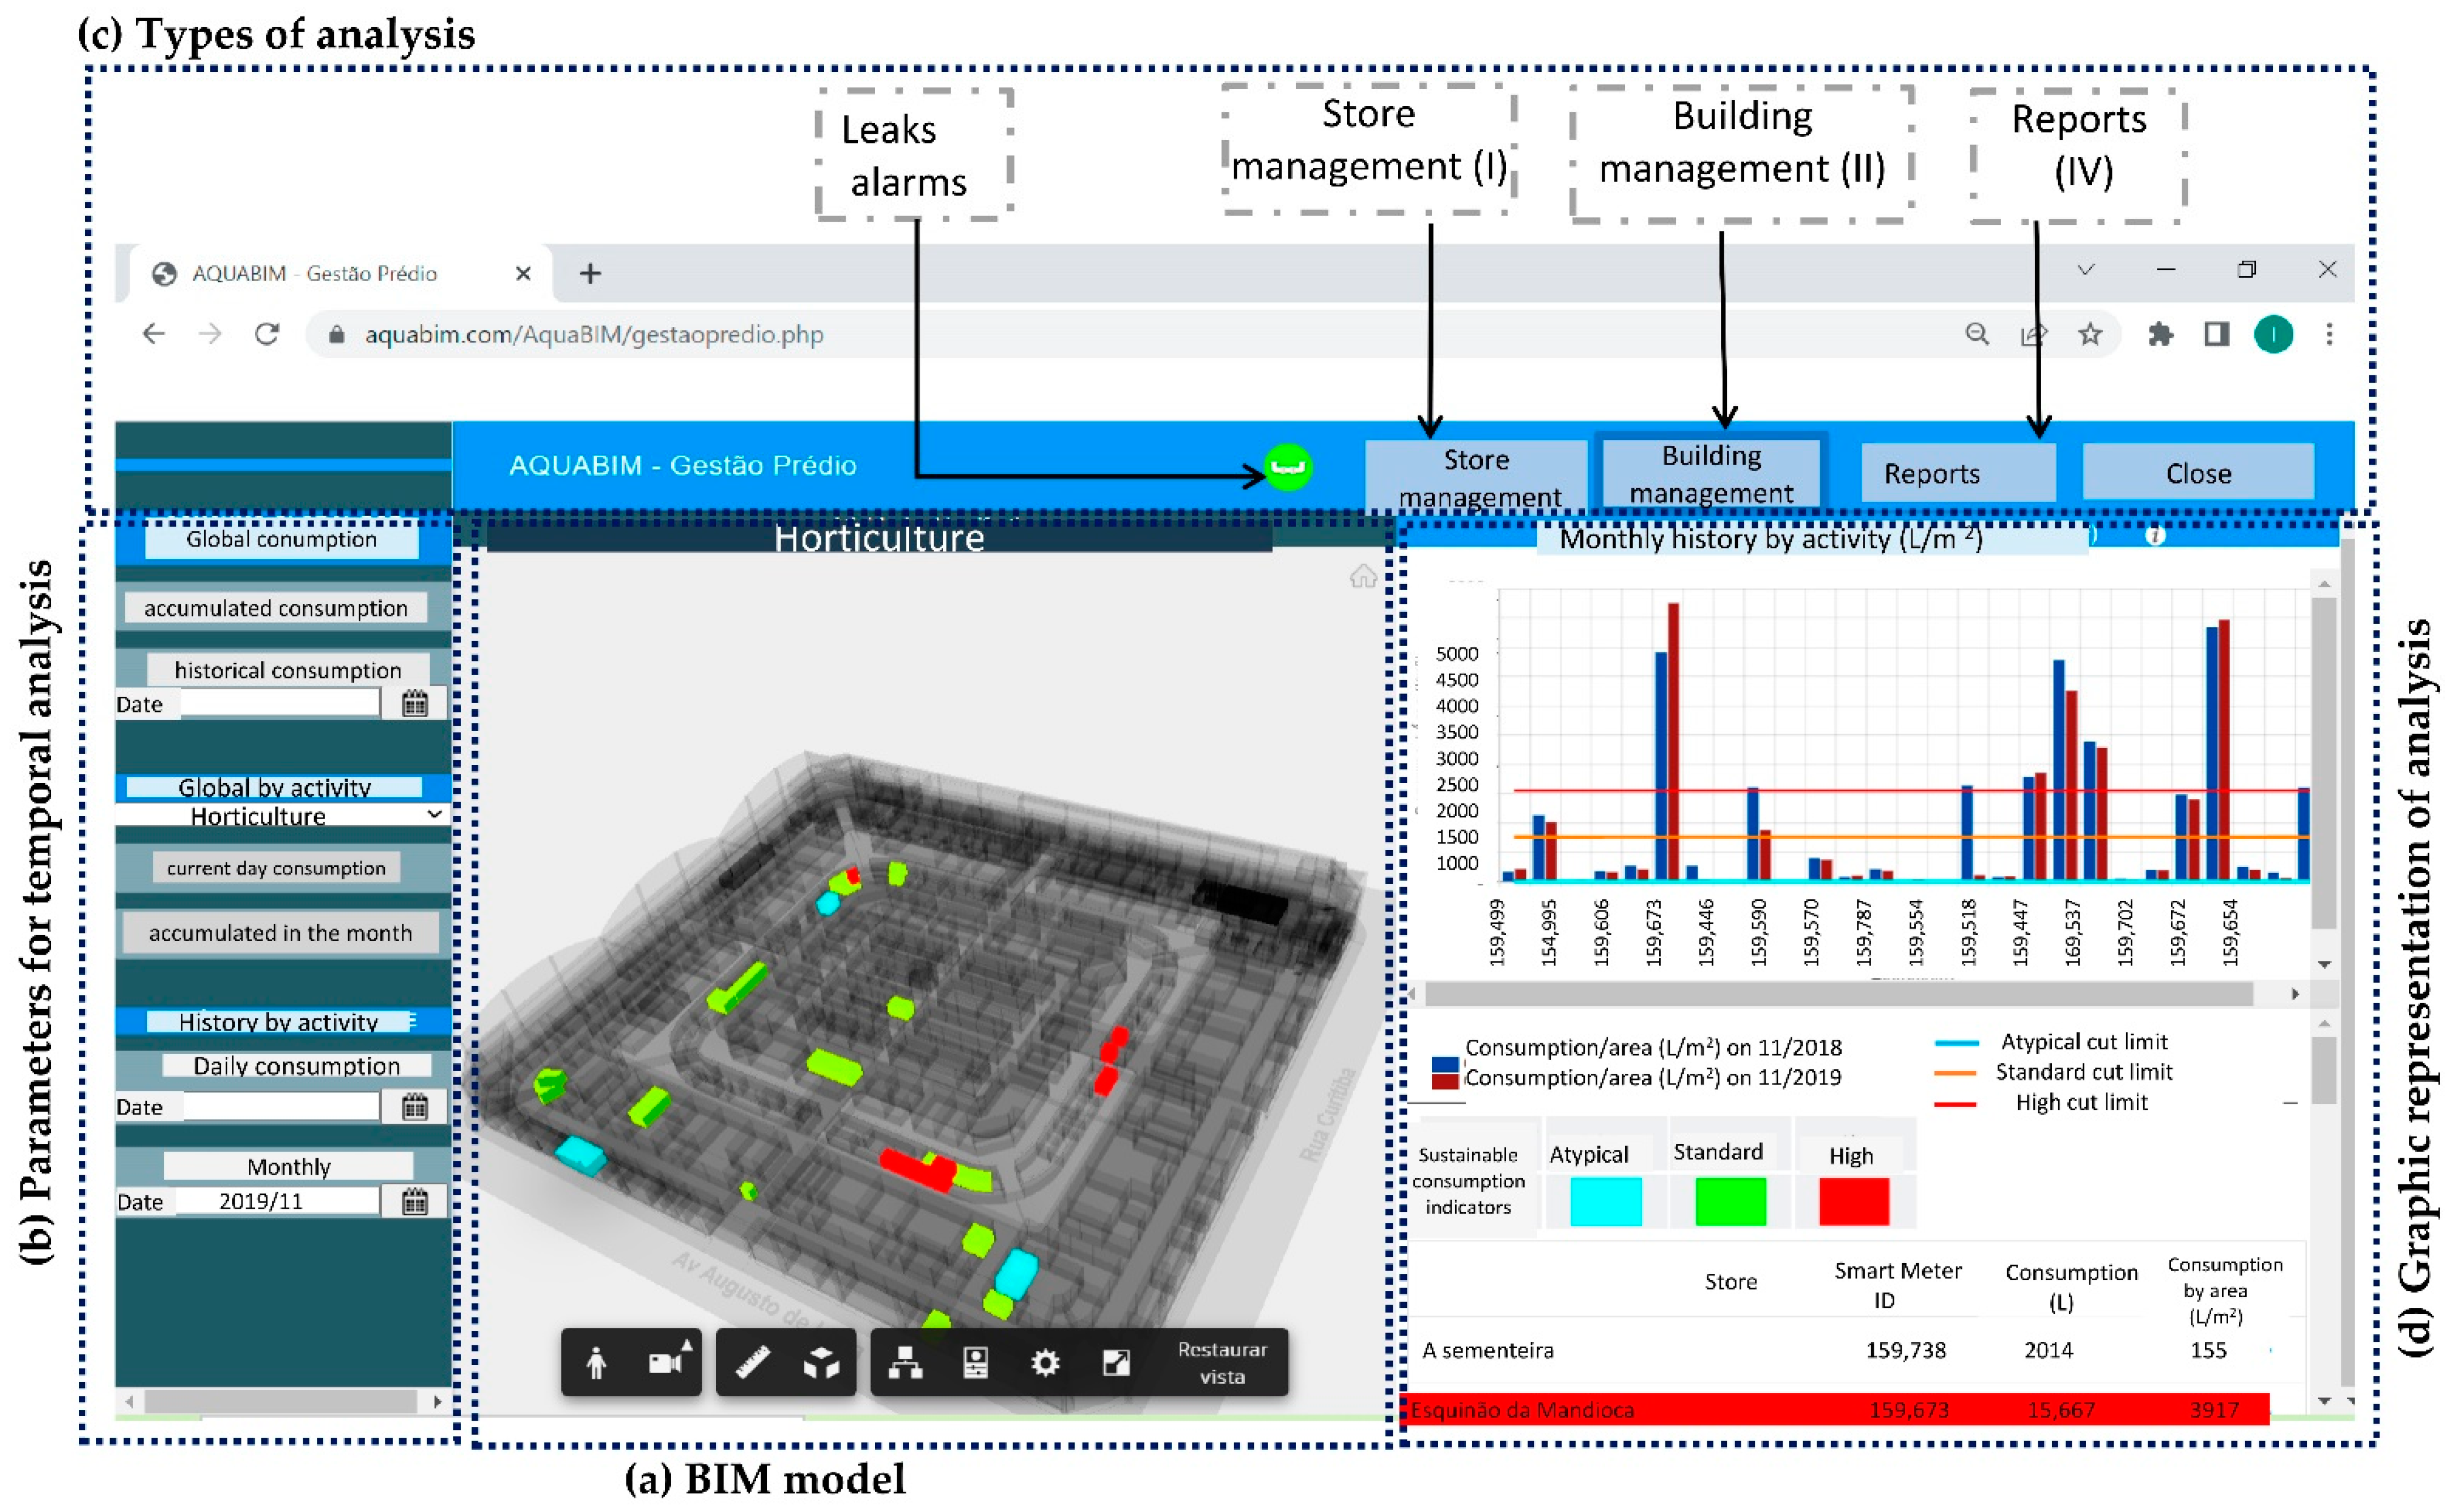
3.1.5. Water Management Functionalities (V)

The methodology proposed eight functionalities to automate water management in buildings, which included the guidelines of the plan–do–check–act process of the ISO 41001 standard on FM [31]. This process consisted of establishing objectives (plan), implementing (do), monitoring and measuring (check), and taking actions (act), which promoted performance improvement. Such functionalities were designed to allow the monitoring of current and previous consumption.
In addition, the consumption analyses resulting from the aforementioned functionalities were performed either on a global scale of the building, individually by store, or by activity categories, as summarized in Table 1. The functionalities for consolidating the annual evolution of the global consumption of the building and by category of activities, as shown in Table 1, issued graphical reports of the results. Other functionalities for monthly consolidation of consumption and alarms by activity category were presented using spreadsheets.
Functionalities for individual store analysis.
Store Consumption in Current Month: This graph presented the accumulated store consumption in the current month up to the day of the query. The value was compared against two reference values: the accumulated consumption during the same period in the previous month and the total consumption from the previous month (Figure 6).
Consumption history: The graph showed the evolution of the store’s consumption history over four months, starting from the selected month. The bars represent the store’s actual consumption each month; the colors indicate high, standard, or atypical consumption (Figure 7).
Functionalities for stores grouped by activity category.
Consumption by activity category: This functionality allowed us to assess the current consumption for the day and month of a set of stores grouped by activity category. The results of the analyses were presented in graphs in order to compare these consumptions against the reference consumptions from previous periods. The current day’s consumption was compared to the day’s consumption of the previous fourth week. The accumulated consumption in the current month was compared with the accumulated consumption corresponding to the same period of the month in the previous year.
Consumption history by activity category: This important functionality allowed us to determine the consumption history by activity during previous periods. Consumption in a day or month, specific to a previous period, could be analyzed. For the historical consumption of any day, the comparative reference value was the consumption of the day four weeks prior to the selected date. Figure 8 shows the results of the analysis of historical consumption in a given month. The interpretation of this graph enabled the comparison of the consumption during that month against the reference consumption during the same month in the previous year. The results of the analysis presented the consumption of each category in blue and the reference consumption in brown. The cut lines, in blue and red, showed the limits of atypical and high consumption, respectively, and the control line represented the value of the sustainable consumption indicator for the category. Atypical- and high-consumption cutting lines defined the standard consumption range.
Reporting functionalities.
The functionalities provided four types of reports, through which it was possible to evaluate and interpret the evolution of the building’s consumption by activity categories. The following reports were issued to assist in building management.
Evolution of Global Consumption (Building): This report provided a graph of the evolution of building consumption month-by-month during the chosen year. Textual data also showed the total consumption of the building and the months of maximum and minimum consumption with their respective percentages in relation to the total consumption.
Evolution of Consumption by Category of Activity: The evolution of consumption was presented through an individual graph by category or by a set of graphs for various activity categories. The individual graphs were accompanied by the sustainable consumption indicator line for the category, which indicated whether the category had any period of excessive consumption during the year.
Consumption Analysis: This analysis provided reports presented in spreadsheets, where various aspects of the monthly consumption of each category in the chosen year were detailed. The worksheet organized consumption data from sets of stores for each activity category according to their consumption range, classified as atypical, standard, or high. The worksheet showed the consumption analysis data, which were presented by activities in a given month/year, according to the consumption range of the set of stores. For each activity category, the following data were organized by monthly consumption: number of stores, consumption in liters per square meter, and in total liters. The consumption ranges of each set of stores in the category were represented in colors, blue for atypical, green for standard, and red for high. The worksheet also presented the values of the consumption cutoff limits in liters per square meter for the atypical- and high-consumption ranges and the value of the sustainable consumption indicator for the standard-consumption range.
Excessive consumption estimate: A second spreadsheet of the consumption analysis functionality presented the results of the excessive consumption estimate in the chosen month/year and also allowed us to evaluate the financial impact of the excess for each category. The excess consumption estimate was calculated by subtracting the value of the UCL in liters (L) from the consumption value (L) above this line. The spreadsheet data organized by activity category showed the number of stores with excessive consumption, the value of UCL (L/m2), the area (m2) of the UCL (L), and the value of excess consumption (L). The financial impact of this excess was shown through its cost in local currency. This worksheet was useful for assessing sustainability issues in water consumption in buildings. The data and interpretation of these analyses could enable an entity to study and plan feasibility actions to obtain international sustainability certificates, for example, by fulfilling the requirements of the buildings in operation–sustainable management module of the AQUA Haute Qualité Environnementale (AQUA-HQE) certification [79].
Alarm Analysis: This functionality provided a report with the analysis of triggered alarms to indicate excessive consumption on days of a chosen month/year. The results were presented in three spreadsheets with relevant information for sustainable management and control of excess consumption and leakage. The first worksheet consolidated the excess consumption data of stores in a given month/year, showing the name of the store, the number of days of alarms triggered, the average value of daily consumption in liters, the value of excess consumption in liters, and the cost of this excess. The criterion considered necessary to trigger the alarm was consumption above 20% of the average daily consumption value for the year.
The second worksheet presented the details of the information indicating the names of the stores with alarms in the month, the identifying numbers (ID) of their smart meter, the dates of occurrence of the alarms, and the consumption in liters on that date. The third worksheet listed the number of alarms triggered per year.

3.2. Design Cycle

In the design stage, the proposed methodology was implemented in a computational online prototype called AquaBIM. The prototype modelled and integrated information from BIM and data from smart meters to implement sustainable building management. The implemented functionality generated graphical reports, which allowed us to analyze the integrated information more efficiently. Figure 9 shows the design of the standard AquaBIM interface.
The interface was divided into four parts. The first, shown in Figure 9a, allowed direct interaction with BIM. The second enabled the input of parameters for temporal analysis and is shown in Figure 9b. The third provided access to the types of functionalities for the analyses. The water management functionalities were divided into three groups: store management (I), building management (II), and reports (III), all available in the standard interface (Figure 9c). The last one showed the graphic representation of the analysis results in graphs and tables, as shown in Figure 9d.

4. Contributions of the Methodology Embedded in AquaBIM for Sustainable Management

This section describes with the methodology’s contributions to sustainable management. The smart meter database used to conduct the research recorded data from approximately 50,000 m installed in 35,000 buildings, including residential and commercial buildings. Within this context, a compatible large commercial building was selected as the object of this research. Flores and Ghisi [16] suggested that determining sustainable consumption indicators for large buildings was important to establish benchmarks for comparisons among similar types of buildings.
A concept test was performed in the chosen building, using data from the year 2019, to evaluate the methodology implemented in AquaBIM and to validate the consumption indicators in a real-world consumption situation. The building selected for the AquaBIM application was the Central Market in Belo Horizonte, Brazil. This traditional municipal market was built in 1929 and specializes in the trade of food products and regional handicrafts (Figure 10). During the studied period, in 2019, there were approximately 400 stores, distributed by sectors, in an area of 14,000 m2.
AquaBIM’s features pointed towards automated management, which would improve the building’s performance through reduced consumption and controlling leaks. Automated facility management employs strategic planning and decision-making in the pursuit of sustainability.
During the application of AquaBIM, relevant contributions to a sustainable management were identified. Some could be highlighted, such as the importance of defining sustainable consumption indicators by activity category, the identification of temporal patterns of consumption for some categories, the fulfillment of criteria to claim a sustainability certification such as the AQUA-Haute Qualité Environnementale (AQUA-HQE), the interactive management of the building’s facilities with BIM, and the analysis of the reports issued that assessed and interpreted the building’s consumption.

4.1. Determination of Sustainable Water Consumption Indicators

An important contribution of this research was the determination of sustainable water consumption indicators, which were defined following standard and statistical criteria. One of the criteria used was the classification of stores by activity categories. The determination was performed using a statistical study using the Shewhart graphs in the R software and considering a historical series of data collected for one year. The information and data used to determine the indicators were sourced from the integration of BIM database and consumption data captured online through 361 smart meters. As it is an old building, the BIM of the Central Market was built from the original CAD designs and technical visits. The online readings of the water consumption considered in the survey were captured between January and December of the previous year. For the Central Market study, the determination of sustainable indicators required a classification of stores into 17 categories of activities, detailed in Table 2.
The indicators of sustainable water consumption calculated by activity category in the Central Market for the year 2019 are shown in Table 3.
The proposed sustainable water consumption indicators were compatible with the criteria defined in the methodology in accordance with the characteristics of the activities. Reliable indicators were important for management to account for information to support sustainability decision-making [65].
The calculated consumption indicators served to support the sustainable consumption analyses performed in this research. The basis of the methodology for defining these indicators could be generalized for application in similar sustainability studies of other types of consumption.

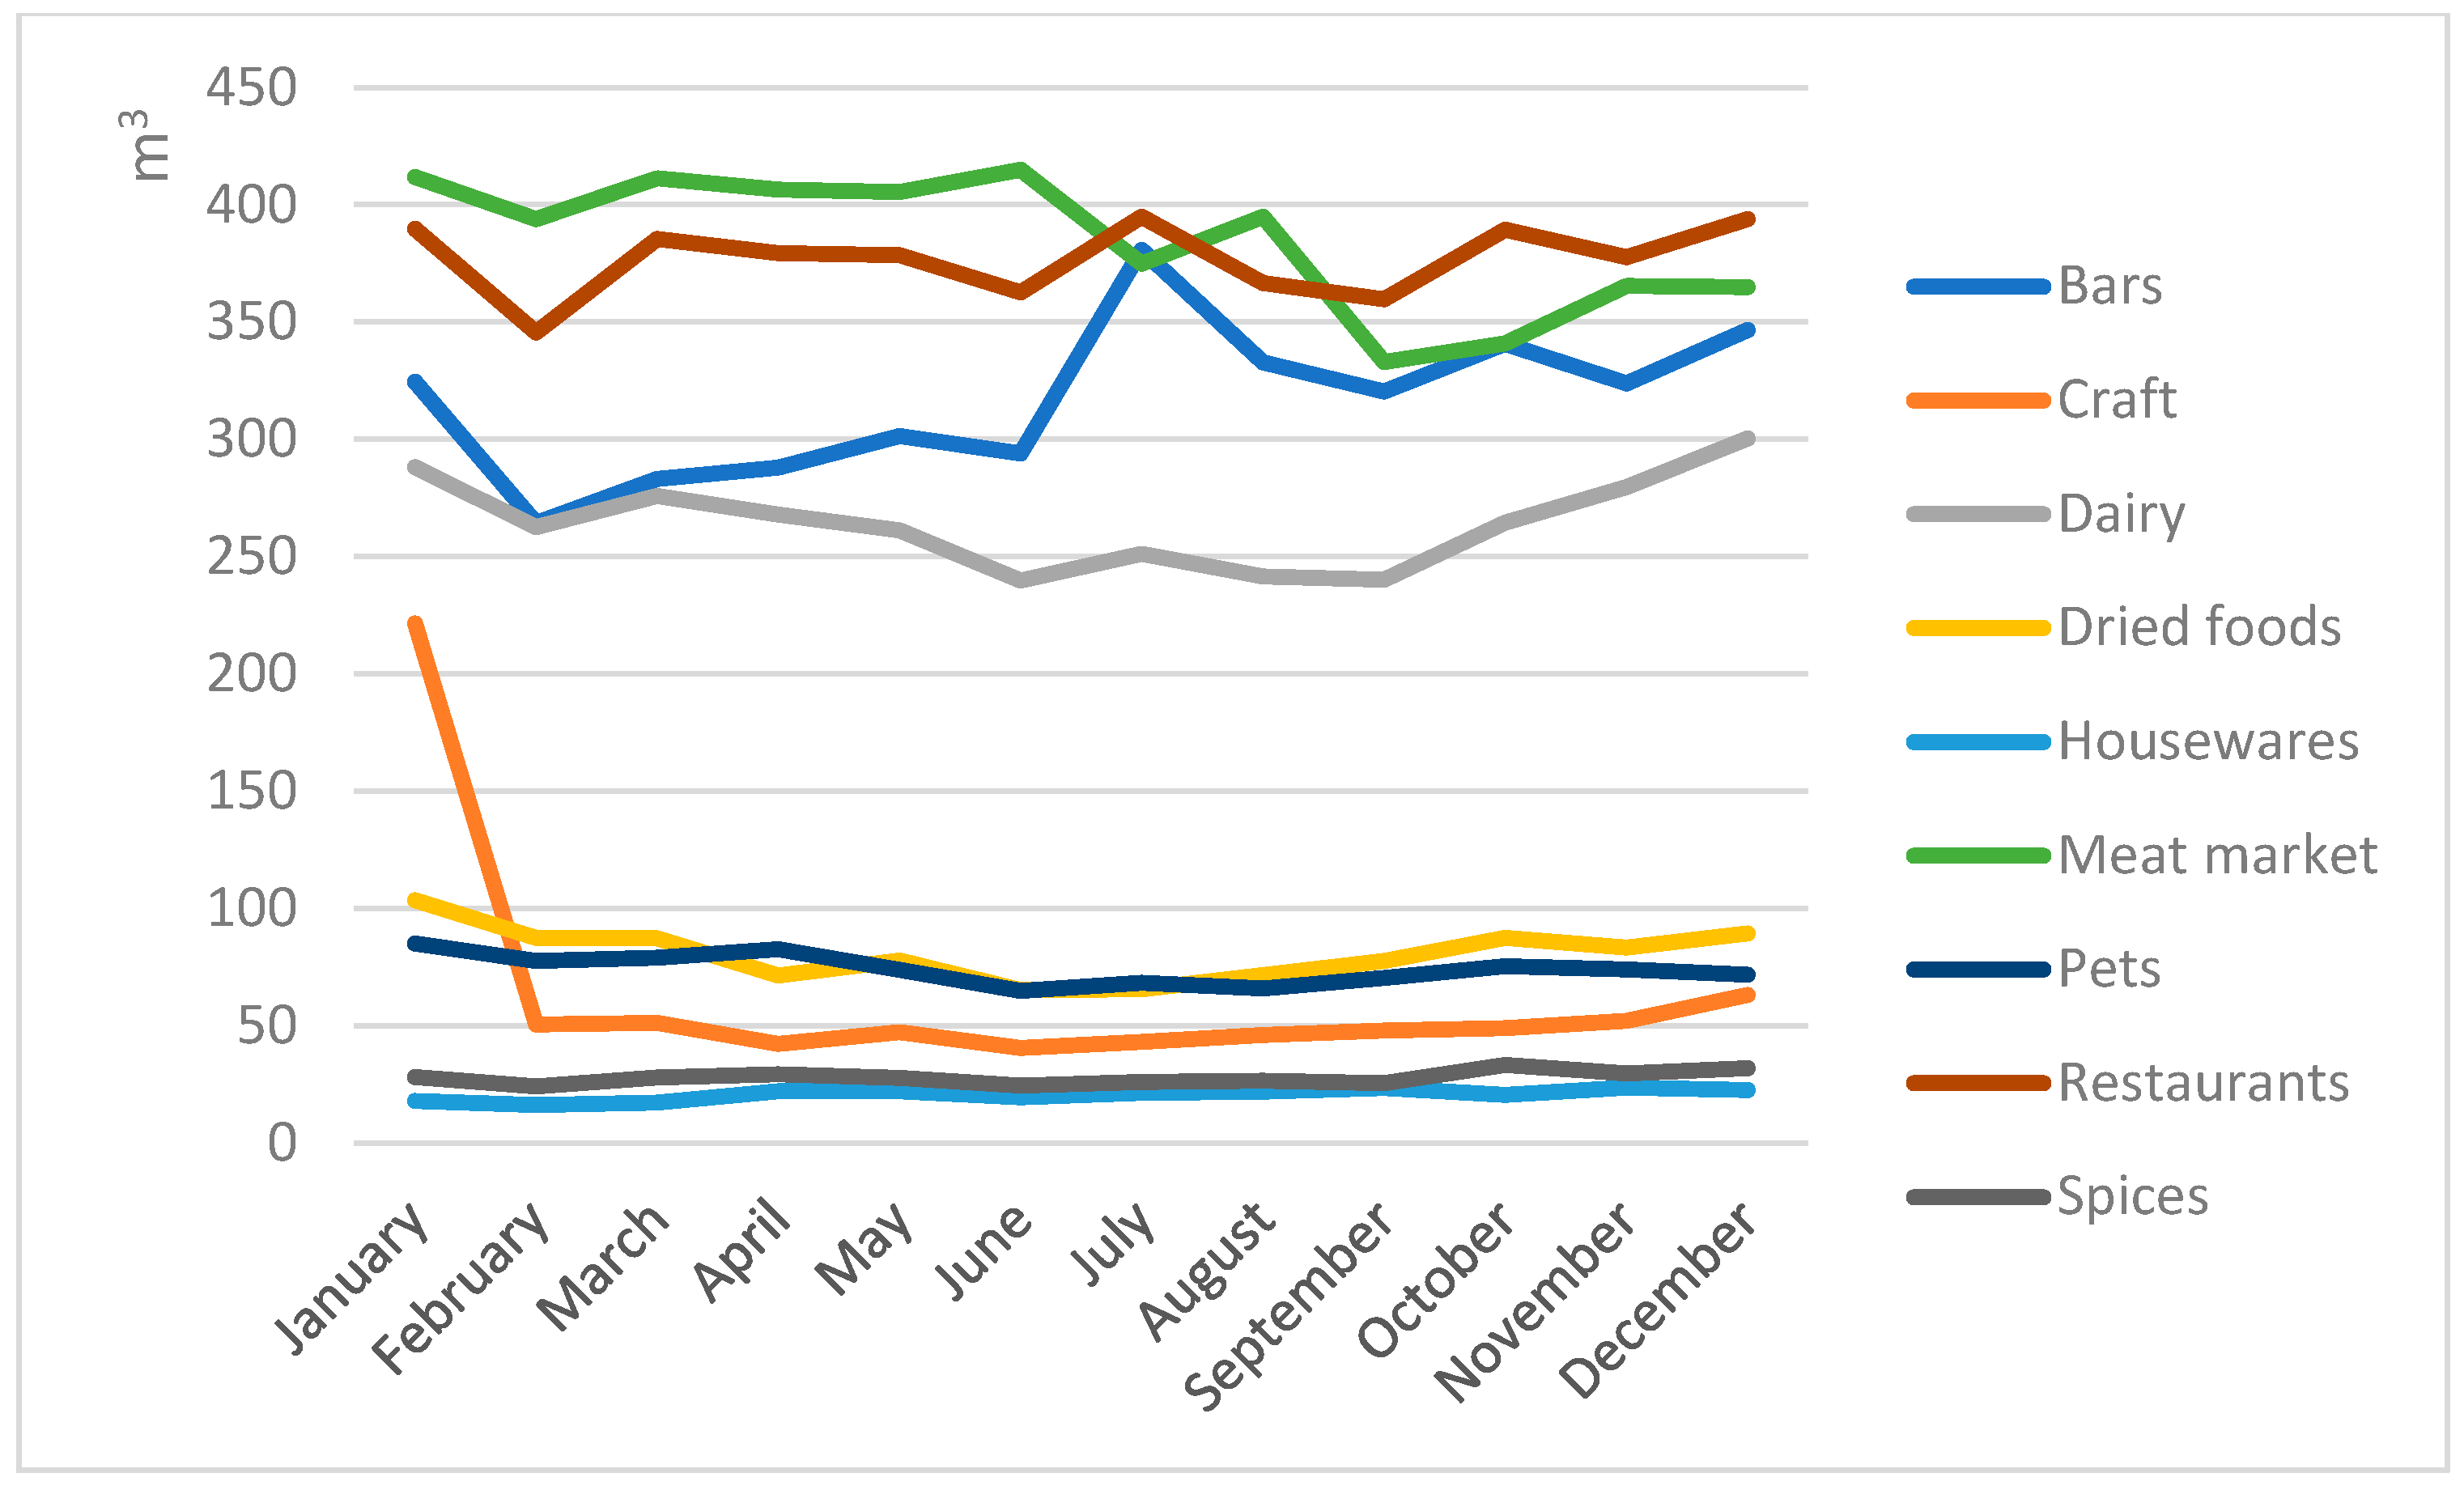
4.2. Identification of Temporal Patterns of Consumption

The statistical study included in this work to determine sustainable consumption indicators produced results that could identify of temporal patterns of consumption during the year in certain categories. Annual consumption of different activity categories was grouped into three temporal patterns of consumption, as described below.
Pattern 1—Some activities showed a pattern of consumption with variations throughout the year, as shown in the graph in Figure 11. At the beginning of the year (January–June), consumption showed a downward trend, remaining stable in the middle of the year (June–August) and then trending upward during the last four months (September–December). Water consumption was higher in the hottest months of the year and lower in the coldest months, indicating a correlation between the water consumption of these activities and weather conditions. The pet, food, industrial, dairy, and craft activity categories showed this pattern.
Pattern 2—This pattern was presented by certain activity categories, in which consumption was higher at the beginning of the year, with a continuous downward trend (Figure 12). The graph showed a descending line divided by the sustainable consumption indicator into two distinct regions. The periods of consumption above and below the sustainable indicator were proportional throughout the year. The consumption of the meat market and supplement categories indicated this pattern.
Pattern 3—Some categories showed a pattern with little variation in consumption during the year (Figure 13), which remained close to the sustainable indicator, indicating stability in consumption. The beverages, herbs, edibles, restaurants, and hair salon/barbershop categories indicated this pattern.
The detection of consumption patterns by analyzing the evolution of consumption in Mercado Central was an important contribution to the field. Our results could support the planning of strategic actions in accordance with the seasonal consumption characteristics of activity categories, for which it would be possible to predict peaks in consumption throughout the year.

4.3. AQUA-HQE Sustainability Certification

The analyses of water consumption performed by AquaBIM enabled us to objectively evaluate the criteria relating to the “water” category of the Haute Qualité Environnementale (HQE) sustainability certification. HQE is a French certification that promotes good practices in pursuit of sustainable management quality during the life cycle (construction, operation, and renovation) of commercial and non-commercial buildings.
The present research used the technical document Practical Guide AQUA-HQE: Buildings in Operation–Sustainable Management [79] as a reference. In this guide, the criteria for certification were divided into 14 categories (terrain, components, construction site, energy, water, waste, maintenance, hygrothermal comfort, acoustic comfort, visual comfort, olfactory comfort, quality of spaces, air quality, and quality of water). The “water” category was used as a model in this research for a sustainability management category that could meet some of the following requirements for HQE certification [73]: recording the water consumption of the building in a reference period; reducing the water consumption of the building; limiting the risk of water leaks; optimizing consumption readings; regularly analyzing water consumption; optimizing the maintenance of water management equipment; and ensuring the monitoring of demands in relation to olfactory comfort.
The management of the Central Market with AquaBIM results showed that it met the first five requirements previously mentioned.
The requirement to record the consumption of the building was met by AquaBIM with automatic readings of consumption from smart meters. Additionally, the determination and application of sustainable indicators defined consumption ranges for categories of activities through the analyses performed over 12-month periods.
The results were consolidated in reports issued by AquaBIM, and the results indicated the adoption of measures to control and reduce water consumption. The consumption analyses were used to define austerity goals and policies and also to propose incentives to mitigate the impact of excess and leakage. The results showed that the Central Market had significant potential for improvement for greater sustainability. The estimated excess consumption of 3750 m3 per year corresponded to 15.44% of the building’s global consumption. This percentage represented a potential for savings that was equivalent to the highest of the three required HQE certification percentages, which is considered the best practice level [79]. A management plan with actions aimed at reducing water consumption could, for example, obtain an international sustainability certification such as the AQUA-HQE.
The issuance of real-time alarms to monitor non-standard consumption was a feature of our AquaBIM, which met the certification requirement for leak control and monitoring. Data regarding alarm occurrences could be analyzed for appropriate action.
Real-time consumption reporting by smart meters optimized their consumption reporting, as required by HQE. These data were uploaded to AquaBIM, and the requirement to regularly analyze consumption was met. The interpretation of these data could further optimize the sustainable management of the building.

4.4. Interactive Management of Building Facilities with BIM

BIM methodology introduced a new paradigm and revolutionized the AEC/O industry. The adoption of a single database for the entire life cycle of the building, especially in the operational stage, enabled important advances in civil construction technology. Collaborative work and information sharing between professionals from different areas allowed the resolution of conflicts a priori, through the compatibility of projects. The methodology for sustainable water management in buildings represents an important scientific and technological advance, following the trend of civil construction in adopting the BIM–IoT–FM interaction for sustainable management in the operating phase of the building.
The interactions and interactivity of sustainable management with a building’s BIM could be important resources for the operational functioning of AquaBIM, as they would allow access and manipulation of information through graphic elements (Figure 12). BIM has semantic features to filter information and integrate different databases [41]. These characteristics facilitate the application of AquaBIM features in building management.
The operation and maintenance during a building life cycle are marked by the occurrence of dynamic changes with a certain frequency. Model geometry data due to architectural changes and non-geometric data due to changes in store activities, among others, undergo constant changes during the daily life of a building.
The use of information from a single 3D BIM for the management of buildings represented one of the main innovations of this research, as it enabled dynamic updates. The interactivity of BIM with management methods could improve the process of automatically and reliably updating information. The development of AquaBIM’s functionalities was based on the ISO 4100 standard on FM, where the requirements for improving the operation based on monitoring information were considered. FM has become an important operational process to improve the performance and sustainability of a building, especially when integrated with BIM and IoT device data.
BIM provides three operational functionalities to automate building management. In store management, consumption analyses can be performed by selecting the store using BIM. Simply choosing a store for analysis provides its basic information such as its location in the model, name, typology, owner, water meter number, type of activity, and area.
The data processed by AquaBIM feed BIM the results of the analyses of the stores individually or of an activity category, using the spatial representation of the stores in a defined color pattern.
Finally, an important functionality of BIM is the issuing of leak alarms in real time with the identification of the store. These alarms meet the requirement of limiting the risk of water leakage in a sustainability certification and also allow for the prompt reporting of events for resolution. Real-time alarms, with the identification of the store, allows for continuous monitoring of a building throughout the year. When AquaBIM triggered an alarm, the alarm indicator was activated on BIM. This interactivity of AquaBIM with BIM indicated the store where the alarm occurred and enabled the verification of leaks. This functionality also issued monthly reports on alarms, with details of the stores where they occurred, the number of alarms issued, and the related excess consumption and cost incurred.

4.5. Management Reports

The issuance of consumption reports by AquaBIM was an important feature for sustainable consumption management via the reporting and interpretation of the analysis results that were then presented in texts, tables, and graphs. The interpretation of the results of these reports enabled us to evaluate the evolution of the individual consumption of the stores, of the building, and of the activity categories according to their consumption range. In addition, the analysis of the reports characterized the consumption profile of the building. The global consumption of water in the Central Market in 2019 was approximately 24.3 M liters, a value broken down by consumption range, as shown in Figure 14. The graph indicated that approximately half of the stores had consumption within the standard range, which also corresponded to almost half of the total water consumption. A smaller number of stores (20%) accounted for 40% of total consumption in the high-consumption range. Finally, the graph showed that nearly 30% of the stores had low total consumption within the atypical-consumption range.
One of the AquaBIM reports showed the evolution of consumption by categories and revealed consumption profiles during the year. Figure 15 activity categories whose consumption was seasonal and had marked consumption peaks. The analysis and interpretation of the annual evolution of consumption also allowed us to assess the impact of each category within the context of the building. This same analysis enabled us to predict periods of higher consumption during the year and to identify sudden variations due to possible leaks.
The evolution of consumption could be analyzed across all categories simultaneously, for groups of categories, or for an individual category. For individual consumption, the sustainable consumption index for the category was also shown for comparison.
An important source of information for the sustainable management of the Central Market was available in the report “Analysis of Consumption”, where monthly consumption had been broken down by activity categories. The sustainable consumption indicators for each category were used, together with the control limits, to define groups of stores according to their consumption ranges. The details of the consumption information for these groups are presented in tables. Table 4 shows that establishments in each category with consumption below or above the control limits were classified as atypical and high consumption, respectively. Stores with consumption within the range defined by the control limits were assigned default consumption. In this table, the following information is detailed: number of stores, cut-off limit or consumption indicator, consumption in liters per square meter and in liters, and the impact on global consumption (%). The interpretation of the results identified the activity categories with the highest gross consumption due to a large number of stores, such as crafts. Large relative consumption categories in liters per square meter were also identified although there were fewer stores. The restaurants category, for example, had an impact of almost 12% on the building’s consumption of 2.12 M liters during the month, considering that only six stores were classified as high consumption.
Table 5 shows the number of stores with excess consumption by category, the value of this excess in liters, and its financial impact. In addition, it shows the volume of excess consumption in liters of the entire building and its incurred costs.
Based on the analysis of the reports, the average global consumption of the building was 3343 L/m2 and the annual average of excess consumption was approximately 3.75 M liters, which represented 15% of global consumption. Excessive consumption was not always due to waste; it could also be related to inherent activities for the operation of the establishment.

5. Discussion

The objective of this study was to develop a methodology to automate the sustainable management of water consumption in the micro-environment of commercial buildings using the online AquaBIM application. The integration of BIM methodology with data from IoT smart meters provided a novel method for FM during building operation.
The application of AquaBIM as a test concept delivered reports that reflected the evolution of consumption in the study subject, the Central Market, and it identified monthly and annual patterns of consumption by activity categories. The automation of analyses by AquaBIM and the monitoring of real-time consumption represented an advance in the management of water consumption. Sustainable management planning is reliant on factors such as a definition of the criteria for the use of water in consideration of sustainability certification, the identification of activity categories with the greatest impact on consumption, and the regular assessment and quantification of consumption and excess, among others. The analysis of the information extracted from the reports provided a quantitative and qualitative assessment of water consumption in the Central Market. This information could be used to support decision-making for management planning, with the aim of rationalizing water use, mitigating risks of leakage, and improving equipment maintenance. The interpretation of the results corroborated the feasibility of the research proposal to deliver a methodology that, in practice, promoted sustainable management of water consumption for commercial buildings.
The reference indicators of sustainable consumption defined and determined in this work were important instruments for FM. While authors such as Hörisch [65], Zhongming [66], and Nika [11] applied indicators to address more generic sustainability issues to support decision-making, the present research focused on sustainable water management in commercial buildings. The use of digital technologies was a contemporary approach to improving building performance [46,67,68]. Other studies have examined the management of energy consumption [48,49,50]; however, there remains a paucity of research in water management for commercial buildings [24].

6. Conclusions

Based on design science research (DSR), we employed a BIM–IoT–FM integration and consolidated its objectives for improving facility management in commercial buildings, in the pursuit of sustainable performance during building operation. One of the contributions of the proposed methodology was the determination of indicators for sustainable water consumption, based on Shewhart graphs, that were applied to the FM of the Central Market of Belo Horizonte, Brazil.
The interactivity between the building’s BIM and smart meters enabled the construction of a single database integrating the data from BIM and the building’s consumption. Once implemented in the online AquaBIM application, the methodology provided automated management of water consumption.
Environmental certifications are important benchmarks for assessing the sustainability of buildings. The application of AquaBIM complied with the requirements of the AQUAHaute Qualité Environnementale (AQUA-HQE) sustainability certification regarding water consumption, consumption details, and leakage control. The automated analyses presented the results in tables, texts, and graphs, which indicated the evolution of consumption, the detailed management of water use, and the issuance of alarms in real time. Reports were important instruments for interpreting these results and for assisting in decision-making and action-planning. The results showed, for example, that the Central Market had the potential to save approximately 15% of its annual consumption.
Although the scope of the work was limited to water consumption parameters in commercial buildings, the proposed methodology has a much wider scope for other types of consumption.
Regarding future research, our methodology could provide a perspective for extension and generalization. Activity categories of similar buildings could be included for the application of AquaBIM. Various typologies and activities will require the methodological concepts proposed in this research to be adapted and fitted for their needs. The extension of the methodology to generalize the energy concept and encompass studies on the consumption and sustainability of other resources such as electricity and gas indicate a promising horizon for innovative research.

Author Contributions

Conceptualization, J.R.Q.F., L.T.B. and M.F.P.; methodology, J.R.Q.F. and M.F.P.; software, L.T.B.; validation, J.R.Q.F., L.T.B. and M.F.P.; Formal analysis, C.M.P.B.; investigation, L.T.B.; writing—original draft preparation, L.T.B.; supervision, J.R.Q.F., M.F.P. and R.H.F. All authors have read and agreed to the published version of the manuscript.

Funding

This research received no external funding.

Institutional Review Board Statement

Not applicable.

Informed Consent Statement

Not applicable.

Data Availability Statement

Not applicable.

Acknowledgments

The authors acknowledge the support of the National Council for Scientific and Technological Development (CNPq); the Coordination for the Improvement of Higher-Level Personnel (CAPES), Research Support Foundation of the State of Minas Gerais (FAPEMIG) and Pró-Reitoria de Pesquisa (PRPq) da Universidade Federal de Minas Gerais.

Conflicts of Interest

The authors declare no conflict of interest.

References

  1. Nguyen, K.A.; Stewart, R.A.; Zhang, H.; Sahin, O. An adaptive model for the autonomous monitoring and management of water end use. Smart Water 2018, 3, 2–21. [Google Scholar] [CrossRef] [Green Version]
  2. Maqsoom, A.; Aslam, B.; Ismail, S.; Thaheem, M.J.; Ullah, F.; Zahoor, H.; Musarat, M.A.; Vatin, N.I. Assessing Rainwater Harvesting Potential in Urban Areas: A Building Information Modelling (BIM) Approach. Sustainability 2021, 13, 12583. [Google Scholar] [CrossRef]
  3. McDaniel, R.D.; O’Donnell, F.C. Assessment of Hydrologic Alteration Metrics for Detecting Urbanization Impacts. Water 2019, 11, 1017. [Google Scholar] [CrossRef] [Green Version]
  4. Brears, R.C. Introduction. In Urban Water Security; Wiley Online Books: New York, NY, USA, 2017; pp. 1–4. [Google Scholar]
  5. Rogers, B.C.; Dunn, G.; Hammer, K.; Novalia, W.; de Haan, F.J.; Brown, L.; Brown, R.R.; Lloyd, S.; Urich, C.; Wong, T.H.F.; et al. Water Sensitive Cities Index: A diagnostic tool to assess water sensitivity and guide management actions. Water Res. 2020, 186, 116411. [Google Scholar] [CrossRef] [PubMed]
  6. Khatri, K.B.; Vairavamoorthy, K. Challenges for Urban Water Supply and Sanitation in the Developing Countries’; UNESCO-IHE Institute for Water Education: Delft, The Netherlands, 2007. [Google Scholar]
  7. Rabaey, K.; Vandekerckhove, T.; Van de Walle, A.; Sedlak, D.L. The third route: Using extreme decentralization to create resilient urban water systems. Water Res. 2020, 185, 116276. [Google Scholar] [CrossRef]
  8. Bröchner, J.; Haugen, T.; Lindkvist, C. Shaping tomorrow’s facilities management. Facilities 2018, 37, 366–380. [Google Scholar] [CrossRef] [Green Version]
  9. Nielsen, S.B.; Sarasoj, A.; Galamba, K.R. Sustainability in facilities management: An overview of current research. Facilities 2016, 34, 535–563. [Google Scholar] [CrossRef] [Green Version]
  10. Becerik-Gerber, B.; Jazizadeh, F.; Li, N.; Calis, G. Application areas and data requirements for BIM-enabled facilities management. J. Constr. Eng. Manag. 2012, 138, 431–442. [Google Scholar] [CrossRef]
  11. Nika, C.; Vasilakia, V.; Expósitob, A.; Katsou, E. Water Cycle and Circular Economy: Developing a Circularity Assessment Framework for Complex Water Systems. Water Res. 2020, 187, 116423. [Google Scholar] [CrossRef]
  12. Šulyová, D.; Vodák, J.; Kubina, M. Effective Management of Scarce Water Resources: From Antiquity to Today and into the Future. Water 2021, 13, 2734. [Google Scholar] [CrossRef]
  13. Brears, R.C. Demand Management to Achieve Urban Water Security, Urban Water Security; John Wiley & Sons: New York, NY, USA, 2017; pp. 60–85. [Google Scholar]
  14. Antzoulatos, G.; Mourtzios, C.; Stournara, P.; Kouloglou, I.O.; Papadimitriou, N.; Spyrou, D.; Mentes, A.; Nikolaidis, E.; Karakostas, A.; Kourtesis, D.; et al. Making urban water smart: The SMART-WATER solution. Water Sci. Technol. 2020, 82, 2691–2710. [Google Scholar] [CrossRef] [PubMed]
  15. Willuweit, L.; O’Sullivan, J.J. A decision support tool for sustainable planning of urban water systems: Presenting the dynamic urban water simulation model. Water Res. 2013, 47, 7206–7220. [Google Scholar] [CrossRef] [PubMed]
  16. Flores, R.A.; Enedir Ghisi, E. Water Benchmarking in Buildings: A Systematic Review on Methods and Benchmarks for Water Conservation. Water Benchmarking in Buildings: A Systematic Review on Methods and Benchmarks for Water Conservation. Water 2022, 14, 473. [Google Scholar] [CrossRef]
  17. Worthington, A. Commercial and industrial water demand estimation: Theoretical and methodological guidelines for applied economics research. Estud. Econ. Apl. 2010, 28, 237–258. [Google Scholar]
  18. Tabassum, R.; Arsalan, M.; Imam, N. Estimation of water demand for commercial units in Karachi City. FRJ 2016, 2, 21–26. [Google Scholar]
  19. Eggimann, S.; Mutzner, L.; Wani, O.; Schneider, M.Y.; Spuhler, D.; de Moy Vitry, M.; Beutler, P.; Maurer, M. The potential of knowing more: A review of data-driven urban water management. Environ. Sci. Tec. 2017, 51, 2538–2553. [Google Scholar] [CrossRef] [Green Version]
  20. Yuan, Z.; Olsson, G.; Cardell-Oliver, R.; van Schagen, K.; Marchi, A.; Deletic, A.; Urich, C.; Rauch, W.; Liu, Y.; Jiang, G. The role of instrumentation, control and automation in urban water systems. Water Res. 2019, 155, 381–402. [Google Scholar] [CrossRef]
  21. Hering, G.; Waite, T.D.; Luthy, R.G.; Drewes, J.; Sedlak, D.L. A changing framework for urban water systems. Environ. Sci. Tec. 2013, 47, 10721–10726. [Google Scholar] [CrossRef]
  22. Cominola, A.; Giuliani, M.; Piga, D.; Castelletti, A.; Rizzoli, A.E. Benefits and challenges of using smart meters for ad-vancing residential water demand modeling and management: A review. Environ. Model. Softw. 2015, 72, 198–214. [Google Scholar] [CrossRef] [Green Version]
  23. Gourmelon, N.; Bayer, S.; Mayle, M.; Bach, G.; Bebber, C.; Munck, C.; Sosna, C.; Maier, A. Implications of Experiment Set-Ups for Residential Water End-Use Classification. Water 2021, 13, 236. [Google Scholar] [CrossRef]
  24. Stewart, R.A.; Nguyen, K.; Beal, C.; Zhang, H.; Sahin, O.; Bertone, E.; Vieira, A.S.; Castelletti, A.; Cominola, A.; Giuliani, M.; et al. Integrated intelligent water-energy metering systems and informatics: Visioning a digital multi-utility service provider. Environ. Model. Softw. 2018, 105, 94–117. [Google Scholar] [CrossRef]
  25. Boyle, T.; Giurco, D.; Mukheibir, P.; Liu, A.; Moy, C.; White, S.; Stewart, R. Intelligent metering for urban water: A review. Water 2013, 3, 1052–1081. [Google Scholar] [CrossRef] [Green Version]
  26. Willis, R.M.; Stewart, R.A.; Giurco, D.P.; Talebpour, M.R.; Mousavinejad, A. End use water consumption in households: Impact of socio-demographic factors and efficient devices. J. Clean. Prod. 2013, 60, 107–115. [Google Scholar] [CrossRef] [Green Version]
  27. Liu, A.; Mukheibir, P. Digital metering feedback and changes in water consumption—A review. Resour. Conserv. Recycl. 2018, 134, 136–148. [Google Scholar] [CrossRef]
  28. Pärn, E.A.; Edwards, D.J.; Sing, M.C.P. The building information modelling trajectory in facilities management: A review. Autom. Constr. 2017, 75, 45–55. [Google Scholar] [CrossRef] [Green Version]
  29. ISO 41011; Facility Management—Vocabulary. ISO: Geneva, Switzerland, 2017.
  30. Chotipanich, S. Positioning facility management. Facilities 2004, 22, 364–372. [Google Scholar] [CrossRef]
  31. ISO 41001; Facility Management–Management Systems–Requirements with Guidance for Use. ISO: Geneva, Switzerland, 2018.
  32. Bilal, M.; Oyedele, L.O.; Qadir, J.; Munir, K.; Ajayi, S.O.; Akinade, O.; Owolabi, H.A.; Alaka, H.A.; Pasha, M. Big Data in the construction industry: A review of present status, opportunities, and future trends. Adv. Eng. Inform. 2016, 30, 500–521. [Google Scholar] [CrossRef]
  33. Eastman, C.; Teicholz, P.; Sacks, R.; Liston, K. BIM Handbook: A Guide to Building Information Modeling for Owners, Managers, Designers, Engineers and Contractors, 2nd ed.; John Wiley & Sons: Hoboken, NJ, USA, 2011. [Google Scholar]
  34. Succar, B. Building information modelling framework: A research and delivery foundation for industry stakeholders. Autom. Constr. 2009, 18, 357–375. [Google Scholar] [CrossRef]
  35. Gao, X.; Pishdad-Bozorgi, P. BIM-enabled facilities operation and maintenance: A review. Adv. Eng. Inform. 2019, 39, 227–247. [Google Scholar] [CrossRef]
  36. Gürsel, I. CLIP—Computational Support for Lifecycle Integral Building Performance Assessment. Ph.D. Thesis, Faculty of Archi-tecture, Delft University of Technology, Delft, The Netherlands, 2010. [Google Scholar]
  37. Zhan, J.; Ge, X.J.; Huang, S.; Zhao, L.; Wong, J.K.W.; He, S.X. Improvement of the inspection-repair process with building information modelling and image classification. Facilities 2019, 37, 395–414. [Google Scholar] [CrossRef] [Green Version]
  38. Dixit, M.K.; Venkatraj, V.; Ostadalimakhmalbaf, M.; Pariafsai, F.; Lavy, S. Integration of facility management and building information modeling (BIM) A review of key issues and challenge. Facilities 2019, 7, 455–483. [Google Scholar] [CrossRef]
  39. Kelly, G.; Serginson, M.; Lockley, S.; Dawood, N.; Kassem, M. BIM for facility management: A review and a case study inves-tigating the value and challenges. In Proceedings of the 13th International Conference on Construction Applications of Virtual Reality, London, UK, 30–31 October 2013. [Google Scholar]
  40. Wong, J.K.W.; Ge, J.; He, S.X. Digitisation in facilities management: A literature review and future research directions. Autom. Constr. 2018, 92, 312–326. [Google Scholar] [CrossRef]
  41. Tang, S.; Shelden, D.S.; Charles, M.; Eastman, C.M.; Pishdad-Bozorgi, P.; Gao, P. review of building information modeling (BIM) and the internet of things (IoT) devices integration: Present status and future trends. Autom. Constr. 2019, 101, 127–139. [Google Scholar] [CrossRef]
  42. Kochovski, P.; Stankovski, V. Supporting smart construction with dependable edge computing infrastructures and applications. Autom Constr. 2018, 85, 182–192. [Google Scholar] [CrossRef]
  43. Windapo, A.O.; Moghayedi, A. Adoption of smart technologies and circular economy performance of buildings. Built Environ. Proj. Asset Manag. 2020, 10, 585–601. [Google Scholar] [CrossRef]
  44. Geng, Y.; Ji, W.; Wang, Z.; Lin, B.; Zhu, Y. A review of operating performance in green buildings: Energy use, indoor environmental quality and occupant satisfaction. Energy Build. 2018, 183, 500–514. [Google Scholar] [CrossRef]
  45. Azhar, S.; Khalfan, M.; Maqsood, T. Building information modelling (BIM): Now and beyond. Constr. Econ. Build. 2015, 12, 15–28. [Google Scholar] [CrossRef] [Green Version]
  46. Hunhevicz, J.J.; Motie, M.; Daniel, M.; Hall, D.M. Digital building twins and blockchain for performance-based (smart) contracts. Autom. Constr. 2022, 133, 103981. [Google Scholar] [CrossRef]
  47. Chew, M.Y.L.; Conejos, S.; Asmone, A.S. Developing a research framework for the green maintainability of building. Facilities 2017, 39–63. [Google Scholar] [CrossRef]
  48. Santos, R.; Costab, A.A.; Silvestreb, J.D.; Pyla, L. Informetric analysis and review of literature on the role of BIM in sustainable construction. Autom. Constr. 2019, 103, 221–234. [Google Scholar] [CrossRef]
  49. Li, Y.; Kubicki, S.; Guerriero, A.; Rezgui, Y. Review of building energy performance certification schemes towards future improvement. Renew. Sust. Energy Rev. 2019, 113, 109244. [Google Scholar] [CrossRef]
  50. Abdelalim, A.; O’Brien, W.; Shi, Z. Data visualization and analysis of energy flow on a multi-zone building scale. Autom. Constr. 2017, 84, 258–273. [Google Scholar] [CrossRef]
  51. Opoku, A.; Lee, J.Y. The Future of Facilities Management: Managing Facilities for Sustainable Development. Sustainability 2022, 14, 1705. [Google Scholar] [CrossRef]
  52. Roper, K.O.; Beard, J.L. Justifying sustainable buildings—Championing green operations. J. Corp. Real Estate 2006, 8, 91–103. [Google Scholar] [CrossRef]
  53. Elmualim, A.A.; Czwakiel, A.; Valle, C.R.; Ludlow, G.; Shah, S. Barriers for implementing sustainable facilities management. In Proceedings of the World Sustainable Building Conference, Melbourne, Australia, 21–25 September 2008. [Google Scholar]
  54. Aaltonen, A.; Määttänen, E.; Kyrö, R.; Sarasoja, A.-L. Facilities management driving green building certification: A case from Finland. Facilities 2013, 31, 328–342. [Google Scholar] [CrossRef]
  55. Montgomery, D. Introdução ao Controle Estatístico da Qualidade, Translated by Ana Maria de Farias, Vera Regina de Farias e Flores. In Original Title Introduction to Statistical Quality Control, 4th ed.; LTC: Rio de Janeiro, Brazil, 2012; p. 513. [Google Scholar]
  56. Qiu, P. Introduction to Statistical Process Control; Texts in Statistical Science Series; Chapman and Hall/CRC: New York, NY, USA, 2013; p. 520. [Google Scholar]
  57. MacCarthy, B.; Wasusri, T. A review of non-standard applications of statistical process control (SPC) charts. Int. J. Qual. Reliab. Manag. 2002, 19, 295–320. [Google Scholar] [CrossRef]
  58. Durmusoglu, A. Updating technology forecasting models using statistical control charts. Kybernetes 2017, 47, 672–688. [Google Scholar] [CrossRef]
  59. Elevli, S.; Uzgören, N.; Bingöl, D.; Elevli, B. Drinking water quality control: Control charts for turbidity and pH. J. Water, Sanit. Hyg. Dev. 2016, 6, 511–518. [Google Scholar] [CrossRef]
  60. Iglesias, C.; Sancho, J.; Piñeiro, J.; Martínez, J.; Pastor, J.; Taboada, J. Shewhart-type control charts and functional data analysis for water quality analysis based on a global indicator. Desalination Water Treat. 2015, 57, 1–16. [Google Scholar] [CrossRef]
  61. Paroissin, C.; Penalva, L.; Pétrau, A.; Verdier, G. New control chart for monitoring and classification of environmental data. Environmetrics 2016, 27, 182–193. [Google Scholar] [CrossRef]
  62. Da Conceição, K.Z.; Vilas Boas, M.A.; Sampaio, S.C.; Remor, M.B.; Bonaparte, D.I. Statistical control of the process applied to the monitoring of the water quality index. Eng. Agrícola 2018, 38, 951–960. [Google Scholar] [CrossRef] [Green Version]
  63. Romano, M.; Woodward, K.; Kapelan, Z. Statistical Process Control Based System for Approximate Location of Pipe Bursts and Leaks in Water Distribution Systems. Procedia Eng. 2017, 186, 236–243. [Google Scholar] [CrossRef]
  64. Freitas, L.L.G.; Henning, E.; Kalbusch, A.; Konrath, A.C.; Walter, O.M.F.C. Analysis of water consumption in toilets employing Shewhart, EWMA, and Shewhart-EWMA combined control charts. J. Clean. Prod. 2019, 233, 1146–1157. [Google Scholar] [CrossRef]
  65. Hörisch, J.; Ortas, E.; Schaltegger, S.; Álvarez, I. Environmetal effects of sustainability management tools: A empirical analysis of large companies. Ecol. Econ. 2015, 120, 241–249. [Google Scholar] [CrossRef]
  66. Lu, Z.; Broesicke, O.A.; Chang, M.E.; Yan, J.; Xu, M.; Derrible, S.; Mihelcic, J.R.; Schwegler, B.R.; Crittenden, J.C. Seven Approaches to Manage Complex Coupled Human and Natural Systems: A Sustainability Toolbox. Environ. Sci. Technol. 2019, 53, 9341–9351. [Google Scholar] [CrossRef] [PubMed]
  67. Hu, S.; Corry, E.; Curry, E.; Turner, W.J.N.; O’Donnell, J. Building performance optimisation: A hybrid architecture for the integration of contextual information and time-series data. Autom. Constr. 2016, 70, 51–61. [Google Scholar] [CrossRef]
  68. Bonci, A.; Carbonari, A.; Cucchiarelli, A.; Messi, L.; Pirani, M.; Vaccarini, M. A cyber-physical system approach for building efficiency monitoring. Autom. Constr. 2019, 102, 68–85. [Google Scholar] [CrossRef]
  69. Tagliabue, L.C.; Cecconi, F.R.C.; Maltese, S.; Rinaldi, S.; Ciribini, A.L.C.; Flammini, A. Leveraging Digital Twin for Sustainability Assessment of an Educational Building. Sustainability 2021, 13, 480. [Google Scholar] [CrossRef]
  70. Braga, L.; Braga, A.; Braga, C. On the characterization and monitoring of building energy demand using statistical process control methodologies. Energy Build. 2013, 65, 205–219. [Google Scholar] [CrossRef]
  71. Wieringa, R. Design science as nested problem solving. In Proceedings of the 4th International Conference on Design Science Research in Information Systems and Technology, DESRIST 09, Kristiansand, Norway, 4–6 August 2021; pp. 1–12. [Google Scholar]
  72. Hevner, A.R. A Three Cycle View of Design Science Research. Scand. J. Inf. Syst. 2007, 19, 87–92. [Google Scholar]
  73. About SQLite. Available online: https://www.sqlite.org/about.html (accessed on 18 June 2020).
  74. Walpole, R.E.; Myers, R.H.; Myers, S.L.; Ye, K. Probabilidade e Estatística Para Engenharia e Ciências. Original Title: Probability & Statisties for Engineers & Scientists; Pearson Prentice Hall: São Paulo, Brazil, 2009. [Google Scholar]
  75. What Is R? Available online: https://www.r-project.org/about.html (accessed on 20 June 2020).
  76. The Popularity of Data Science Software. R4stats. Available online: http://r4stats.com/articles/popularity/ (accessed on 23 November 2019).
  77. Yan, H.; Yang, N.; Peng, Y.; Ren, Y. Data mining in the construction industry: Present status, opportunities, and future trends. Autom. Constr. 2020, 119, 103331. [Google Scholar] [CrossRef]
  78. Scrucca, L. qcc: An R package for quality control charting and statistical process control. R News 2004, 1, 11–17. [Google Scholar]
  79. HQE. Guia prático AQUA-HQE™ Edifícios em Operação Gestão Sustentável Referencial Técnico—Gestão Sustentável, Brasil. Available online: https://vanzolini.org.br/aqua/certificacao-aqua-hqe/ (accessed on 24 March 2022).
Figure 1. Typical control chart.
Sustainability 14 05695 g001
Figure 2. Research framework (adapted Hevner 2007).
Sustainability 14 05695 g002
Figure 3. Diagram of the information flow.
Sustainability 14 05695 g003
Figure 4. X ¯ chart template.
Sustainability 14 05695 g004
Figure 5. Water consumption patterns.
Sustainability 14 05695 g005
Figure 6. Store consumption in current month.
Sustainability 14 05695 g006
Figure 7. Historical store consumption.
Sustainability 14 05695 g007
Figure 8. Monthly consumption history by activity category.
Sustainability 14 05695 g008
Figure 9. AquaBIM standard interface design.
Sustainability 14 05695 g009
Figure 10. Photograph of the Central Market.
Sustainability 14 05695 g010
Figure 11. Water consumption Pattern 1.
Sustainability 14 05695 g011
Figure 12. Water consumption Pattern 2.
Sustainability 14 05695 g012
Figure 13. Water consumption Pattern 3.
Sustainability 14 05695 g013
Figure 14. Global water consumption analysis in the year 2019.
Sustainability 14 05695 g014
Figure 15. Evolution of annual consumption by activity categories.
Sustainability 14 05695 g015
Table 1. Water management functionalities.
Type of Function
(Analysis)
Type of Function (Analysis)Water Management ToolsGraphic
Presentation
For individual stores Current
(in the month)
For the accumulated in the monthChart
HistoricFor evolution in a quarter Chart
On a global scale of
the building
(by activity category)
Current
(in the month)
For the accumulated in the month Chart
HistoricFor the monthChart
By activity categoryCurrent (on the day)For the current dayChart
Current
(in the month)
For the accumulated in the monthChart
Historic
(set day)
To date setChart
Historic
(month defined)
For chosen monthChart
ReportsYearlyGlobal consumptionChart
YearlyConsumption by categoriesChart
YearlyConsumption analysisSpreadsheet
YearlyConsumption analysis Spreadsheet
Some of the functionalities for the analyses are described below.
Table 2. Description of activity categories.
Activity CategoriesDescription
BarsRetail business establishment that serves
alcoholic beverages (beer, cocktails),
soft drinks, and snack foods
Hair Salon/Barber shopHair salon or barber shop
CraftCraft shop
DairyDairy stores
(Milk products, especially handmade regional cheeses)
Dried foodsAssorted food store
(Chocolate, flour, cookies, nuts, etc.)
DrinksBottled industrialized beverages shop
(cachaças)
Flower shopFlower shop
Groceries Retail shop that primarily sells food, either fresh or preserved and assorted non-food products
HerbsMedicinal herb shop
HorticultureFresh fruits and vegetables shop
HousewareHousewares shop
(Small household items such as kitchen utensils, tableware, and decorative objects)
IndustrializedAssorted manufactured products (cleaning products, packaging,
religious articles...)
PetsPet shops
Meat marketMeat, poultry, fish
RestaurantsSmall restaurants and snack bars
SpicesSpice shop
(Cinnamon, paprika, oregano, chili, etc.)
SupplementsNutritional supplements shop
Table 3. Sustainable water consumption indicator by activity category.
Activity
Categories
Sustainable Water Consumption
Indicator (L/m2/Month)
Bars1402
Hair salon/
Barber shop
239
Craft41
Dairy553
Dried foods182
Drinks114
Flower shop183
Grocery154
Herbs148
Horticulture758
Houseware84
Industrialized 50
Pets437
Meat Market1027
Restaurants1261
Spices256
Supplements94
Table 4. Sustainable water consumption indicators by activity category.
Atypical Standard High
CategoryUCL 1
(L/m2)
Consumption
(L/m2)
Consumption
(L)
IGC 2
%
SWI 3
(L/m2)
Consumption
(L/m2)
Consumption
(L)
IGC 2
(%)
LCL 4
(L/m2)
Consumption
(L/m2)
Consumption
(L)
IGC 2 (%)
Bars≤774696,051818,2033.4140212061911,0917.9≥203131781,070,8704.4
Hair salon/
Barber shop
0301,88800.0239198212,9950.9≥55445632,8570.1
Craf≤2232,85722,1990.1413835,6620.1≥59229696,0512.9
Dairy≤4021,560,970693,7862.9553537891,2763.7≥7049221,587,1886.5
Dried
foods
≤54590,97965,8120.3182134310,0711.3≥310577590,9792.4
Drinks01,587,18800.011462120,3900.5≥27451899,5080.4
Flora≤1051,01500.0183217249,5901.0≥35516751,0150.2
Groceries≤59122,10192,3970.4154147548,7562.3≥250438258,2731.1
Herbs≤1799,50822320.014876189,5950.8≥278435158,5170.7
Horticulture0258,27300.0758201474,2702.0≥155230251,560,9706.4
Houseware0130,28600.08434122,6420.5≥175423124,6790.5
Industrial≤23158,51754,4330.2504292,8920.4≥78133111,3540.5
Meat market≤1831,912,92238,9330.210277852,665,86711.0≥187127481,912,92279
Pets≤1241,070,87023,3810.1437365562,4902.3≥751994301,8881.2
Restaurants≤661111,354401,0051.7126112521,723,7397.1≥186021772,398,4619.9
Spices0000.0256150333,6221.4≥550000.0
Suplements02,398,46100.09434125,2470.5≥187350130,2860.5
Global
consumption
--2.212.3819.11-5479.910.570.19543.5--11,085,81845.6
1 UCL—Upper Central Line: Cut-off limit for atypical-consumption range (L/m2—average). 2 IGC–Impact on global consumption (%). 3 SWI—Sustainable water consumption indicator (L/m2—average). 4 LCL—Lower Central Line: Cut-off limit for high-consumption range (L/m2—average).
Table 5. Sustainable water consumption indicators by activity category.
Number of
Stores
ULC 1
(L)
HCR 2
(L)
Excessive
Cons (L)
Cost ($)IGC3
(%)
Bars421,715696,051522,414$2.8992.15
Hair salon/Barber shop220,595301,88864,572$7520.27
Craf14255632,8572941$6.0670.01
Dairy375,1921,560,970780,314$4.4303.21
Dried foods133,486590,979256,179$5311.05
Drinks3106,4881,587,188377,012$7661.55
Flora0352051,01515,160$2440.06
Groceries26089122,10172,529$7.2500.30
Herbs4534799,50846,900$9.0760.19
Horticulture613,221258,273116,523$4310.48
Houseware126506130,28657,917$4.3610.24
Industrialized410,004158,51757,881$1.3280.24
Meat market5120,7111,912,922610,706$3.9502.51
Pets165,9561,070,870386,423$341.59
Restaurants25652111,35441,756$6920.17
Spices0000$00.00
Suplements3178,1552,398,461346,881$8911.43
Total--11,083,240.03,756,107.943,700.515.5
1 ULC—Upper limit consumption (L/m2—average). 2 HCR—High-consumption range (L). 3 IGC—Impact on global consumption (%).
Publisher’s Note: MDPI stays neutral with regard to jurisdictional claims in published maps and institutional affiliations.

