Article

The Impact of Transport Exclusion on the Local Development of Biała County

by
Aliaksandr Charnavalau
1,
Elżbieta Jadwiga Szymańska
2,* and
Grzegorz Czapski
3
1
Department of Economics, Faculty of Economic Sciences, Bialska Academy of Applied Sciences John Paul II, Sidorska 95/97, 21-500 Biała Podlaska, Poland
2
Department of Logistics, Institute of Economics and Finance, Warsaw University of Life Sciences-SGGW, 02-787 Warsaw, Poland
3
Department of Management, Faculty of Economic Sciences, Bialska Academy of Applied Sciences John Paul II, Sidorska 95/97, 21-500 Biała Podlaska, Poland
*
Author to whom correspondence should be addressed.
Sustainability 2022, 14(9), 5674; https://doi.org/10.3390/su14095674
Submission received: 26 March 2022 / Revised: 4 May 2022 / Accepted: 6 May 2022 / Published: 8 May 2022

Abstract

:
The issue of transport exclusion is an important social problem. It is of major interest to both central and local authorities. For the purposes of this study, a research questionnaire was conducted on the issue of transport exclusion. The area of the research carried out was Biała County, composed of seventeen communes and two cities. The data were collected based on an electronic questionnaire, i.e., using the CAWI method (Computer Assisted Web Interview). In total, 473 inhabitants of the studied area took part in the survey. Logistic regression, Spearman’s rank correlation method, and Pearson’s chi-square test of independence were all used in the data analysis. The research shows that local communities emphasise the problem of an insufficient number of connections or point out the complete lack of connections with respect to particular localities. Transport exclusion affects, in particular, people living in small towns, the elderly, the disadvantaged, and the disabled. The lack of basic means of transport hinders access to the labour market, especially for people starting their vocational careers, as well as for education, health care, and other spheres of human life. The lack of collective transport forces the inhabitants to use their own cars. As a consequence, the environment suffers from it (more and more exhaust fumes are getting into the air), road infrastructure is excessively being used and the number of accidents is increasing. Additionally, there are traffic jams at the entrances to cities (congestion). Limited access to public transport or its total absence results in the depopulation of localities and halting the development of selected communes.

1. Introduction

The transport exclusion is the restriction of the accessibility of people to means of transport. It is of an economic nature and is related to the inability to provide access to administrative, commercial, educational, health, and labour related facilities. Transport exclusion can be seen in two aspects, namely social and transport. The social aspect is directly related to the exclusion of everyday life celebrations and problems in commuting to work, school, cultural, and other service facilities [1]. The second aspect is purely a transport aspect, which includes mobility and transport accessibility. Therefore, all the barriers to the technical inaccessibility of a given form of transport hinder the proper functioning of society in a given area [2]. The result of that is the emergence or reinforcement of other dimensions of social exclusion related to the limitation of opportunities to receive education, and health services as well as the possibility to change or acquire employment by people who do not have access to the collective public transport. According to T. Komornicki, transport exclusion may have a spatial or social aspect. The spatial aspect refers to an area in which there is no access to collective public transport. The social aspect concerns groups of people who do not have access to such transport [3]. The research shows that insufficient access to transport prevents society from meeting its social needs fully [1,4,5,6].
In recent years, Poland has experienced a growing problem related to transport exclusion, which may affect millions of Poles. It is estimated that 13.8 million citizens live in communes where no public transport is organised by the local authorities [7]; 20% of Polish towns and villages are not connected to public transport services, and many others do not have more than two buses a day [8]. If the residents do not have their own means of transport, and there are no active bus stops or train stations around, then it is necessary to use a family’s or neighbours’ own means of transport. The collapse of many public transport carriers, including Przedsiębiorstwo Komunikacji Samochodowej (commonly abbreviated PKS), was one of the main reasons many regions in Poland became utterly cut off from access to organised public transport. Dealing with the issue of transport exclusion is a task that the government and local authorities face daily. The phenomenon of transport exclusion is a problem for many local self-governments, which are accounted for by society not only for investments in linear infrastructure but also for ensuring access to organised public transport. This problem also applies to Biała County, where research was carried out for the study. A vast database of research in transport exclusion has now demonstrated that transport disadvantages can act to limit access to social and economic activities. It can both lower the quality of life and exacerbate social exclusion [9,10,11,12]. The research on transport exclusion has either focused on specific socially disadvantaged groups or geographical locations facing disadvantages. However, the research conducted so far does not indicate the importance of transport exclusion for local development. Local development is the entirety of changes in the socio-economic perspective of a given territory. J. Parysek defines local development as conducting activities to further a given territorial unit’s economic and social development using its resources and taking into account the needs of residents and their participation in the conducted activities. Local development is a social process involving the activation of local communities, the externalisation of local pro-development attitudes, and the inclusion of social institutions in this process [13]. Actions taken at the local level should aim, inter alia, to support development initiatives to improve the quality of life of local communities [14]. Such activities include the appropriate organization of public transport that meets the local community’s needs.

2. Literature Review

Transport exclusion has been the subject of much research in various countries. Research linking the issues of transport accessibility with the possibility of participation in social activities as well as transport poverty and the risk of transport-related social exclusion has been significantly developed in Great Britain. This is to some extent thanks to the Labor government in 1997–2010, which established, inter alia, the Social Exclusion Unit and Sustainable Development Commission. A certain summary of research work in this area may be the report of the latter, entitled Fairness in a Car-dependent Society [15]. This report assessed the impact of contemporary “focused on car” transport systems on groups, particularly at risk of social exclusion.
In Australia, G. Currie et al. have identified that acute transport cases tend to be found in suburban and regional areas, where distance is a significant barrier to economic and social inclusion [11]. Although Australia has among states the highest car ownership in the world, not everyone has a car or can drive. Young people [16] low-income households [17] and aboriginal populations [18], in particular, are known to experience difficulties accessing work, education, shops, and leisure and cultural activities.
In the Canadian context, A. Paez et al. have been recording similar trends from their Toronto and Montreal Household Travel Surveys analysis. They found that lower-income households, particularly elderly and disabled Canadians, travel considerably less and over shorter distances and have less access to critical services than the average Canadian population [19].
E. Rose et al. analyzed the issue of social exclusion related to transport in New Zealand. They indicated that New Zealand is the country with one of the highest shares of car owners in the population in the world and the share of a car in the travel modal (80%). The authors stated that the policy focused on individual car transport contributed to this state of affairs. At the same time, they indicated that nearly 30% of New Zealanders did not have access to a car, e.g., due to disability, age, or income. This created a risk of social exclusion [20].
D. Oviedo Hernandes and H. Titheridge used qualitative interviews with the residents of informal peripheral communities on the outskirts of the Colombian capital city of Bogota to consider the issue of TRSE (Transport-Related Social Exclusion) based on their lived experiences. They identified how people could generate their coping strategies and solutions to overcome the peripherality of their residential location to provide informal paratransit and vehicle sharing options to access the city, thus avoiding social exclusion [21].
Yamamoto and Zhang examine mobility challenges facing elderly people in rural Japan, where declining population numbers, a shortage of public transport services, and reducing opportunities for being driven by elderly male family members or friends combine to increase exclusion risks. The article illustrates how cultural attitudes and social norms affect how older people manage their nobilities [22].
D. Cao et al. seek to identify areas of relative transport disadvantage within an archipelagic region of the Philippines. The authors assess constraints that limit travel between cities and townships by undertaking a small travel behavior survey and developing a trip generation/distribution model applied across four population centres to observe how physical isolation from larger centers of social confluence can be reflected by lower trip volumes and associated increases in risks of social exclusion. The article estimates how faster inter-island travel times will impact inter-island travel opportunities for people living in areas of relatively more excellent transport and social and economic disadvantage, with the expectation of associated reduction of exclusion risks and improved economic opportunities [23].
M. Kamruzzman and Hine have identified disadvantageous transport conditions over time and space for rural areas in Northern Ireland [24]. N.R. Velaga, et al. undertook the task of researching accessibility and connectivity in rural Scotland, noting significant differences between urban and rural communities [25]. According to them, limitations in infrastructure and transport services in rural areas are often exacerbated by limitations in the development and resilience of technological infrastructure (including technologies supporting rural passengers in using collective public transport and supporting the use of flexible and demand-responsive transport services). L. Shergold and G. Parkhurst presented an interesting study on the transport exclusion of older people in rural areas of South West England and Wales [26]. They argued that living in the countryside and old age increase the risk of social exclusion, with accessibility having an important facilitating role. The topic of seniors’ mobility in peri-urban areas also appeared in a study by J. Ryan and A. Wretstrand. These authors rightly point out that planners and policymakers face a major challenge in improving the public transport system (and the entire transport system) so that older people have alternative modal options and can continue to participate in society [27].
Lucas, Grosvenor, and Simpson examined the role and importance of transport in the lives of economically and socially disadvantaged groups and communities. They noted that transport often acts as an enabler of greater social inclusion and that increased mobility can improve accessibility and social and economic commitment [28].
Part of the research concerned the issue of financial accessibility to public transport from the perspective of the risk of transport exclusion of certain groups. C. Nuworsoo et al. on the example of San Francisco (United States) [29] and B. Nahmias Biran et al. using the example of Haifa (Israel) indicated that modifications to the price list of transport services may significantly change the costs of transport of certain social groups, such as ethnic minorities, people with low incomes, and students [30].
Polish scientific literature on the issue of transport exclusion is much poorer, although mobility studies are carried out at the national [31,32,33,34,35], regional [36,37,38], or local [39,40,41] levels. One of the first people to take up the topic of transport exclusion was P. Zmuda-Trzebiatowski [42]. However, he focused more on so-called transport poverty. On the other hand, J. Kaczorowski conducted a compelling discussion on the consequences of transport exclusion [43]. On the other hand, A. Dubicki identified many factors that led to the collapse of public transport in Poland and the resulting transport exclusion [44]. Few studies concern the relationship between transport accessibility and transport poverty or the social exclusion of M. Baran and D.J. Augustyn [45,46]. However, there is no research on the impact of transport exclusion on local development in Poland. The research problem undertaken by the authors is the filling of this research gap.

3. Public Transport

3.1. Changes in Public Transport in Poland

Changes in public transport are a very important factor in the economic development of every country. It is closely correlated with other sectors of the national economy and determines their development. The efficient operation of the economy without the participation of transport is impossible, as it is an indispensable element of the supply, production, and distribution processes [47]. The importance of transport as a factor determining economic development as well as its impact on the standard of living of the inhabitants increases with transport accessibility.
The implementation of transport, especially at the local level, is one of the most important tasks of local government units. In the act of March 8th, 1990, on local self-government it was stated that providing collective local transport is one of the tasks of local authorities that govern selected communes [48].
Public transport is an alternative to individual transport, especially for people who do not have their own means of transport or cannot use it. Well-developed public transport allows you to reduce fuel consumption, exhaust emissions, noise, traffic jams, and damage to roads. The ability to use well-developed public transport increases the quality of life. It allows one to get to a place of work or study in a safe and timely manner as well as decides about the choice of the place of education, the possibility of taking additional classes or choosing one out of many different places to rest [49].
Road and rail transport play an important role in the regional transport market. The former one is carried out by traditional carriers, i.e., PKS and private carriers. The second is based on the services provided by Polskie Koleje Państwowe S.A (PKP).
The history of changes in the regional bus transport market is associated with the political changes that took place at the end of the 1980s. At that time, transport was carried out mainly by one carrier–Państwowa Komunikacja Samochodowa (PKS). The transport services were supplemented by employee transport, which was carried out by the employers themselves or with the use of outsourcing; with the use of public transport companies. It is worth noting that employee transportation was often free of charge.
In Poland, after 1989, many particularly large enterprises were liquidated, to which employees were transported using public or company transport. New enterprises emerged in their place. These were mostly small companies that could not generate such a large demand for transport [50].
In the following years, along with the liberation of the economy, competition began to emerge in the market for transport services. There, newly established economic entities aimed at taking over the most attractive (profitable) routes. Vehicles of private companies appeared on routes crowded with passengers just before of planned passage of PKS buses while offering transport for a lower price. The private carriers operated the most profitable bus connections, while PKS buses were expected to fulfill their missions, which was to follow routes that were not profitable, yet crucial for social reasons [46]. In the mid-1990s, it was common to plan timetables of private carriers according to the principle “Five minutes before the PKS” [51]. This usually resulted in the situation, where the second bus was empty due to leaving too little time between departures. Such a state of affairs was favourable for passengers, which was determined by the attractiveness of prices of private carriers [52].
The 1990s were a difficult period in the functioning of the national railways, which was also noticeable in terms of the PKP transport offer. A significant drop in the number of passengers was observed, while the assets and transport potential of enterprises were not used, and subsidies from the state budget were reduced. It determined the need to implement radical measures related to the reduction of the operating costs of the PKP company. Limitations in the service offer resulted in the liquidation of many passenger lines [6]. In this way, the Polish railways experienced a crisis in the 1990s [53].
On 3 April 2000, then the Polish State Railways (Before the 2001 reform) suspended trains on 1028 kilometres of the railway network. This event is now known as a “sharp cut”. Then, on an unknown scale at that time, hundreds of thousands of town and country inhabitants were cut off from rail transport [54].
In 2020, the railway transported 209.2 million passengers in Poland [55]. “Compared to 2019, 127 million fewer people and 13 million tons goods less. Such significant drops, especially in passenger transport, illustrate how many challenges railway transport had to face during the time of the global crisis caused by the coronavirus pandemic [56].

3.2. The Issue of Transport Exclusion

The years of centrally controlled public transport often resulted in a mismatch between the offer and customer expectations. Local governments had no influence on the transport services PKP and PKS had to offer. As a result, some residents did not have access to public transport.
The issue of transport exclusion is noticeable, especially in areas with low population density, where the demand for transport services is highly volatile. Communication problems occur especially in rural areas, where 40% of Poles live [49].
The problem of public transport increased especially with the migration of inhabitants of small towns to larger cities. Deteriorating financial results of carriers resulted in limitations of the offer, e.g., suspension and liquidation of the evening, inter-peak, and non-peak courses.
The remaining offer was based on public funding for the carried out transport. The network of connections present at that time was not adapted to the needs of the inhabitants (e.g., one trip a day through the town with no possibility of returning or returning late).
Overgrown tracks, poles without tractions, damaged bus stops, or empty railway stations are the landscape of many Polish villages and towns. They were all cut off from communication links [57]. No transport connections or the wrong schedule is the main reason why many people cannot start working. There is the inability to travel to the place of employment, e.g., at 6.00 a.m., when only the first bus passes through a given town at this time and only on working days. Determined people try to solve this problem on their own and, therefore, they commute with the use of their own vehicle or look for people who drive to the same time or workplace.
Nowadays, the issue of transport exclusion is being handled by a wide range of associations, social activists, local authorities, politicians, as well as infrastructure managers. The lack of transport connection reduces the quality of life for people who do not have their own means of transport. Lack of communication also affects the tourism of a given region. Tourists travelling by bus or train rarely reach unconnected towns, which hinders the development of local tourism. Despite the actions to fix the issues and priorities of the state policy, still, over 60% of minor communes in the country do not deal with the subject of public transport at all, and 50% of the self-governments inspected by the Supreme Audit Office did not examine or analyse the transport needs in their self-governments [57].
The Bus Transport Development Fund (known as FRPA) was established by the Act of 16 May 2019 on the Public Transport Development Fund [58]. Its task is to finance a single bus transport line in public utility bus transport. The subsidy from the Fund’s resources applies to the transport lines that are not operational at least 3 months before the effective date of the Act and lines for which the contract for the provision of collective public transport services will be concluded after the effective date of the Act [59].

3.3. Characteristics of the Region Covered by the Research

Biała County is situated in the eastern part of Poland, in the north-eastern part of the Lublin Voivodeship. The eastern border of this county is the border between Poland and the European Union with Belarus. From the north, Biała County borders the County of Siematycze, and from the west with the following counties: Losicki, Siedlce, and Łuków. From the south, Biała County is adjacent to the following counties of the Lublin Voivodeship: Włodawski, Parczewski and Radzyński. Biała County also borders with Biała Podlaska-a city with county rights.
The area of the Biała County is approximately 2755 kilometres square. In terms of area, it is the largest county in the Lublin Voivodeship and the third largest county in Poland. The Biała County consists of two cities: Międzyrzec Podlaski and Terespol as well as 17 rural communes: Biała Podlaska, Drelów, Janów Podlaski, Kodeń, Konstantynów, Leśna Podlaska, Łomazy, Międzyrzec Podlaski, Piszczac, Rokitno,Rossosz, Sławatycze, Sosnówka, Terespol, Tuczna, Wisznice, Zalesie [60]. As of 30 June 2020, the population of Biała County was 109,958 inhabitants. In 2020, 110,124 motor vehicles and tractors were registered in the studied area, including 77,796 passenger cars, i.e., 702.3 per 1000 inhabitants and 6923 motorcycles. When compared to the Lublin Voivodeship and the entire country, the indicators were much higher [61].

3.4. Public Transport in Biała County

A significant date in the operation of public transport in Biała County was the liquidation of PKS in Biała Podlaska that occurred in 2011. Then, the connections were taken over by the local and neighbouring transport companies. Private micro-businesses were also of great importance, providing connections with Warsaw, Lublin, Terespol, Parczew, Białystok, Konstantynów, and Janów Podlaski [62].
The Bus Transport Development Fund was also a great chance for many inhabitants of Biała County. In the second half of 2019, the local government of the studied region carried out public utility bus transport on the following routes: I. Drelów–Międzyrzec Podlaski via: Aleksandrówka-Bereza II. Międzyrzec Podlaski–Strzakły III. Janów Podlaski–Terespol–Kodeń [63].
Since 1 January 2020 other routes have been launched:
I.
Międzyrzec Podlaski–Wólka Krzymowska–Tłuścieć–Międzyrzec Podlaski
II.
Międzyrzec Podlaski–Strzakły
III.
Terespol–Janów Podlaski
IV.
Pratulin–Błonie–Cieleśnica–Rokitno–Michałki
V.
Sosnówka–Wisznice–Rozwadówkę–Dębów–Romanów–Lipinki–Przychód–Żeszczynkę—from 1 November to 31 December 2020 (due to additional recruitment announced by the Lublin Voivodeship) [64].
VI.
Kodeń–Terespol
VII.
Międzyrzec Podlaski–Drelów–Żerocin–Biała Podlaska [65].
During 2020, the bus transport lines in use were monitored in terms of the number of passengers and transport needs reported by residents. As a result of the small number of passengers, there were a correction of the amount and the course of bus transport lines in 2021. In that period, there were four bus transport lines planned to be open in Biała County: Bus line No. 1: Międzyrzec Podlaski–Wólka Krzymowska–Tłuściec–Międzyrzec Podlaski, Bus line No. 2: Międzyrzec Podlaski–Strzakły, Bus line No. 3: Terespol–Janów Podlaski, Bus line No. 4: Kodeń–Terespol [59].
In 2021, as a part of the indicated Fund, 8 lines operating in the communes of Biała County and Lublin Voivodeship were co-financed. The following transport lines were covered by the subsidy from the Fund’s resources:
  • Commune of Konstantynów
Bus line No. 1 on route: Konstantynów–Antolin–Konstantynów
Bus line No. 2 on route: Konstantynów–Zakalinki–Konstantynów
2.
Commune of Tuczna
Tuczna–Choroszczynka–Tuczna
Tuczna–Żuki–Tuczna
Leniuszki–Międzyleś–Tuczna
3.
Lubelskie voivodeship
Bus line No. 3 on route: Międzyrzec Podlaski–Ostrów Lubelski
Bus line No. 4 on route: Międzyrzec Podlaski–Siemień
Bus line No. 5 on route: Trzebieszów–Biała Podlaska [65].
The bus lines created as a result of the actions of communes, counties, and the voivodeship partially filled the transport gap in Biała County. The appropriate course of routes enabled free access of the county’s inhabitants to workplaces, schools, offices, or other institutions.

4. Materials and Methods

The subject of the research was transport exclusion and its impact on the functioning of the inhabitants and the development of Biała County. The main aim of the research is to assess the impact of transport exclusion on the professional and private life of the county. For the purposes of achieving the main goal, several specific targets were formulated:
recognising the frequency and purpose of using public transport
determining the reasons for not using public transport
assessment of the quality and frequency of public transport services
diagnosing the relationship between the age of users and the assessment of collective transport
determining the relationship between car ownership and the evaluation of collective transport
identifying ways to eliminate transport exclusion.
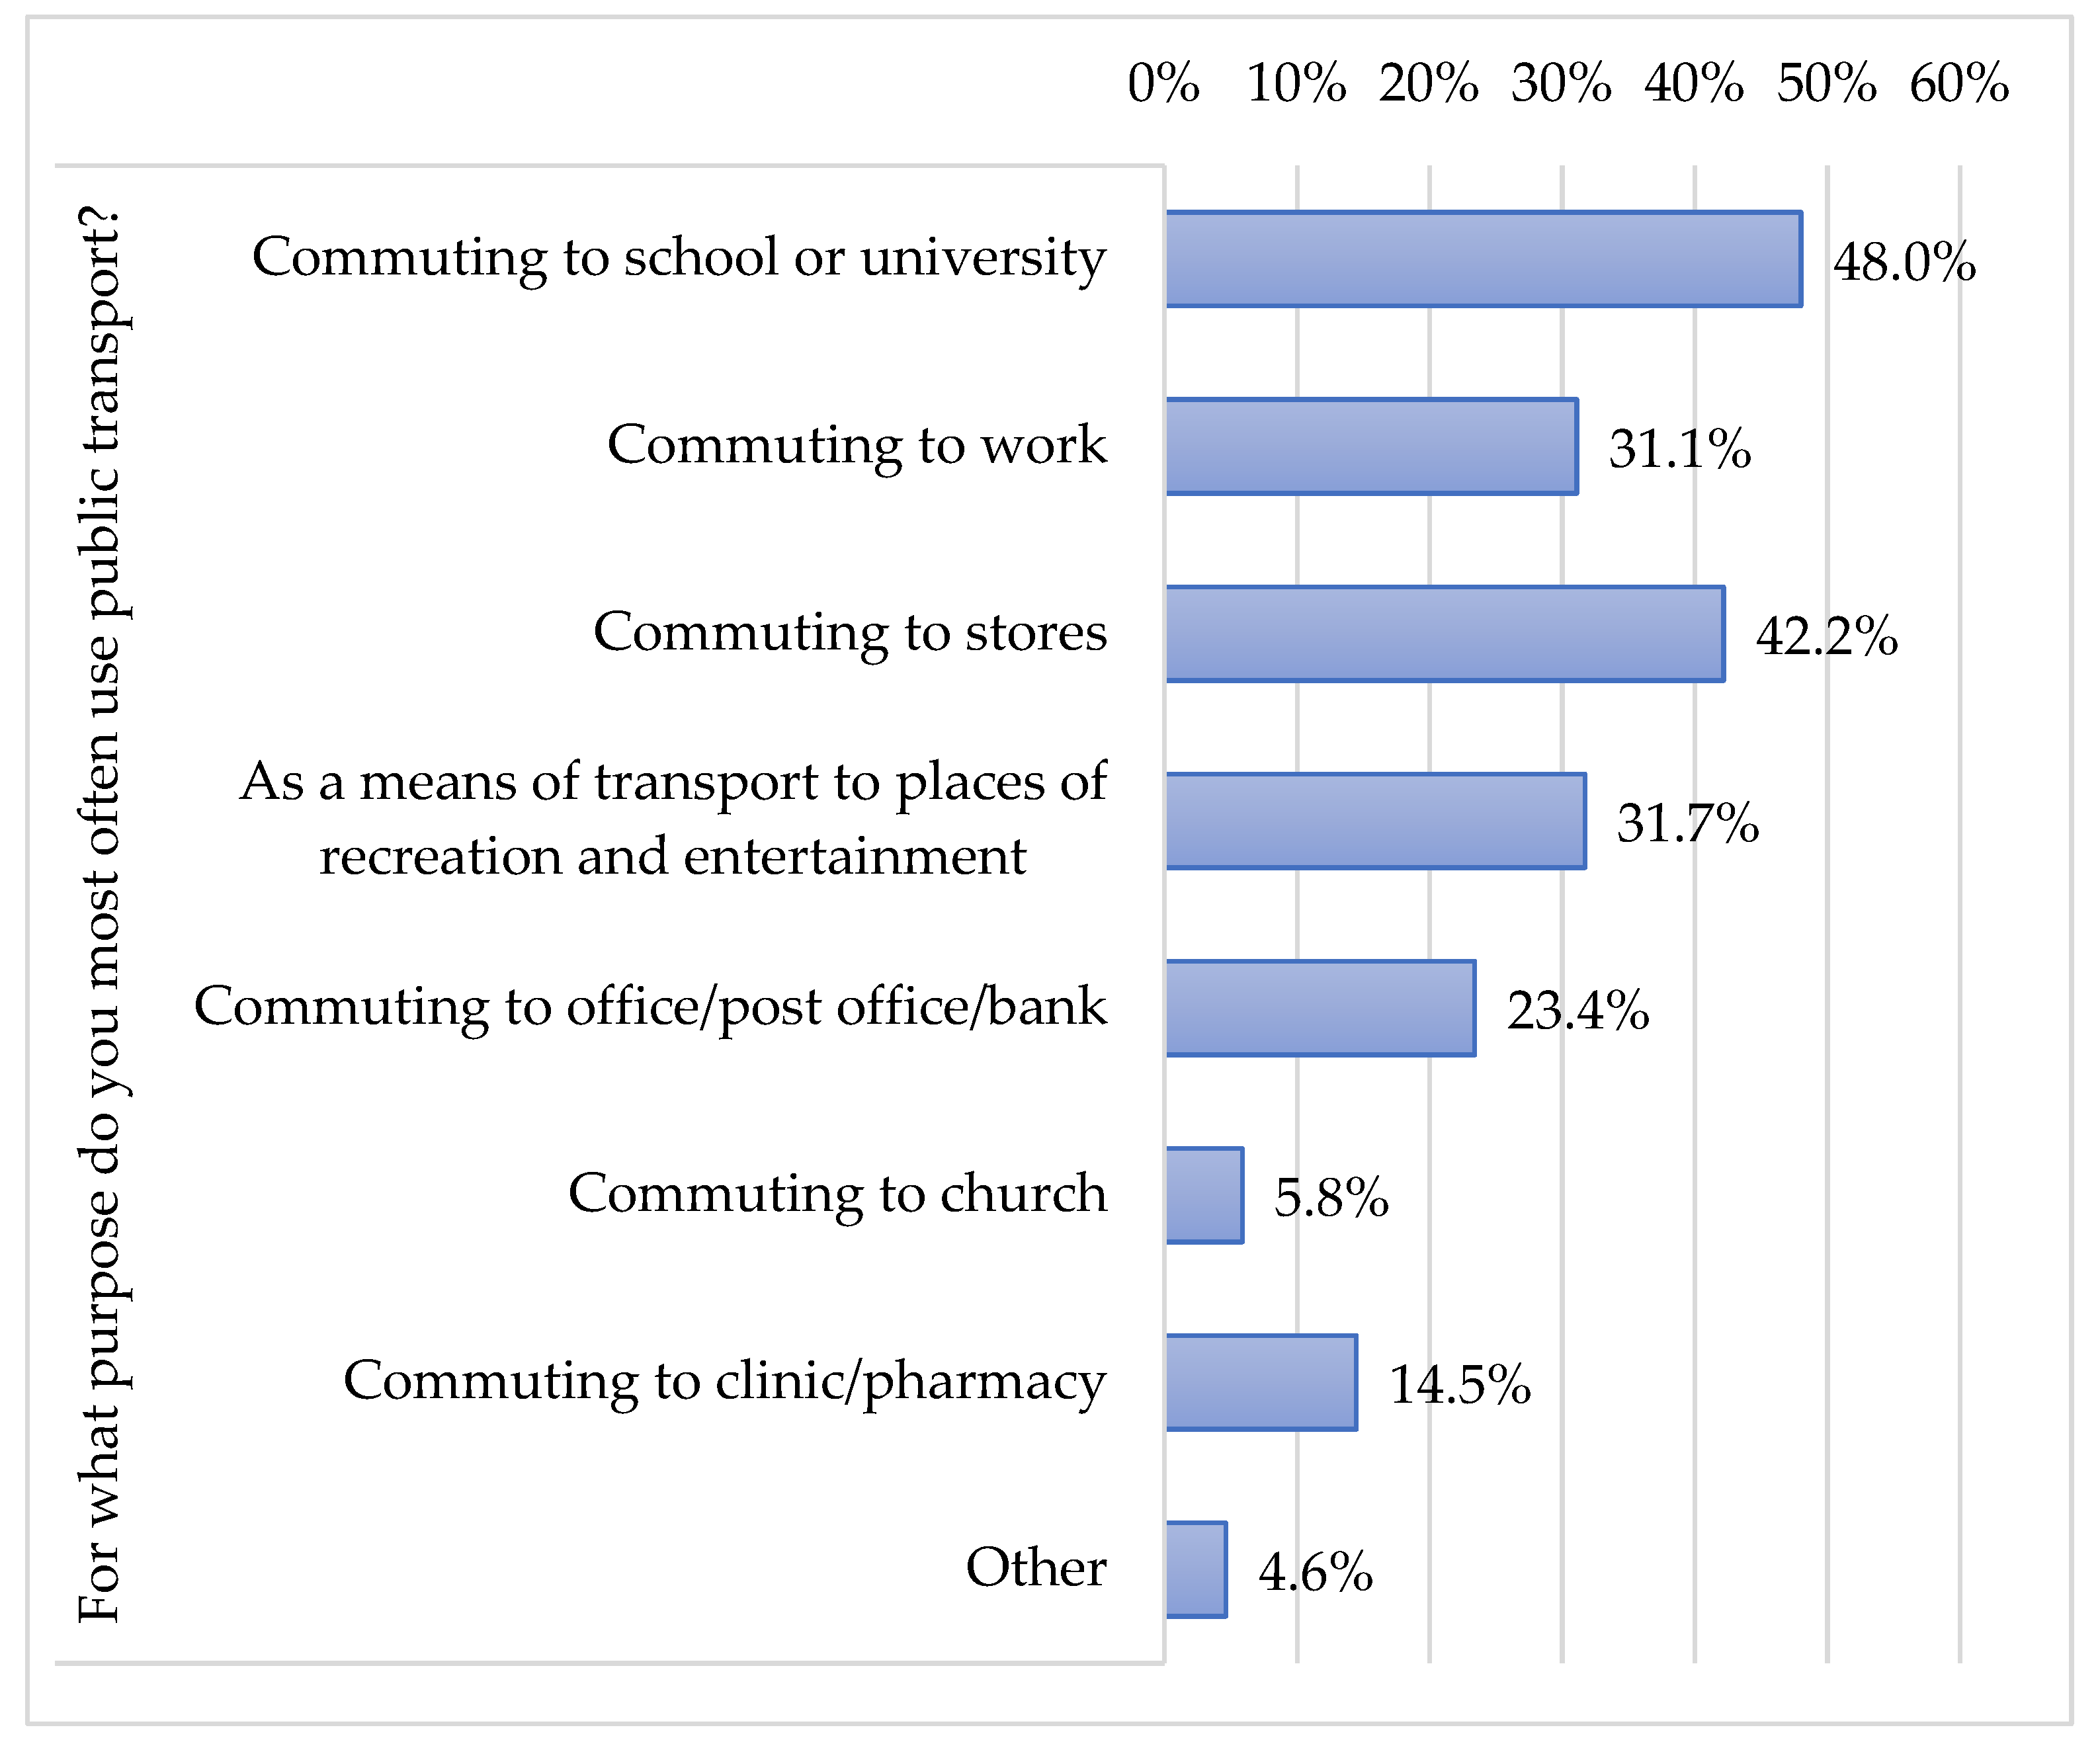
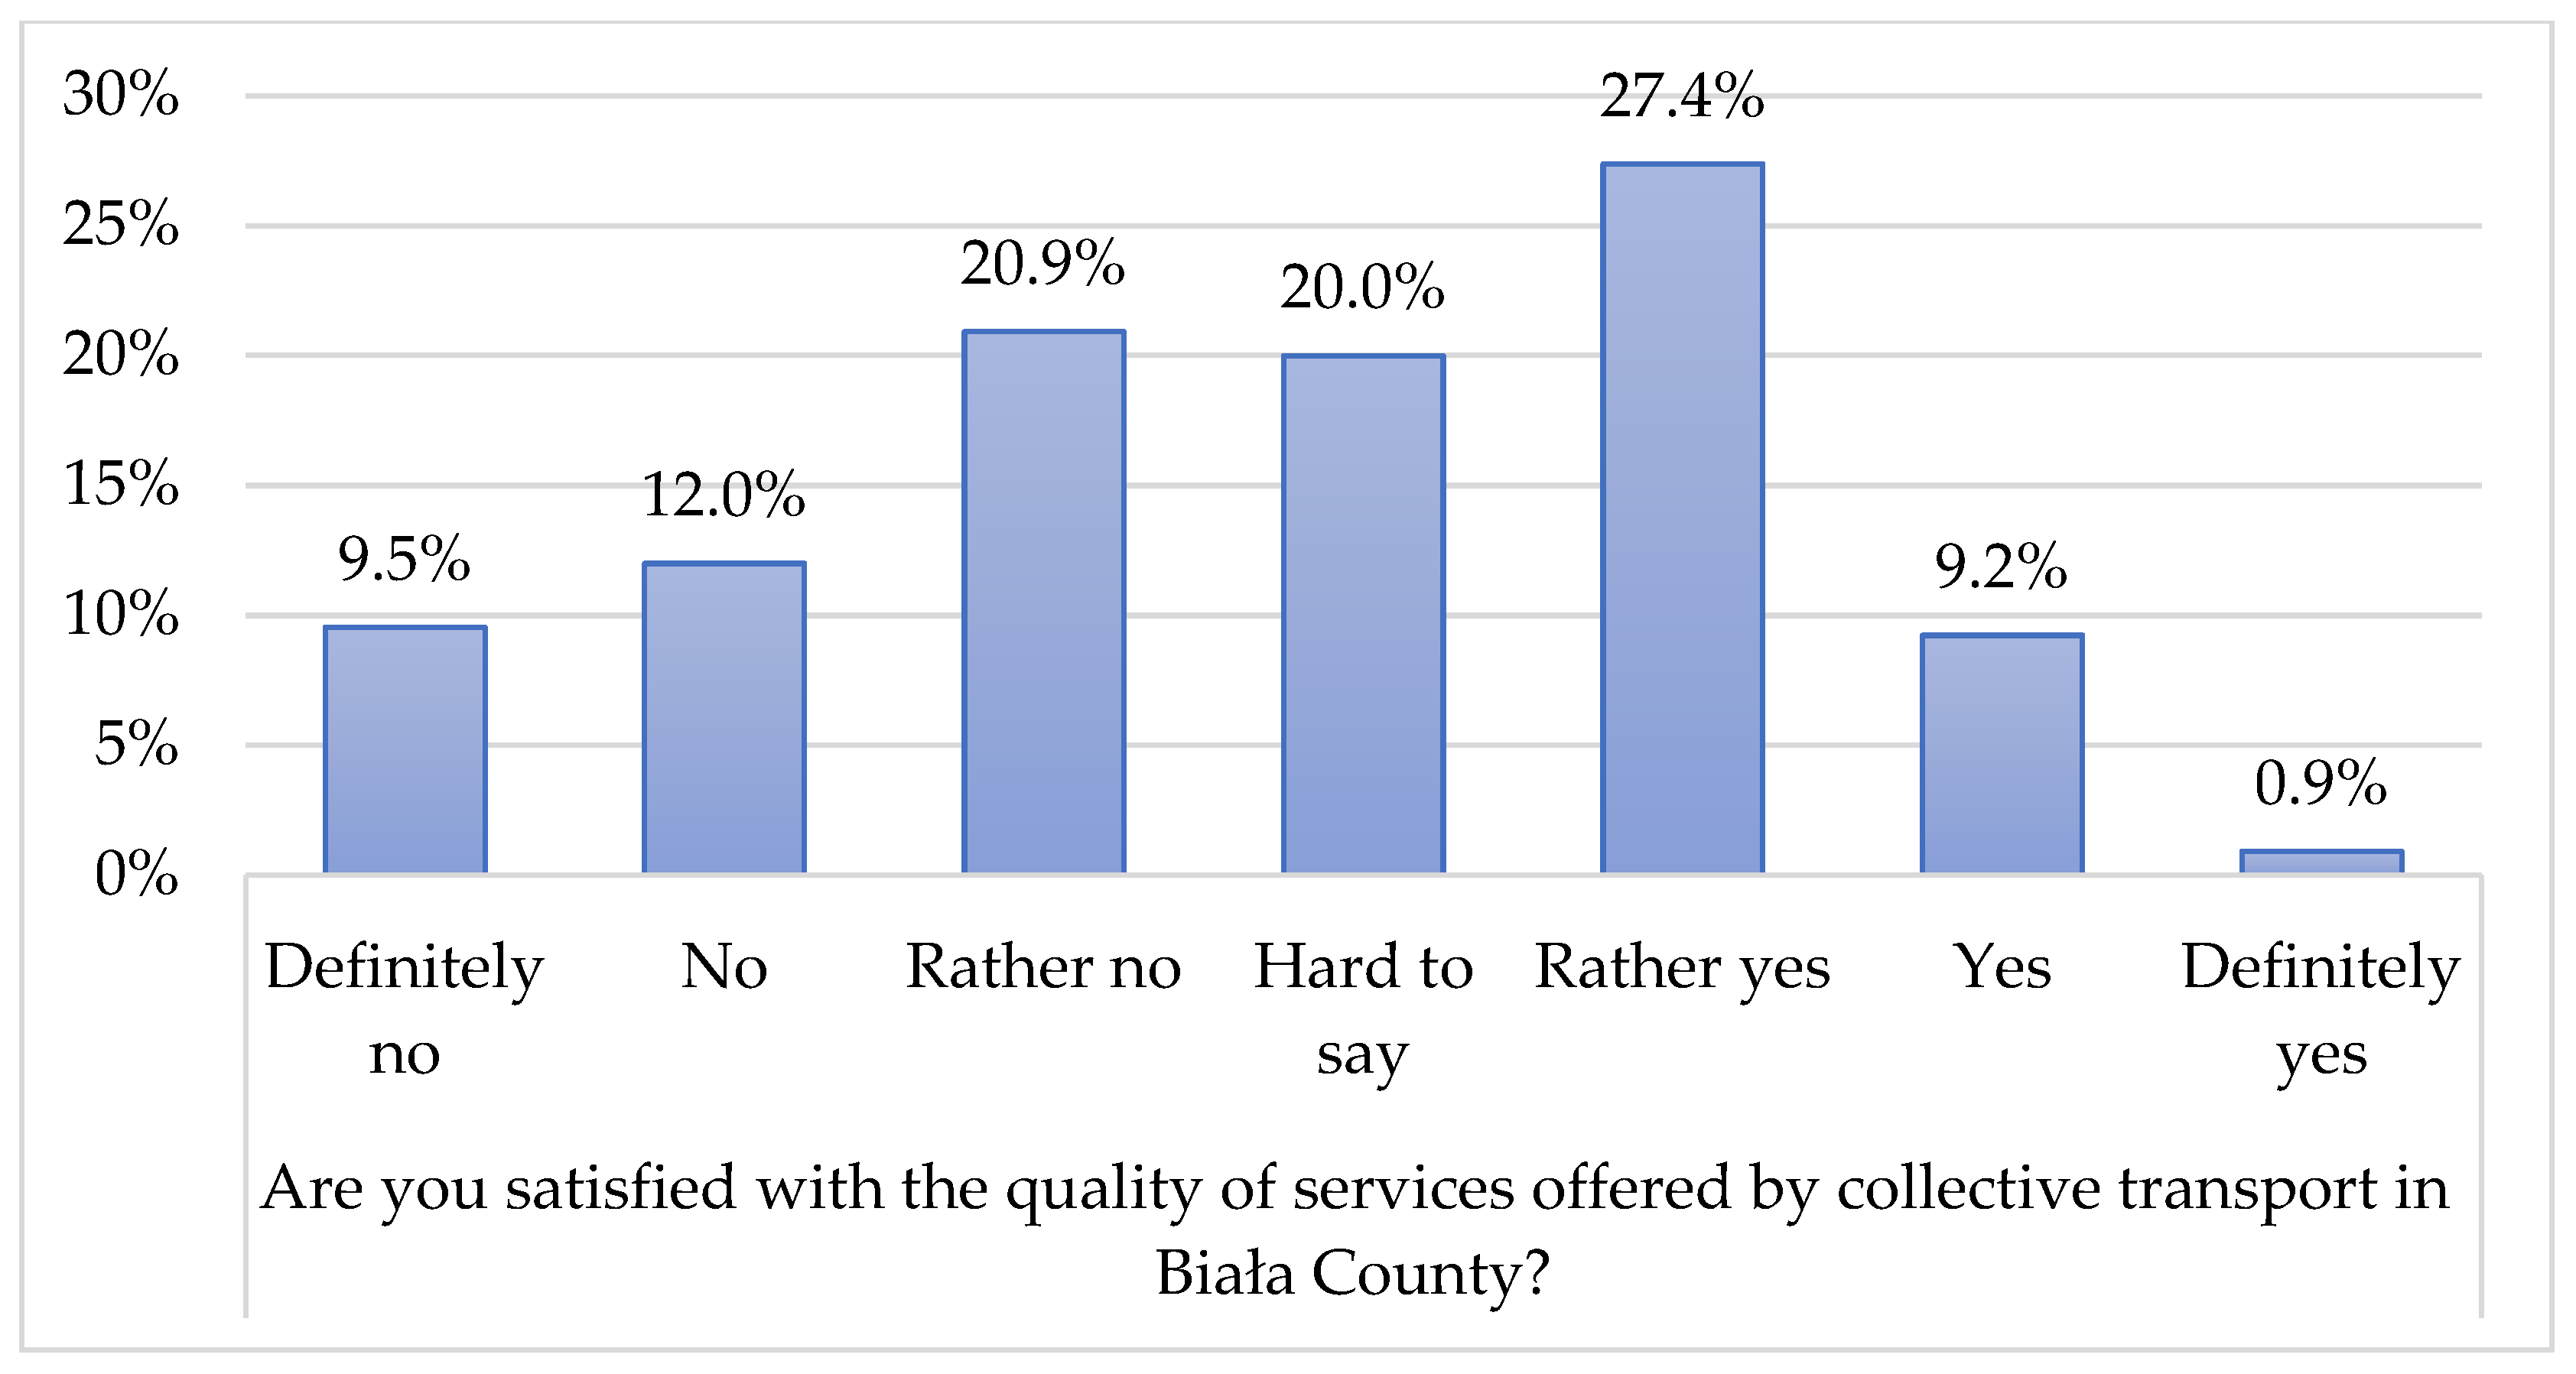
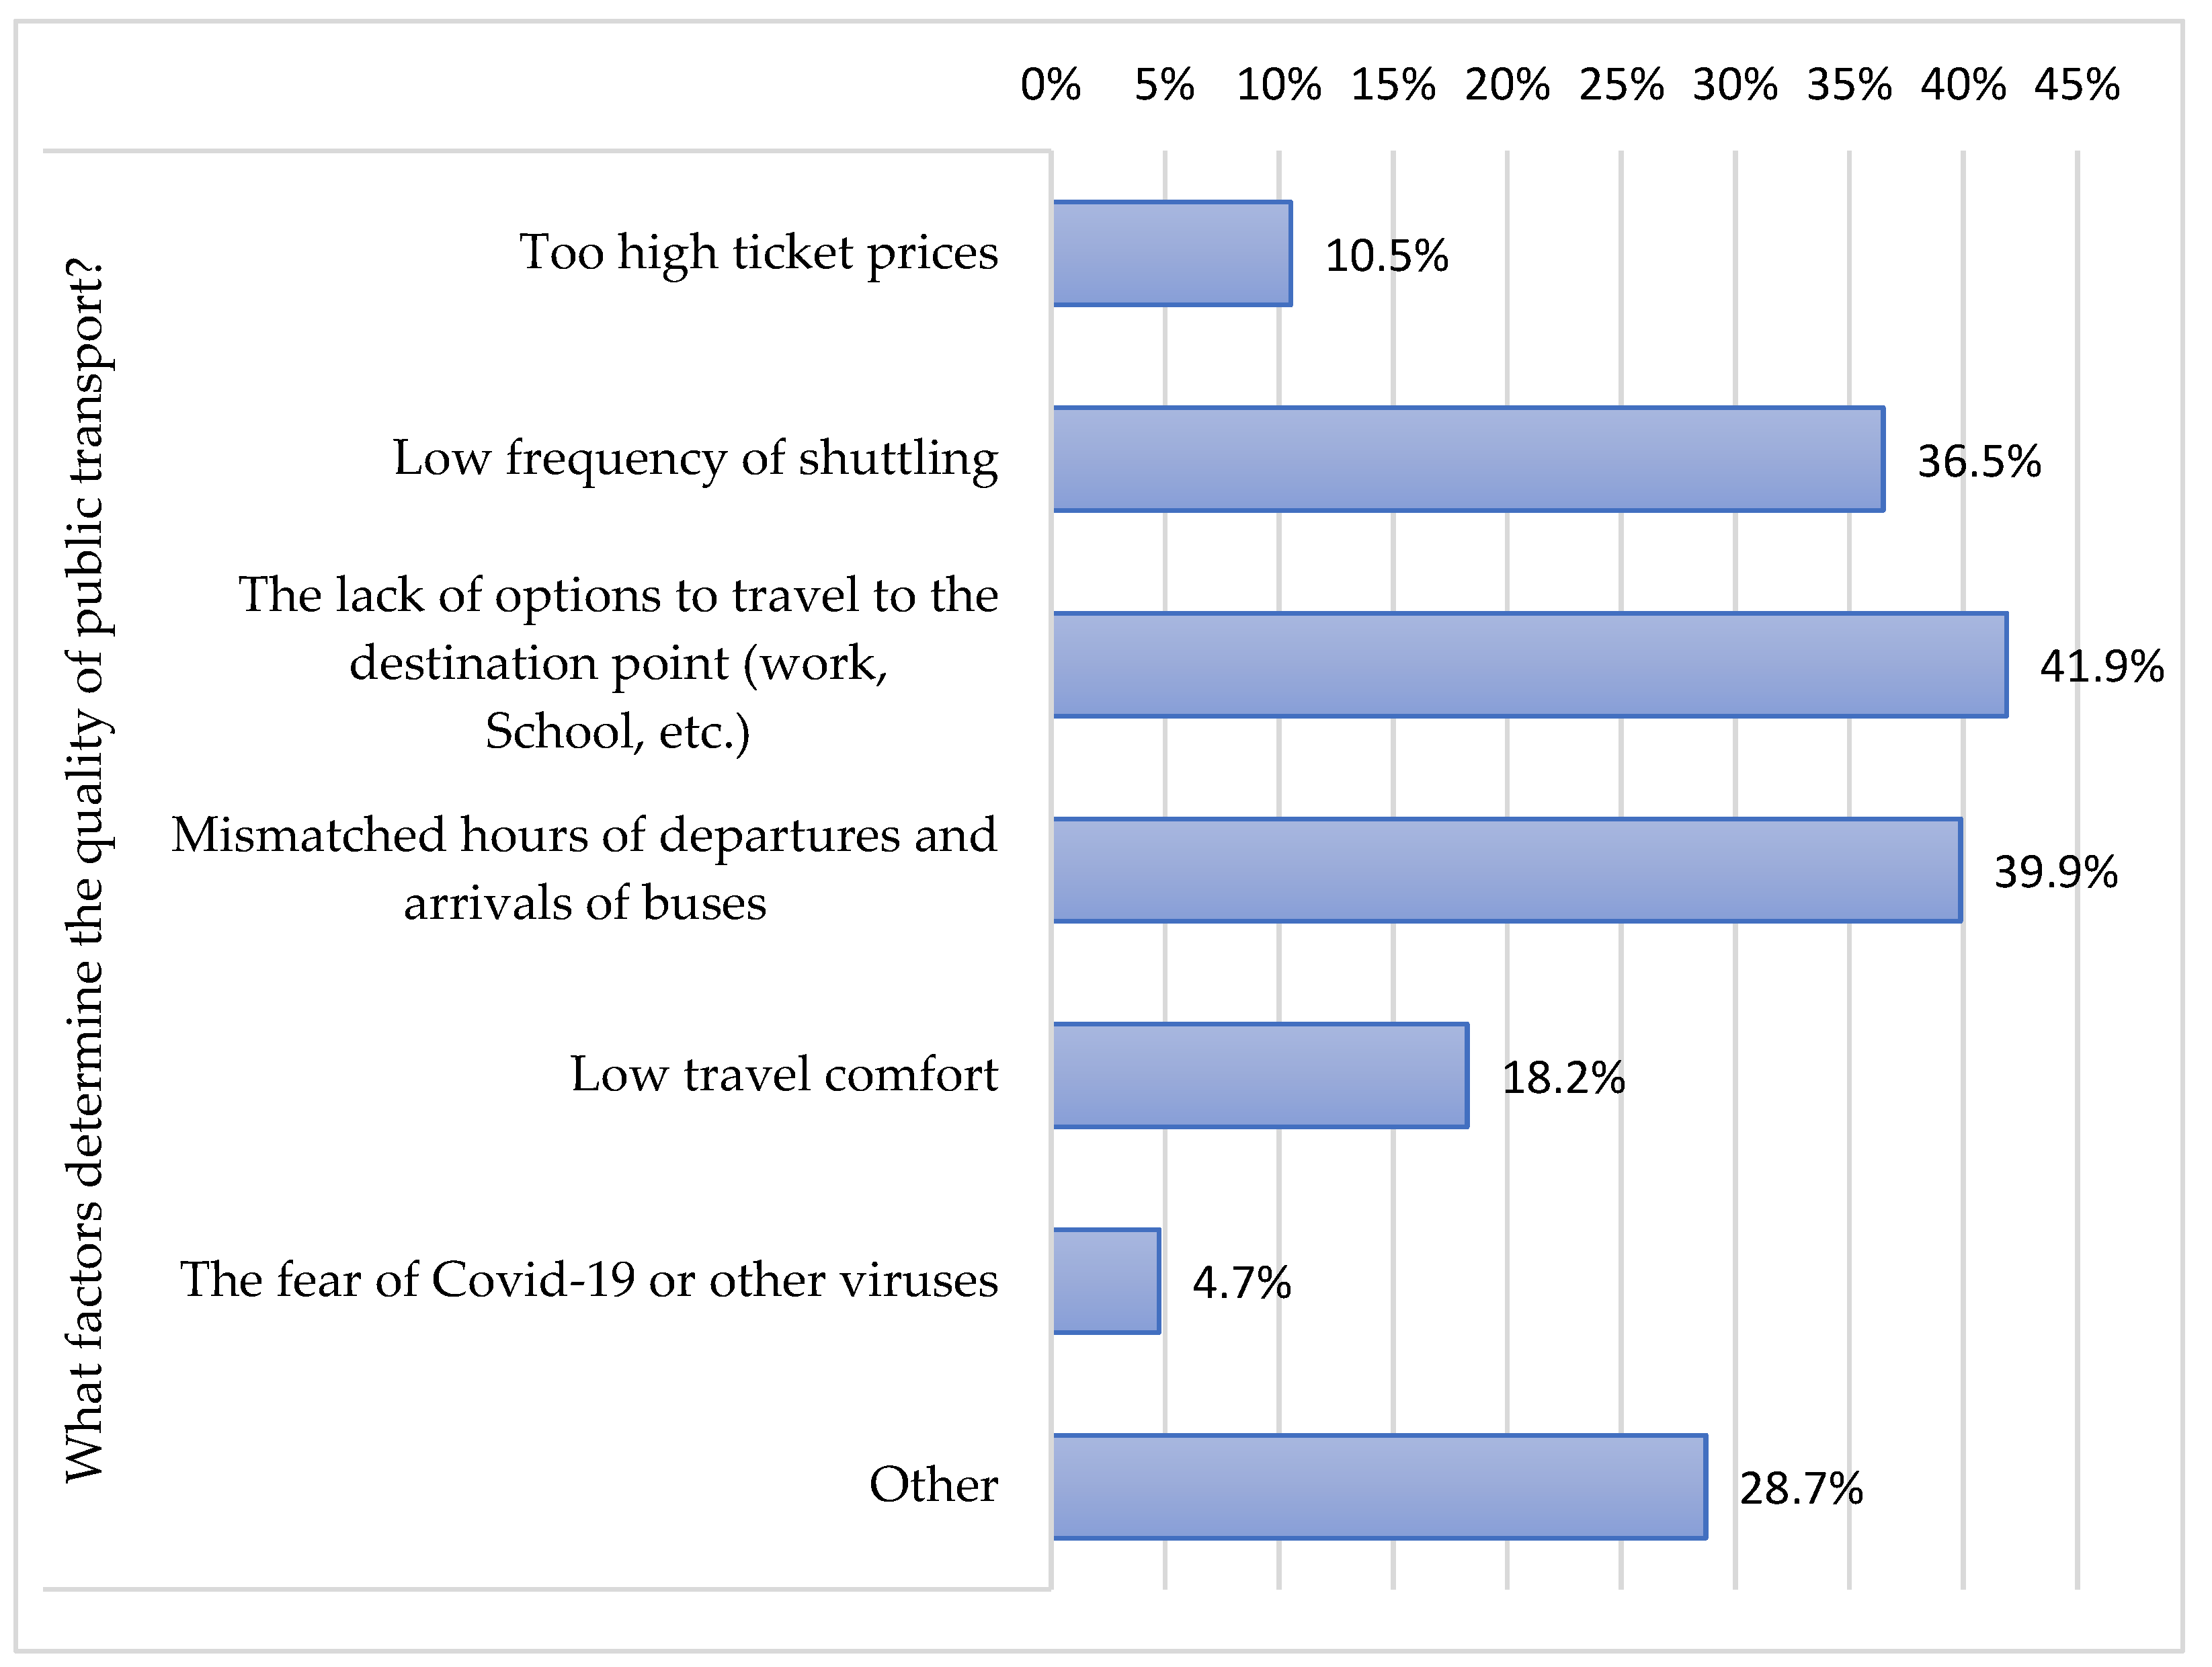
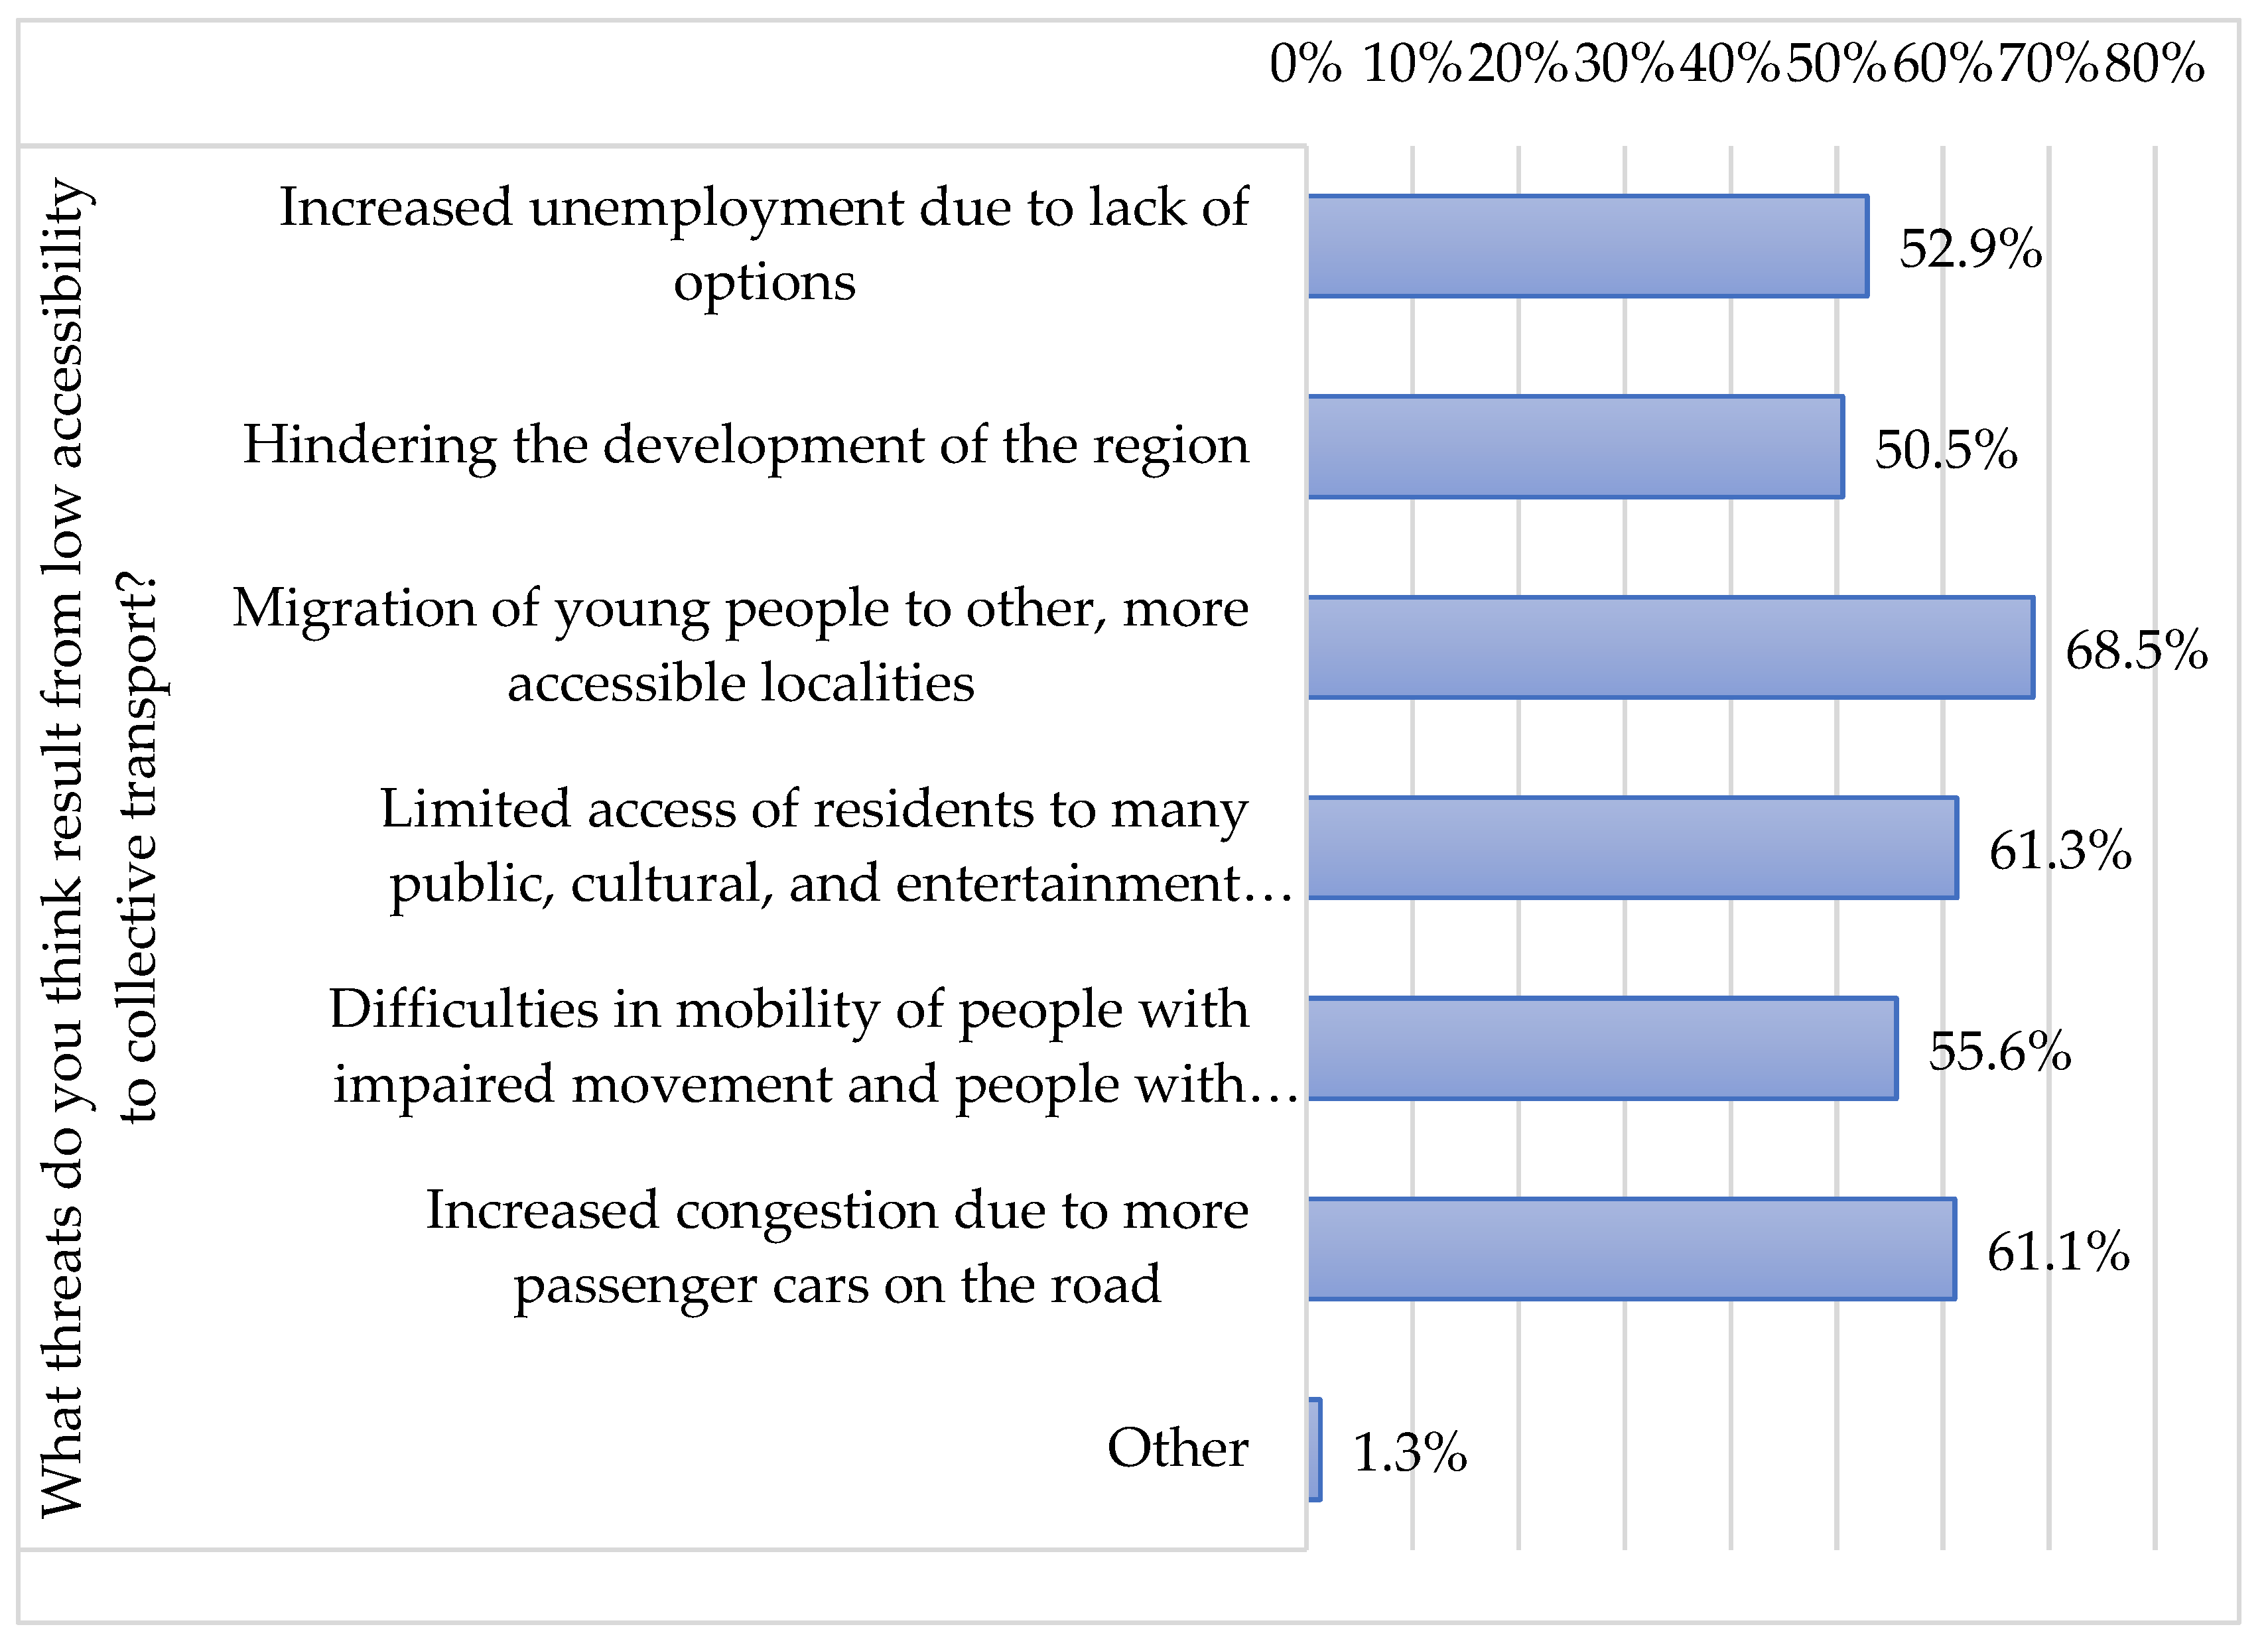
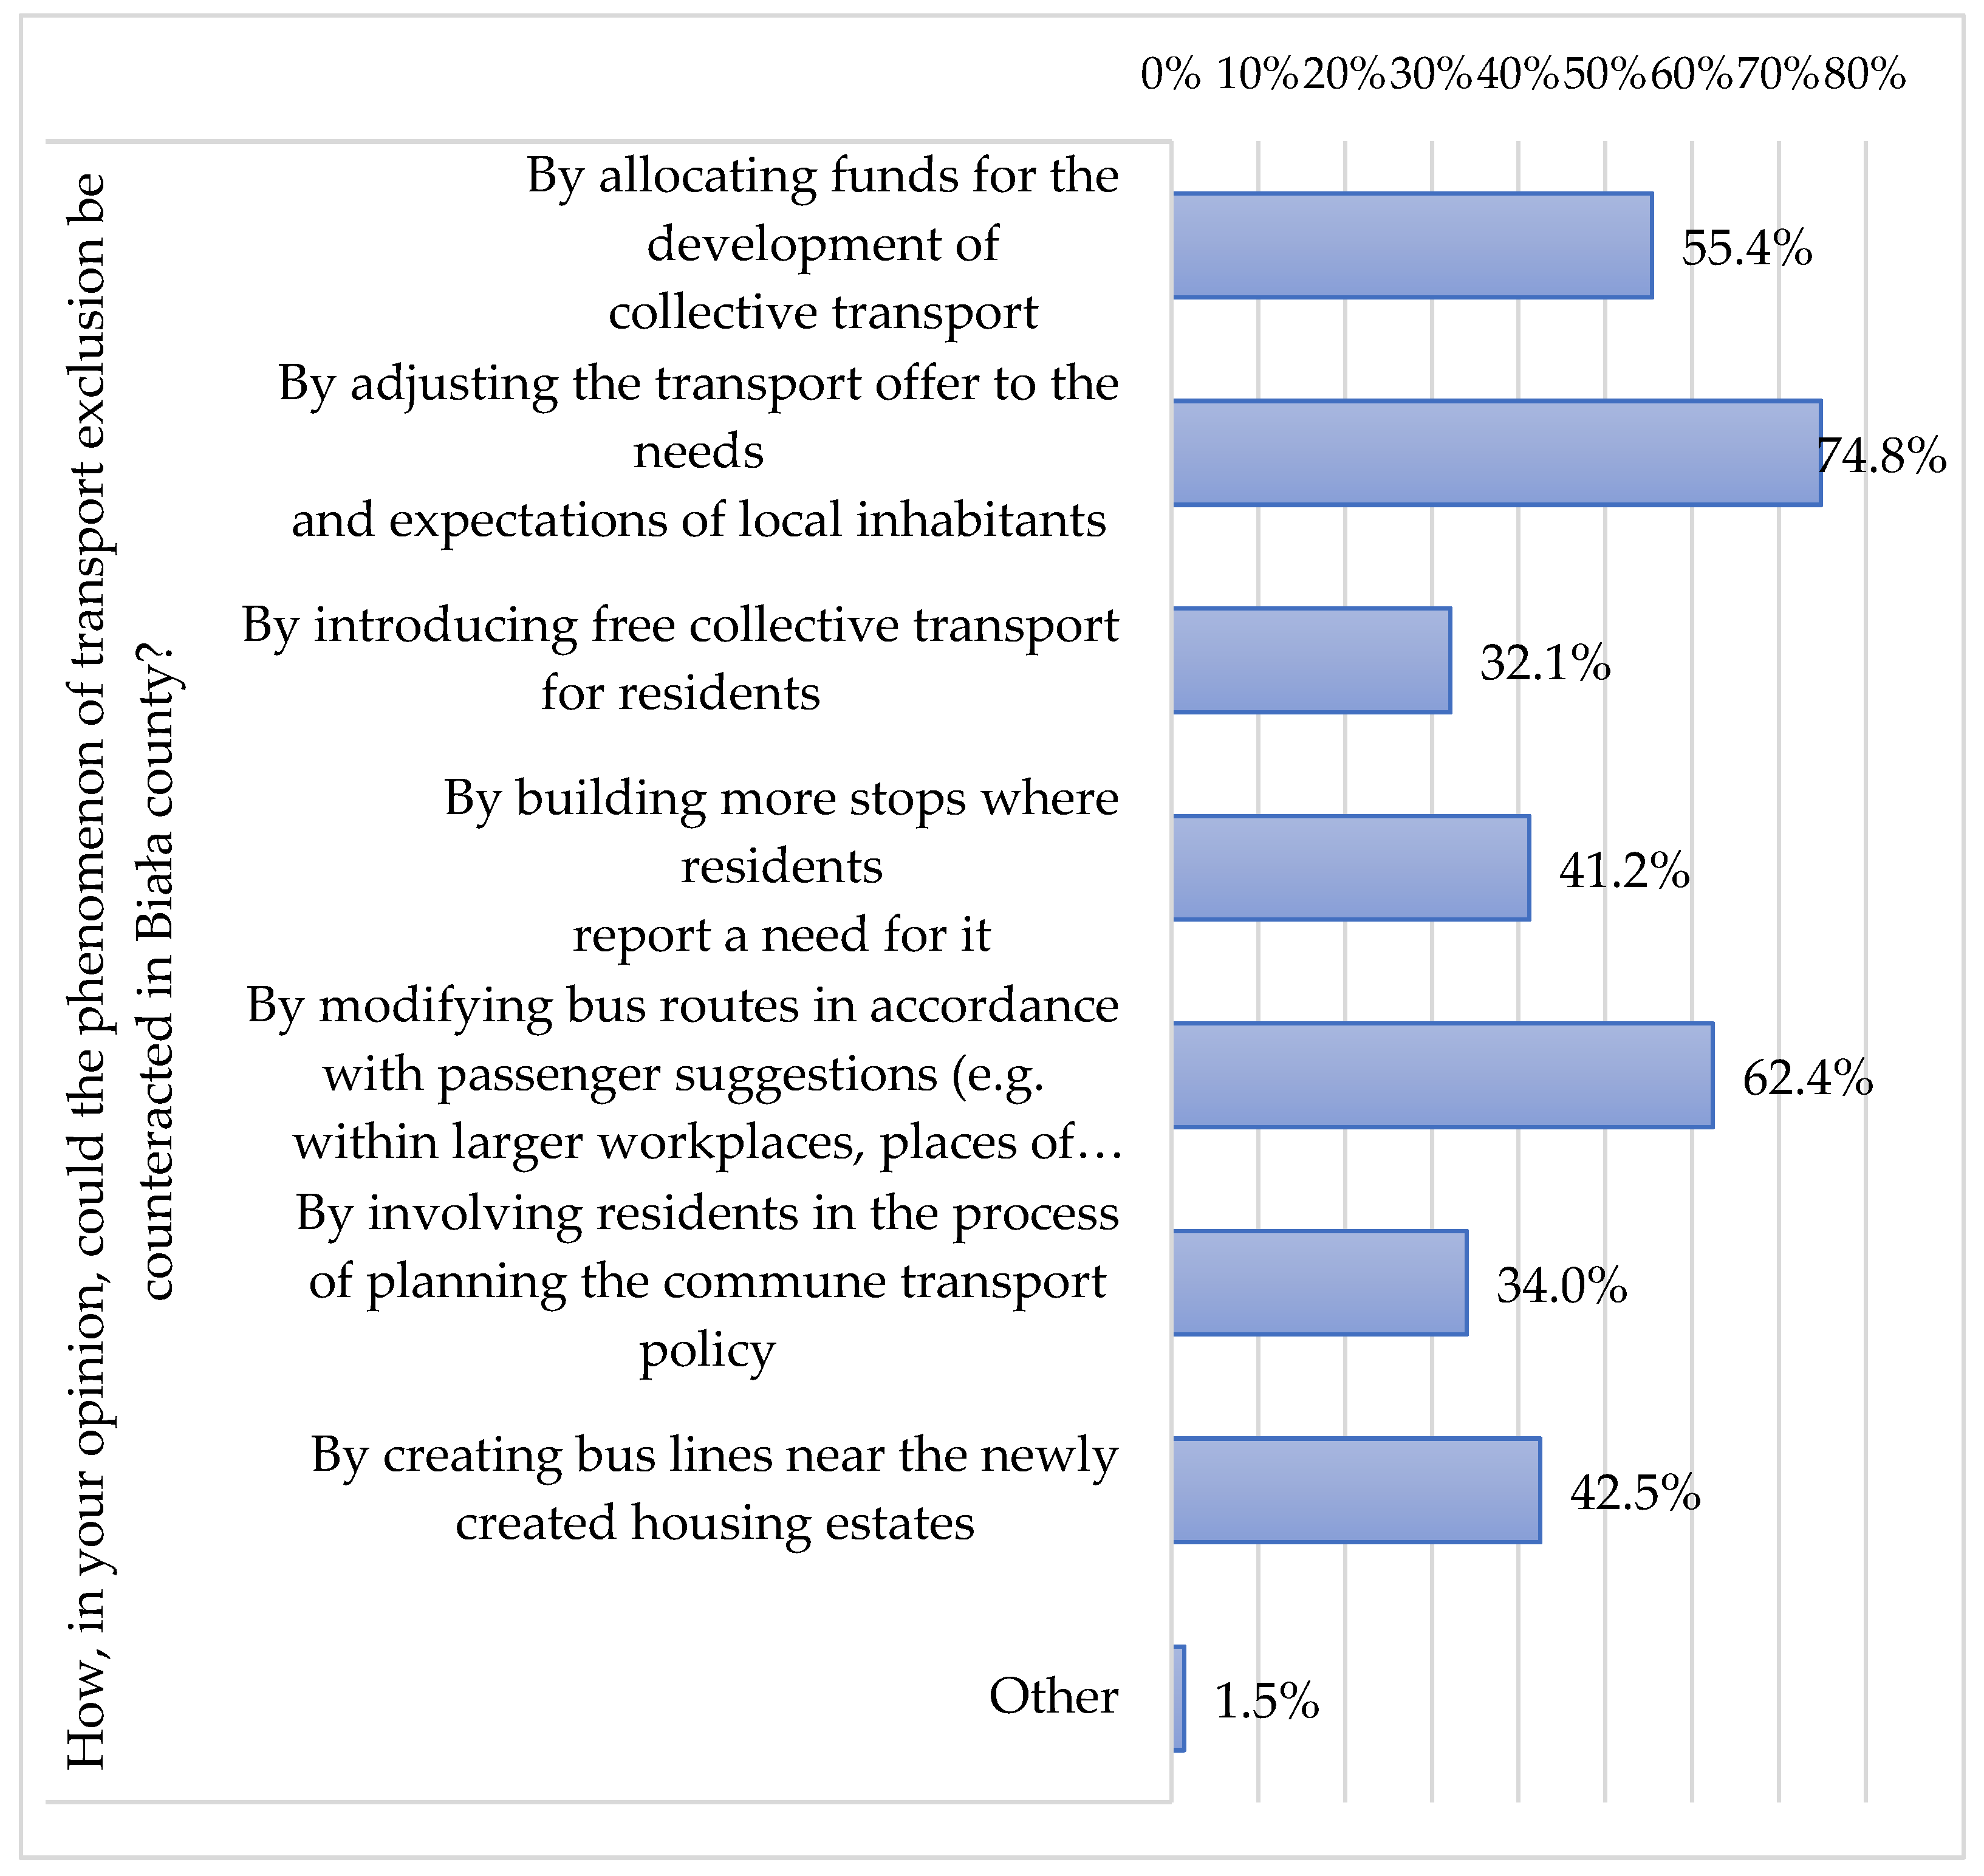
Three research hypotheses were formulated in the research.
H1. 
Transport exclusion determines the professional and social development of the inhabitants.
H2. 
Transport exclusion affects the net migration of the society.
H3. 
Transport exclusion has a negative impact on the development of the region.
In order to achieve the goals adopted in the research and to verify the research hypotheses, the authorship questionnaire was used. It was prepared in the electronic version and made available to the inhabitants of Biała County. The research was carried out using the CAWI method (Computer Assisted Web Interview) The CAWI method involves the creation of a research questionnaire, which is shown on the website in such a way as to be available online for respondents to fill out [66]. Questions and answers in the questionnaire are standardized and previously predefined [67]. The online questionnaire was made available on social networks and on offices’ websites (File S1). This research method resulted from the development of the COVID-19 pandemic and the necessity to limit direct interpersonal contacts. However, the research took into account that 90.4% of households have access to the Internet in Poland, and 88.9% in the studied powiat. Such broad access to the Internet made it possible to cover a large group of residents with the research. To maintain the sample’s representativeness, its minimum size was calculated based on the formula [68].
N min = Np ( α 2 f ( 1 f ) Np e 2 + α 2 f ( 1 f )
where:
Nmin—the minimum sample size
Np—the population size
α—the confidence level
f—the fraction size
e—the assumed estimation error
The following parameters were considered in the calculations: confidence level—95%, fraction size—0.5, and maximum error—5%. Moreover, in 2021, 110,454 people lived in the analyzed powiat.
To determine the appropriate size of the research sample, statistical requirements were taken into account, and the following parameters were taken into account: confidence level—95%, fraction size—0.5, and maximum error—5%. Based on the adopted assumptions, the research sample’s minimum (required) size was calculated at 383 people. The research carried out in November 2021 involved N = 473 participants from 19 communes of the white powiat. Such a number of respondents allowed for appropriate inference. The descriptive method was used in the data analysis. Pearson’s chi-square test of independence was used in order to determine the relationship between the commune and the evaluation of the public transport offer, as well as the relationship between car ownership and the frequency of using public transport. For the recognition of the relationship between age and grade significance of public transport, Spearman’s rank correlation analysis was used. For the purpose of determining the determinants of the negative impact of the lack of public transport on the quality of life, logistic regression was used.
Before applying these methods, it was checked whether the adopted size of the research sample would be appropriate. According to M.A. Bujang et al., for observational studies that incorporate logistic regression in the analysis, a minimum sample size of 500 is recommended to obtain statistics that can represent parameters in the target population. The other recommended rules of thumb are an EPV of 50 and formula; n = 100 + 50i, where i refers to a number of independent variables in the final model. However, a sample size of less than 500 may be sufficient for associations that yield medium to large effect sizes [69].
A procedure based on the results of Bonett and Wright was used to calculate the sample size needed to obtain a specific width of Spearman’s rank correlation [70]. This procedure requires a planning estimate of the sample Spearman’s correlation. The accuracy of the sample size depends on the accuracy of this planning estimate. Assuming a bivariate normal population with population rank correlation, the transformation of the sample Spearman’s rank correlation from r to zr is approximately normally distributed with variance 1/(n − 3) [71].
z r = 1 2 ln ( 1 + r 1 r )
The lower and upper confidence limits are obtained from the formula:
z r ±   z crit 1 + r 2 2 n 3
where zcrit = NORM.S.INV(1 − α/2).
After transforming this formula and making several assumptions (the zcrit is 1,959,964, the width of the interval is no wider than 0.1, and the estimate of the sample Spearman’s correlation is 0.16), the study sample size was calculated at 392. The obtained sample size allows the results’ generalisation. Based on the calculations presented in the study, it seems that the obtained results can be generalised in the area of the surveyed powiat.

5. Results

The majority of the study group were women (72.7%), and in terms of dwellings, people living in the commune of Biała Podlaska dominated (36.4%), followed by the commune of Łomazy (6.1%), commune of Wisznice (6.1%), commune of Podlaski (5.7%), commune of Kodeń (5.3%), and the town of Międzyrzec Podlaski (4.7%). The subjects were between 14 and 77 years old, and the mean age was 30.34 years. The largest group consisted of people aged 18–25 (41.6%) and those aged 26–40 (35.5%). In terms of education, the studied group was dominated by people with secondary education (42.9%), followed by higher education (39.3%). The research was dominated by working people (53.1%) and students (30.9%), and a relatively low share of retired people (1.7%) and disability pensioners (1.2%). The presented data indicate that mainly young and middle-aged people, studying or professionally active, participated in the survey. In terms of the distance of the place of residence to the nearest bus stop or railway station, the highest percentage of the surveyed people indicated 0.5 km (38.5%) or up to 1 km (23%). People with more than 2 km to a stop or a station accounted for 18.8% of the study group. Restrictions on access to public transport after the introduction of the epidemic state in Poland prominently affected 36.4% of people and slightly affected 21.4% of respondents.
For the purpose of realization of the main goal, the first thing to assess was the frequency of using public transport by the inhabitants of the county. The data show that public transport was very often used by 29.6% of the inhabitants of Biała County, and often used by 7.6% of the respondents (Figure 1). Public Transport was rarely used by 9.9% of the respondents and very rarely used by 21.6% of them. At the same time, 31.3% of the respondents did not use public transport.
The needs of respondents in the use of public transport were diverse (Figure 2). Most of the surveyed people used bus transport or train to travel to school or university (48%). A large percentage of people also indicated commuting to stores (42.2%). Over 31% of the respondents said they were using public transport to commute to work. A similar percentage of people (31.7%) indicated this means of transport as a source of commuting to places of recreation and entertainment. In order to travel to offices, banks, or post offices, public transport was used by 23.4% of respondents. Only 14.5% of respondents stated that they travelled by bus or train to a clinic or pharmacy.
Respondents’ opinions on the quality of collective transport services were diverse (Figure 3). This could be due to the differences in transport accessibility in individual communes as well as passenger requirements in terms of the expected standard of services. Only 0.9% of the respondents were prominently satisfied with the services of collective transport in Biała County. The share of satisfied people was 9.2%, and slightly satisfied ones were 27.4%. On the other hand, 12% of the surveyed people were dissatisfied and 9.5% of respondents were prominently dissatisfied. More than 1/5 of the surveyed people were slightly dissatisfied.
Among the most important determinants of public transport quality, the respondents included the lack of options to travel to the destination point (41.9%), mismatched hours of departures and arrivals of buses (39.9%), and low frequency of shuttling (36.5%) (Figure 4). About 18.2% of the respondents indicated low travel comfort, and 9.5% stated that ticket prices in public transport were too high. For 4.7% of respondents, the quality of public transport services is negatively affected by the possibility of contracting the COVID-19 coronavirus and other viruses; 29.7% of respondents indicated other quality factors without specifying them.
The answers of the respondents constitute an important indication of the scope of improving the functioning of collective transport for the authorities of Biała County and its communes. Local self-government should pay special attention to the functioning of the network of connections and analyse the transport needs of the local population in order to identify places where there is a demand for travel by public transport. The hours of departures and arrivals are also important so that they are convenient for people travelling to these regions and they correlate with the operating hours of local offices, workplaces, schools, or places that provide cultural and entertainment services.
As a part of the research, an attempt was also made to identify the assessment of collective transport in individual communes. For this purpose, Pearson’s chi-squared independence test was used to analyse the relationship between the commune and the assessment of the collective transport offer. The result of this test turned out to be statistically significant (χ2(108) = 133.26; p < 0.05; V = 0.26). The data show the inhabitants of the communes of Wisznice, Drelów, Biała Podlaska, and Terespol assessed the quality of collective transport as the best (Table 1). The inhabitants of Rossosz, Sławatycze, Janów Podlaski and Piszczac assessed the quality of the collective transport services as the lowest.
Due to the large percentage of assessments indicating transport exclusion in many communes, respondents were asked to rate the risks of low access to collective transport. A majority of people believed that one of the threats includes migration of young people to localities that are more accessible (68.5%), limited access of residents to many public, cultural, or entertainment services (61.1%), and increased congestion associated with a greater number of passenger cars on the road (61.1%) (Figure 5). A large proportion of people also mentioned difficulties in the mobility of people with impaired movement and people with disabilities (55.8%), increased unemployment due to the lack of options to commute to work as well as hindering the development of the region (50.5%).
The respondents often believed that highly developed public transport favours the development of the local region (Table 2). Moreover, they indicated that the low availability of public transport makes it difficult for them to use municipal services. They also agreed that access to public transport affects their quality of life.
Because of insufficient public transport services, they have a problem with accessing the capital of the county/voivodeship. The obtained results enabled positive verification of the first hypothesis (H1), which indicated that transport exclusion determined the professional and social development of the inhabitants of Biała County. High accessibility to collective transport favours the development of regions and facilitates the access of residents to public services. Access to collective transport also favours the development of the private and vocational lives of the inhabitants of Biała County.
The next step of the study was to examine which factors were related to the assessment of the negative impact of the number of transport lines on the quality of life. To examine this relation the Wald logistic regression analysis was used. The results of the analysis with the use of the χ2 system in the regression analysis proved to be of utmost importance from the statistical point of view χ2(5) = 132.27; p < 0.001; R2 = 0.33 which means that the model was very well fitted for the data, and the variability in the assessment of the negative impact of the number of transport lines on the quality of life was explained in 33% by the variability of the model’s variables (Table 3). The Hosmer–Lemeshow test gave a statistically insignificant result of χ2(8) = 7.70; p = 0.456, which confirms the good fit of the model to the data.
Statistically significant predictors on the assessment of the negative impact of the number of transport lines on the quality of life turned to be possession of a car in the household W(1) = 6.70; p < 0.05; OR = 2.54, frequency of using public transport W(1) = 10.64; p < 0.01; OR = 1.32 as well as the assessment of the collective transport offers in Saturdays, Sundays, and holidays W(1) = 26.46; p < 0.001; OR = 0.56.
The negative impact of the number of transport connections on the quality of life was related to the possession of a car on the farm. Probably, the limited number of public transport connections was one of the reasons for the possession of cars on the farms. Thanks to them, the respondents could commute to the required places without adapting their needs to bus timetables. Moreover, traveling by car is much more convenient than using public transport.
The assessment of the negative impact of the number of transport connections on the quality of life also resulted from the frequency of using public transport. The limited number of public transport courses makes it difficult to travel to workplaces, schools, government and local government offices, health care facilities, and cultural institutions for a specific hour. It wastes time, as a large part of it is spent waiting for the means of transport. With the greater frequency of public transport, the time of users can be used more efficiently.
The offer of public transport on Saturdays, Sundays, and holidays are also important in assessing the negative impact of the number of transport connections on the quality of life. These are usually days of social meetings, cultural events, and stays in places of religious worship. The lack of convenient connections in public transport limits social contacts and makes it challenging to participate in religious events and meetings. It has a negative impact on the social satisfaction of inhabitants of towns and villages excluded from transport.
Using the obtained data, it was also examined whether the age of the inhabitants of Biała County was associated with the assessment of public transport and the importance of communication. For this purpose, Spearman’s rho analysis was carried out and the results are presented in Table 4.
Based on the results of the analyses, it can be concluded that the age of the respondents was related to the frequency of using public transport (ρ = −0.32; p < 0.001), difficulties in accessing urban centres of the capital of the county/voivodeship (ρ = 0.10; p < 0.05), the assessment of the collective transport offers on Saturdays, Sundays, and holidays (ρ = −0.12; p < 0.05) as well as the consideration of changes to the place of residence due to limited access to public transport. Older people used public transport less frequently (ρ = 0.10; p < 0.05). They used public transport less often and more often had problems with getting to the capital of the county/voivodeship due to the insufficient number of offers of public transport. They assessed the offer of collective transport services was worse when it comes to Saturdays, Sundays, and holidays. They were less frequently considering changing their place of residence due to limited access to public transport. This allowed for the positive verification of the second hypothesis (H2), according to which the transport exclusion affects the net migration of the society in Biała County. The vast majority of respondents indicated that the low accessibility to public transport poses a threat related to the migration of young people to places with greater access to collective transport. It is of particular interest to young people who are characterised by greater mobility and willingness to travel. Investments in collective transport may affect the balance of migration in Biała County as well as prevent young people from emigrating to other locations.
It was also shown that the elderly more often believed that highly developed public transport favours the development of the local region (ρ = 0.16; p < 0.01). Moreover, they took the accessibility to public transport into account less often when choosing the place of residence (ρ = −0.10; p < 0.05). This enabled positive verification of the third hypothesis (H3), according to which transport exclusion negatively affects the development of the region. Access to high quality collective transport may have a positive impact on the region, generate workplaces, and increase its attractiveness. On the other hand, transport exclusion and the lack of public transport connections lead to a decrease in the attractiveness of a selected region, making it difficult to attract new investments and create new workplaces. In this case, collective transport can be considered as a factor contributing to the development of a given area.
The subject of the analyses was also the relation between the ownership of a car and the distance from the stop as well as the frequency of using public transport. For this purpose, analyses were carried out with χ2 Pearson’s independence tests and they are presented in Table 5. The results of the analyses showed that car ownership was not related to the distance from the stop χ2(8) = 6.73; p = 0.566; V = 0.08, but was related to the frequency of using public transport χ2(8) = 186.44; p < 0.001; V = 0.44. People with a car used public transport less frequently.
Another series of analyses with χ2 Pearson’s tests concerned the relation between owning a car and assessment of public transport (Table 6). The results of the analyses showed that owning a car was significantly associated with the assessment of the impact of the number of connections on the quality of life χ2(4) = 54.98; p < 0.001; V = 0.24 and considering the change of place of residence due to limited accessibility to public transport χ2(8) = 52.72; p < 0.001; V = 0.24. People who owned a car were less likely to think that a small number of communication connections had a negative impact on their quality of life. Additionally, they less often considered changing the place of residence due to limited access to public transport. On the other hand, no relation between owning a car and the assessment of the transport offers on Saturdays, Sundays, and holidays were demonstrated χ2(8) = 9.89; p = 0.273; V = 0.10.
The purpose of the research was also to identify the ways of eliminating threats to the quality of life for inhabitants of Biała County resulting from transport exclusion. The respondents were asked to evaluate the methods of counteracting the phenomenon of communication exclusion in Biała County. The respondents most often mentioned the adaptation of the transport offer to the needs and expectations of local residents (74.8%), as well as modifications of bus routes in accordance with suggestions of passengers (62.4%) and allocating funds for the development of collective transport (55.4%) (Figure 6). A large proportion of respondents also believed that in order to counteract the phenomenon of transport exclusion in Biała County, new bus lines nearby newly-built housing estates (42.5%) and more bus stops in places where residents report the need for it (41.2%) should be created. In particular, the respondents pointed out the need to increase the frequency of buses on lines Biała Podlaska-Miedzyrzec Podlaski, Biała Podlaska-Łomazy, Biała Podlaska-Terespol as well as introducing better communication of the surrounding villages (Rakowiska, Stary Sławacinek, Grabanów) with Biała Podlaska. The respondents also emphasized the need to expand the network of connections from places, such as Leśna Podlaska, Wólka Plebańska, Kodeń, Cieleśnica, Dobrynka, Sławatycze, Franopol, Kozły, Bohukały, Drelów, Kożuszki, Rzeczyca, Rokitno, Piszczac, Lachówka Mała, while emphasizing the fact that many small towns in the county are lacking any public transport connections, and that the insufficient level of these connections is implemented to some other locations. These demands should be reflected in the development strategy of individual communes as well as the whole Biała County.

6. Discussion

Transport exclusion has many negative consequences for residents of territories affected by this phenomenon, as well as visiting people and organisations operating in areas where there is social exclusion related to transport. It is a very burdensome phenomenon for a wide range of potential employees or consumers who want to travel to workplaces and establishments to trade and use services [72]. People who do not have access to transport have limited access to employment, education, health services, social networks, and other opportunities [73]. Moreover, a high level of accessibility to public transport influences a high level of access of commuters to other services [74]. Therefore, ensuring a high level of accessibility is a prerequisite for creating a user-friendly public transport service system [75]. The phenomenon of transport exclusion has a particularly negative impact on people with disabilities, the elderly, and young people (students), but also on everyone who wants to benefit from public transport. Transport exclusion is also a serious problem from the point of view of local authorities who are responsible for providing residents with access to public services and an adequate quality of life for local communities because in this case economic factors heavily hinder the process of meeting the needs and social expectations of residents of areas with limited public transport [76]. Therefore, local governments face the challenge of developing and implementing organisational solutions to minimise the costs of the public transport system while ensuring the expected level of quality of transport services [77].
Transport exclusion also has various negative consequences for a wide range of local companies and institutions. Problems with commuting may result in the inability to begin or continue employment at certain day hours due to a shortage of convenient transport connections. Moreover, in the conditions of transport exclusion, employment costs are rise since potential employees have to commute to work in private vehicles. The consumption of products and services offered outside the place of residence is also declining due to difficult access and reduced consumer’s purchasing power by the cost of commuting by private cars. Public transport can be seen as a factor that stimulates economical effectiveness by providing people with access to employment outside the place of residence [78,79]. Moreover, the research on access to employment shows that access to public transport positively impacts the salaries of people commuting to work [80]. Transport exclusion and the resulting increase in the share of private transport in general transport increase environmental costs due to the emission of exhaust fumes from private means of transport used by residents of remote areas, which also requires appropriate actions by local authorities [78,81,82]. In such a situation, transport exclusion becomes a serious obstacle in the implementation of the concept of sustainable development-both from the perspective of the entire local economic system and individual entities [83]. To sum up, the transport exclusion can have the following consequences [84,85]:
the wastage of development opportunities by individuals, groups of people, and
potentially even large organizations;
social poverty, which decreases consumers’ purchasing power;
adverse migration-related changes in the (age, education, etc.) structure of the population influencing the supply of labour and consumption;
the occurrence of structural unemployment;
the weakening or severing of social ties;
socioeconomic disintegration;
an increasing level of car ownership (which often entails the purchase of vehicles that are significantly worn out and emit a lot of pollution) and, consequently, a negative impact on the natural environment;
the progressive peripheralization of smaller towns and villages.
Restrictions in access to public transport contribute to uneven development and spatial disparities between regions. Without accessible, good-quality transport, it is impossible to take advantage of public services that guarantee a proper standard of living and sometimes allow people to get out of poverty or disease.

7. Conclusions and Recommendations

The conducted research allowed us to present the phenomenon of transport exclusion in Biała County. The analysis of the research results proved that to some degree a high availability of collective transport determined the vocational and social development of the inhabitants of Biała County. The respondents indicated that in the areas affected by exclusion there are difficulties in accessing public services as well as commuting to places of work, culture, and leisure.
Transport exclusion affects the net migration in a selected area. In areas without public transport, there is gradual depopulation and the process of migration from rural to urban areas is deepening. For this reason, an element of significant importance that can keep young people in Biała County are investments in collective transport and the development of a network of connections.
The regions affected by transport exclusion are also less attractive to investors, and it is more difficult to find a good job there. Therefore, public transport favours enrichment of some regions, and transport exclusion becomes, to some extent, a barrier that hinders the development.
As a part of the research, recommendations were also formulated for the voivodeship, county, and commune offices. In this area, the respondents most often asked for the adaptation of the transport offers to the needs and expectations of local inhabitants as well as to modify the bus routes in accordance with the suggestions of passengers (62.4%) or allocate funds for the development of public transport. The respondents pointed out that, in order to counteract the phenomenon of transport exclusion in Biała County, bus lines should be created in the vicinity of newly created housing estates and a larger number of stops should be built where residents report a need for it. The task of local authorities should be analysing the transport needs of the local population and, if the budget allows, adjusting the network of connections to the demands and expectations of the local population.
One of the possible ways to reduce the phenomenon of transport exclusion (and at the same time create an environment favoring sustainable development) is by applying solutions based on carpooling [86]. This service generally consists of sharing a journey in a private vehicle with people living separately. However, the point is to organize a formalized system enough to be used regularly through its inclusion in the official public transport network. The idea of institutionalized carpooling integrated into the public transport system can constitute a response to the challenges of ensuring an efficient public transport system in areas with low demand for transport services [87]. A necessary resource for the development of such a system is appropriate information allowing an estimation of the scale of transport exclusion for individual localities.
A telebus can be considered an innovative communication service in dispersed areas instead of the classic bus service with a fixed schedule. Thanks to the on-demand bus service, residents of less populated municipalities will be able to establish their bus route and departure time, and the lack of regular service can save money [43].
The problem of transport exclusion may also limit virtual mobility, that is, accessing activities that traditionally require physical mobility [88]. Such activities have been specially developed during the COVID-19 pandemic. They were made possible by the dynamization of the development of the information society. Virtual mobility applies particularly to distance education, remote work, and access to offices and health care. Action in these areas can now be taken without traveling.

Supplementary Materials

The following supporting information can be downloaded at: https://www.mdpi.com/article/10.3390/su14095674/s1, File S1. Questionnaire on the issue of transport exclusion in the Biała Podlaska poviat.

Author Contributions

Conceptualization: A.C., E.J.S. and G.C.; methodology: A.C., E.J.S. and G.C.; software: A.C., E.J.S. and G.C.; validation: A.C., E.J.S. and G.C.; formal analysis: A.C., E.J.S. and G.C.; investigation: A.C., E.J.S. and G.C.; resources: A.C., E.J.S. and G.C.; data curation: A.C., E.J.S. and G.C.; writing—original draft preparation: A.C., E.J.S. and G.C.; writing—review and editing: E.J.S. and G.C.; visualization: E.J.S. and G.C.; supervision, E.J.S.; project administration, A.C., G.C.; funding acquisition; A.C., G.C. All authors have read and agreed to the published version of the manuscript.

Funding

These studies received funding as a part of a research project number PB/29/2020 entitled “Transport exclusion in Biała County” financed by the science development fund of the Bialska Academy of Applied Sciences John Paul II in Biala Podlaska for 2020.

Institutional Review Board Statement

In the case of this study, ethical evaluation and approval were abandoned on the grounds that the research was voluntary, concerned public opinion and did not exhaust the hallmarks of research requiring the opinion of the Ethics Committee.

Informed Consent Statement

The survey of respondents’ opinions was voluntary by completing the online.

Data Availability Statement

The research results were obtained from questionnaires constructed by the Authors of this publication.

Conflicts of Interest

The authors declare no conflict of interest.

References

  1. Kenyon, S.; Lyons, G.; Rafferty, J. Transport and social exclusion: Investigating the possibility of promoting inclusion through virtual mobility. J. Transp. Geogr. 2002, 10, 207–209. [Google Scholar] [CrossRef] [Green Version]
  2. Jaroš, V. Social and transport exclusion. Geogr. Pol. 2017, 90, 247–263. [Google Scholar] [CrossRef]
  3. Komornicki, T. Polska Sprawiedliwa Komunikacyjnie; Fundacja im. Stefana Batorego: Warszawa, Poland, 2019; pp. 11–12. [Google Scholar]
  4. Hine, J. Transport and social justice. In Transport Geographies Mobilities, Flows and Spaces; Knowles, R.D., Shaw, J., Docherty, I., Eds.; John-Wiley/Blackwells: Oxford, UK, 2008. [Google Scholar]
  5. Mackett, R.; Thoreau, R. Transport, social exclusion and health. J. Transp. Health 2015, 2, 610–617. [Google Scholar] [CrossRef]
  6. Preston, J.; Rajé, F. Accessibility, mobility and transport-related social exclusion. J. Transp. Geogr. 2007, 15, 151–160. [Google Scholar] [CrossRef]
  7. Dulak, M.; Jakubowski, B. Publiczny Transport Zbiorowy w Polsce. Studium Upadku; Klub Jagielloński: Kraków, Poland, 2018; Available online: https://klubjagiellonski.pl/2018/04/17/publiczny-transport-zbiorowy-w-polsce-studium-upadku/ (accessed on 7 December 2021).
  8. My, Pasażerowie Żądamy! Instytut Spraw Obywatelskich: Łódź, Poland, 2021; Available online: https://instytutsprawobywatelskich.pl/my-pasazerowie-zadamy/ (accessed on 7 December 2021).
  9. Social Exclusion Unit. Making the Connections: Final Report on Transport and Social Exclusion; Office of the Deputy Prime Minister: London, UK, 2003.
  10. Lucas, K. Transport & Social Exclusion: A Survey of the Group of Seven Nations. FIA Foundation. Available online: http://www.fiafoundation.org/publications/Documents/social_exclusion.pdf (accessed on 7 December 2021).
  11. Currie, G.; Stanley, J.; Stanley, J. No Way to Go—Transport and Social Disadvantage in Australian Communities; Monash Univesity ePress: Melbourne, Australia, 2007. [Google Scholar]
  12. Hine, J. Transport disadvantage and social exclusion in Urban Scotland. Built. Environ. 2004, 30, 161–171. [Google Scholar] [CrossRef]
  13. Parysek, J. Podstawy Gospodarki Lokalnej; Wydawnictwo Naukowe UAM: Poznań, Poland, 2001. [Google Scholar]
  14. Jabłońska, A. Rola samorządu gminnego w kształtowaniu rozwoju lokalnego, In Polska Wschodnia—Zarządzanie Rozwojem; Wyższa Szkoła Administracji Publicznej: Białystok, Poland, 2008. [Google Scholar]
  15. Sustainable Development Commission; Fairness in a Car-Depended Society: London, UK, 2011.
  16. Johnson, V. An Exploration of the Relationship between Transport to Artsand Cultural Activities and Social Exclusion. Ph.D. Thesis, Monash University, Melbourne, Australia, 2011. [Google Scholar]
  17. Hurni, A. Transport and Social Exclusion in Western Sydney; University of Western Sydney and Western Sydney Community Forum: Sydney, Australia, 2006. [Google Scholar]
  18. Altman, J.; Hinkson, M. Mobility ad Modernity in Arnhem Land: The socialuniverse of Kuninjku trucks. J. Mater. Cult. 2007, 12, 181–203. [Google Scholar] [CrossRef]
  19. Paez, A.; Mercado, R.G.; Farber, S.; Morency, C.; Roorda, M. Mobility and Social Exclusion in Canadian Communities: An Empirical Investigation of Opportunity Access and Deprivation from the Perspective of Vulnerable Groups; Policy Research Directorate Strategic Policy and Research: Toronto, ON, Canada, 2009. [Google Scholar]
  20. Rose, E.; Witten, K.; McCreanor, T. Transport related social exclusion in New Zealand: Evidence and challenges, Kōtuitui: New Zealand. J. Soc. Sci. Online 2009, 4, 191–203. [Google Scholar]
  21. Oviedo Hernandes, D.; Titheridge, H. Mobilities of the periphery: Informality, access and social exclusion in the urban fringe in Colombia. J. Transp. Geogr. 2016, 55, 152–164. [Google Scholar] [CrossRef]
  22. Yamamoto, F.; Zhang, J. The Kindness of Strangers: Exploring Interdependencies and Shared Mobilities of Elderly People in Rural Japan. Soc. Incl. 2017, 5, 183–195. [Google Scholar] [CrossRef] [Green Version]
  23. Cao, D.; Stanley, J.; Stanley, J. Indicators of socio-spatial transport disadvantage for inter-island transport planning in rural Philippine communities. Soc. Incl. 2017, 5, 116–131. [Google Scholar] [CrossRef] [Green Version]
  24. Kamruzzaman, M.; Hine, J. Participation index: A measure to identify rural transport disadvantage? J. Transp. Geogr. 2011, 19, 882–899. [Google Scholar] [CrossRef] [Green Version]
  25. Lucas, K.; Grosvenor, T.; Simpson, R. Transport, the Environment and Social Exclusion; York Publishing Services for the Joseph Rowntree Foundation: York, UK, 2001. [Google Scholar]
  26. Velaga, N.R.; Beecroft, M.; Nelson, J.D.; Corsar, D.; Edwards, P. Transport poverty meets the digital divide: Accessibility and connectivity in rural communities. J. Transp. Geogr. 2012, 21, 102–112. [Google Scholar] [CrossRef] [Green Version]
  27. Shergold, I.; Parkhurst, G. Transport-related social exclusion amongst older people in rural Southwest England and Wales. J. Rural Stud. 2012, 28, 412–421. [Google Scholar] [CrossRef] [Green Version]
  28. Ryan, J.; Wretstrand, A. What’s mode got to do with it? Exploring the links between public transport and car access and opportunities for everyday activities among older people. Travel Behav. Soc. 2019, 14, 107–118. [Google Scholar] [CrossRef]
  29. Nuworsoo, C.; Golub, A.; Deakin, E. Analyzing equity impacts of transit fare changes: Case study of Alameda–Contra Costa Transit, California. Eval. Program Plan. 2009, 32, 360–368. [Google Scholar] [CrossRef] [PubMed] [Green Version]
  30. Nahmias-Biran, B.; Sharaby, N.; Shiftan, Y. Equity Aspects in Transportation Projects: Case Study of Transit Fare Change in Haifa. Int. J. Sustain. Transp. 2014, 8, 69–83. [Google Scholar] [CrossRef]
  31. Centrum Badań i Edukacji Statystycznej GUS. Badanie Pilotażowe Zachowań Komunikacyjnych Ludności w Polsce—Raport Końcowy; GUS: Jachranka, Poland, 2015. [Google Scholar]
  32. GUS. Bank Danych Lokalnych, Poland. 2021. Available online: https://bdl.stat.gov.pl/BDL/start (accessed on 7 December 2021).
  33. GUS. Dojazdy do Pracy—Narodowy Spis Powszechny Ludności i Mieszkań; GUS: Warszawa, Poland, 2014. [Google Scholar]
  34. GUS. Transport—Wyniki Działalności w 2016 r; GUS: Warszawa, Poland, 2016. [Google Scholar]
  35. Komornicki, T.; Rosik, P.; Śleszyński, P.; Stępniak, M. Oszacowanie Wartości Wskaźnika Dostępności Czasowej na Potrzeby Dokumentów strategicznych, Których Postępy są Monitorowane w Ramach Bazy STRATEG (Izochrona Drogowa 60 i 90 Minut); IGiPZ PAN: Warszawa, Poland, 2015. [Google Scholar]
  36. Beim, M. Wpływ Dostępności Transportem Zbiorowym na Rozwój Społeczno-Ekonomiczny Województwa Wielkopolskiego; Wielkopolskie Regionalne Obserwatorium Terytorialne: Poznań, Poland, 2014. [Google Scholar]
  37. Borowska-Stefańska, M. Dostępność transportowa od straży pożarnych do obiektów społecznych zlokalizowanych na terenach zagrożonych powodziami w województwie łódzkim z wykorzystaniem analiz sieciowych. Transp. Miej. I Reg. 2016, 3, 28–32. [Google Scholar]
  38. Praca zbiorowa. Plan Zrównoważonego Rozwoju Publicznego Transportu Zbiorowego dla Województwa Wielkopolskiego, Poznań. 2015. Available online: https://bip.umww.pl/artykuly/2821239/pliki/20151109115823_307z1.pdf (accessed on 17 December 2021).
  39. Goliszek, S.; Połom, M. Porównanie dostępności komunikacyjnej transportem zbiorowym w ośrodkach wojewódzkich Polski Wschodniej na koniec perspektywy UE 2007–2013. Transp. Miej. I Reg. 2016, 3, 16–27. [Google Scholar]
  40. Hebel, K.; Wyszomirski, O. Rower jako środek transportu w podróżach miejskich w Gdyni. Autobusy Tech. Eksploat. Syst. Transp. 2015, 12, 18–21. [Google Scholar]
  41. Kisielewski, P.; Skóra, A. Analiza dostępności czasowo-przestrzennej połączeń komunikacji miejskiej na wybranych przykładach. Autobusy Tech. Eksploat. Syst. Transp. 2016, 4, 49–53. [Google Scholar]
  42. Zmuda-Trzebiatowski, P. Dostępność transportowa, a partycypacja w aktywnościach, ubóstwo oraz zagrożenie wykluczeniem społecznym. Autobusy Tech. Eksploat. Syst. Transp. 2016, 17, 754–759. [Google Scholar]
  43. Kaczorowski, J. Wykluczeni. O likwidacji transportu zbiorowego na wsi i w małych miastach. Przegląd Planisty 2019, 4, 11–14. [Google Scholar]
  44. Dubicki, A. Transport Exclusion as Heritage of Communist Period. The example of Poland. Rev. Stiinte Politice 2019, 62, 22–32. [Google Scholar]
  45. Baran, M.; Augustyn, D.J. The Evaluation of Transport Exclusion in the Peripheral Cross-Border Areas of Central Europe in the Context of Applicability of Information-Based Carpooling. Sustainability 2021, 13, 3440. [Google Scholar] [CrossRef]
  46. Kiciński, M.; Zmuda-Trzebiatowski, P.; Bieńczak, M. Ocena zagrożenia wykluczeniem społecznym związanym z transportem w powiatach Wielkopolski. In Proceedings of the Ogólnopolska Konferencja Naukowa: Pomiar Ubóstwa i Wykluczenia Społecznego w Układach Regionalnych i Lokalnych, Poznań, Poland, 11–12 June 2015; pp. 13–14. [Google Scholar]
  47. Kruszyński, M.; Andrzejczyk, P. Transport a gospodarka. Zesz. Nauk. WSES W Ostrołęce 2018, 30, 86–87. [Google Scholar]
  48. Ustawa z Dnia 8 Marca 1990 r. o Samorządzie Gminnym (Dz.U. 1990 nr 16 poz. 95). Available online: https://isap.sejm.gov.pl/isap.nsf/DocDetails.xsp?id=wdu19900160095 (accessed on 10 January 2022).
  49. Ziemski, K.; Misiejko, A. (Eds.) Organizacja Publicznego Transportu Zbiorowego Przez Jednostki Samorządu Terytorialnego ze Szczególnym Uwzględnieniem Prawnych Aspektów Współdziałania; Wydawnictwo Naukowe UAM: Poznań, Poland, 2016. [Google Scholar]
  50. Załoga, E.; Kwarciński, T. Pasażerski Transport Regionalny; Wydawnictwo Naukowe PWN: Warszawa, Poland, 2019. [Google Scholar]
  51. Molecki, B. (Ed.) Rola Samorządu w Kształtowaniu Transportu Regionalnego w Polsce i w Europie; Oficyna Wydawnicza Politechniki Wrocławskiej: Wrocław, Poland, 2010; pp. 113–114. [Google Scholar]
  52. PKS Kontra Prywatni Przewoźnicy; Nowy Koncept: Ząbkowice Śląskie, Poland. 2014. Available online: http://zabkowice.express-miejski.pl/wiadomosc/17673,pks-kontra-prywatni-przewoznicy (accessed on 9 December 2021).
  53. Trammer, K. Ostre Cięcie. Jak Niszczono Polską Kolej; Wydawnictwo Krytyki Politycznej: Warszawa, Poland, 2019. [Google Scholar]
  54. Izydorek, A. 21 lat od “Ostrego Cięcia” Polskiej Kolei. Do Dzisiaj Walczymy z Jego Następstwami; NaKolei.pl: Warszawa, Poland, 2021; Available online: https://www.nakolei.pl/21-lat-od-ostrego-ciecia-polskiej-kolei-do-dzisiaj-walczymy-z-jego-nastepstwami/ (accessed on 10 December 2021).
  55. 2020 w Przewozach Pasażerskich i Towarowych; Urząd Transportu Kolejowego: Warszawa, Poland, 2021. Available online: https://utk.gov.pl/pl/aktualnosci/16651,2020-w-przewozach-pasazerskich-i-towarowych.html (accessed on 10 December 2021).
  56. Podsumowanie 2020—Przewozy Pasażerskie i Towarowe; Urząd Transportu Kolejowego: Warszawa, Poland, 2021.
  57. Gąsior, M. Odbić Się od Dna; Instytut Spraw Obywatelskich: Łódź, Poland, 2021; Available online: https://instytutsprawobywatelskich.pl/odbic-sie-od-dna/ (accessed on 10 December 2021).
  58. Ustawa z Dnia 16 Maja 2019 r. o Funduszu Rozwoju Przewozów Autobusowych o Charakterze Użyteczności Publicznej (Dz.U. 2019 poz. 1123). Available online: https://isap.sejm.gov.pl/isap.nsf/download.xsp/WDU20190001123/T/D20191123L.pdf (accessed on 5 February 2022).
  59. Podpisano Umowy na Dofinansowanie Nowych Linii Autobusowych; Lubelski Urząd Wojewódzki w Lublinie: Lublin, Poland, 2021. Available online: https://www.lublin.uw.gov.pl/aktualnosci/podpisano-umowy-na-dofinansowanie-nowych-linii-autobusowych (accessed on 14 December 2021).
  60. Strategia Rozwoju Powiatu Bialskiego na lata 2018–2026; Powiat Bialski: Biała Podlaska, Poland, 2018; Available online: https://www.powiatbialski.eu/wp-content/uploads/2019/03/Strategia-Rozwoju-Powiatu-Bialskiego-na-lata-2018-2026.pdf (accessed on 14 December 2021).
  61. Powiat Bialski w Liczbach. Polska w Liczbach; Główny Urząd Statystyczny: Warszawa, Poland, 2020; Available online: https://www.polskawliczbach.pl/powiat_bialski (accessed on 14 December 2021).
  62. Plan Zrównoważonego Rozwoju Publicznego Transportu Zbiorowego dla Powiatu Bialskiego; Powiat Bialski: Biała Podlaska, Poland, 2015; Available online: https://www.powiatbialski.eu/wp-content/uploads/2015/11/Plan-Transportowy-dla-Powiatu-Bialskiego-Etap-III.pdf (accessed on 15 December 2021).
  63. Uchwała Nr XIII/84/2019 Rady Powiatu w Białej Podlaskiej z dnia 23 Sierpnia 2019 r. w Sprawie Wyrażenia zgody na Zawarcie Umowy o Świadczenie usług w Zakresie Publicznego Transportu Zbiorowego w Przewozach Autobusowych Użyteczności Publicznej w 2019 r. Available online: https://spbialapodlaska.bip.lubelskie.pl/upload/pliki//uchw_RP_XIII_84_2019.pdf (accessed on 20 January 2022).
  64. Krzywicki, G. Linie Autobusowe z Dofinansowaniem: Z Siedmiu Zostanie Cztery; RadioBiper: Biała Podlaska, Poland, 2020; Available online: https://www.radiobiper.info/2020/12/29/linie-autobusowe-z-dofinansowaniem-z-siedmiu-zostanie-cztery/ (accessed on 15 December 2021).
  65. Uchwała Nr XXVII/175/2020 Rady Powiatu w Białej Podlaskiej z dnia 23 Października 2020 w Sprawie Zmiany Uchwały Rady Powiatu w Białej Podlaskiej Nr XVIII/115/2019 z dnia 18 Grudnia 2019 r. w Sprawie Wyrażenia zgody na Zawarcie Umowy o Świadczenie usług w Zakresie Publicznego Transportu Zbiorowego w Przewozach Autobusowych Użyteczności Publicznej w 2020 r. Available online: https://spbialapodlaska.bip.lubelskie.pl/upload/pliki/uchw_RP_XXVII_175_2020.pdf (accessed on 18 January 2022).
  66. Mider, D. Dylematy metodologiczne badań kultury politycznej w Internecie. Przegląd Politol. 2013, 2, 23–24. [Google Scholar] [CrossRef]
  67. Fowler, F.J.; Magnione, T.W. Standardized Survey Interviewing: Minimizing Interviewer-Related Error; Sage: Newbury Park, CA, USA, 1990. [Google Scholar]
  68. Wzór na Minimalna Wielkość Próby. Available online: https://www.naukowiec.org/wzory/metodologia/minimalna-liczebnosc-proby_902.html (accessed on 15 January 2022).
  69. Bujang, M.A.; Sa’at, N.; Sidik, T.; Joo, L.C. Sample Size Guidelines for Logistic Regression from Observational Studies with Large Population: Emphasis on the Accuracy between Statistics and Parameters Based on Real Life Clinical Data. Malays. J. Med. Sci. 2018, 25, 122–130. [Google Scholar] [CrossRef]
  70. Bonett, D.G.; Wright, T.A. Sample size requirements for estimating Pearson, Kendall and Spearman correlations. Psychometrika 2000, 65, 23–28. [Google Scholar] [CrossRef]
  71. Fisher, R.A. On the probable error of a coefficient of correlation deduced from a small sample. Metron 1921, 1, 1–32. [Google Scholar]
  72. Schwanen, T.; Lucas, K.; Akyelken, N.; Cisternas Solsona, D.; Carrasco, J.A.; Neutens, T. Rethinking the links between social exclusion and transport disadvantage through the lens of social capital. Transp. Res. Part A Policy Pract. 2015, 74, 123–135. [Google Scholar] [CrossRef]
  73. Heffner, K.; Klemens, B. Potencjały i strefy problemowe w zakresie świadczenia usług publicznych na obszarach wiejskich w skali regionalnej. Stud. Obsz. Wiej. 2016, 42, 23–35. [Google Scholar] [CrossRef]
  74. Abreha, D.A. Analysing Public Transport Performance Using Efficiency Measures and Spatial Analysis: The Case of Addis Ababa, Ethiopia; Thesis Report; International Institute for Geo-Information Science and Earth Observation: Enschede, The Netherlands, 2007. [Google Scholar]
  75. Cheng, Y.H.; Chen, S.Y. Perceived accessibility, mobility, and connectivity of public transportation systems. Transp. Res. Part A Policy Pract. 2015, 77, 386–403. [Google Scholar] [CrossRef]
  76. Berg, J.; Ihlström, J. The Importance of Public Transport for Mobility and Everyday Activities among Rural Residents. Soc. Sci. 2019, 8, 58. [Google Scholar] [CrossRef] [Green Version]
  77. Budzanowska-Drzewiecka, M.; Jedynak, P.; Lipińska, A. Challenges Related to New Segments and Market Trends; Jagiellonian University Press: Krakow, Poland, 2016. [Google Scholar]
  78. Taylor, Z. Przestrzenna Dostępność Miejsc Zatrudnienia, Kształcenia i Usług a Codzienna Ruchliwość Ludności Wiejskiej; PAN IGiPZ: Wroclaw, Poland, 1999. [Google Scholar]
  79. Gannon, C.A.; Liu, Z.I. Poverty and Transport; World Bank: Washington, DC, USA, 1997. [Google Scholar]
  80. Pons Rotger, G.A.; Nielsen, T.A. Effects of Job Accessibility Improved by Public Transport System: Natural Experimental Evidence from the Copenhagen Metro. Eur. J. Transp. Infrastruct. Res. 2015, 15, 419–441. [Google Scholar]
  81. Górka, K.; Poskrobko, B.; Radecki, W. Ochrona Środowiska. Problemy Społeczne, Ekonomiczne i Prawne; Polskie Wydawnictwo Ekonomiczne: Warsaw, Poland, 2001. [Google Scholar]
  82. Wronka, J. Internalizacja Kosztów Zewnętrznych Transportu w Polsce. In Kongres Transport 2000, Kraków, Zakopane 14–16 Września 2000; Stowarzyszenie Inżynierów i Techników Komunikacji: Zakopane-Krakow, Poland, 2000. [Google Scholar]
  83. Wolny, A.; Ogryzek, M.; Źróbek, R. Towards Sustainable Development and Preventing Exclusions—Determining Road Accessibility at the Sub-Regional and Local Level in Rural Areas of Poland. Sustain. J. Rec. 2019, 11, 4880. [Google Scholar] [CrossRef] [Green Version]
  84. Cresswell, T. Citizenship in worlds of mobility. In Critical Mobilities; Söderstrom, O., Randeria, S., D’Amato, G., Panese, F., Eds.; EPFL Pres: Lausanne, Switzerland, 2013; pp. 105–124. [Google Scholar]
  85. Lucas, K.; Mattioli, G.; Verlinghieri, E.; Guzman, A. Transport poverty and its adverse social consequences. Proc. Inst. Civ. Eng. Transp. 2016, 169, 353–365. [Google Scholar] [CrossRef] [Green Version]
  86. Daunoriene, A.; Drakšaite, A.; Snieška, V.; Valodkiene, G. Evaluating Sustainability of Sharing Economy Business Models. Procedia Soc. Behav. Sci. 2015, 213, 836–841. [Google Scholar] [CrossRef] [Green Version]
  87. Shaheen, S.; Cohen, A.; Bayen, A. The Benefits of Carpooling; University of California: Berkeley, CA, USA, 2018. [Google Scholar]
  88. Kenyon, S.; Rafferty, J.; Lyons, G. Social exclusion and transport in the UK: A role for virtual accessibility in the alleviation of mobility-related social exclusion? J. Soc. Policy 2003, 32, 317–338. [Google Scholar] [CrossRef]
Figure 1. Frequency of using public transport. Source: own study.
Sustainability 14 05674 g001
Figure 2. Goals of using public transport. Source: own study.
Sustainability 14 05674 g002
Figure 3. The assessment of the quality of collective transport services. Source: own study.
Sustainability 14 05674 g003
Figure 4. Public transport quality determinants. Source: own study.
Sustainability 14 05674 g004
Figure 5. Assessment of threats resulting from low accessibility to collective transport. Source: own study.
Sustainability 14 05674 g005
Figure 6. Assessment of methods of counteracting the phenomenon of transport exclusion in Biała County. Source: own study.
Sustainability 14 05674 g006
Table 1. The results of χ2 Pearson’s correlation analyses for the relationship of a commune with the evaluation of the collective transport offer.
Are You Satisfied with the Quality of the Services Offered by the Collective Transport in Biała County?Definitely YesYesRather YesHard to SayRather NoNoDefinitely No
χ2(108) = 133.26; p < 0.05; V = 0.26
Biała County0.8%16.3%31.8%16.3%23.3%4.7%7.0%
Commune of Drelów16.7%16.7%16.7%33.3%16.7%0.0%0.0%
Commune of Janów Podlaski0.0%0.0%20.0%10.0%20.0%30.0%20.0%
Commune of Kodeń4.8%0.0%23.8%14.3%19.0%23.8%14.3%
Commune of Konstantynów0.0%0.0%28.6%14.3%28.6%14.3%14.3%
Commune of Leśna Podlaska0.0%0.0%20.0%20.0%30.0%10.0%20.0%
Commune of Łomazy0.0%4.5%27.3%27.3%4.5%13.6%22.7%
Commune of Międzyrzec
Podlaski
0.0%0.0%33.3%26.7%13.3%26.7%0.0%
Commune of Piszczac0.0%0.0%9.1%27.3%18.2%36.4%9.1%
Commune of Rokitno0.0%0.0%33.3%50.0%0.0%0.0%16.7%
Commune of Rossosz0.0%0.0%28.6%0.0%57.1%14.3%0.0%
Commune of Sławatycze0.0%0.0%0.0%25.0%50.0%25.0%0.0%
Commune of Sosnówka0.0%0.0%0.0%66.7%33.3%0.0%0.0%
Commune of Terespol0.0%0.0%40.0%0.0%20.0%20.0%20.0%
Commune of Tuczna0.0%0.0%20.0%40.0%10.0%30.0%0.0%
Commune of Wisznice0.0%14.3%42.9%28.6%9.5%0.0%4.8%
Commune of Zalesie0.0%10.0%20.0%20.0%30.0%0.0%20.0%
The city of Międzyrzec
Podlaski
0.0%23.1%15.4%7.7%23.1%23.1%7.7%
The city of Terespol0.0%0.0%16.7%33.3%16.7%16.7%16.7%
Explanations: χ2—Chi-square statistics, p—level of statistical significance, V—the strength of Cramer’s V association. Source: own study.
Table 2. Conformity with statements regarding public transport in Biała County.
DescriptionI Definitely AgreeI AgreeHard to SayI Don’t AgreeI Definitely Don’t Agree
Poor access to public transport makes it difficult to find an employment30.7%18.6%23.3%15.3%12.1%
Poor access to public transport makes it difficult to use municipal services39.1%29.6%16.3%9.7%5.3%
Access to public transport affects the quality of my life37.6%28.6%16.9%6.1%10.8%
Highly developed public transport favours the development of the local region49.9%30.4%12.9%3.8%3.0%
I am considering change of residence due to limited access to public transport17.5%15.2%15.1%22.4%29.8%
Source: own study.
Table 3. The results of the logistic regression analyses for determinants of the negative impact of the lack of public transport connection on the quality of life.
The Negative Impact of the Number of Transport Lines on the Quality of LifeBSEWdfpOR
No car 8.062.00.018
Car in a household0.930.366.7010.0102.54
Owning a car0.020.290.0110.9321.02
Using the means of public transport0.270.0810.6410.0011.31
The assessment of collective transport offers in Saturdays, Sundays, and holidays0.580.1126.4610.0000.56
Constant−1.010.367.9810.0050.36
Explanations: B—non-standardized coefficient, SE—standard error, W—Wald’s statistics, df—df-number of degrees of freedom, p—level of statistical significance, OR—odds ratio. Source: own study.
Table 4. The results of Spearman’s rho correlation analyses for the relationship between the age and the assessment of the importance of public transport.
Assessment of the Importance of Public TransportAge
Frequency of using public
transport
−0.32 ***
The assessment of the negative impact of the number of transport lines on quality of life0.00
Assessment of the collective transport offers on Saturdays, Sundays, and
holidays
−0.12 *
Considering a change of residence due to limited
access to public transport
−0.10 *
Poor access to public transport makes it difficult to find a job0.06
Highly developed public transport favours the development of the region0.16 **
The low availability of public transport makes it difficult to use the municipal services0.03
I am considering changing my place of residence due to the limited
access to public transport
0.03
I have problems with getting to the capital of the county/voivodeship due to the insufficient amount of public transport offers0.10 *
While choosing a place of residence, I take into account the accessibility
to collective transport
−0.10 *
Access to public transport affects my quality of life−0.05
The importance of public transport0.01
Explanations: * p < 0.05; ** p < 0.01; *** p < 0.001. Source: own study.
Table 5. The results of Person’s χ2 correlation analyses for the relation between car ownership and the frequency of using public transport.
How Often Do Use Public Means of Transport?No CarCar in a HouseholdOwning a Car
Never5.1%8.8%49.3%
Very rarely (less than once a month)9.0%16.8%27.4%
Rarely (1–2 times a month)5.1%11.2%10.7%
Often (once a week)15.4%11.2%3.7%
Very often
(Everyday/several times a week)
65.4%52.0%8.9%
χ2(8) = 186.44; p < 0.001; V = 0.4
Explanations: χ2—Chi-square statistics, p—level of statistical significance, V—the strength of Cramer’s V association. Source: own study.
Table 6. The results of analyses with Pearson’s χ2 tests concerned the relation between owning a car and the assessment of public transport.
Questions and AnswersNo CarA Car in a HouseholdOwning a Car
Does the number of transport connections from your town have a negative effect on the quality of your life?χ2(4) = 54.98; p < 0.001; V = 0.24
No6.4%20.0%34.8%
Hard to say19.2%36.0%34.8%
Yes74.4%44.0%30.4%
How do you assess the offer of collective transport services on Saturdays, Sundays, and holidays?χ2(8) = 9.89; p = 0.273; V = 0.10
It is definitely insufficient43.6%29.6%33.3%
It is insufficient30.8%28.8%25.6%
It is average20.5%33.6%29.3%
It is sufficient3.8%6.4%8.9%
It is definitely sufficient1.3%1.6%3.0%
Considering the change of residence due to limited access to public transportχ2(8) = 52.72; p < 0.001; V = 0.24
Definitely no7.7%16.0%22.6%
No24.4%39.2%49.6%
Hard to say15.4%19.2%10.7%
Yes30.8%16.0%10.7%
Definitely yes21.8%9.6%6.3%
Explanations: χ2—Chi-square statistics, p—level of statistical significance, V—the strength of Cramer’s V association. Source: own study.
Publisher’s Note: MDPI stays neutral with regard to jurisdictional claims in published maps and institutional affiliations.

