
Local-Scale Groundwater Sustainability Assessment Based on the Response to Groundwater Mining (MGSI): A Case Study of Da’an City, Jilin Province, China


Abstract
:1. Introduction
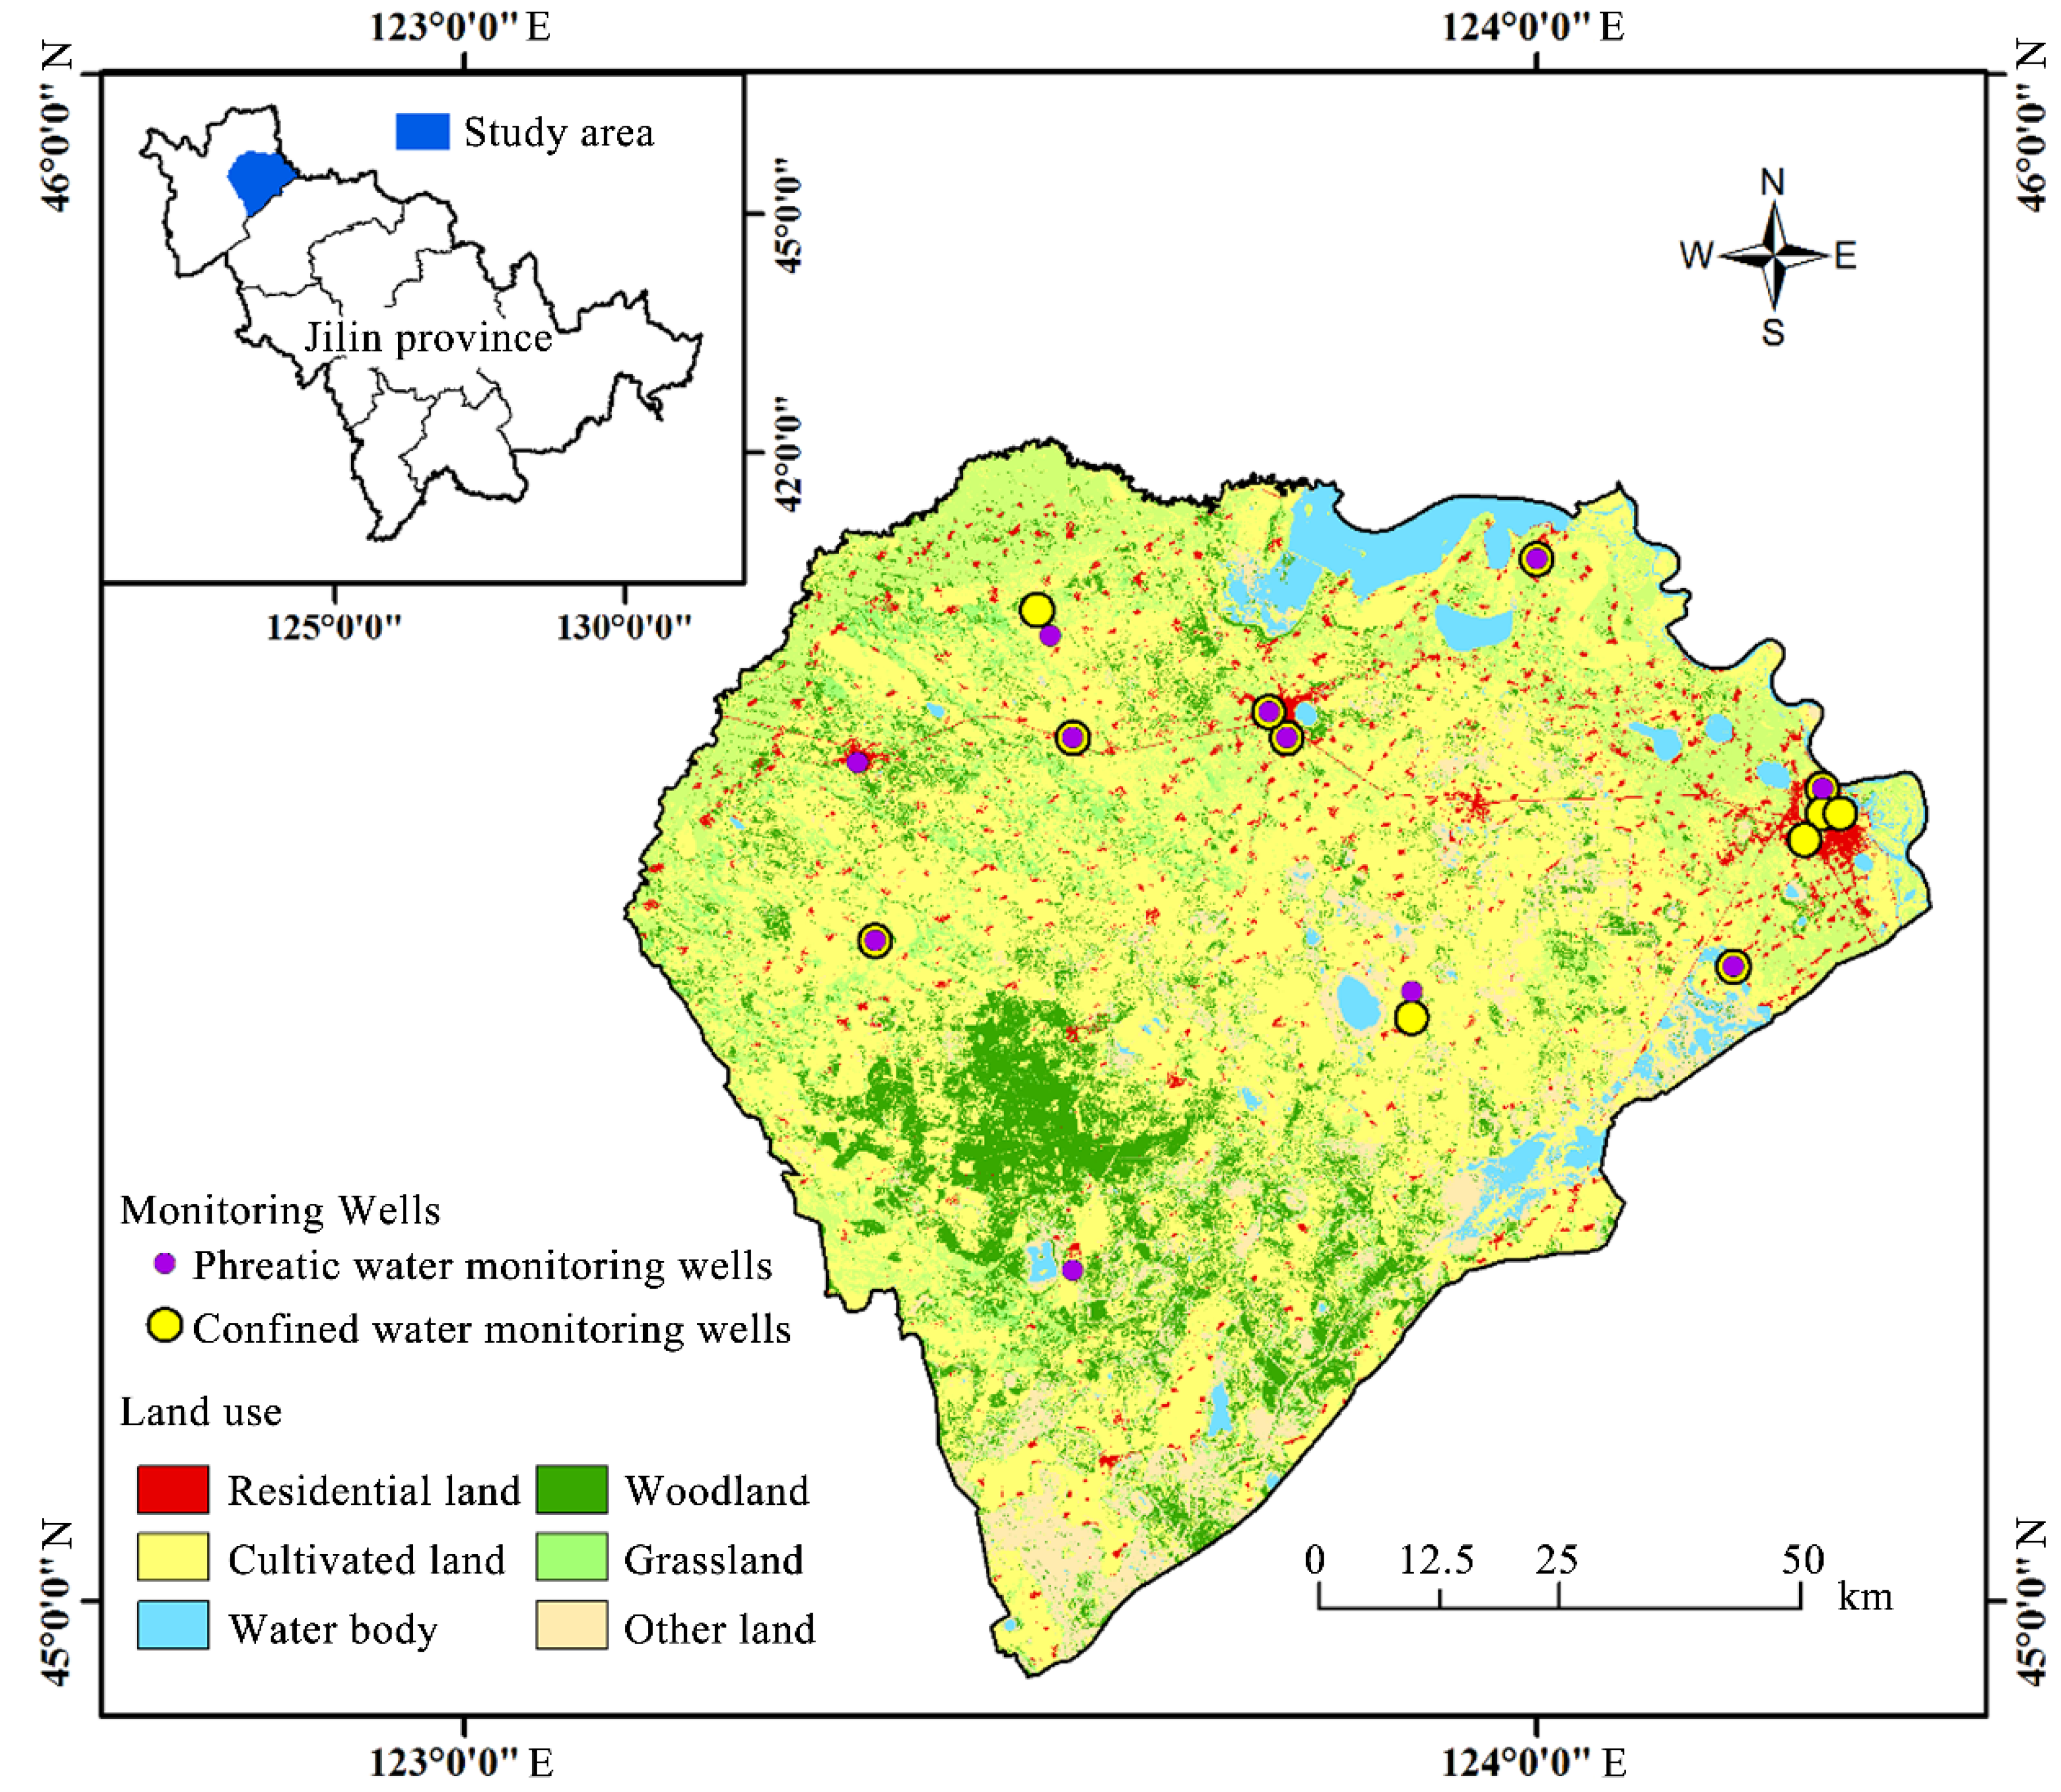
2. Study Area
3. Data Sources
4. Methodology
4.1. Mining-Response-Based Groundwater Sustainability Index (MGSI)
4.2. Groundwater Response State (RES)
4.3. Groundwater Mining Pressure (PRE)
4.3.1. Degree of Mining (MD)
4.3.2. Decomposition Coefficient (DC)
4.4. Trend Test
5. Results and Discussion
5.1. Spatio-Temporal Variation in Groundwater Sustainability
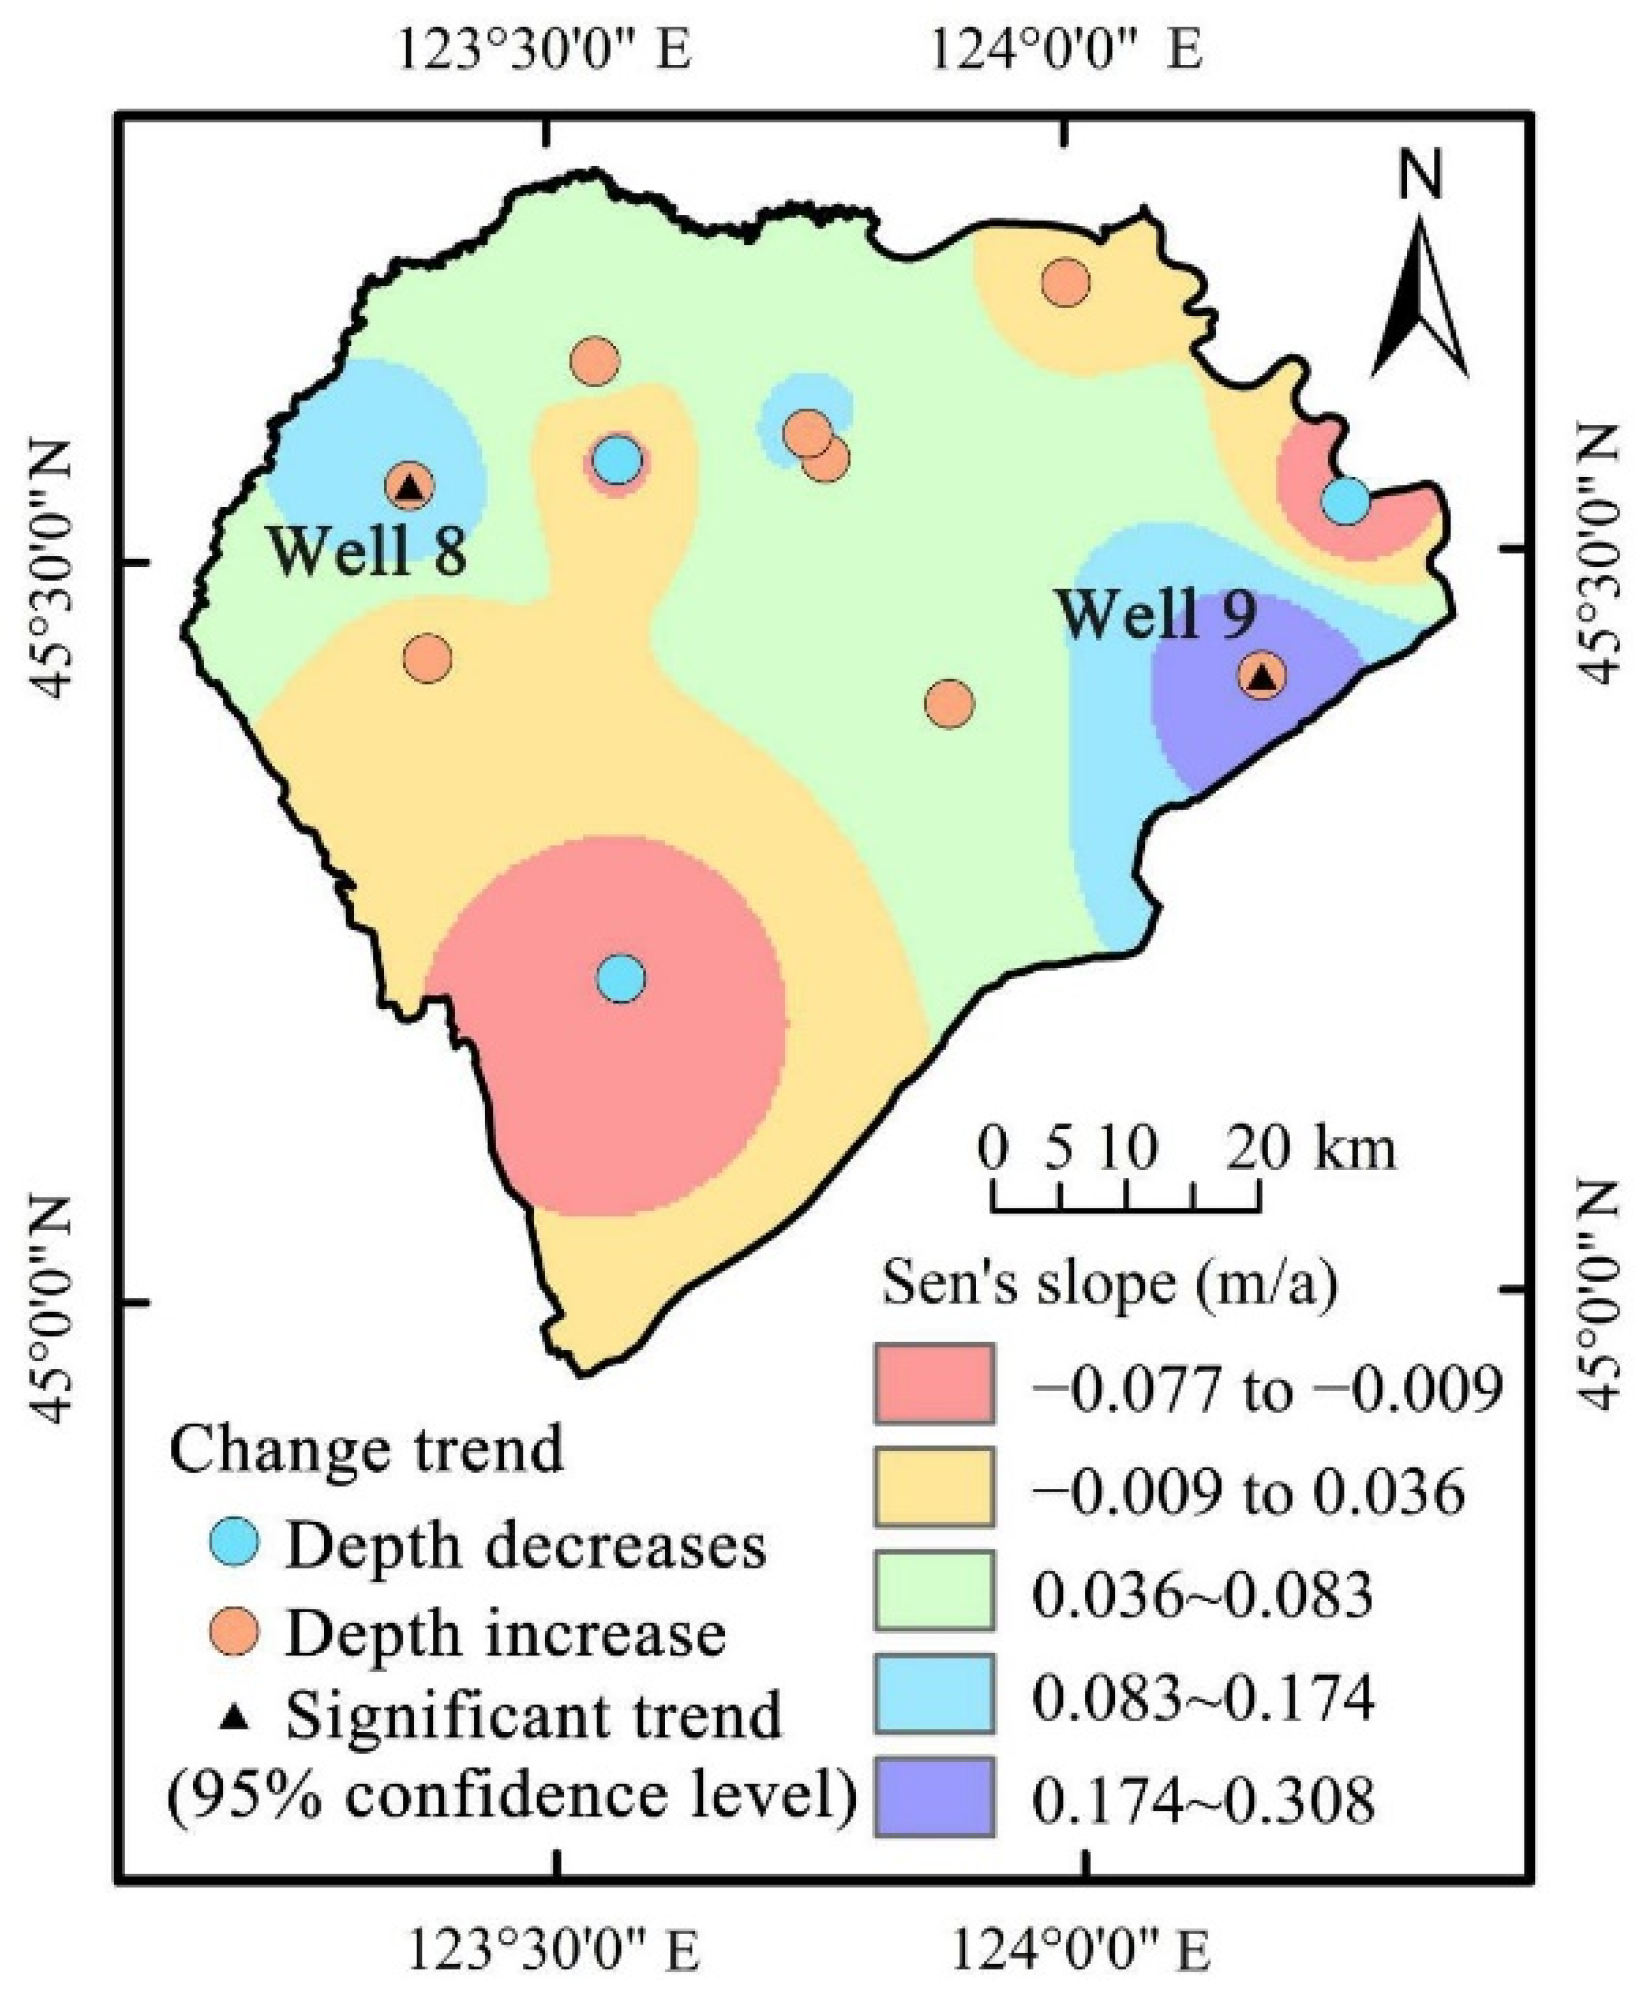
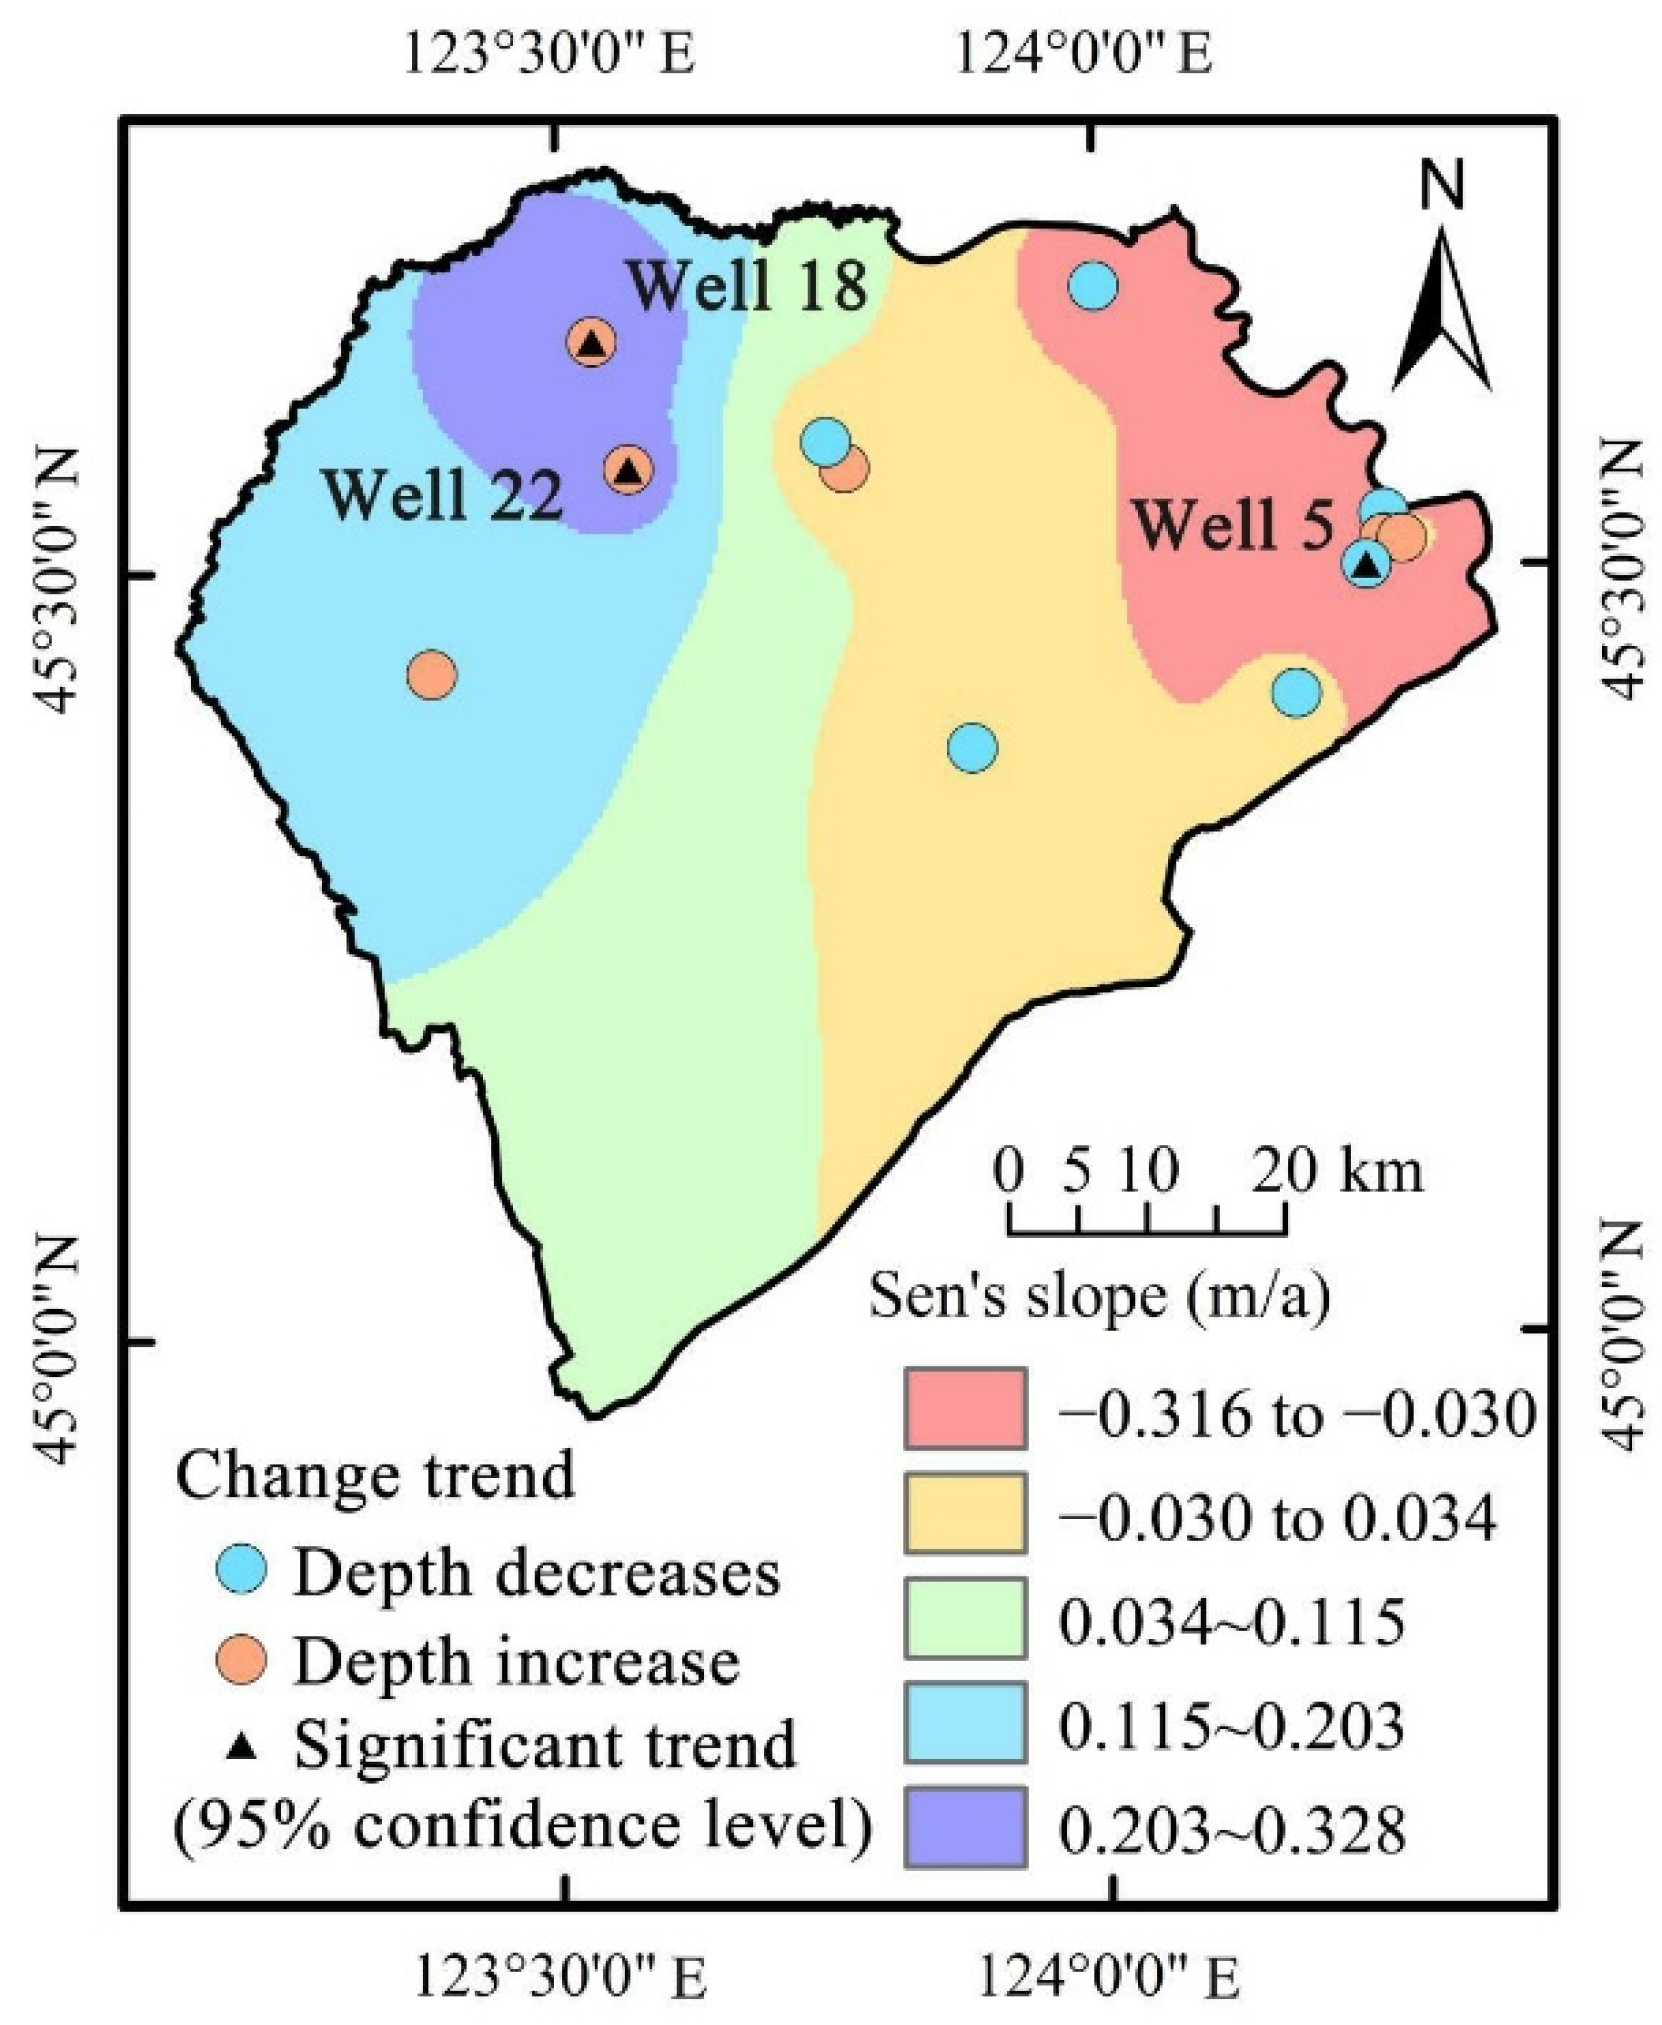
5.2. Change Trends of Groundwater Depth
6. Conclusions
- (1)
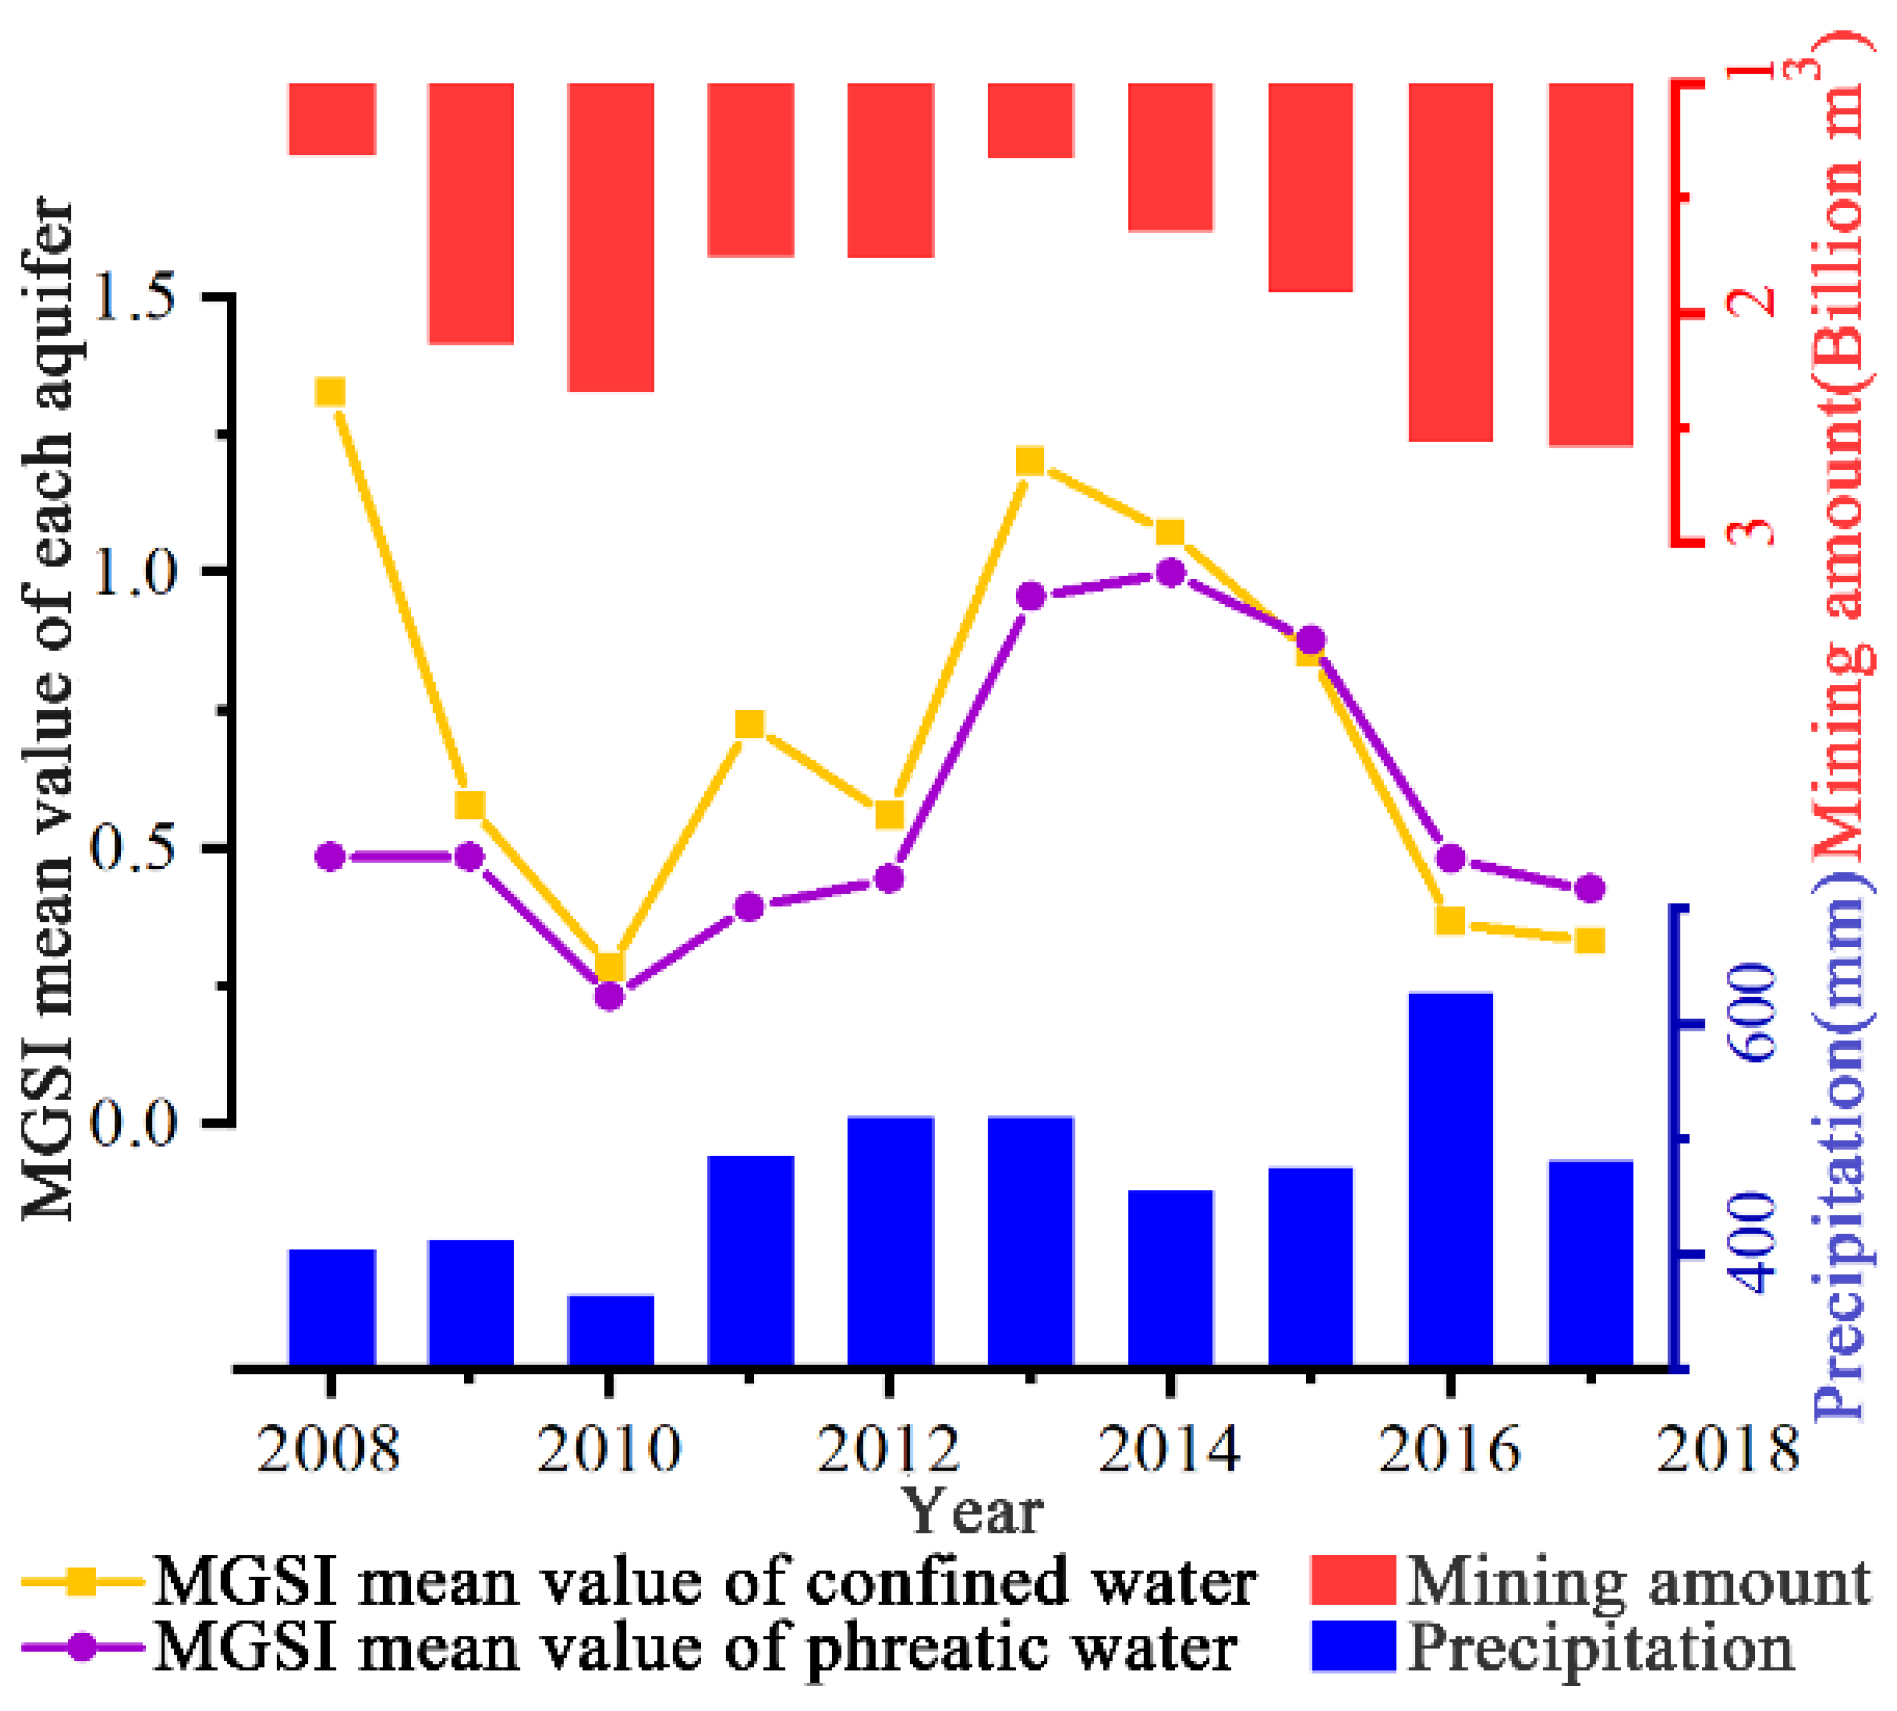
- The mean MGSI of confined water is more significantly affected by groundwater mining than that of phreatic water. During 2013–2017, with the increase in mining, the mean MGSI of confined water dropped sharply, and the mean MGSI of phreatic water also showed a similar trend. In the future, water resource management should consider replacing groundwater with surface water or other water sources to reduce groundwater exploitation.
- (2)
- The mean MGSI of the phreatic aquifer increases at a rate of 0.01 per year, whereas that of the confined aquifer decreases at a rate of 0.04 per year. Therefore, the mining of confined water in Da’an City should be carried out more cautiously in the future.
- (3)
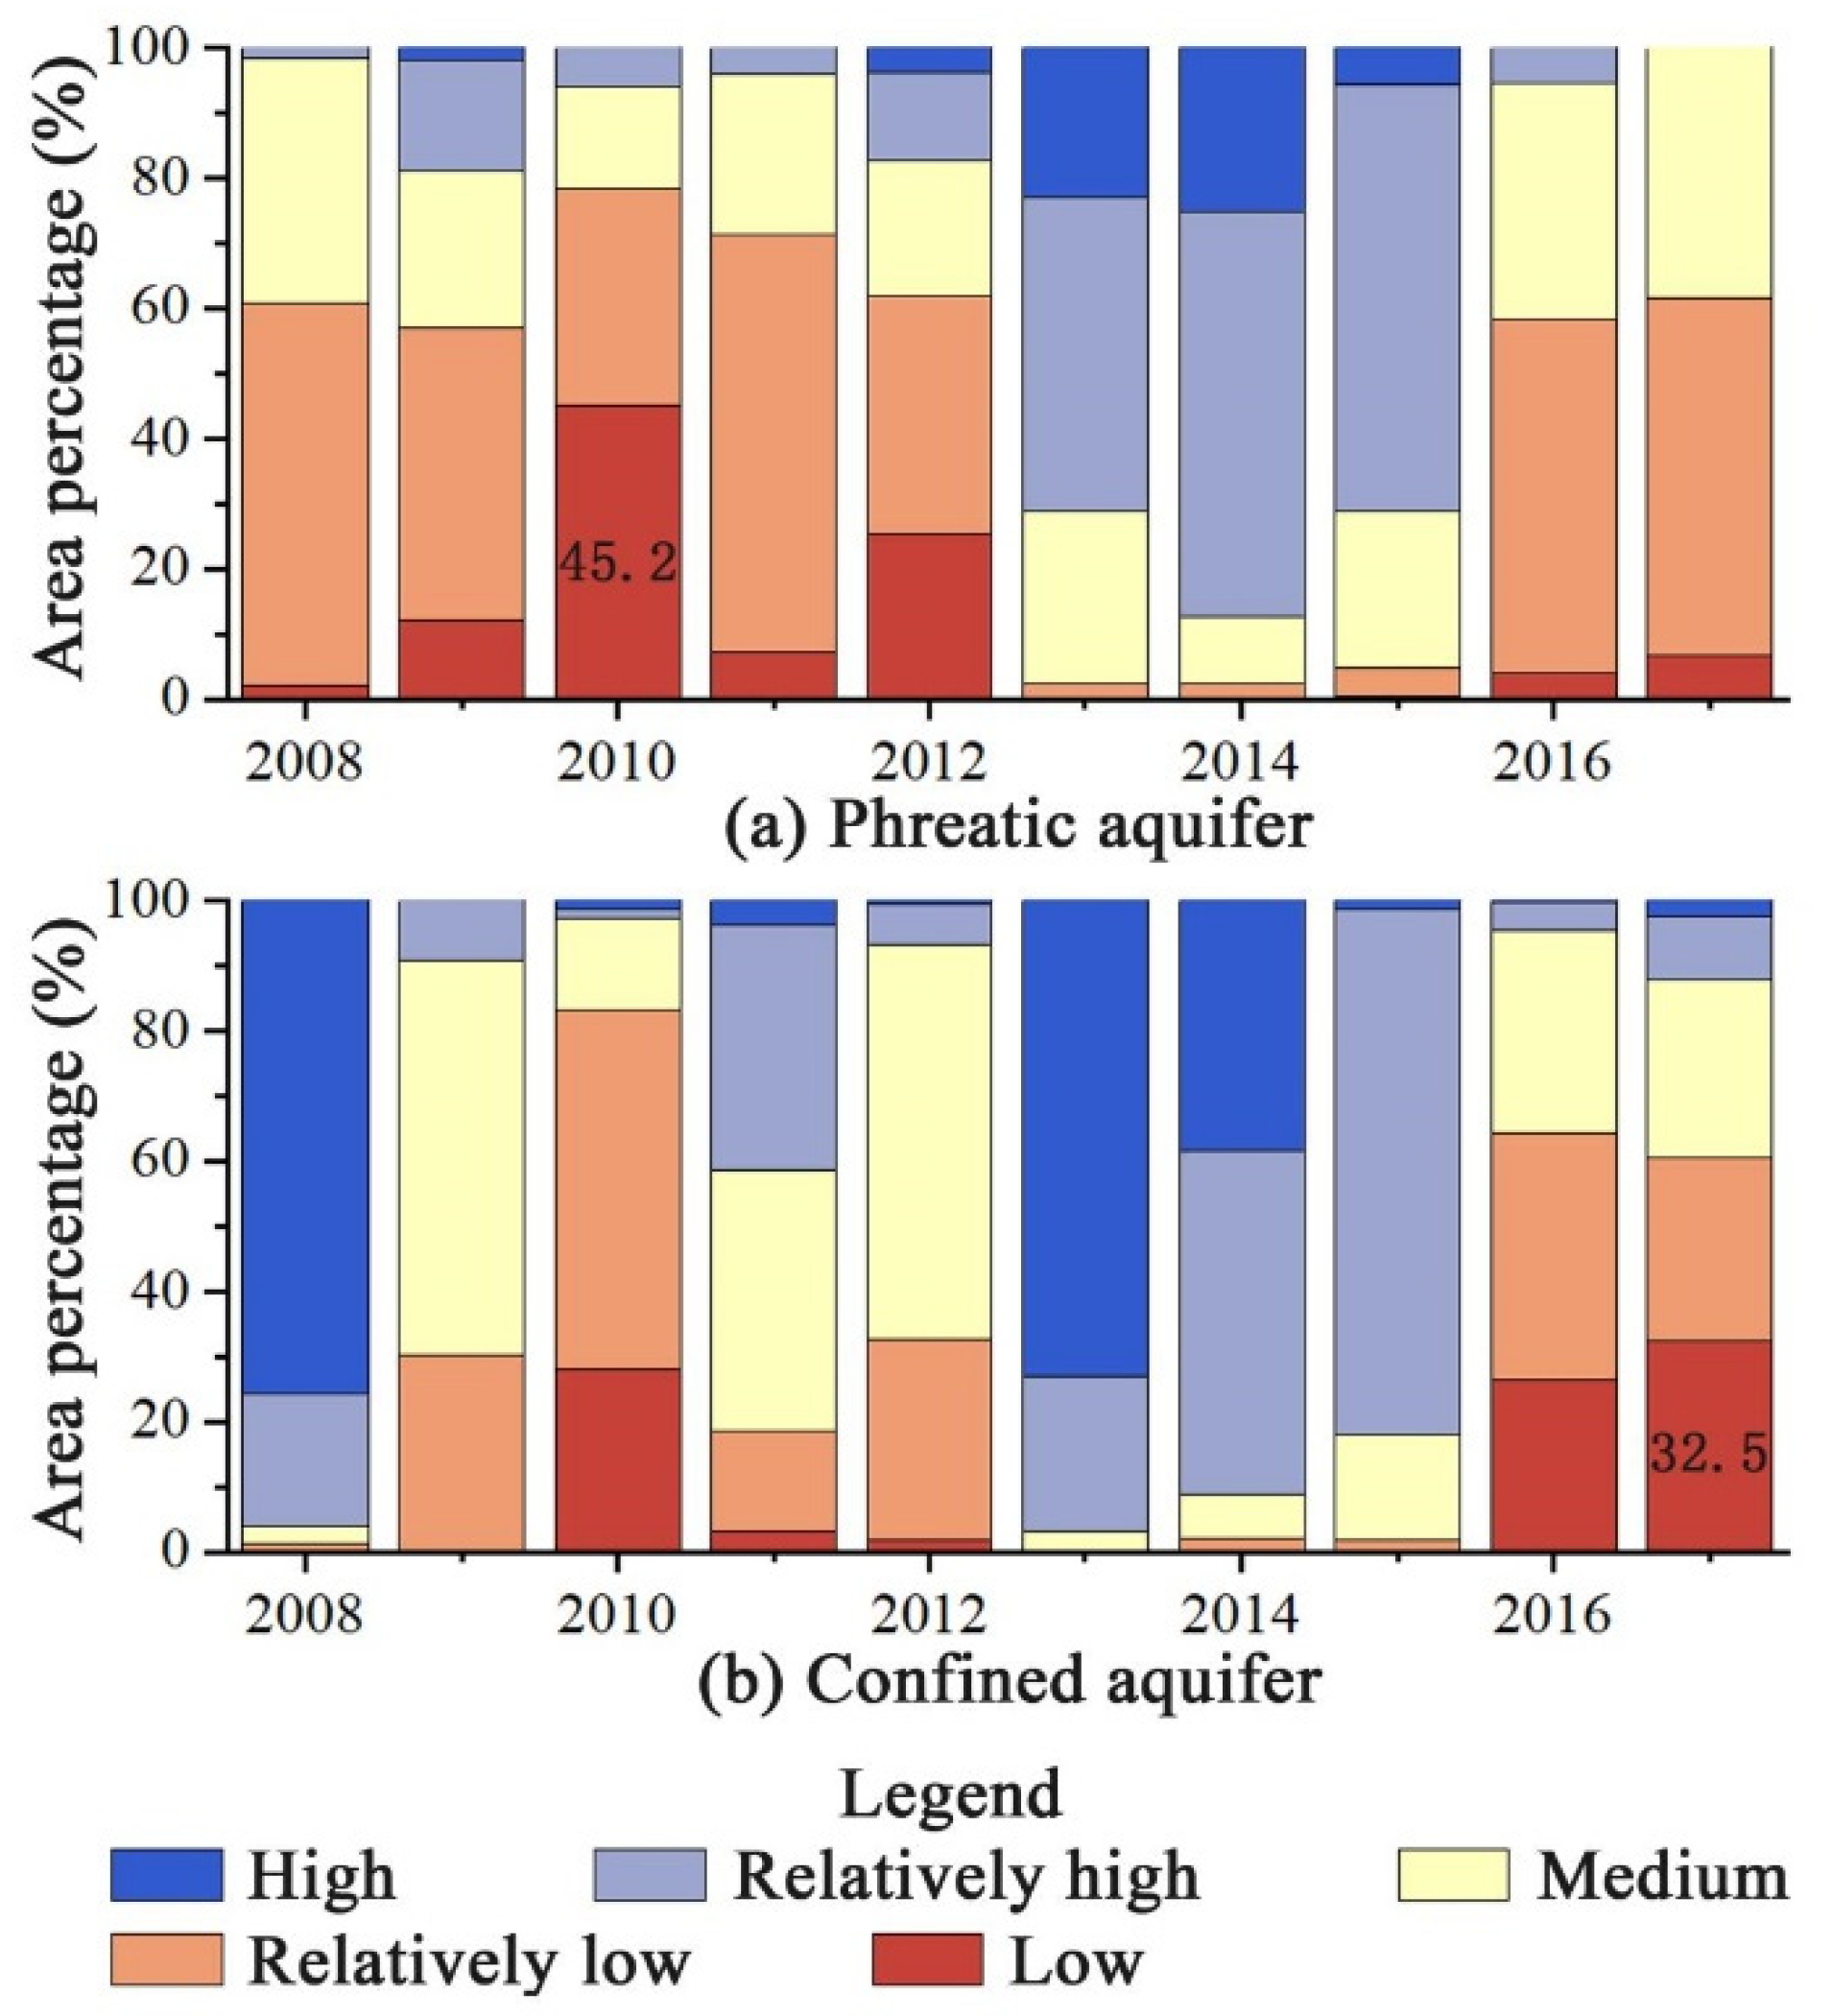
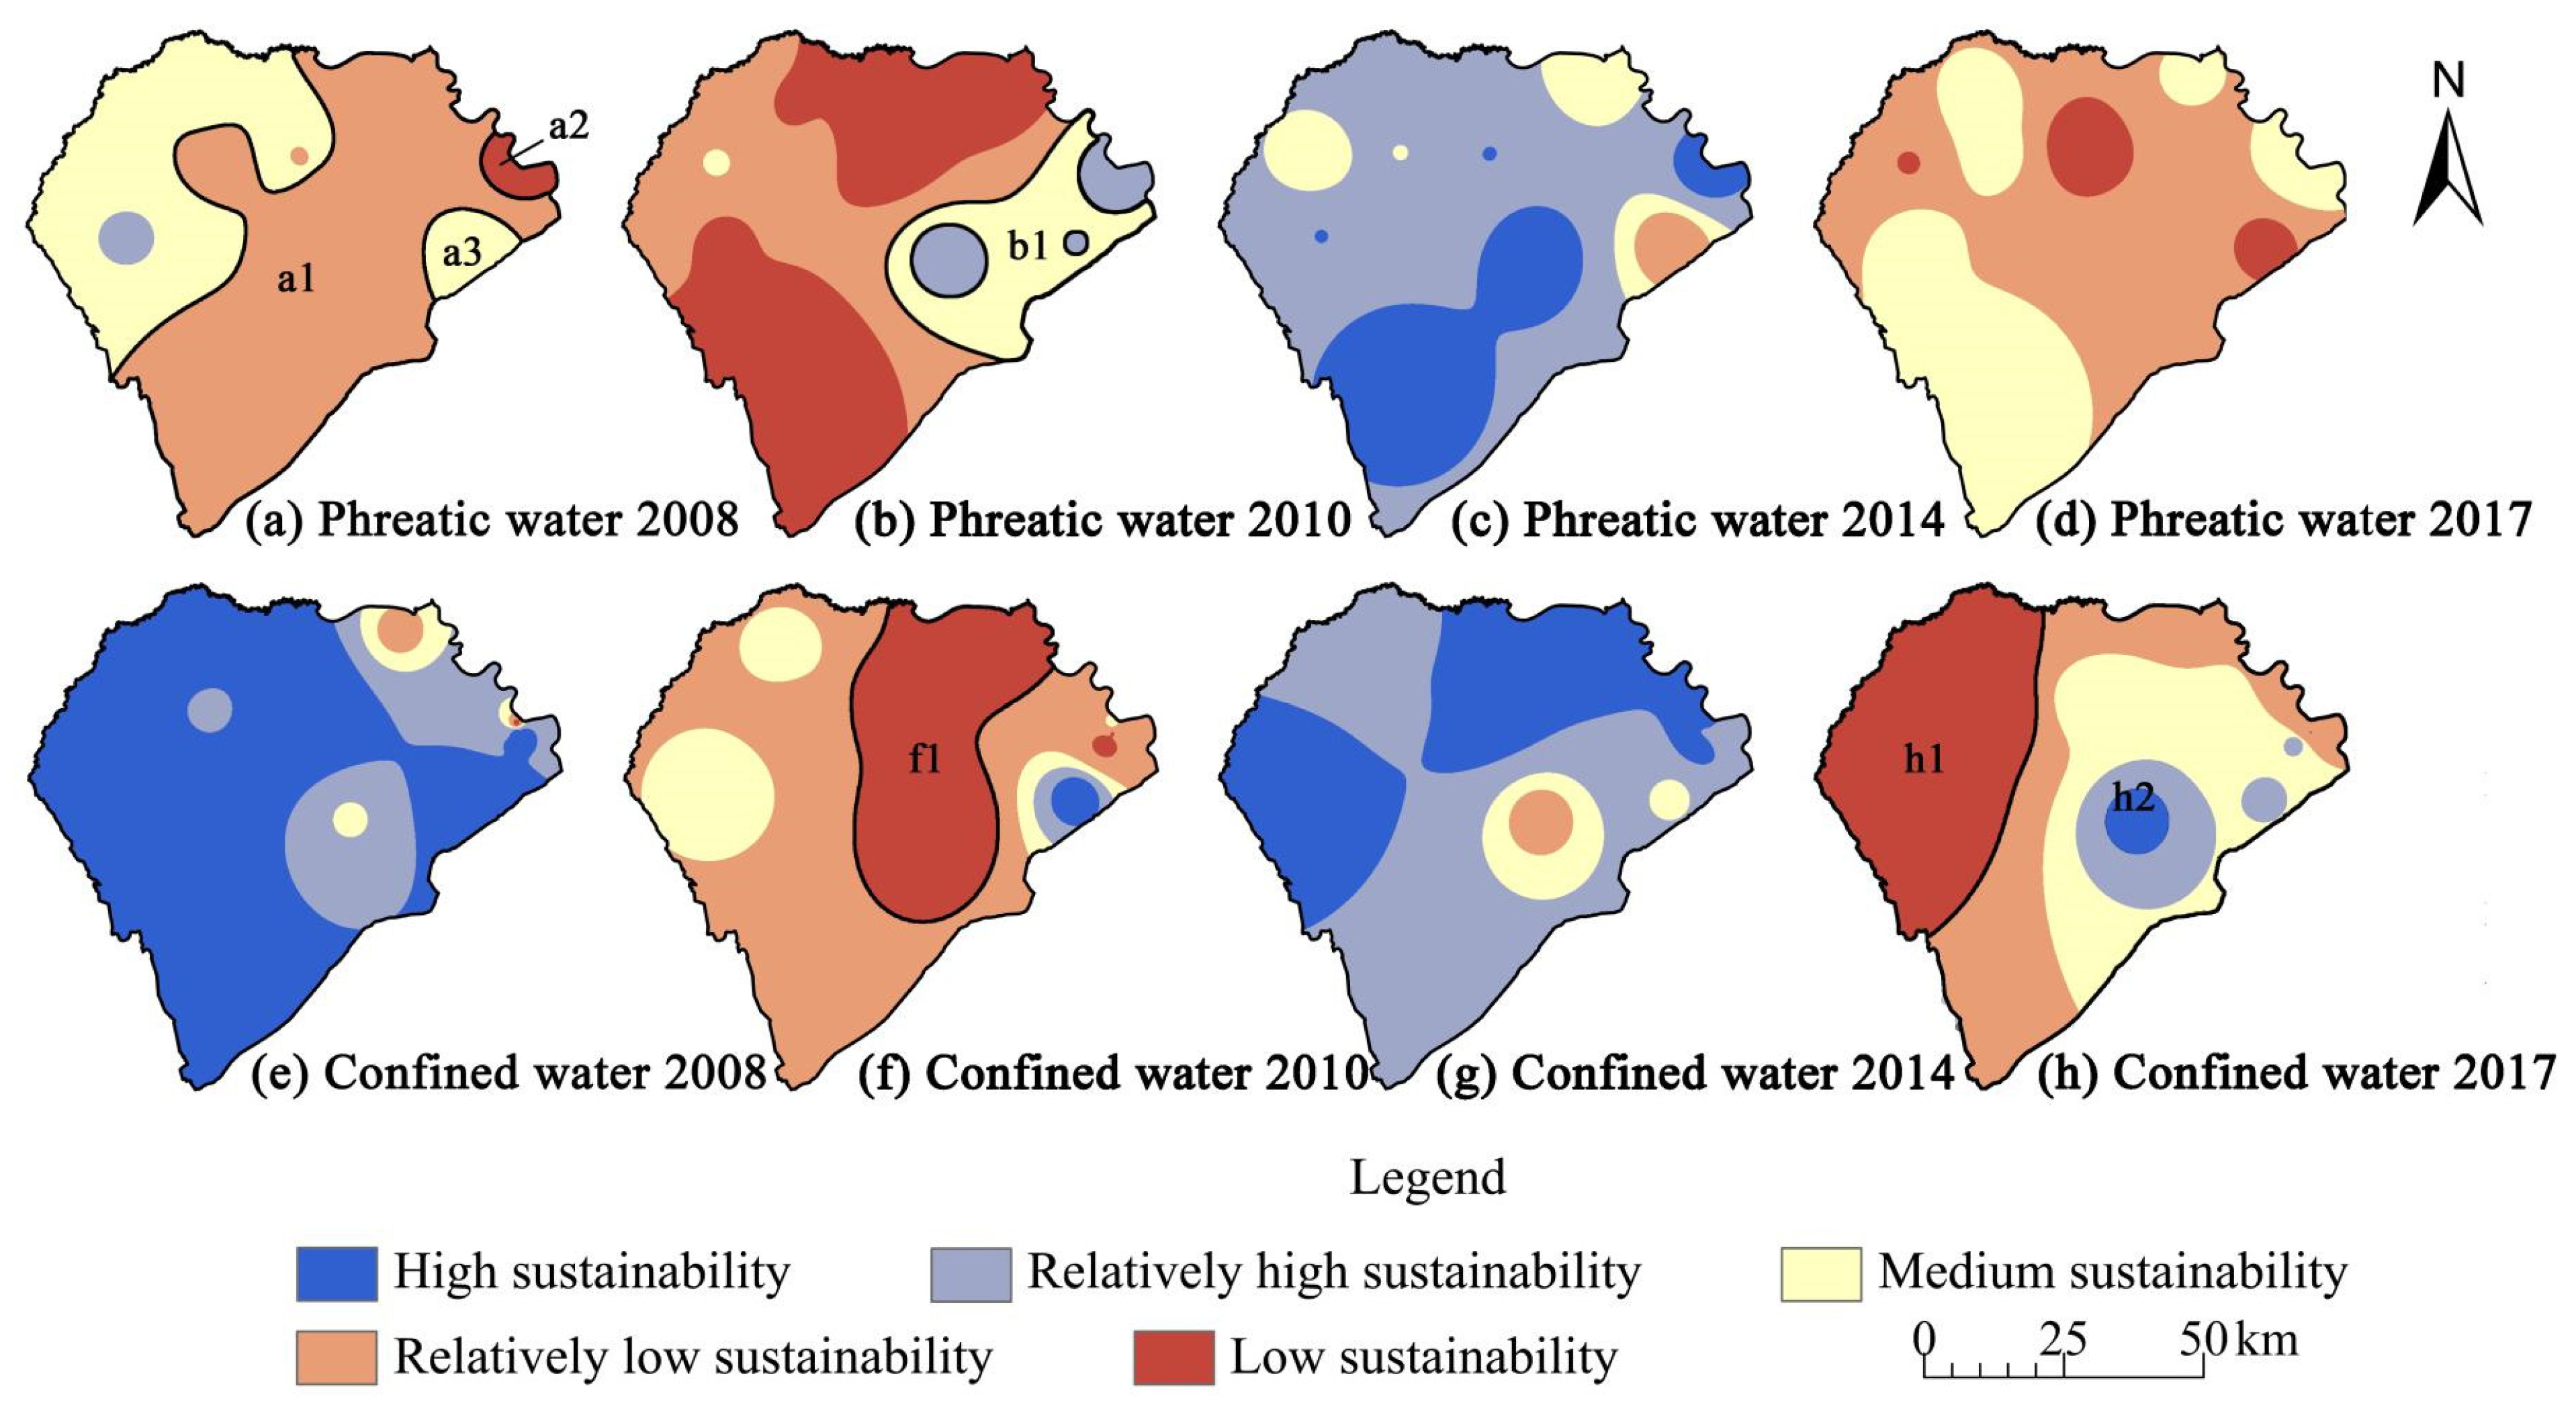
- The sustainability level evaluation using the MGSI shows that the continuous increase in mining up to 2017 subsequently led to the “Relatively low” sustainable subzone occupying most of the submerged aquifer, and the “Low” sustainable subzone of the confined aquifer was concentrated in the west of Da’an City. Reducing mining and the utilization of groundwater is still a challenge that should be overcome in Da’an City, especially in the west of Da’an City. Taking into account the local conditions, developing water-saving agriculture, or replacing paddy fields with dry fields should be considered.
- (4)
- The groundwater depths of Well 8 and Well 9 have increased significantly, indicating that the phreatic water in these areas has been overconsumed during recent years, and management measures should be implemented in the future while continuing to pay attention to the groundwater levels in these areas. The groundwater depth of Well 5 decreased significantly, indicating that the confined water in this area has the potential for further mining.
Author Contributions
Funding
Institutional Review Board Statement
Data Availability Statement
Conflicts of Interest
Appendix A

References
- Döll, P.; Hoffmann-Dobrev, H.; Portmann, F.T.; Siebert, S.; Eicker, A.; Rodell, M.; Strassberg, G.; Scanlon, B.R. Impact of water withdrawals from groundwater and surface water on continental water storage variations(Article). J. Geodyn. 2012, 59–60, 143–156. [Google Scholar] [CrossRef]
- Rahman, A.T.M.S.; Hosono, T.; Kisi, O.; Dennis, B.; Imon, A.H.M.R. A minimalistic approach for evapotranspiration estimation using the Prophet model. Hydrol. Sci. J. 2020, 65, 1994–2006. [Google Scholar] [CrossRef]
- Rahman, A.T.M.S.; Hosono, T.; Quilty, J.M.; Das, J.; Basak, A. Multiscale groundwater level forecasting: Coupling new machine learning approaches with wavelet transforms. Adv. Water Resour. 2020, 141, 103595. [Google Scholar] [CrossRef]
- Rahman, A.T.M.S.; Jahan, C.S.; Mazumder, Q.H.; Kamruzzaman, M.; Hosono, T. Drought analysis and its implication in sustainable water resource management in Barind area, Bangladesh. J. Geol. Soc. India 2017, 89, 47–56. [Google Scholar] [CrossRef]
- Ministry of Water Resources of the People’s Republic of China, China Water Resources Bulletin (2015). 2015. Available online: http://www.mwr.gov.cn/sj/tjgb/szygb/201612/t20161229_783348.html (accessed on 21 March 2021).
- Ministry of Ecology and Environment of the People’s Republic of China, 2011, National Groundwater Pollution and Control Plan (2011–2020). Available online: http://www.gov.cn/gongbao/content/2012/content_2121713.htm (accessed on 21 March 2021).
- Yu, L.; Tang, S.; Ding, Y.; Chen, F.; Yang, Y.; Ding, Y.; He, J. The situation and countermeasures of groundwater overexploitation in northeast China. Water Resour. Plan. Des. 2019, 186, 37–40. (In Chinese) [Google Scholar] [CrossRef]
- Wang, Y.X.; Zheng, C.M.; Ma, R. Review: Safe and Sustainable Groundwater Supply in China. Hydrogeol. J. 2018, 26, 1301–1324. [Google Scholar] [CrossRef]
- Harmancioglu, N.; Barbaros, F.; Cetinkaya, C. Sustainability Issues in Water Management. Water Resour. Manag. 2013, 27, 1867–1891. [Google Scholar] [CrossRef]
- Wable, P.; Jha, M.; Murasingh, S. Evaluation of groundwater resources for sustainable groundwater development in a semiarid river basin of India. Environ. Earth Sci. 2017, 76, 601. [Google Scholar] [CrossRef]
- Pétré, M.-A.; Rivera, A.; Lefebvre, R. Numerical modeling of a regional groundwater flow system to assess groundwater storage loss, capture and sustainable exploitation of the transboundary Milk River Aquifer (Canada–USA). J. Hydrol. 2019, 575, 656–670. [Google Scholar] [CrossRef]
- Zhang, X.; Ren, L.; Kong, X. Estimating spatiotemporal variability and sustainability of shallow groundwater in a well-irrigated plain of the Haihe River basin using SWAT model. J. Hydrol. 2016, 541, 1221–1240. [Google Scholar] [CrossRef]
- Patra, S.; Mishra, P.; Mahapatra, S.C. Delineation of groundwater potential zone for sustainable development: A case study from Ganga Alluvial Plain covering Hooghly district of India using remote sensing, geographic information system and analytic hierarchy process(Article). J. Clean Prod. 2018, 172, 2485–2502. [Google Scholar] [CrossRef]
- Salmoral, G.; Viñarta Carbó, A.; Zegarra, E.; Knox, J.W.; Rey, D. Reconciling irrigation demands for agricultural expansion with environmental sustainability—A preliminary assessment for the Ica Valley, Peru. J. Clean Prod. 2020, 276, 123544. [Google Scholar] [CrossRef]
- Pal, S.; Kundu, S.; Mahato, S. Groundwater potential zones for sustainable management plans in a river basin of India and Bangladesh. J. Clean Prod. 2020, 257, 120311. [Google Scholar] [CrossRef]
- Vu, T.D.; Ni, C.; Li, W.; Truong, M.H.; Hsu, S.M. Predictions of groundwater vulnerability and sustainability by an integrated index-overlay method and physical-based numerical model(Article). J. Hydrol. 2021, 596, 126082. [Google Scholar] [CrossRef]
- Gleeson, T.; Alley, W.M.; Allen, D.M.; Sophocleous, M.A.; Zhou, Y.; Taniguchi, M.; VanderSteen, J. Towards sustainable groundwater use: Setting long-term goals, backcasting, and managing adaptively. Ground Water 2012, 50, 19–26. [Google Scholar] [CrossRef]
- Pandey, V.P.; Shrestha, S.; Chapagain, S.K.; Kazama, F. A framework for measuring groundwater sustainability. Environ. Sci. Policy 2011, 14, 396–407. [Google Scholar] [CrossRef]
- Castle, S.L.; Thomas, B.F.; Reager, J.T.; Rodell, M.; Swenson, S.C.; Famiglietti, J.S. Groundwater depletion during drought threatens future water security of the Colorado River Basin. Geophys. Res. Lett. 2014, 41, 5904–5911. [Google Scholar] [CrossRef] [Green Version]
- Famiglietti, J.S.; Lo, M.; Ho, S.L.; Bethune, J.; Anderson, K.J.; Syed, T.H.; Swenson, S.C.; de Linage, C.R.; Rodell, M. Satellites measure recent rates of groundwater depletion in California’s Central Valley. Geophys. Res. Lett. 2011, 38, L03403–L03406. [Google Scholar] [CrossRef] [Green Version]
- Nanteza, J.; de Linage, C.R.; Thomas, B.F.; Famiglietti, J.S. Monitoring groundwater storage changes in complex basement aquifers: An evaluation of the GRACE satellites over East Africa. Water Resour. Res. 2016, 52, 9542–9564. [Google Scholar] [CrossRef]
- Thomas, B.F.; Caineta, J.; Nanteza, J. Global Assessment of Groundwater Sustainability Based On Storage Anomalies. Geophys. Res. Lett. 2017, 44, 11445–11455. [Google Scholar] [CrossRef] [Green Version]
- Chen, J.; Famigliett, J.S.; Scanlon, B.R.; Rodell, M. Groundwater Storage Changes: Present Status from GRACE Observations. Surv. Geophys. 2016, 37, 397–417. [Google Scholar] [CrossRef]
- Di, L.; Pan, Y.; Zhou, J.; Chen, Y.; Hou, X.; Hong, Y.; Scanlon, B.R.; Longuevergne, L. Global analysis of spatiotemporal variability in merged total water storage changes using multiple GRACE products and global hydrological models. Remote Sens. Environ. 2017, 192, 198–216. [Google Scholar] [CrossRef]
- Alley, W.M.; Konikow, L.F. Bringing GRACE Down to Earth. Ground Water 2015, 53, 826–829. [Google Scholar] [CrossRef] [PubMed]
- Thomas, B.; Famiglietti, J. Sustainable Groundwater Management in the Arid Southwestern US: Coachella Valley, California. Water Resour. Manag. 2015, 29, 4411–4426. [Google Scholar] [CrossRef] [Green Version]
- Mays, L.W. Groundwater Resources Sustainability: Past, Present, and Future. Water Resour. Manag. 2013, 27, 4409–4424. [Google Scholar] [CrossRef]
- Gain, A.K.; Giupponi, C.; Wada, Y. Measuring global water security towards sustainable development goals. Environ. Res. Lett. 2016, 11, 124015. [Google Scholar] [CrossRef]
- Chaves, H.M.L.; Alipaz, S. An Integrated Indicator Based on Basin Hydrology, Environment, Life, and Policy: The Watershed Sustainability Index. Water Resour. Manag. 2007, 21, 883–895. [Google Scholar] [CrossRef]
- Lavapuro, M.; Lipponen, A.; Artimo, A.; Katko, T.S. Groundwater sustainability indicators: Testing with Finnish data. Boreal Environ. Res. 2009, 13, 381–402. [Google Scholar]
- Wada, Y.; Van Beek, L.P.; Van Kempen, C.M.; Reckman, J.W.; Vasak, S.; Bierkens, M.F. Global depletion of groundwater resources. Geophys. Res. Lett. 2010, 37, 1–5. [Google Scholar] [CrossRef] [Green Version]
- White, S.D. Framing water sustainability in an environmental decision support system. Soc. Natur. Resour. 2013, 26, 1365–1373. [Google Scholar] [CrossRef]
- Chen, J.; Zhang, Y.; Chen, Z.; Nie, Z. Improving assessment of groundwater sustainability with analytic hierarchy process and information entropy method: A case study of the Hohhot Plain, China. Environ. Earth Sci. 2015, 73, 2353–2363. [Google Scholar] [CrossRef]
- Kendall, M.G. Rank Auto-Correlation Methods; Charles Griffin: London, UK, 1975. [Google Scholar]
- Mann, H.B. Nonparametric Tests Against Trend. Econometrica 1945, 13, 245–259. [Google Scholar] [CrossRef]
- Sen, P.K. Estimates of the Regression Coefficient Based in Kendall’s Tau. J. Am. Stat. Assoc. 1968, 63, 1379. [Google Scholar] [CrossRef]
- Wang, L. Analysis of the main problems existing in the development and utilization of water-saving and grain-increasing water resources in Da’an City, Jilin Province. Agric. Technol. 2015, 35, 63–64,85. (In Chinese) [Google Scholar] [CrossRef]
- Qu, K.; Zhang, Z. Prediction of drawdown cone of groundwater extraction in Da’an City the second water sources. Jilin Geol. 2013, 32, 133–135. (In Chinese) [Google Scholar] [CrossRef]
- Jilin Provincial Water Resources Department. Groundwater Dynamic Data (Songyuan, Baicheng Volume); Jilin Provincial Water Resources Department: Changchun, China, 2007–2017. [Google Scholar]
- Manuela, L.; Susanna, M.; Antonio, D.L.D. Groundwater hydrodynamic behaviours based on water table levels to identify natural and anthropic controlling factors in the Piedmont Plain (Italy). Sci. Total Environ. 2020, 716, 137051. [Google Scholar] [CrossRef]
- Baicheng Water Resources Management Center, 2007–2017; Baicheng Water Resources Bulletin: Baicheng, China, 2007–2017.
- Statistic Bureau of Jilin. Jilin Statistical Yearbook; Jilin University Audio and Video Press: Jilin, China, 2017. Available online: http://tjj.jl.gov.cn/tjsj/tjnj/ (accessed on 21 March 2021).
- Liu, L.; Zhang, X. Global 30 m Fine Surface Coverage Products in 2020. 2020. Available online: http://data.casearth.cn/sdo/detail/5fbc7904819aec1ea2dd7061 (accessed on 21 March 2021).
- Hashimoto, T.; Stedinger, J.R.; Loucks, D.P. Reliability, resiliency, and vulnerability criteria for water resource system performance evaluation. Water Resour. Res. 1982, 18, 14–20. [Google Scholar] [CrossRef] [Green Version]
- Ren, Z. Evaluation Method of Port Enterprise Product Quality Based on Entropy Weight TOPSIS. J. Coast. Res. 2020, 103, 766–769. [Google Scholar] [CrossRef]
- Jayanta, D.; Mandal, T.; Saha, P.I.U.; Bhattacharya, S.K. Variability and trends of rainfall using non-parametric approaches: A case study of semi-arid area. Mausam 2020, 71, 33–44. [Google Scholar] [CrossRef]
- Kamruzzaman, M.; Rahman, A.T.M.; Ahmed, M.; Kabir, M.; Mazumder, Q.H.; Rahman, M.S.; Jahan, C.S. Spatio-temporal analysis of climatic variables in the western part of Bangladesh. Environ. Dev. Sustain. 2018, 20, 89–108. [Google Scholar] [CrossRef]
- Nalley, D.; Adamowski, J.; Khalil, B.; Ozga-Zielinski, B. Trend detection in surface air temperature in Ontario and Quebec, Canada during 1967–2006 using the discrete wavelet transform. Atmos. Res. 2013, 132, 375–398. [Google Scholar] [CrossRef]
- Rahman, A.T.M.S.; Ahmed, M.S.; Adnan, H.M.; Kamruzzaman, M.; Khalek, M.A.; Mazumder, Q.H.; Jahan, C.S. Modeling the changes in water balance components of the highly irrigated western part of Bangladesh. Hydrol. Earth. Syst. Sci. 2018, 22, 4213–4228. [Google Scholar] [CrossRef] [Green Version]
- Rahman, A.T.M.S.; Kamruzzama, M.; Jahan, C.S.; Mazumder, Q.H. Long-term trend analysis of water table using “MAKESENS” model and sustainability of groundwater resources in drought prone Barind area, NW Bangladesh. J. Geol. Soc. India 2016, 87, 179–193. [Google Scholar] [CrossRef]
- Tabari, H.; Nikbakht, J.; Some’e, B.S. Investigation of groundwater level fluctuations in the north of Iran. Environ. Earth Sci. 2012, 66, 231–243. [Google Scholar] [CrossRef]
- Zhang, L. Study on the Groundwater and Ecological Landscape Influenced by Water Diversion Project in Da’an County; Jilin University: Changchun, China, 2012. [Google Scholar]


| MGSI Range | Sustainability Level of Groundwater |
|---|---|
| −0.566 to 0.148 | Low |
| 0.148–0.498 | Relatively low |
| 0.498–0.776 | Medium |
| 0.776–1.145 | Relatively high |
| 1.145–1.938 | High |
| Target | First-Level Evaluation Index | Serial Number | Secondary Evaluation Index | Data Source/ Calculation Method | Weight Relative to Target |
|---|---|---|---|---|---|
| Mining degree | Amount of groundwater mining | 1 | Total amount of mining | Baicheng City Water Resources Bulletin | 0.084 |
| 2 | Amount of mining for irrigation | Baicheng City Water Resources Bulletin | 0.109 | ||
| 3 | Amount of mining for industry | Baicheng City Water Resources Bulletin | 0.122 | ||
| Intensity of groundwater mining | 4 | Groundwater consumption per 10,000 Yuan of GDP | Total amount of mining (10,000 m3)/GDP (10,000 Yuan) | 0.207 | |
| 5 | Groundwater consumption per capita | Total amount of mining (10,000 m3)/total population (10,000) | 0.099 | ||
| 6 | Intensity of mining for agriculture | Amount of mining for irrigation (10,000 m3)/total number of agricultural wells | 0.228 | ||
| 7 | Groundwater consumption per 10,000 Yuan of industrial production value | Amount of mining for industry (10,000 m3)/industrial production value (10,000 Yuan) | 0.151 |
| i | MDi | i | MDi | i | MDi |
|---|---|---|---|---|---|
| 2007 | 0.126 | 2008 | 0.063 | 2009 | 0.626 |
| 2010 | 0.789 | 2011 | 0.390 | 2012 | 0.392 |
| 2013 | 0.140 | 2014 | 0.303 | 2015 | 0.487 |
| 2016 | 0.971 | 2017 | 0.966 |
| Aquifer | Mean MGSI | Significance (5% Significance Level) | Trend | Sen’s Slope (/a) |
|---|---|---|---|---|
| Phreatic | 0.230–0.999 | Insignificant | Increasing | 0.01 |
| Confined | 0.283–1.326 | Insignificant | Decreasing | −0.04 |
Publisher’s Note: MDPI stays neutral with regard to jurisdictional claims in published maps and institutional affiliations. |
© 2022 by the authors. Licensee MDPI, Basel, Switzerland. This article is an open access article distributed under the terms and conditions of the Creative Commons Attribution (CC BY) license (https://creativecommons.org/licenses/by/4.0/).
Share and Cite
Fang, Z.; Ding, X.; Gao, H. Local-Scale Groundwater Sustainability Assessment Based on the Response to Groundwater Mining (MGSI): A Case Study of Da’an City, Jilin Province, China. Sustainability 2022, 14, 5618. https://doi.org/10.3390/su14095618
Fang Z, Ding X, Gao H. Local-Scale Groundwater Sustainability Assessment Based on the Response to Groundwater Mining (MGSI): A Case Study of Da’an City, Jilin Province, China. Sustainability. 2022; 14(9):5618. https://doi.org/10.3390/su14095618
Chicago/Turabian StyleFang, Zhang, Xiaofan Ding, and Han Gao. 2022. "Local-Scale Groundwater Sustainability Assessment Based on the Response to Groundwater Mining (MGSI): A Case Study of Da’an City, Jilin Province, China" Sustainability 14, no. 9: 5618. https://doi.org/10.3390/su14095618