Article

B Impact Assessment as a Sustainable Tool: Analysis of the Certification Model

1
School of Engineering, ISEP, Polytechnic of Porto, 4249-015 Porto, Portugal
2
CIICESI, Escola Superior de Tecnologia e Gestão, Politécnico do Porto, 4610-156 Felgueiras, Portugal
3
Institute of Science and Innovation in Mechanical and Industrial Engineering (INEGI), 4200-465 Porto, Portugal
4
Design School, Polytechnic Institute Cavado Ave, 4750-810 Barcelos, Portugal
*
Author to whom correspondence should be addressed.
Sustainability 2022, 14(9), 5590; https://doi.org/10.3390/su14095590
Submission received: 25 March 2022 / Revised: 29 April 2022 / Accepted: 4 May 2022 / Published: 6 May 2022
(This article belongs to the Collection New Frontiers in Production Engineering)

Abstract

:
Currently, certification is an essential tool for a company’s sustainability and a seal of trust for the stakeholders. The B Corporation (B Corp) certification system is in line with the leading indicators of sustainable development and social responsibility published by the general assembly of the United Nations, namely: environment, community, workers, customers, and governance. Nevertheless, it is essential that academic research should empirically assess the B Corp model’s reliability for its validation and legitimization. In this study, we address the results of the B Impact Assessment of 2262 companies certified by B Corp from the beginning of 2017 to March 2021. The main objective is to analyze the B Impact Assessment, verifying the robustness and consistency of the model to measure and improve the economic, social, and environmental impact of companies. We analyzed the construct’s validity through a confirmatory factorial analysis using AMOS statistical software. The results allowed us to identify some weaknesses and limitations of the B Impact Assessment. This certification system reflects an unadjusted model where the main assessment indicators have problems with regard to the measurement scale. The governance and customer indicators are the most vulnerable. The findings also allow us to state that there are apparently no minimum values established for each of the parameters evaluated, which may cause imbalances in the sustainable development process of B Corp companies. This research contributes to enhancing B Impact Assessment as a sustainability tool, highlighting areas for improvement concerning the indicators’ measurement scales and the assessment process, including the monitoring of evaluators.

1. Introduction

It is widely recognized that certification is a relevant tool for the business sector to achieve sustainable development goals and a faithful commitment to stakeholders [1,2,3,4].
Created in 2006 in the United States as “B Lab,” the B Corporation’s certification model is intended to be an instrument for evaluating the social, economic, and environmental performance of companies. In addition to evaluating products and services, this certification model also evaluates operations, the sourcing and input of materials, charitable donations, business model, employees, community, environment, and customers [5].
This certification is perceived as a kind of seal of trust for stakeholders of a company’s good performance [5]. The positive impact of this model is supported by transparency and accountability requirements. B Corporation certification is administered by B Lab which is a non-profit organization [5].
The certification process varies depending on the size and complexity of the company [5]. B Impact Assessment is used as a digital tool to assess a company’s performance and encompasses five different indicators—governance, workers, community, environment, and customers—measured through a set of variables that express the practices and outputs achieved by companies [5].
This paper analyses the consistency and robustness of B Impact Assessment as a certification model that helps companies measure and improve their economic, social, and environmental impact in five different areas: governance, workers, community, environment, and customers. Considering the complexity of the model structure, which includes multiple indicators that are disaggregated into different variables, a confirmatory factor analysis was used.
Taking advantage of transparency as one of the most substantial aspects of this certification system, we study B Impact Assessment data from 2262 companies and organizations distributed worldwide. The database was taken directly from the B Corporation website.
By 2021, the B Corporation had more than 4000 certified companies [5]. The reason that leads us to focus attention on the B Corporation is the high growth of this certification throughout the world, especially in Europe.
To be eligible for certification, a company must demonstrate that it adheres to the “highest standards of verified social and environmental performance, public transparency and legal accountability to balance profit and purpose” [5]. Certification is obtained when a company reaches an 80-point threshold in the evaluation process [5].
Some of the various sustainable development objectives defined by the United Nations are in common with the B Impact Assessment.
Despite the success in the practical application of the B Impact Assessment and B Corp certification, there is a research gap in empirical academic research regarding the model’s reliability, which is an essential issue for legitimizing any management model. Since this subject is essential to everyone, especially managers and entrepreneurs, we believe that this research is an asset to the community and in the right direction for ensuring sustainability.
According to [6], companies with a high level of initiatives related to corporate sustainability tend to obtain better market value and lower the cost of capital and cost of debt. Concerning adopting a B Corp policy, these effects on economic growth apparently need some time to be reflected [7]. However, due to the richness of our dataset and the techniques employed, our paper can address both deficiencies.
The remainder of this paper is structured as follows. In Section 2, a literature review is presented. Section 3 presents the research methodology. Section 4 provides the results of the study. In the final Section 5 and Section 6, a summary of the results is presented and discussed.

2. Literature Review

Literature studies on the B Corporation reveal a subject with great potential emerging in the academic community [8], as it is in line with the leading sustainability demands.
The concept of sustainability has gained prominence in the scientific and business community in recent decades. For example, in the report “Our Common Future” (Brundtland Report), published in 1987, sustainable development was defined as “development that meets the needs of the present without compromising the ability of future generations to meet their own needs” [9] (p. 43). This principle underpins the 17 sustainable development goals (SDGs) defined by the United Nations (UN) in 2015, whose achievement depends on the commitment of companies, governments, and citizens [10].
The Brundtland Report (1987) definition of sustainability makes room for different sustainability models with diverse intensities of the relationship between the three sustainability dimensions: the social, the economic and the environmental.
Research by [11] is thought to be at the origin of the three-pillar conception of sustainability—social, economic, and environmental—usually represented by three intersecting circles with sustainability at the center. A review of the genesis and theoretical foundations of the concept of sustainability highlighted that “there is no single point of origin of this three-pillar conception, but rather a gradual emergence of various critiques in the early academic literature of the economic status quo from both social and ecological perspectives on the one hand, and the United Nations’ quest to reconcile economic growth as a solution to social and ecological problems on the other” [12].
Theoretically, several relevant theories support sustainability and the adoption of B Corp certification. Stakeholder theory [13,14] highlights the relevance of a firm’s relationships with its critical stakeholders with the integration of business and societal considerations fostering stakeholder value and leading to improved performance [15]. According to the resource-based view (RBV) theory [16], organizations should identify and use valuable, rare, difficult to copy, and non-substitutable resources to gain competitive advantages and abnormal profits. The adoption of sustainability and B Corp certification can generate these resources and support integration with stakeholders (an inimitable resource) in response to their demands. Additionally, institutional theory (the adoption of models from successful organizations) can also explain the destination of sustainability and B Corp certification as a search for organizational legitimacy [17].
The institutionalization of sustainable development by the UN, in 1987 in the Brundtland Report and the Earth Summit in 1992, drove a real international awareness and stance on the need to establish a global and effective sustainable development policy.
At the level of organizations, there has been a growing adoption of reporting and management practices for sustainability. According to [18], “given the complexity and multidimensionality of sustainable development, several standards have been proposed to address specific (environmental, social, economic) or practical (reporting mechanisms, management systems, etc.) issues” (p. 333).
Created in 2006 in the United States, B Lab is an already well known and rapidly growing organization in the certification field of corporate sustainability. B Corp certification is based on three essential pillars: social and environmental performance, public transparency, and legal accountability [5]. The five indicators included in the B Impact Assessment model can be equally associated with the three pillars of sustainability: economic (governance), social (workers, community, and customer) and environmental (environmental).
Some companies are still reticent about the financial impact resulting from implementing the B Corp certification. However, as shown by [19], the positive effects on the growth of companies’ turnover in the short term, resulting from increased transparency and the positive socioenvironmental impact observed, outweigh the adverse effects due to the strict audit procedure. Furthermore, according to [20], the critical analysis of the potential of this certification compared to the basic principles of the circular economy allows an opportunity to portray multiple dynamic viewpoints concerning stakeholders.
B Corporation certification can activate circular economy pathways due to the actions of different stakeholders in an international context [20]. With the environment, for example, being one of the evaluation indicators during the B audit process, according to [21], companies’ environmental impact processes have a direct and indirect association with their long-term development and financial performance. Therefore, B Corp certification can contribute fundamentally to economic growth of such companies. In a study [22] conducted on 851 certified B Corporation companies based in the United States, in the first 10 years of certification, it was possible to identify that institutional and economic resources support the diffusion of this certification model. According to [22], the author of this study, companies will be more likely to become certified the greater the number of organizations covered by this model, contributing to the social and environmental well-being of the planet. In addition, the economic resources of the external environment influence adherence to this certification.
The authors of [23] mention that the goal of the B Lab is to improve the alignment of the mission of companies and measure the impact of their business to meet the highest standards of society today. The focus on socioenvironmental performance, transparency, and legal responsibility is part of the strategy of this pro-social and entrepreneurial movement.
Some studies try to understand the motive and the most common reasons that lead companies and organizations to seek B Corp certification. For example, according to the analysis conducted by [24] the main reasons for seeking these certifications have to do with the fact that companies identify their mission with this model and the attempt to enhance their values and identity in the markets.
Another perspective that also deserves some attention is understanding the main reasons that lead stakeholders to seek out companies certified by B Corp. A study carried out on 20 consumers in Chile of products and services provided by B Corp companies reveals that consumers’ main motivations were [25]:
Socio-environmental responsibility
Self-satisfaction
Health and quality of life
Results from the same study [25] show that the image this certification conveys to the consumer is one of trust and effectiveness in the social, economic, and environmental fields. In addition, consumers also highlight the good quality and exclusive design when looking for B Corp companies or organizations. The world is increasingly dynamic and to achieve high levels of quality, everyone involved in this area must have new skills, such as creativity, teamwork, communication, and knowledge of new technologies [26].
Independently of this certification being a good tool for companies to identify more effective ways to integrate social values in markets and business, improvements in the future depend mainly on how founders and leaders relate to certification. The announcement of certifications in the sphere of sustainability is positively associated with the performance of companies [27]. In research conducted by [28], organizations and companies with a strong brand in markets often believe they have already achieved high ethical standards, yet they aspire to let stakeholders know this. Mitigating and reducing the ecological footprint, certainly one of the aspects valued by B Corp, cannot be considered by companies as a sacrifice but rather as an act of ensuring the quality of life and a more promising future. A growing trend of ecological consumerism has opened a vast market of opportunities for entrepreneurs to conduct more sustainable businesses. Companies should exploit this growing market by investing in innovative ecological processes and producing sustainable goods. Such policies will not be cost-free. However, the short-term cost would be outweighed by the long-term sustainability gain [29,30], and this message should be conveyed by agencies to top management.
In addition to this message, the B Corp must be seen as a faithful business partner, and its certification must provide a seal of legitimacy for external markets, investors, and customers [28].
The socio-economic and environmental values of B Corp act as driving and motivational forces on the overall assessment of the impact of benefits for the common good. Regarding environmental values, other tools, such as Lean, have also proven their contribution to improving sustainable business development due to the large reduction in waste produced [31] and this should be valued by the B Corp audit process. Within this framework, the B Corp movement competes alongside existing models as a new paradigm [32]. The search for competitive advantage causes those responsible for the marketing area, in particular, to start introducing corporate sustainability initiatives in search of differentiation in the markets and brand engagement with stakeholders [33]. Consequently, this may lead to high demand for certification systems such as B Corp. Tendentially, as explained by [34], female-gendered business owners are associated with a higher likelihood of obtaining B Corp certification. The authors of [35] have also stated this concerning adopting other certification systems such as ISO 9001. There seems to be a positive correlation between female managers and the adoption of tools for sustainable development.
To approach sustainability without mentioning the importance of social responsibility is an incomplete assessment of the sustainable development of companies. In addition to measuring sustainability, the B Impact Assessment indicators also measure social responsibility. In general, governmental funds and financial investment choices are allocated to companies that incorporate corporate social responsibility policies in their mission [36]. An organization with high status in terms of social responsibility and high ethical principles and practices, as is apparently the case with B Corp companies, is a reliable business partner and a reputable member of the business community [37]. Studies by [38,39] highlight that stakeholders in business markets increasingly value incorporating social responsibility measures. B Corp can act as a major partner in this, broadening commercial horizons.
According to the data available from B Lab, B Corp certification is mainly aimed at the service sector, with a small ecological footprint [5]. Quality improvement tools, such as Lean, have already demonstrated their capacity to develop sustainability indices [40,41]. Perhaps, by exploring different methodologies, B Corp can further expand its certification model to other sectors, such as manufacturing.

3. Method

3.1. Conceptual Model, Data, and Sample

The definition of the conceptual model consists of converting the elements that are intended to be analyzed in the research into a language that allows the systematic work of data collection and analysis [42]. This research aims to validate the certification model proposed by B Lab, which is used to measure companies’ social, environmental, and economic impact. The B Impact Assessment comprises five indicators [5]—governance, workers, community, environment, and customers—measured through a set of variables that express the practices and outputs achieved by companies in terms of their economic, social, and environmental performance (see Figure 1).
The data from the assessment process of the certified B Corporation companies were accessed through the organization’s official website (https://bcorporation.eu/directory, accessed on 28 April 2021), and this information was collected on the assessment of 2262 companies certified between January 2017 and March 2021. The data were extracted directly from the website during the period between March and May 2021, using Microsoft Excel software, which eliminates the probability of errors due to manual transcription of the data. Subsequently, a data processing method was developed through the Visual Basic programming language, where all data were neatly filled in an interactive sheet. The statistical analysis of the sample was performed using SPSS software and the confirmatory factorial analysis (CFA) using AMOS software. The variables extracted from the B Corp directory with significance for this research are mentioned in Table 1.
The overall sample has a total of 2262 companies. However, we found that the observed variables changed over the period during which the certifications occurred, which led us to reduce their size to a constant observation period and preferably closer to the present. Therefore, this period portrays the data of B Corporation companies certified between the beginning of 2020 and March 2021.
Another reason we adjusted the initial sample size to a smaller one (556) was the missing values, since they exceeded 10%, which could create problems for us during the analysis [43]. In order not to distort the reality of the data collected on the B Impact Assessment, with the imputation of random data, the missing values were disregarded. These data are missing mainly because many of the B Corporation companies in the sample do not have employees, and therefore no point value was assigned to the observed variable.

3.2. Confirmatory Factor Analysis

B Impact Assessment is a model consisting of a set of indicators that represent complex concepts that cannot be measured directly and, as such, can be called latent variables. The measured scores are termed observed variables. This model comprises four latent variables (governance, workers, community, and environment) and one observed variable (customer stewardship), as can be seen in Table 2.
In order to validate the measurement model of B Impact Assessment, we performed confirmatory factor analysis using AMOS software, since this analysis allows us to assess the quality of the adjustment of a theoretical measurement model to the correlational structure examined between the observed variables [44]. Additionally, confirmatory factor analysis is the best-known statistical procedure for investigating relations between sets of observed and latent variables [45].
The confirmatory factor analysis influence not only the analytical aspects of the research but also the design and approach to data collection for decision making and problem solving [43]. According to the same author [43], it is essential to pay attention during the creation of the model to fundamental aspects that lead to a correct analysis, such as missing values, identification of outliers, and the construct’s reliability and, most fundamentally, normality.
B Impact Assessment is assumed as a measurement model that allows the assessment of business in social and environmental dimensions. The specification of the measurement model is one of the most complex steps in multivariate analysis. The measurement model aims to identify the observed variables used to measure each of the latent variables (constructs/indicators). Thus, each latent variable is measured indirectly, reflecting consistency across multiple observed variables.
When building the measurement model, it is essential to follow some specification rules [44]: (i) the behavior of the observed variables results from the manifestation of the latent variables; (ii) the variance of the observed variables that is not explained by the latent variables is explained by specific latent factors (e.g., measurement errors); and (iii) measurement errors are usually independent.

4. Results

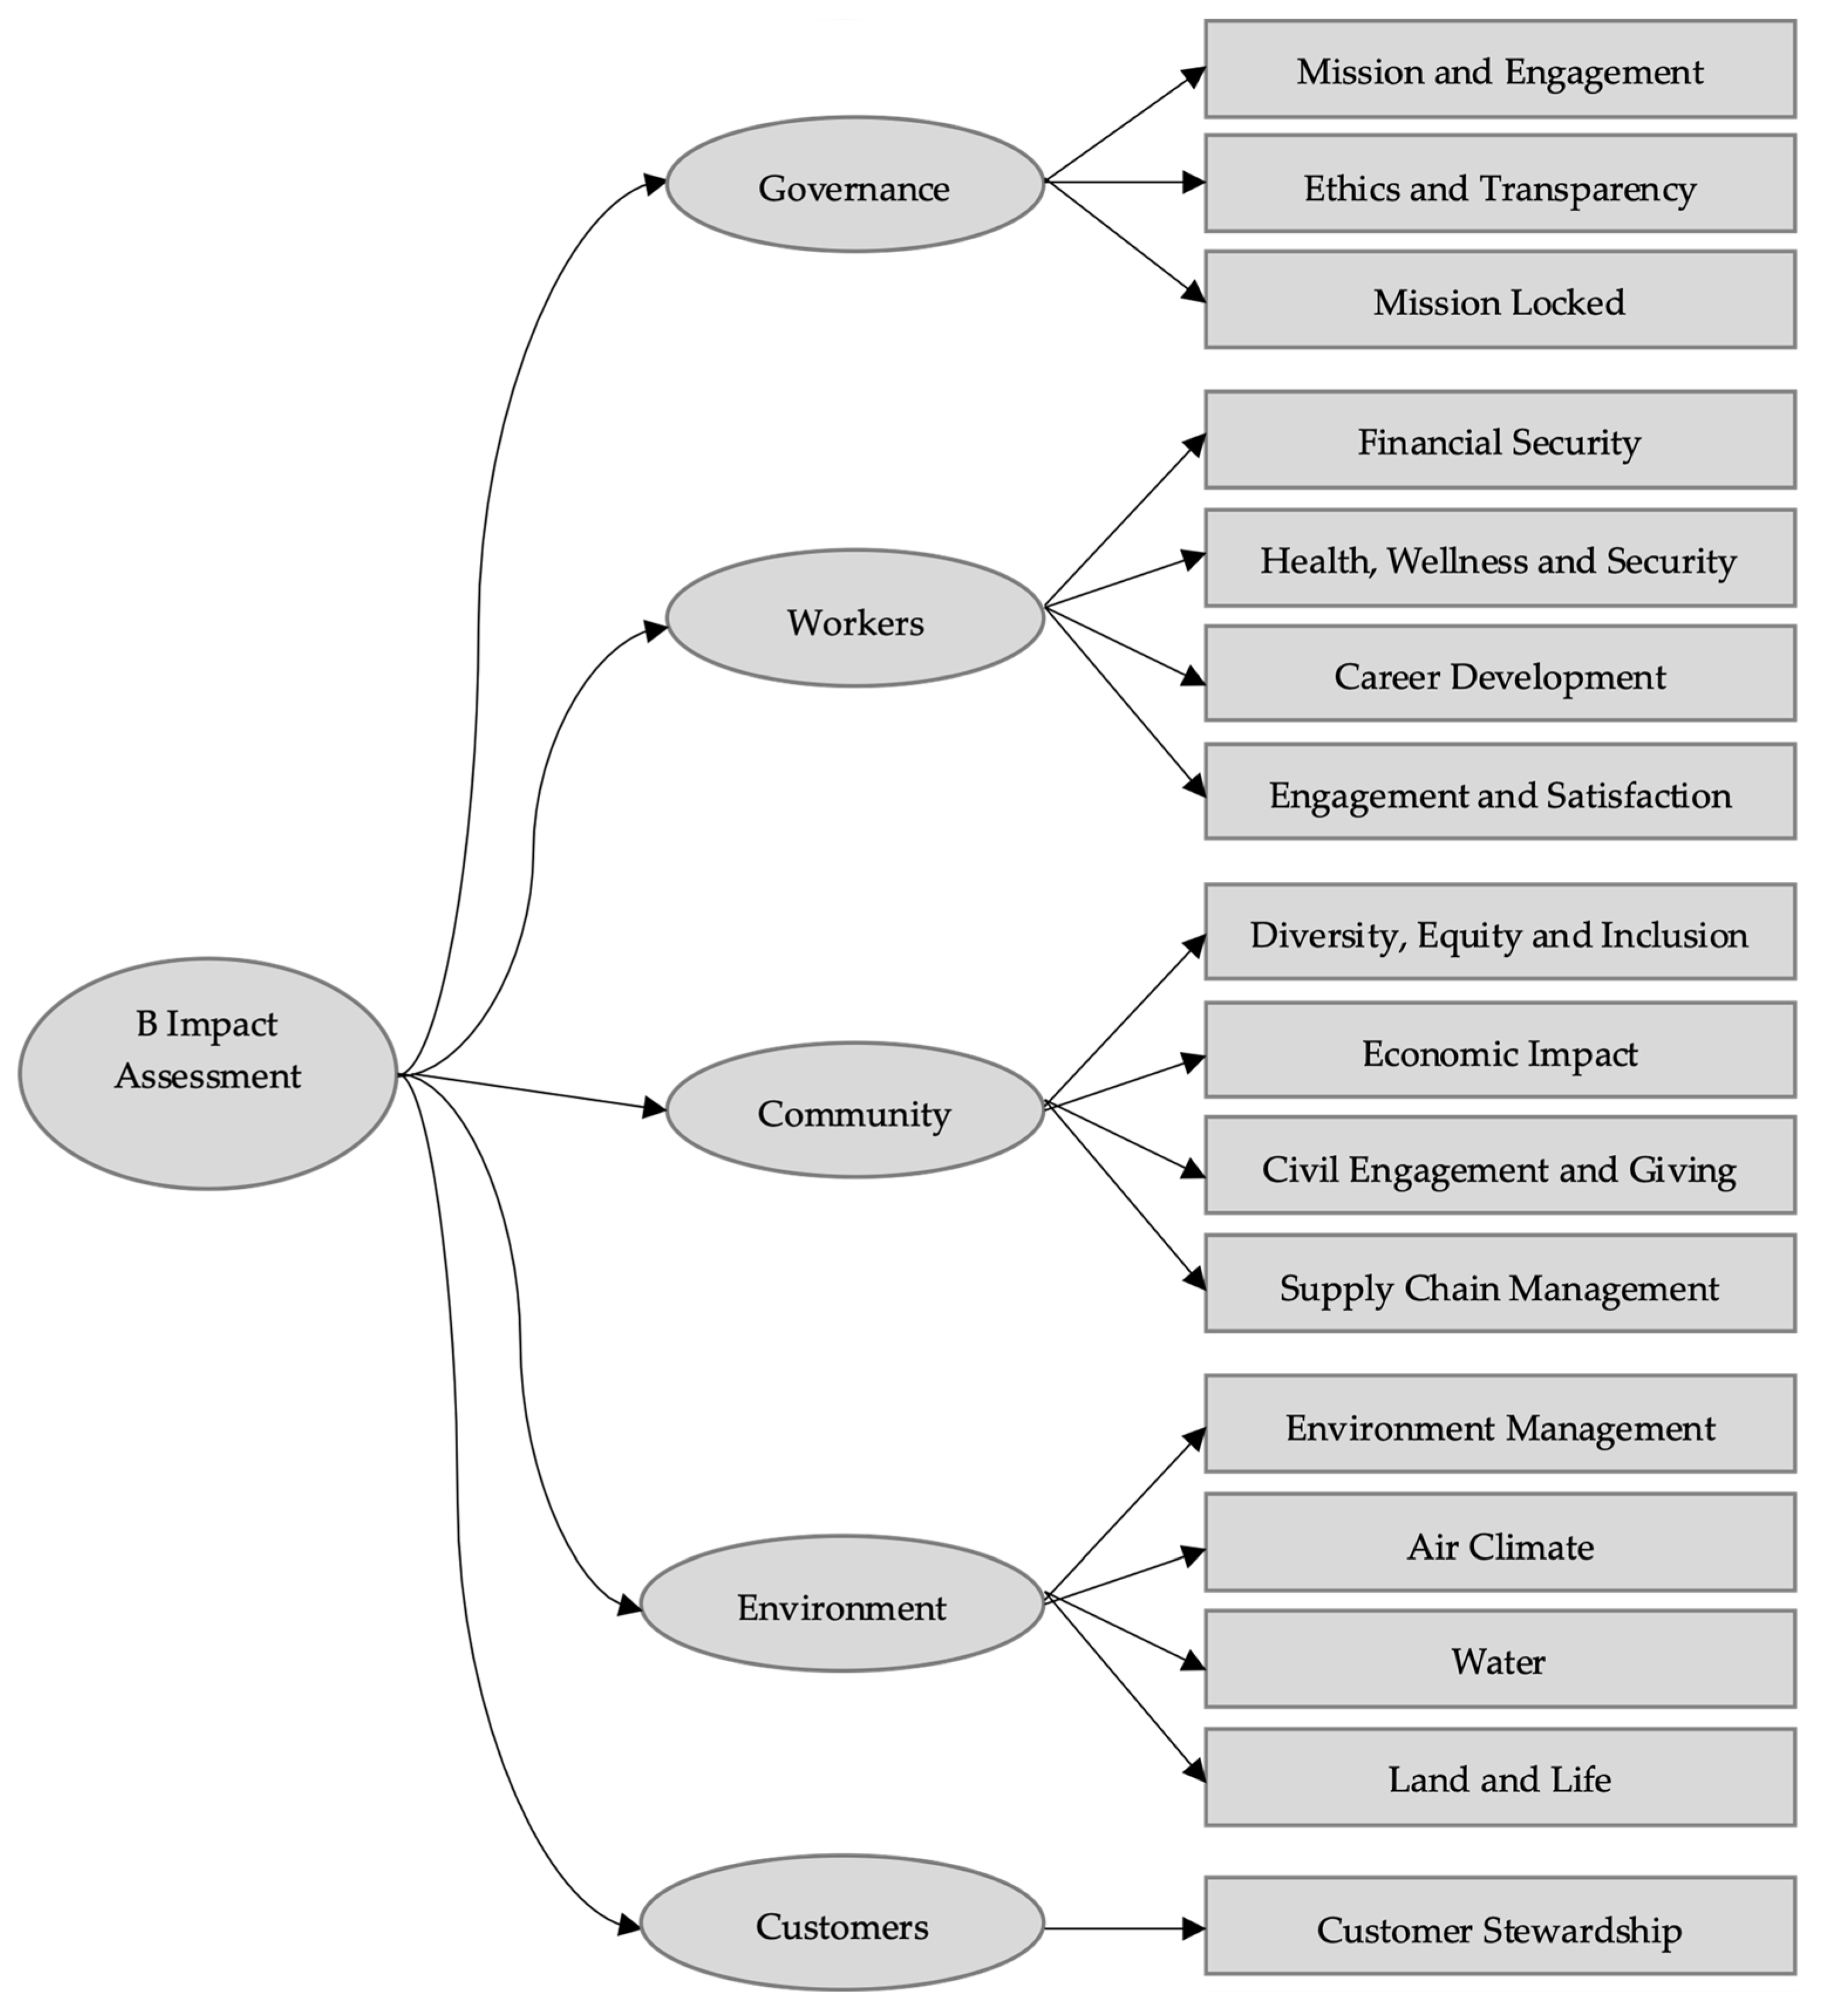
4.1. B Impact Assessment Global Scores

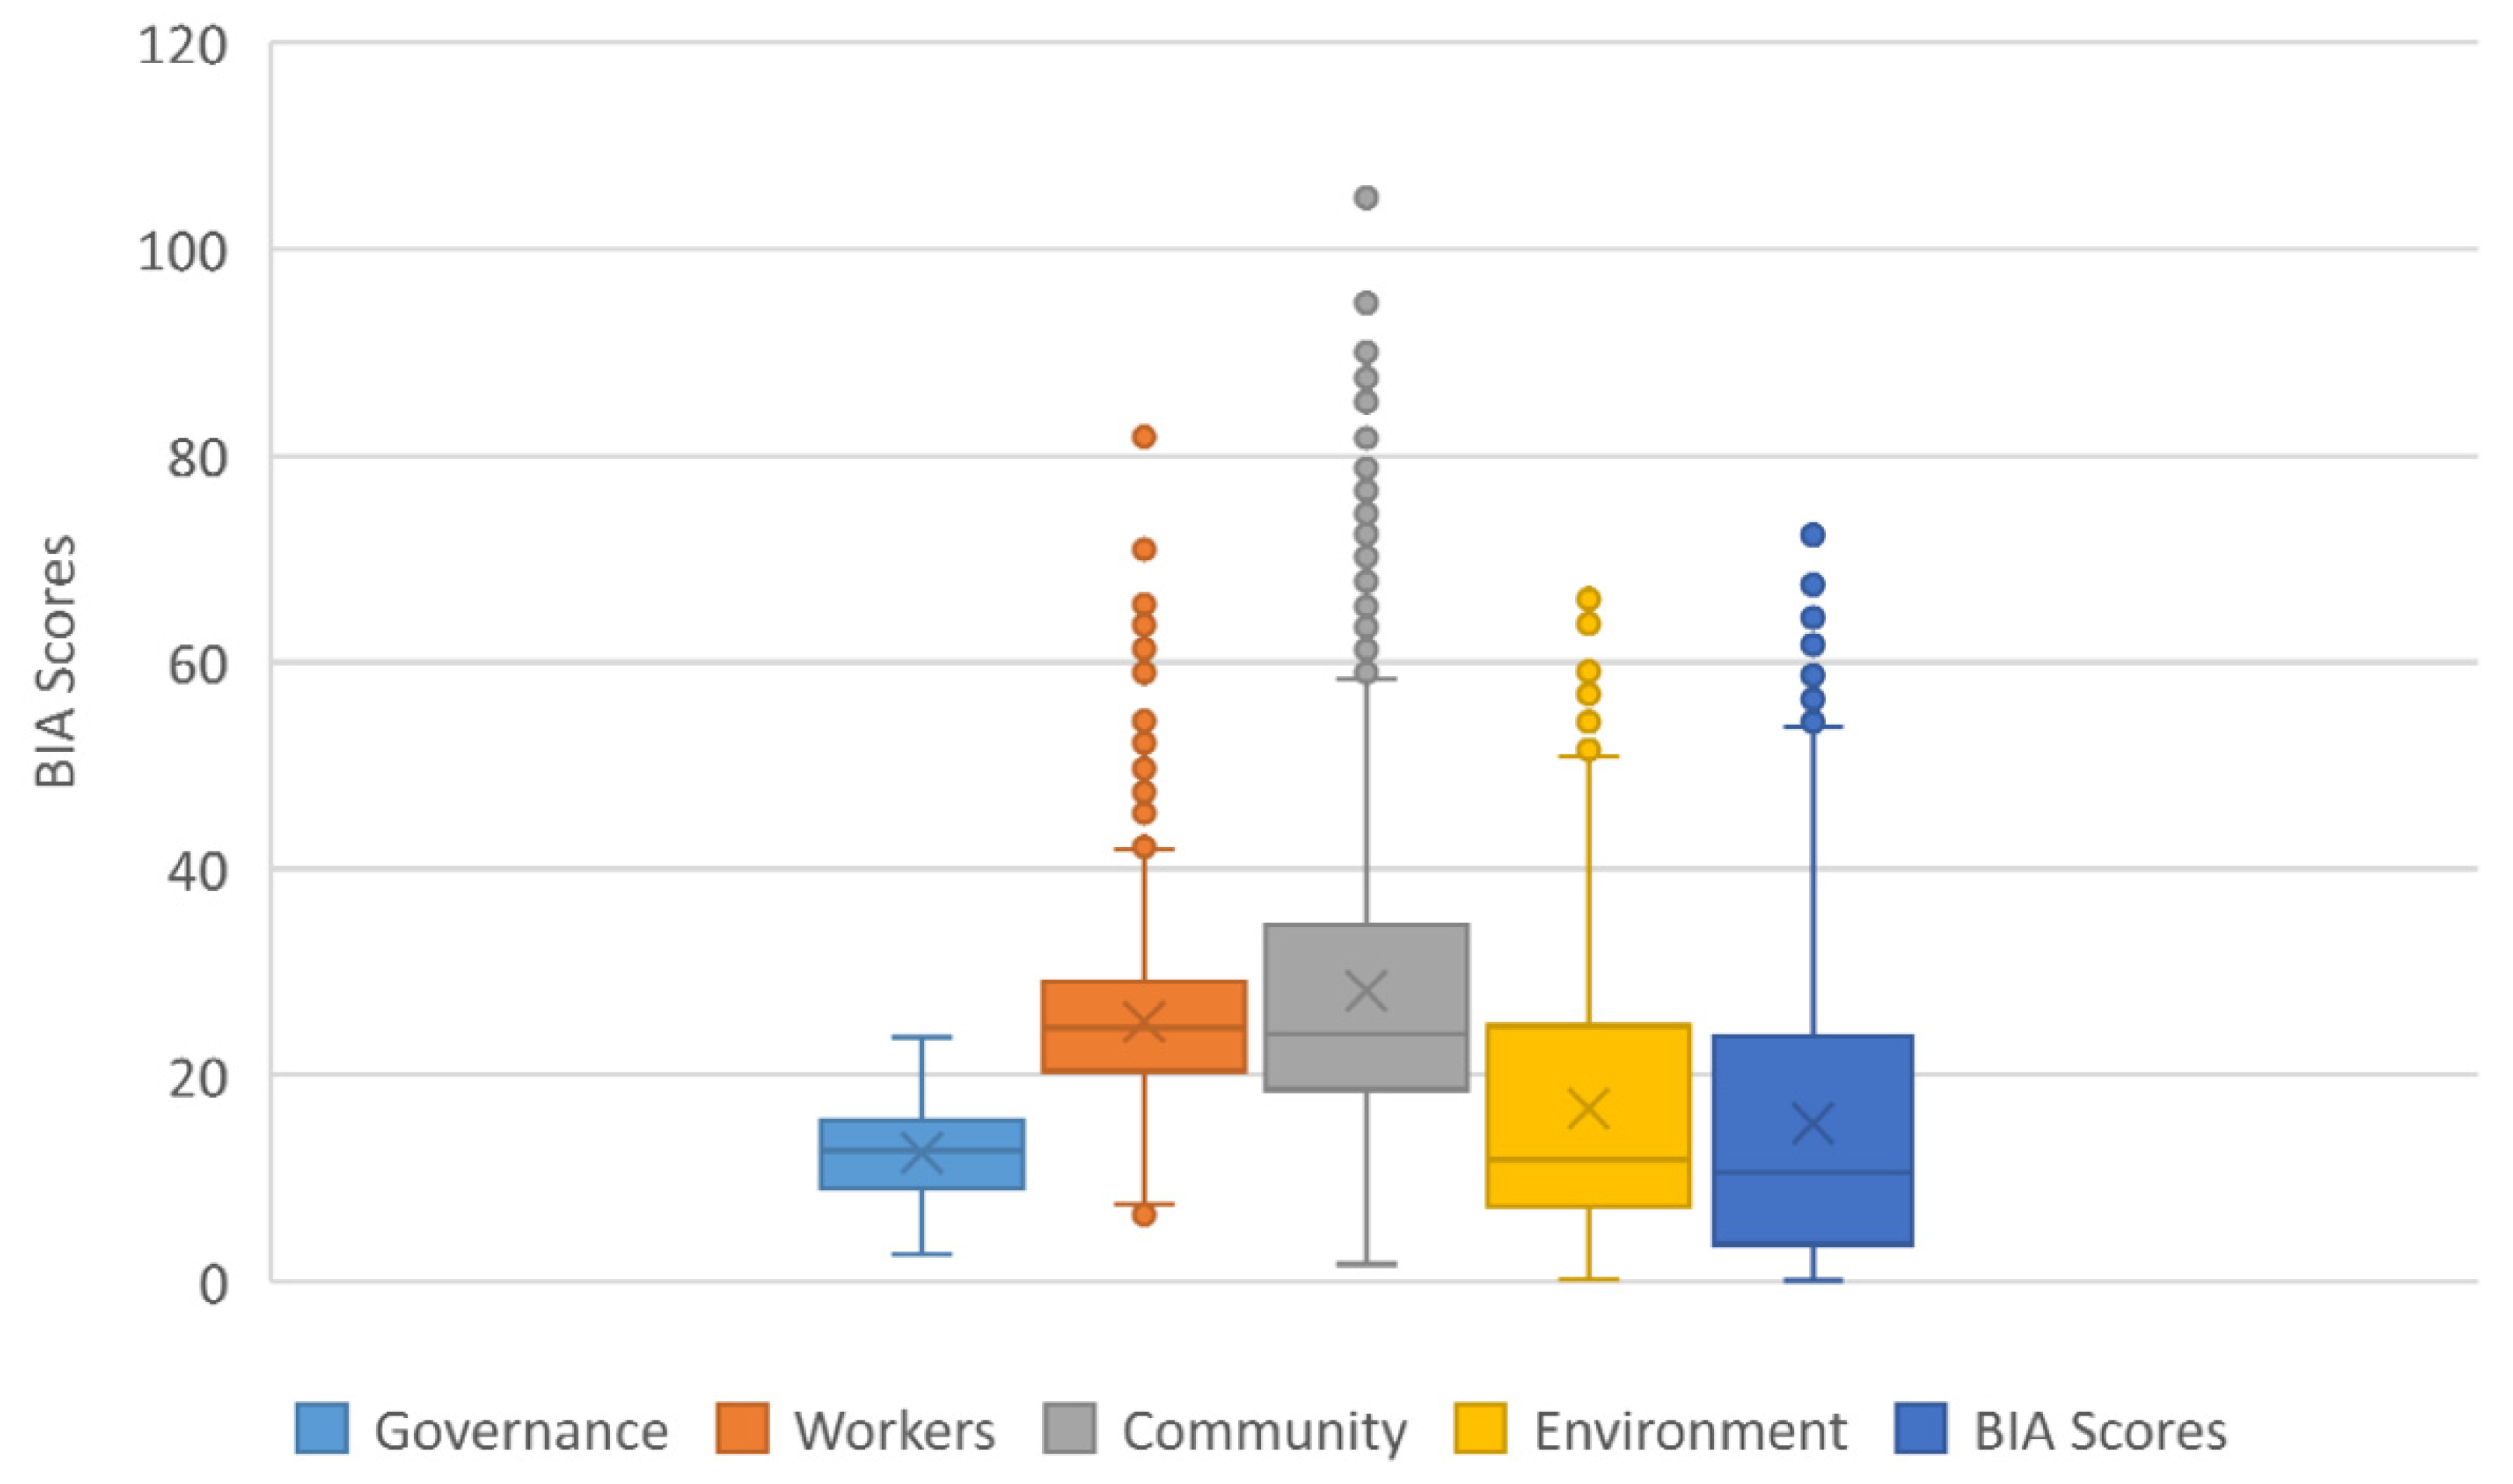
The BIA indicators have different dispersions that result from the indicators’ use of different scales (see Figure 2). For example, the workers indicator presents the highest median value and the community indicator the highest score. In general, all the BIA indicators present a significant dispersion of the data, except for the governance indicator, which exhibits a higher concentration of the data.
Community is the evaluation B indicator with the highest number of discrepant values, followed by employees, customers, and the environment. Although there is a minimum final value for companies to obtain certification, it appears from the data analyzed that B Corp does not define an evaluation scale for its auditing process.
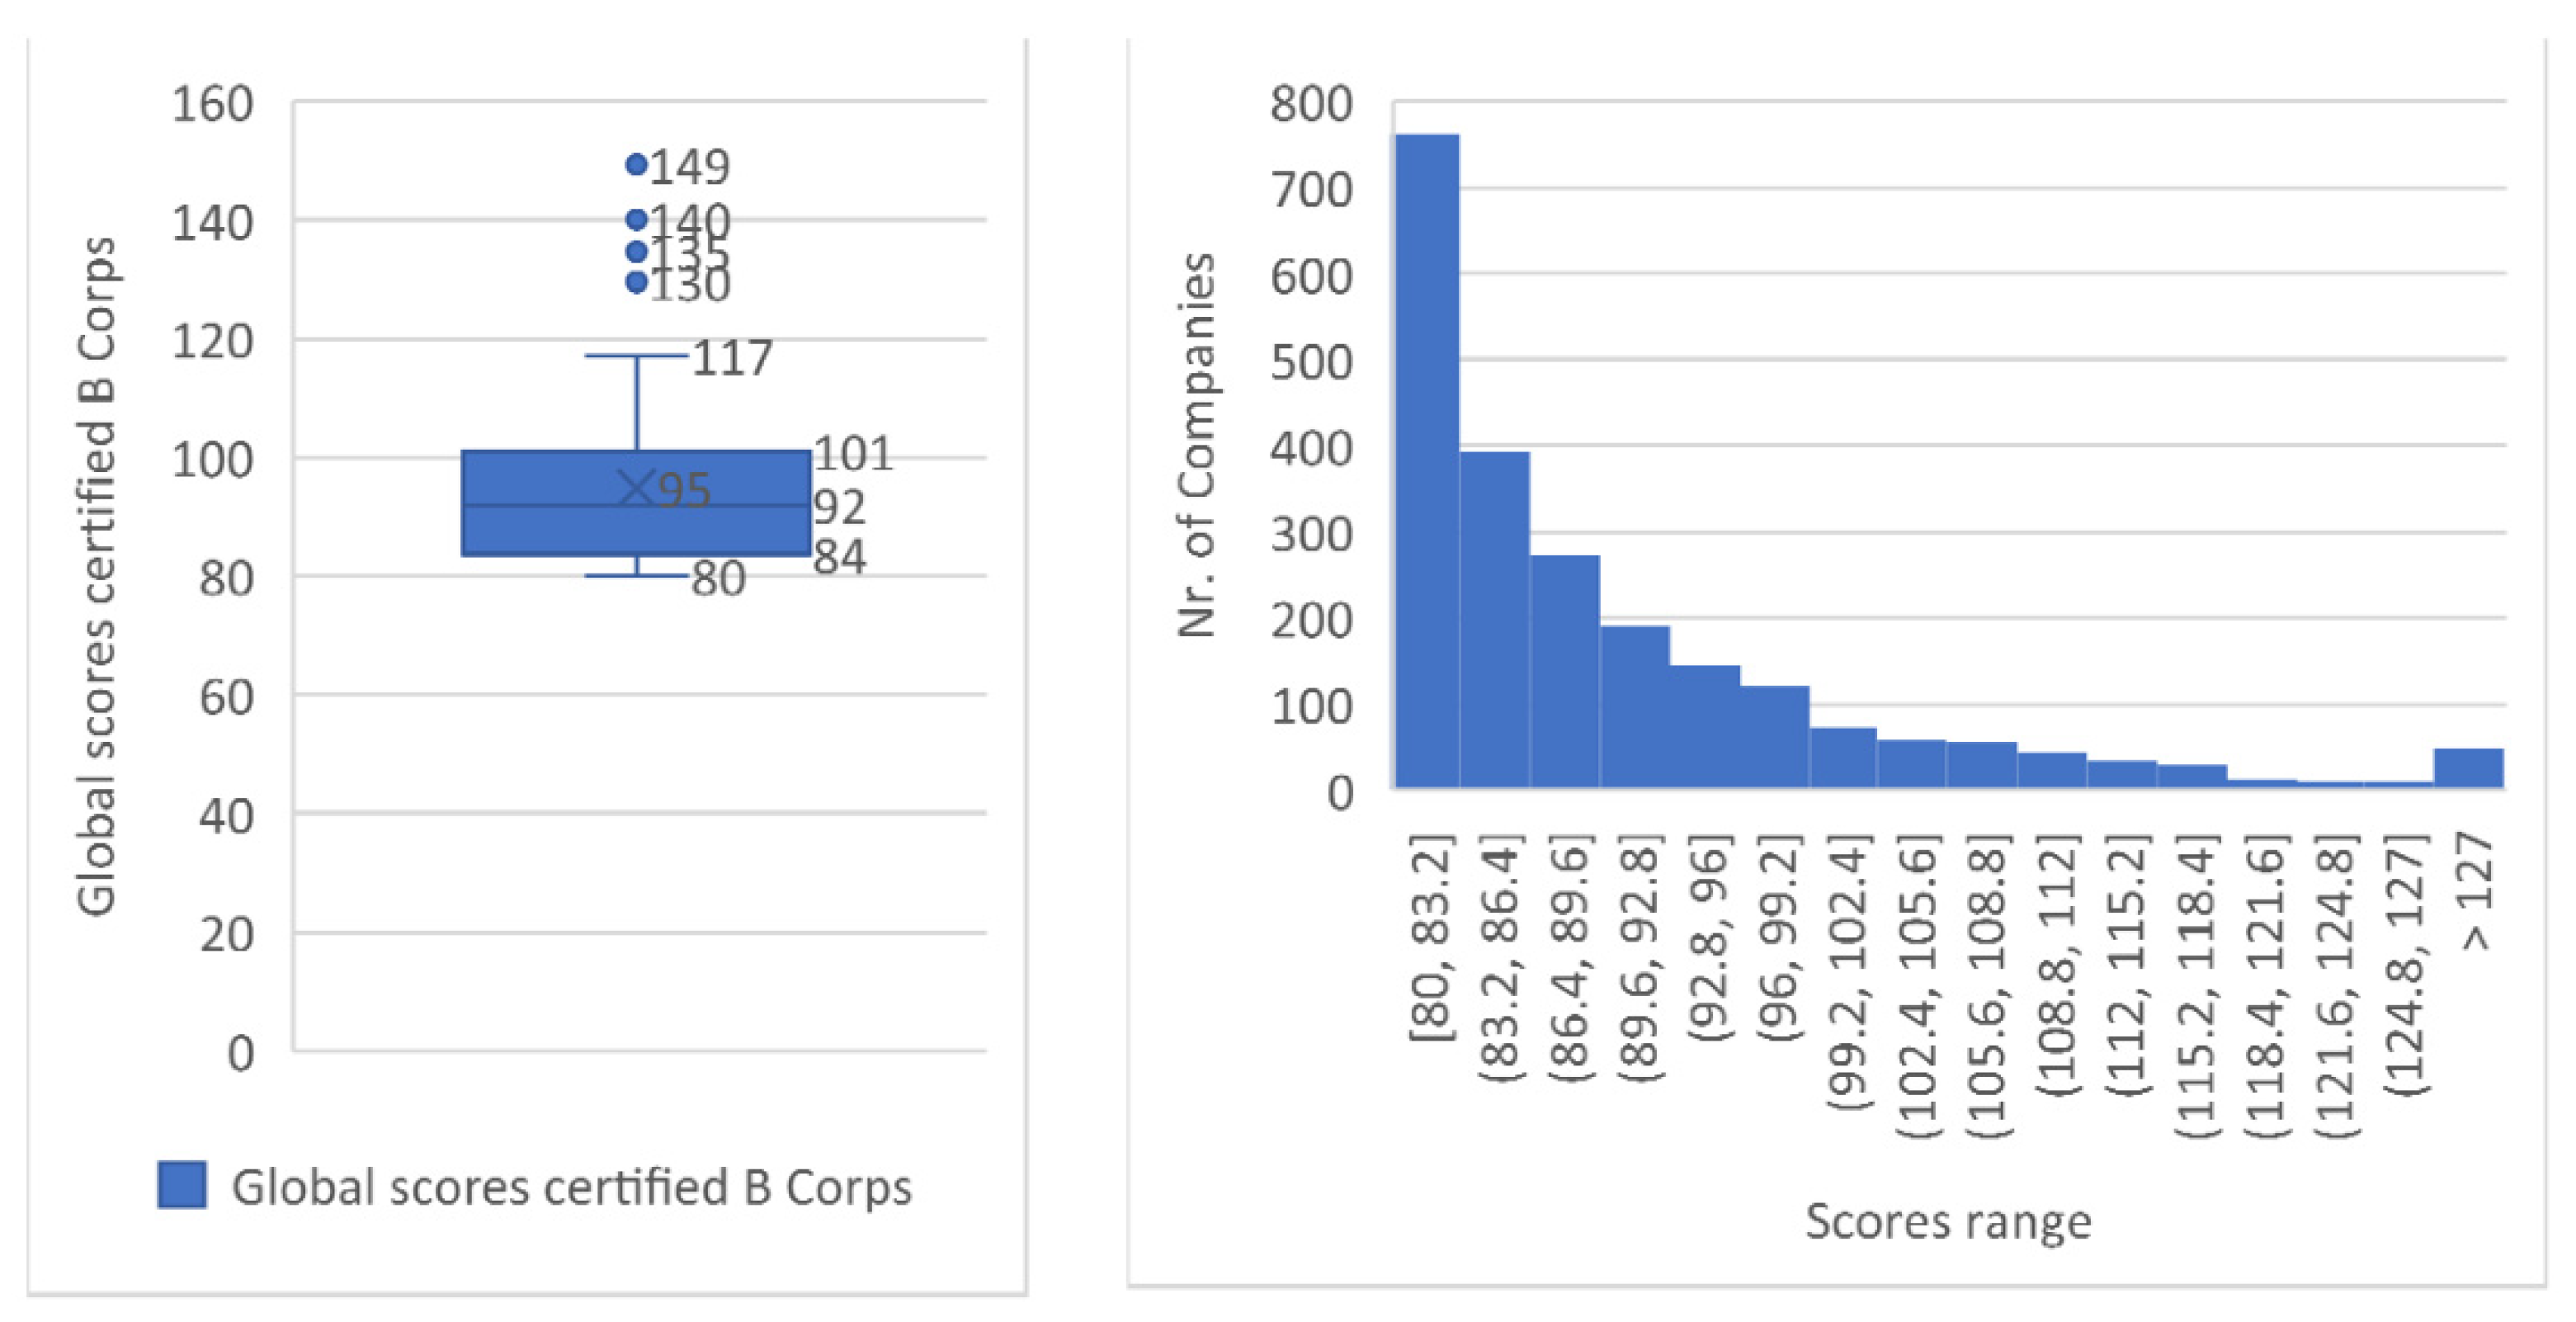
The data analyzed also allows us to generally verify the distribution of the final scores of the certified B companies (see Figure 3).
As represented in the BIA final score chart above, all companies in our sample meet the minimum requirement of 80 points for B Corp certification, and most companies achieve a score between (80–83).
The countries with the highest number of certifications during our sample period are the United States with 681 companies, followed by the United Kingdom with 303 certified companies. Australia and Canada had 171 certifications during the same period. In Europe, besides the United Kingdom as mentioned above, France and Italy stand out with 87 certifications each. Portugal had 10 certifications during the period under observation.
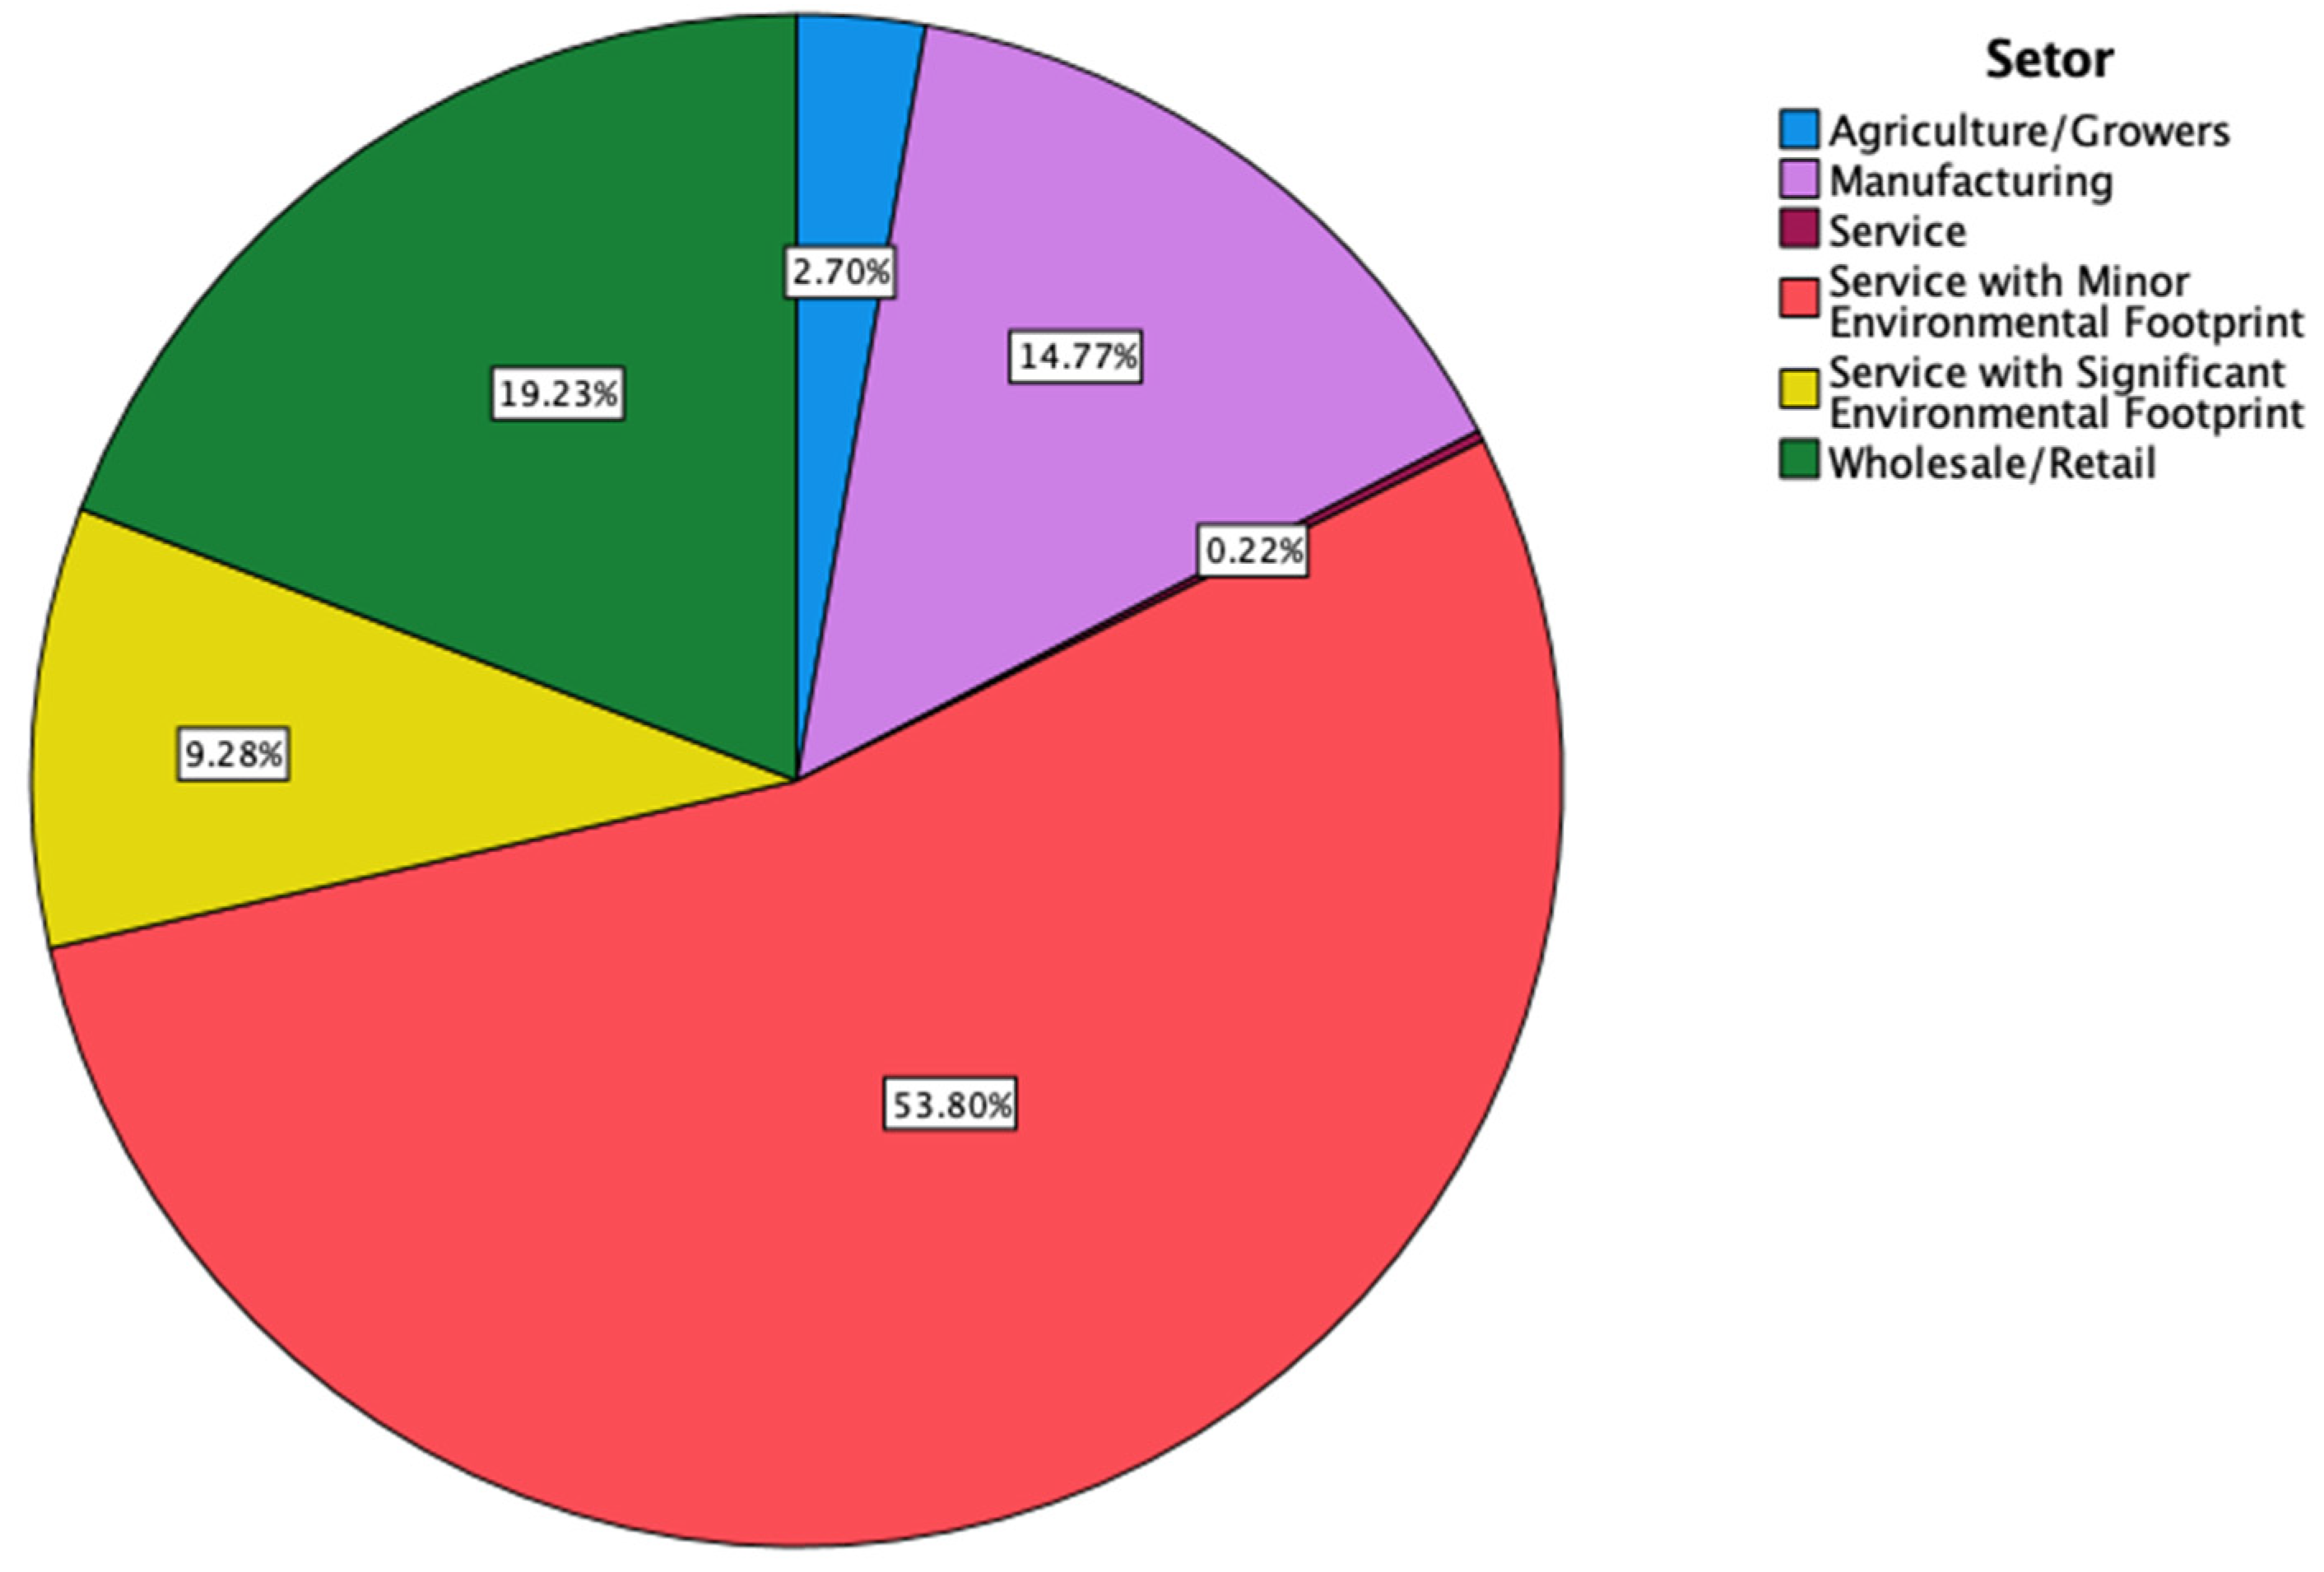
In terms of the activity sector, organizations in the services sector with a minor ecological footprint predominate. The sectoral distribution of the B Corporation can be seen in Figure 4.

4.2. B Impact Assessment—Measurement Model Validation

As mentioned above, for reasons of data consistency and elimination of missing values, we reduced the initial sample to 556 cases, corresponding to companies certified in the period from January 2020 to March 2021. In 
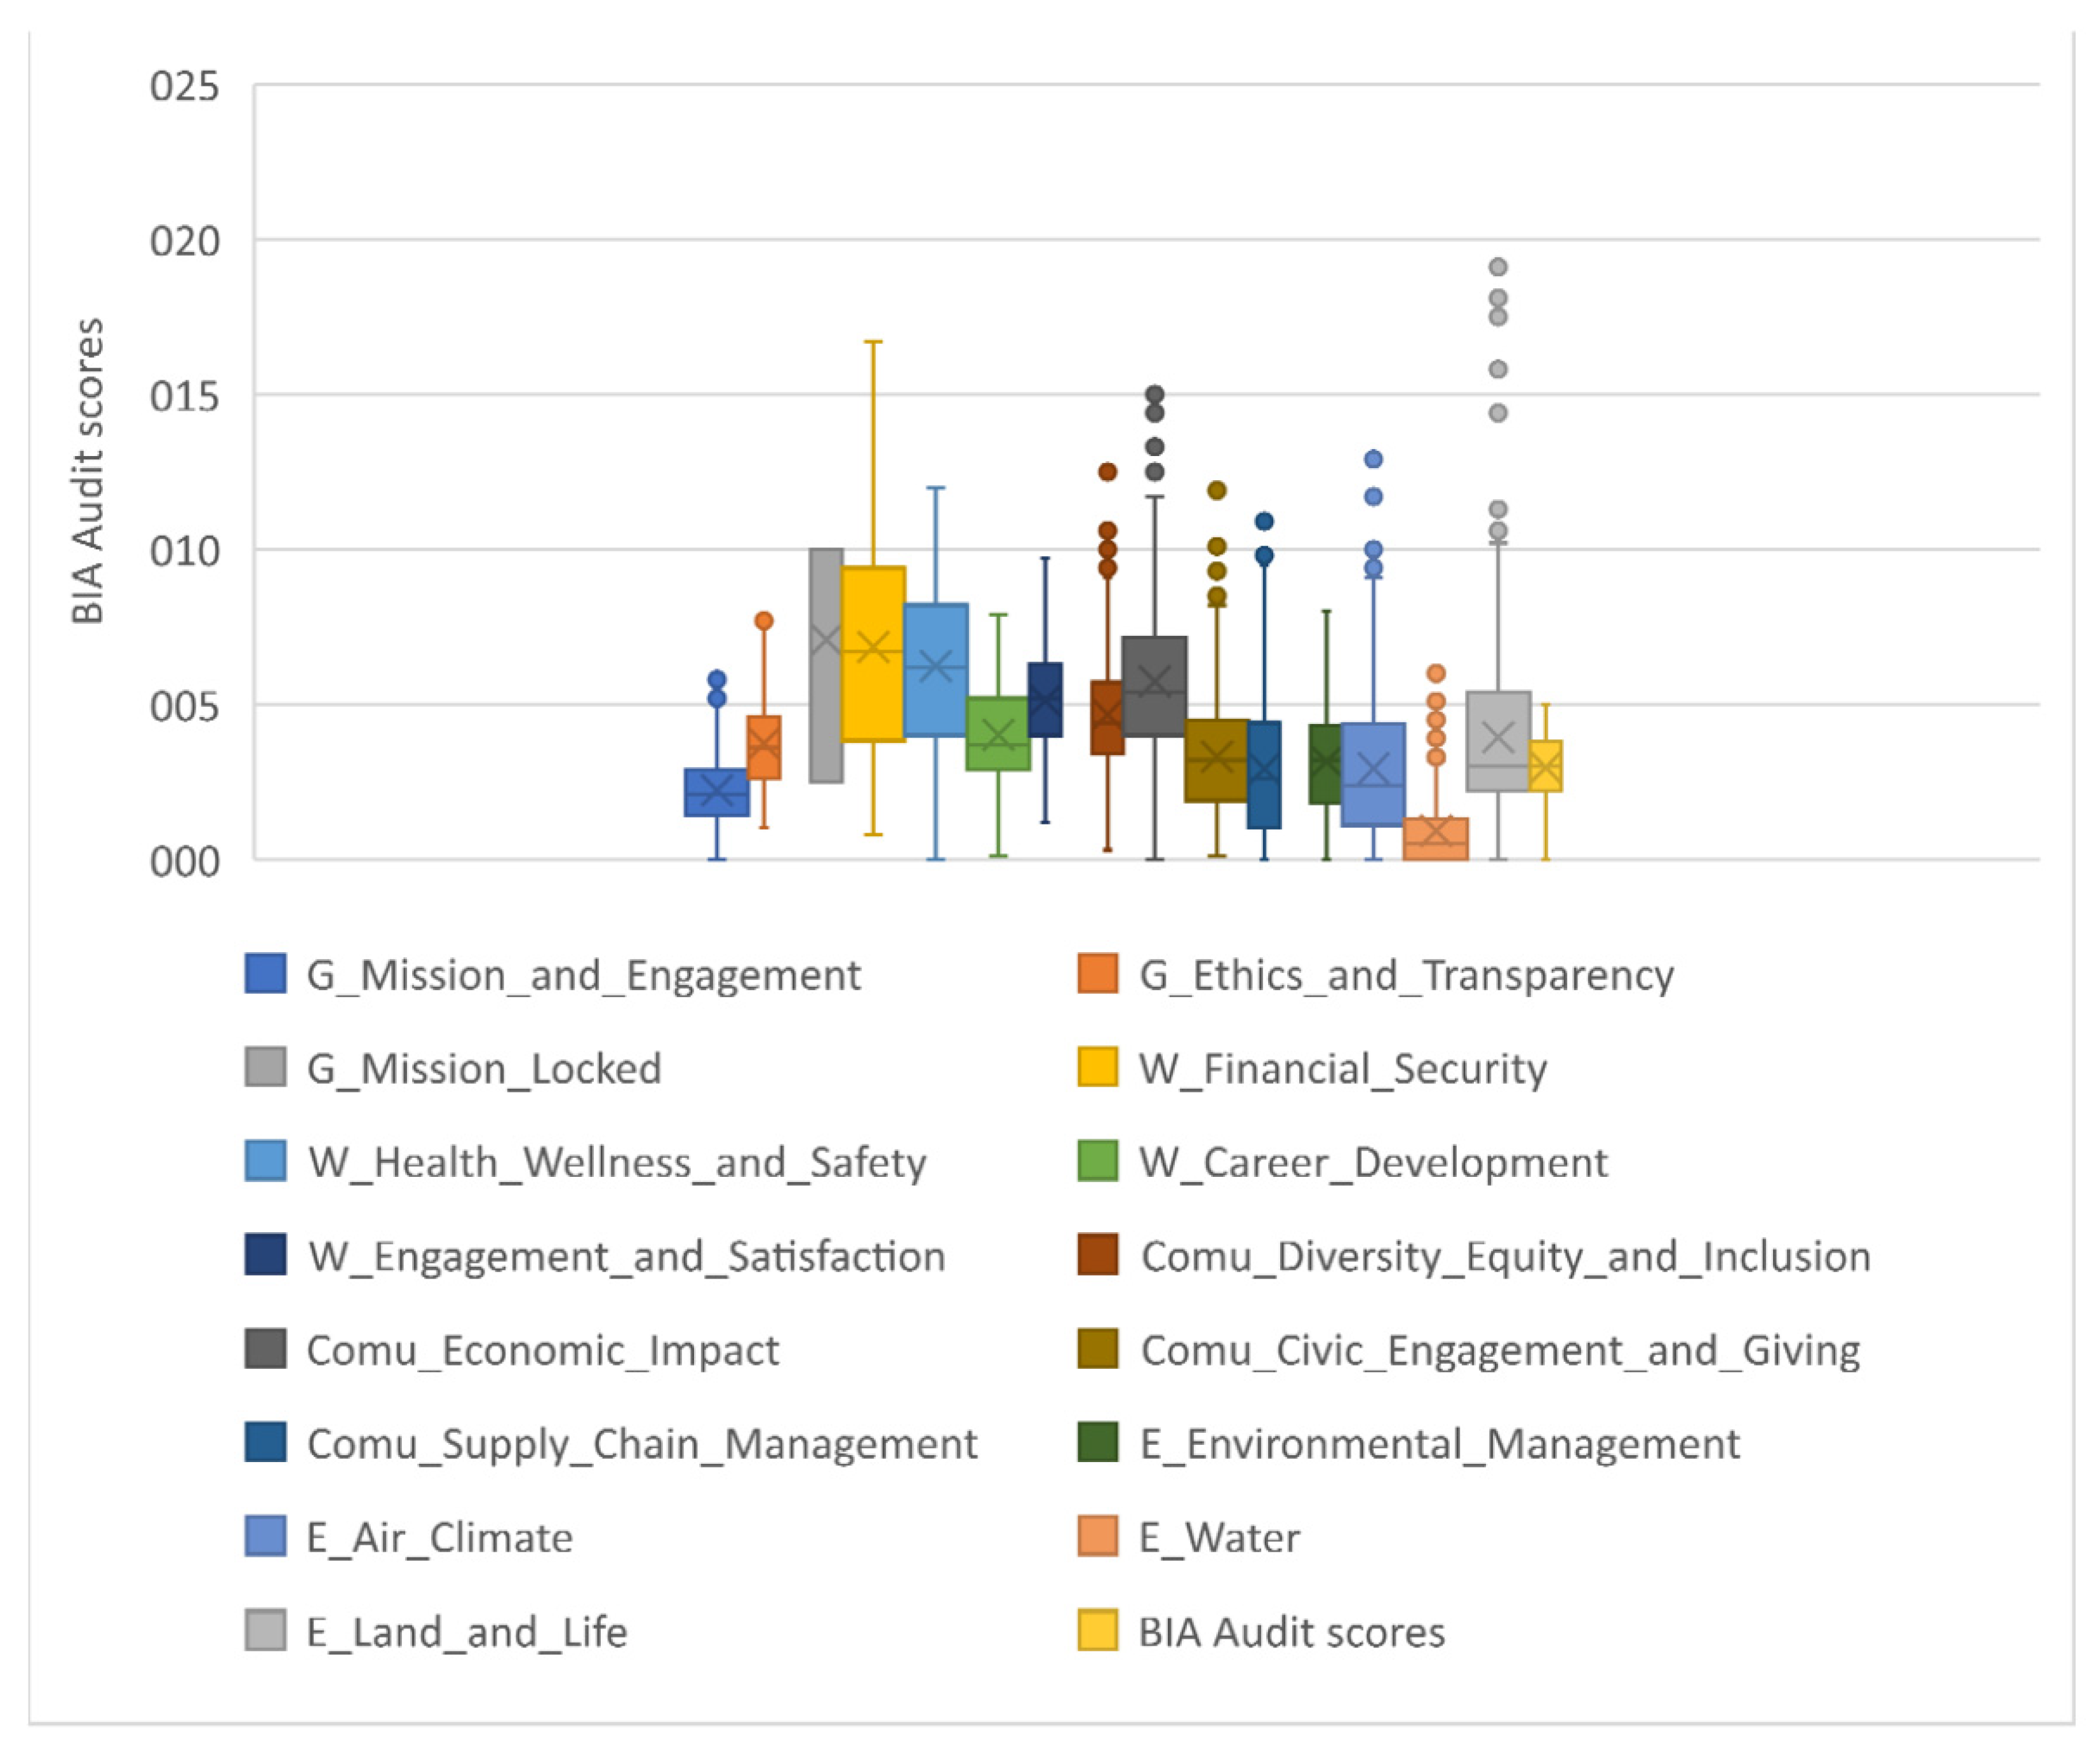
Figure 5, we analyze the dispersion and median values of the observed variables present in this reduced sample.
The variable with the highest data dispersion is “Land and Life” from the environment indicator. The graph below shows that the audit B variables with a greater range of values are from community and environment indicators. The analysis of the “Mission locked” variable leads us to assume that a fixed rating scale with constant values is used to evaluate this item.
Since Figure 5 shows a high dispersion of the data, an analysis of extreme values was performed. Extreme values are “observations with a unique combination of characteristics identifiable as distinctly different from other observations” [43] (p. 64). Usually, an extreme value is an observation that presents an unusually high or low value.
To determine extreme values, we use univariate and multivariate detection methods:
(i) In terms of univariate analysis, we consider as an extreme value any observation with a value higher than Q3 + 1.5 × (Q3 − Q1) or lower than Q1 − 1.5 × (Q3 − Q1), where Q3 and Q1 represent quartiles 3 and 1, respectively [44]. When this proportion exceeds 5%, the impact on descriptive statistics is analyzed.
(ii) Concerning multivariate analysis, we used the Mahalanobis distance (D2), which performs a multivariate assessment of each observation across a set of variables [43,44]. For large samples, an observation with a value greater than three when dividing the Mahalanobis distance (D2) by the degrees of freedom (df) is considered a possible multidimensional extreme value [43].
Table 3 presents univariate extreme values analysis.
The variable water presents a percentage of extreme values higher than 5%. After analyzing the descriptive measures with and without extreme values (see Table 4), the 34 observations were removed, since the differences are significant.
Subsequently, the Mahalanobis distance (D2) was calculated considering 15 degrees of freedom (16 observed variables minus 1). As can be seen in Table 5, there are two multivariate extreme values in the database.
For the validation of the measurement model, composed of four latent variables (governance, workers, community, and environment) and one observed variable (customer stewardship), a database of 520 companies was considered.
The five variables of the measurement model are intercorrelated. The four latent variables are measured through fifteen observed variables, and errors of measurement associated with each observed variable (e1–e15) are uncorrelated. Since latent variables are unobserved, their metric scale must be guaranteed by observed variables by setting at least one path coefficient of an observed variable or by setting the variance of the latent variable [43]. We have chosen to standardize the latent variables, setting their variance at 1.
There are several methods for adjusting measurement models. In this research, the maximum likelihood method was chosen. This method provides centered and consistent estimates and is assumed to be robust when the violation of the multivariate normality assumption of the manifest variables occurs [43].
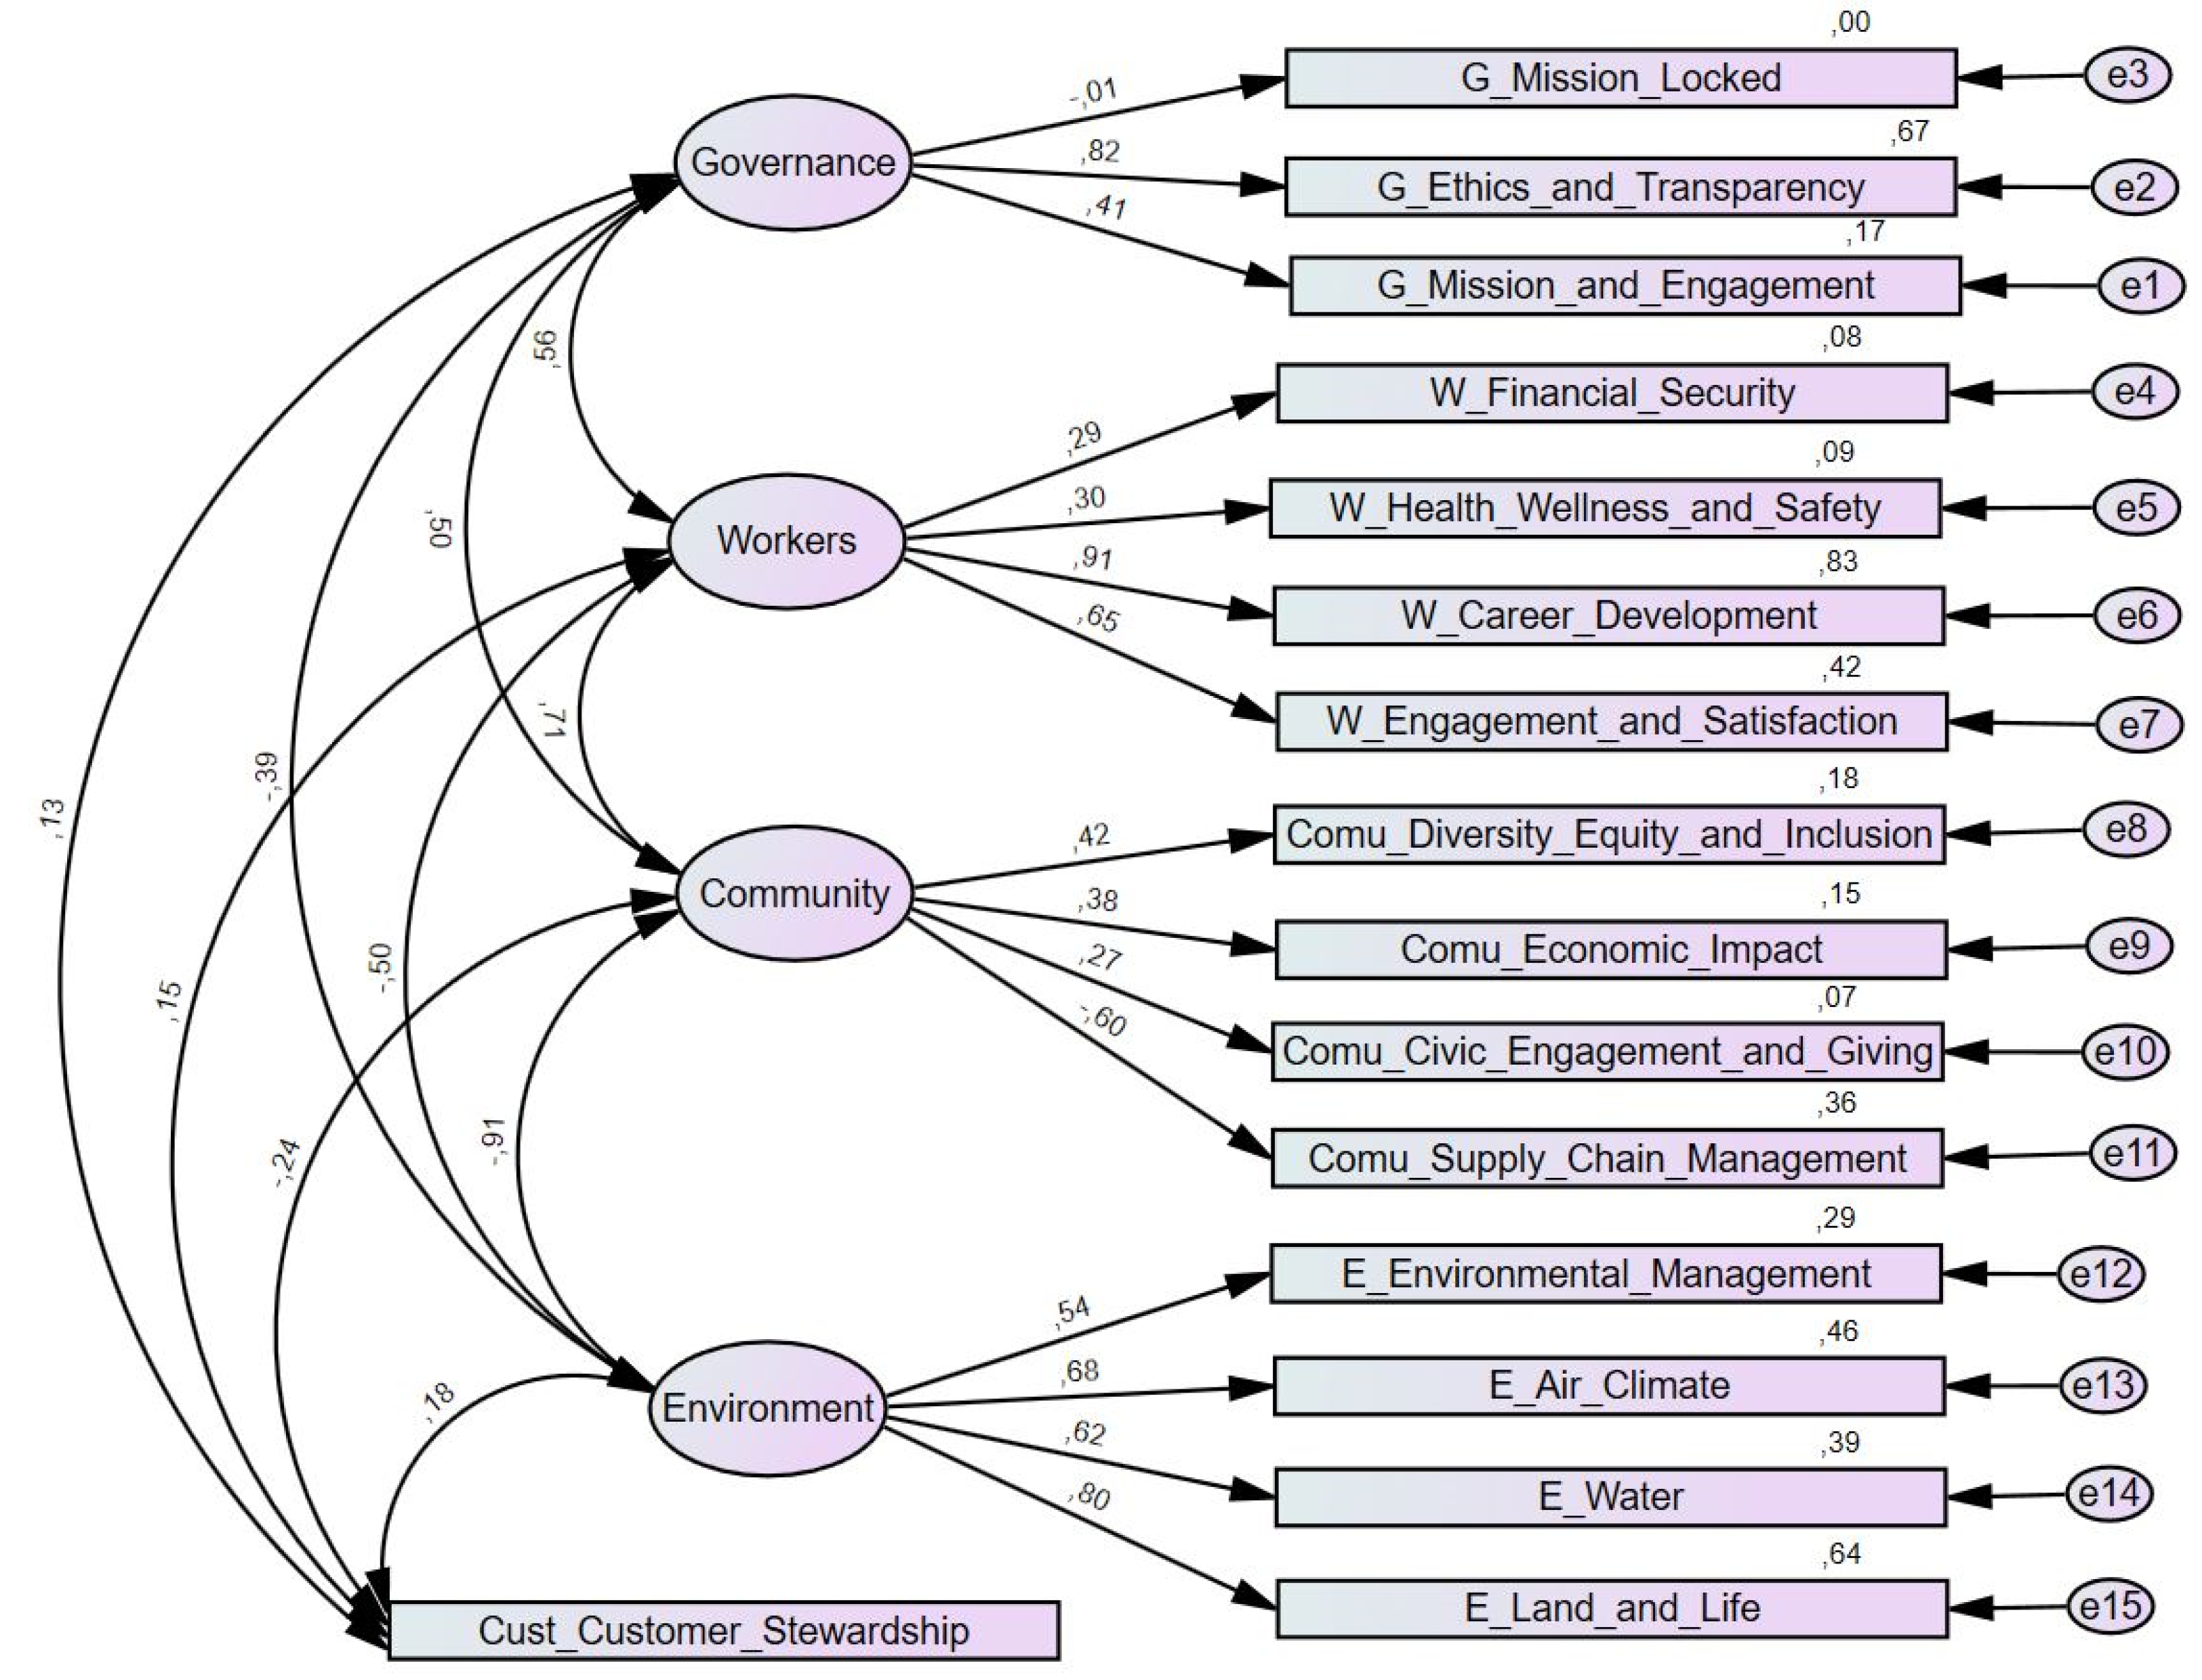
Figure 6 presents the measurement model adjusted to a sample of 520 firms, including the values of the standardized factor weights and the individual reliability of each of the observed variables.
A summary table of regression weights with standardized coefficients and statistic tests for each of the observed variables of the B Impact Assessment is presented in Table 6.
Of all the variables observed, those that do not seem to contribute positively to the model due to the standardized factor weights are “mission locked” from the governance indicator and “supply chain management” from the community indicator. The negative standard coefficient shown in the model (see Figure 6 and Table 6) suggests that as the observed variable increases, the latent variable tends to decrease. All standardized estimates calculated are below 1.0. The governance indicator is reflected essentially in the observed variable “ethics and transparency,” the workers indicator in the variable “career development,” the community indicator in the variable “diversity equity and inclusion” and, finally, the environment indicator in the variable “land and life.”
We then proceeded to evaluate the measurement model as a whole, using the adjustment indices (see Table 7). This analysis determines the goodness-of-fit between the hypothesized model and the sample data. The chi-square statistic with the respective degrees of freedom and the CFI and RMSEA indices are the most reported in the literature [46]. Additionally, the TLI index also stands out among other indices, with some incidence.
The CMIN/DF (chi-square/degree of freedom) is an absolute index that evaluates the quality of the model per se, without comparison with other models [44]. The CFI and TLI are relative indices of fit, since they assess the quality of the model relative to the model with the worst possible fit (independence model, in which there are no relationships between the observed variables) and/or the model with the best possible fit (saturated model, in which all the observed variables are correlated) [44]. Finally, RMSEA is a population discrepancy index that compares the model fit obtained with sample measures (sample means and variances) to the model fit that would be obtained with population measures (population means and variances) [44].
Table 7 presents the values obtained in the adjustment indices and the reference values referred to in the literature to consider a model with a good fit. In addition, the analyzed data allow us to verify that the BIA measurement model is outside the adjustment parameters, revealing an inferior quality of adjustment to the sample.
The variables “mission locked” from the governance indicator and “supply chain management” from the community indicator were eliminated to improve the model fit. Additionally, the modification indices were used, considering that values greater than 11 (p < 0.001) indicate local adjustment problems (see Table 8).
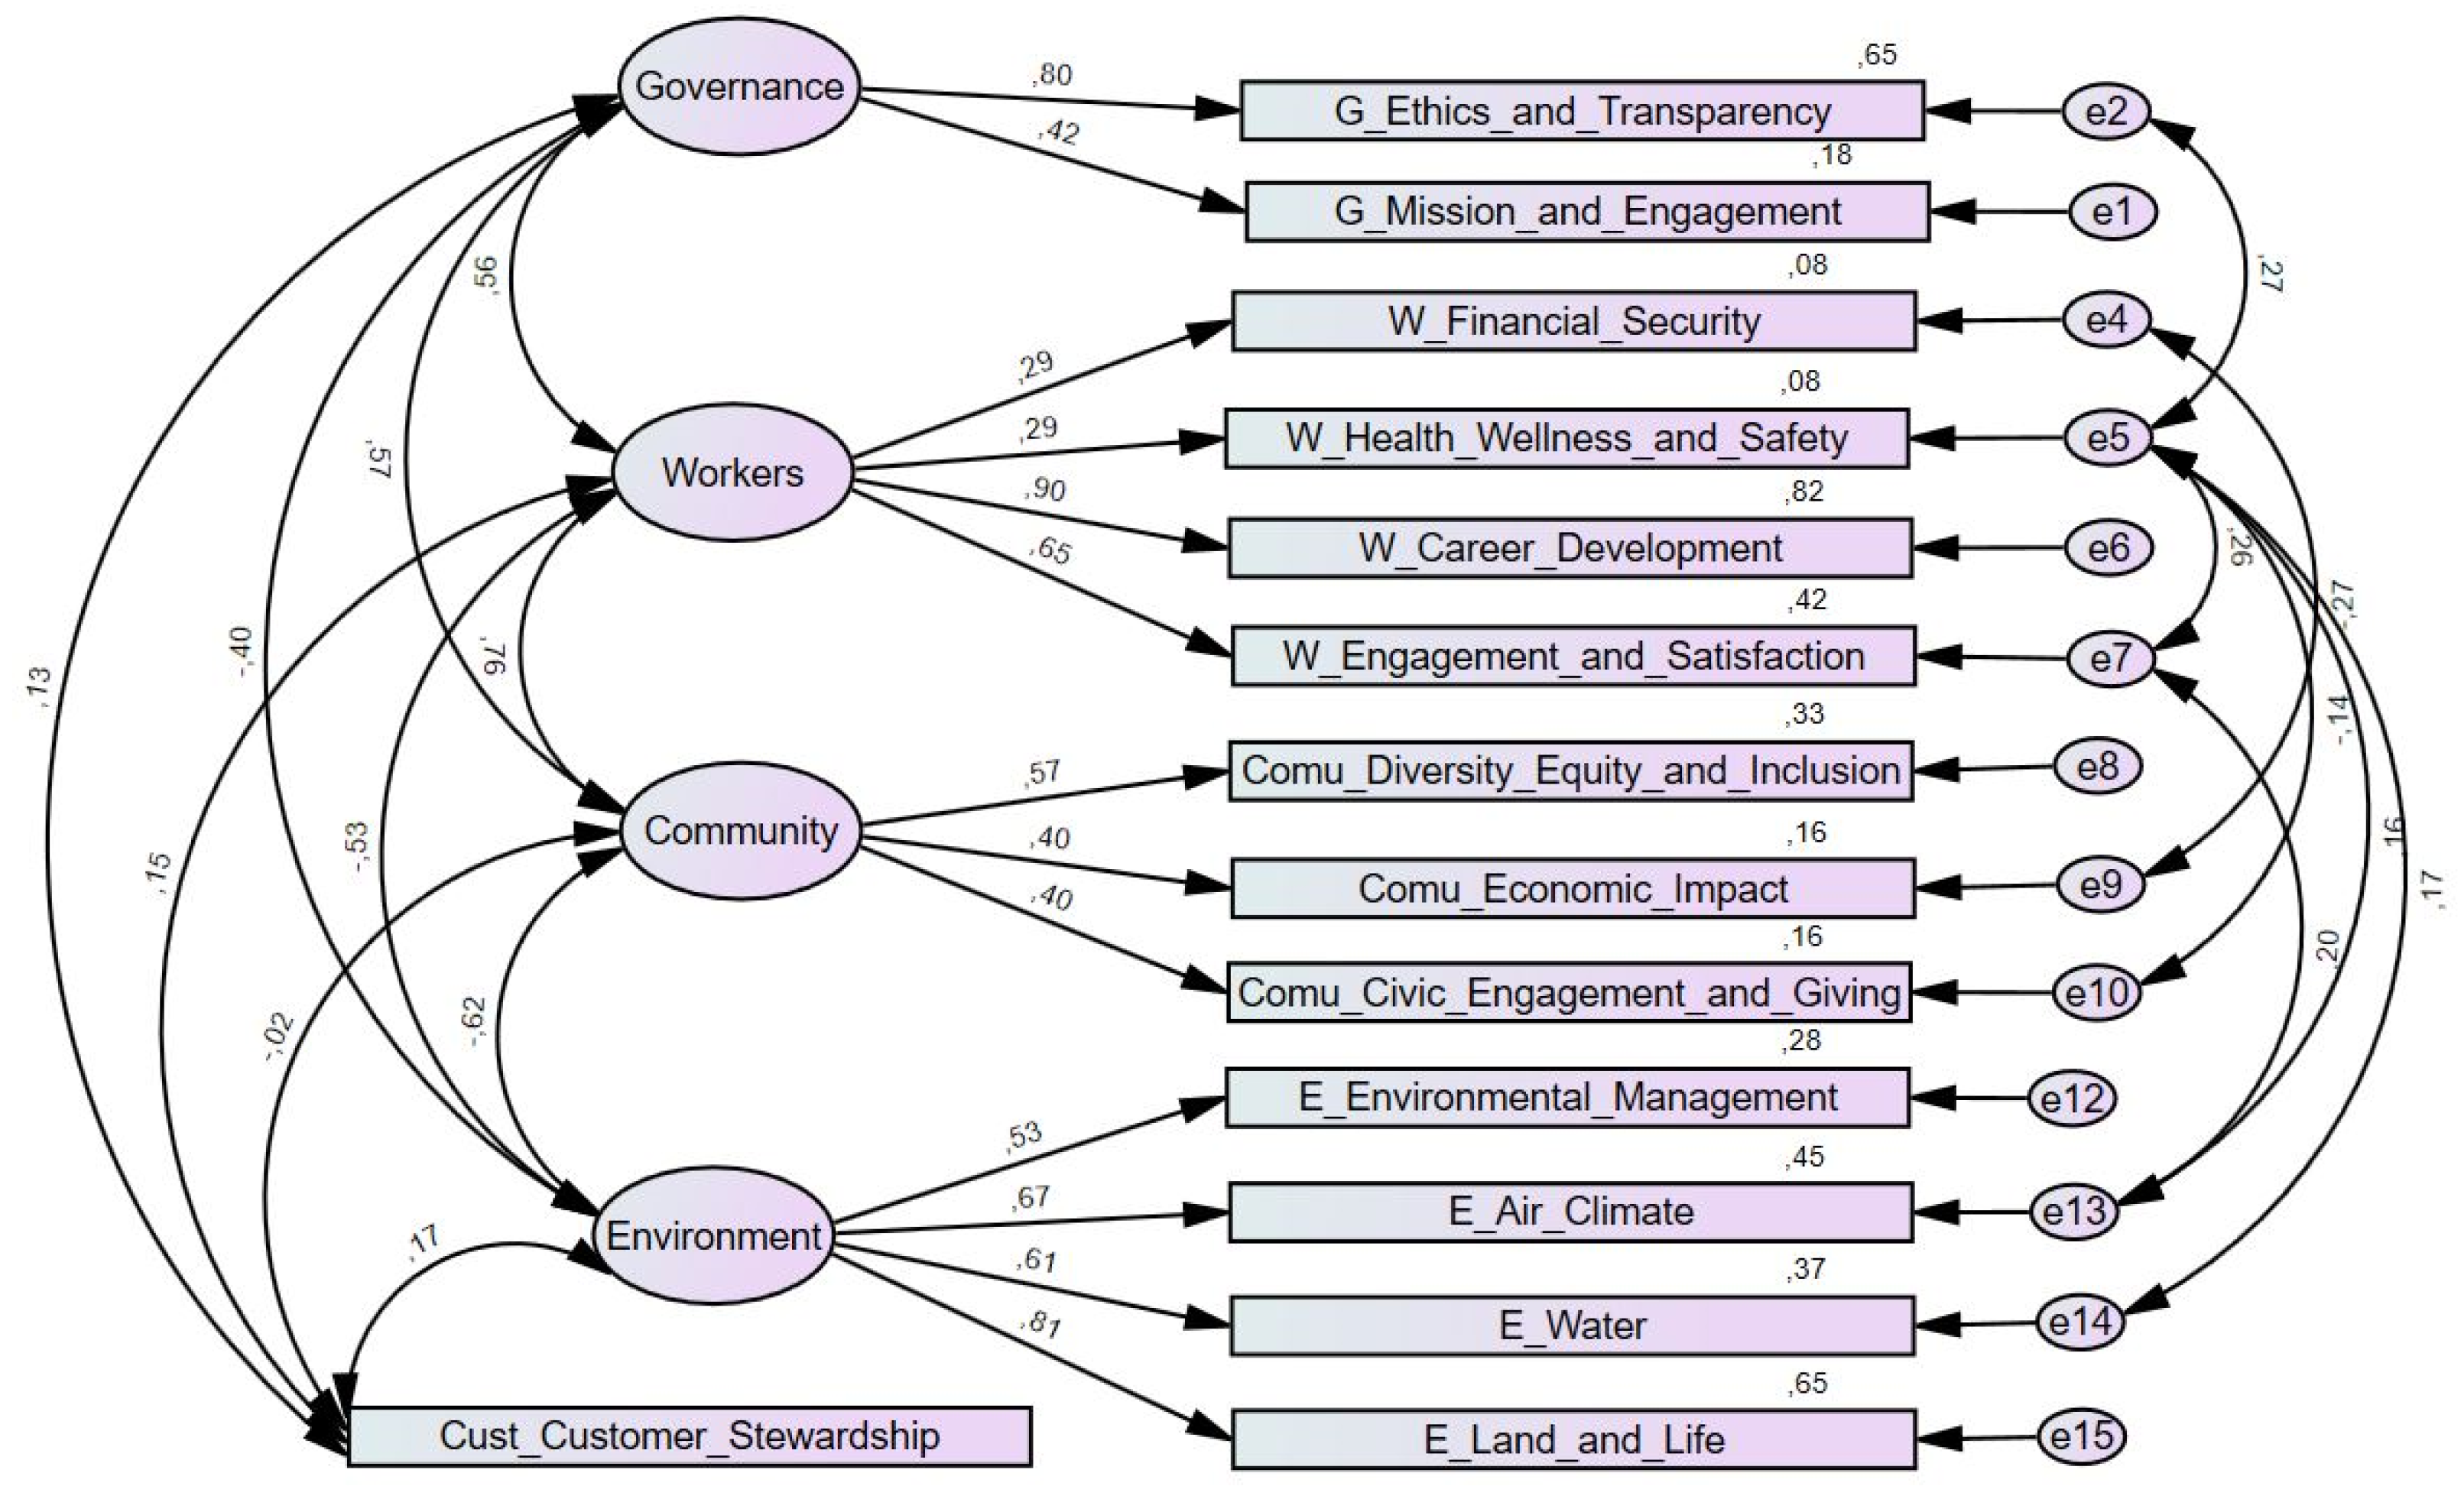
After assessing the theoretical plausibility of the modifications, the measurement errors were correlated, which led to a considerable improvement in the adjustment of the measurement model (see Figure 7 and Table 9).
These modifications improved the adjustment of the BIA model, especially regarding the CFI and RMSEA indices. The remaining indices (CMIN/DF and TLI) reveal a sufferable fit of the model to data (see Table 9).
As explained in the method section, one of the fundamental assumptions of confirmatory factor analysis is data normality [43]. When the normality assumption is verified, the maximum likelihood method exhibits properties of consistency, asymptotic efficiency, and asymptotic null bias [44]. The univariate and multivariate normality analysis is shown in Table 10.
According to [44], the normality assessment should be made through the analysis of the asymmetry (Sk), kurtosis (Ku), and multivariate kurtosis (KuMult) values. In confirmatory factorial analysis, we can assume that there is a severe violation of normality whenever |Sk| > 2–3, |Ku| > 7–10 and |KuMult| > 10 [44,47]. Only in an extreme scenario of violation of normality are the quality of the adjustment indices and parameter estimates questionable [44].
In this context, the variables fulfil the assumption of univariate and multivariate normality (skew values less than or equal to 1.3; kurtosis values less than or equal to 1 and multivariate kurtosis equal to 3.088).
Another aspect to consider in confirmatory factor analysis is the construct’s reliability. Reliability is a measure of internal consistency, i.e., it measures the degree to which the different observed variables analyze the same aspect. Cronbach’s alpha was used to determine the reliability of the latent variables, since it is one of the most commonly used measures to check the internal consistency of a set of items (see Table 11).
Cronbach’s alpha ranges between 0 and 1, and it is acceptable to aggregate items with a value greater than 0.6 [49]. However, as we can see, the latent variables present reliability problems since the values obtained for Cronbach’s alpha are lower than 0.6, except for the “environment” variable, which presents a higher value (0.723). These reliability problems of the latent variables lead us to conclude that the B Impact Assessment model, as a measurement tool used by B Labs to assess companies’ social and environmental impact, may not always give the same results when applied to structurally similar companies.
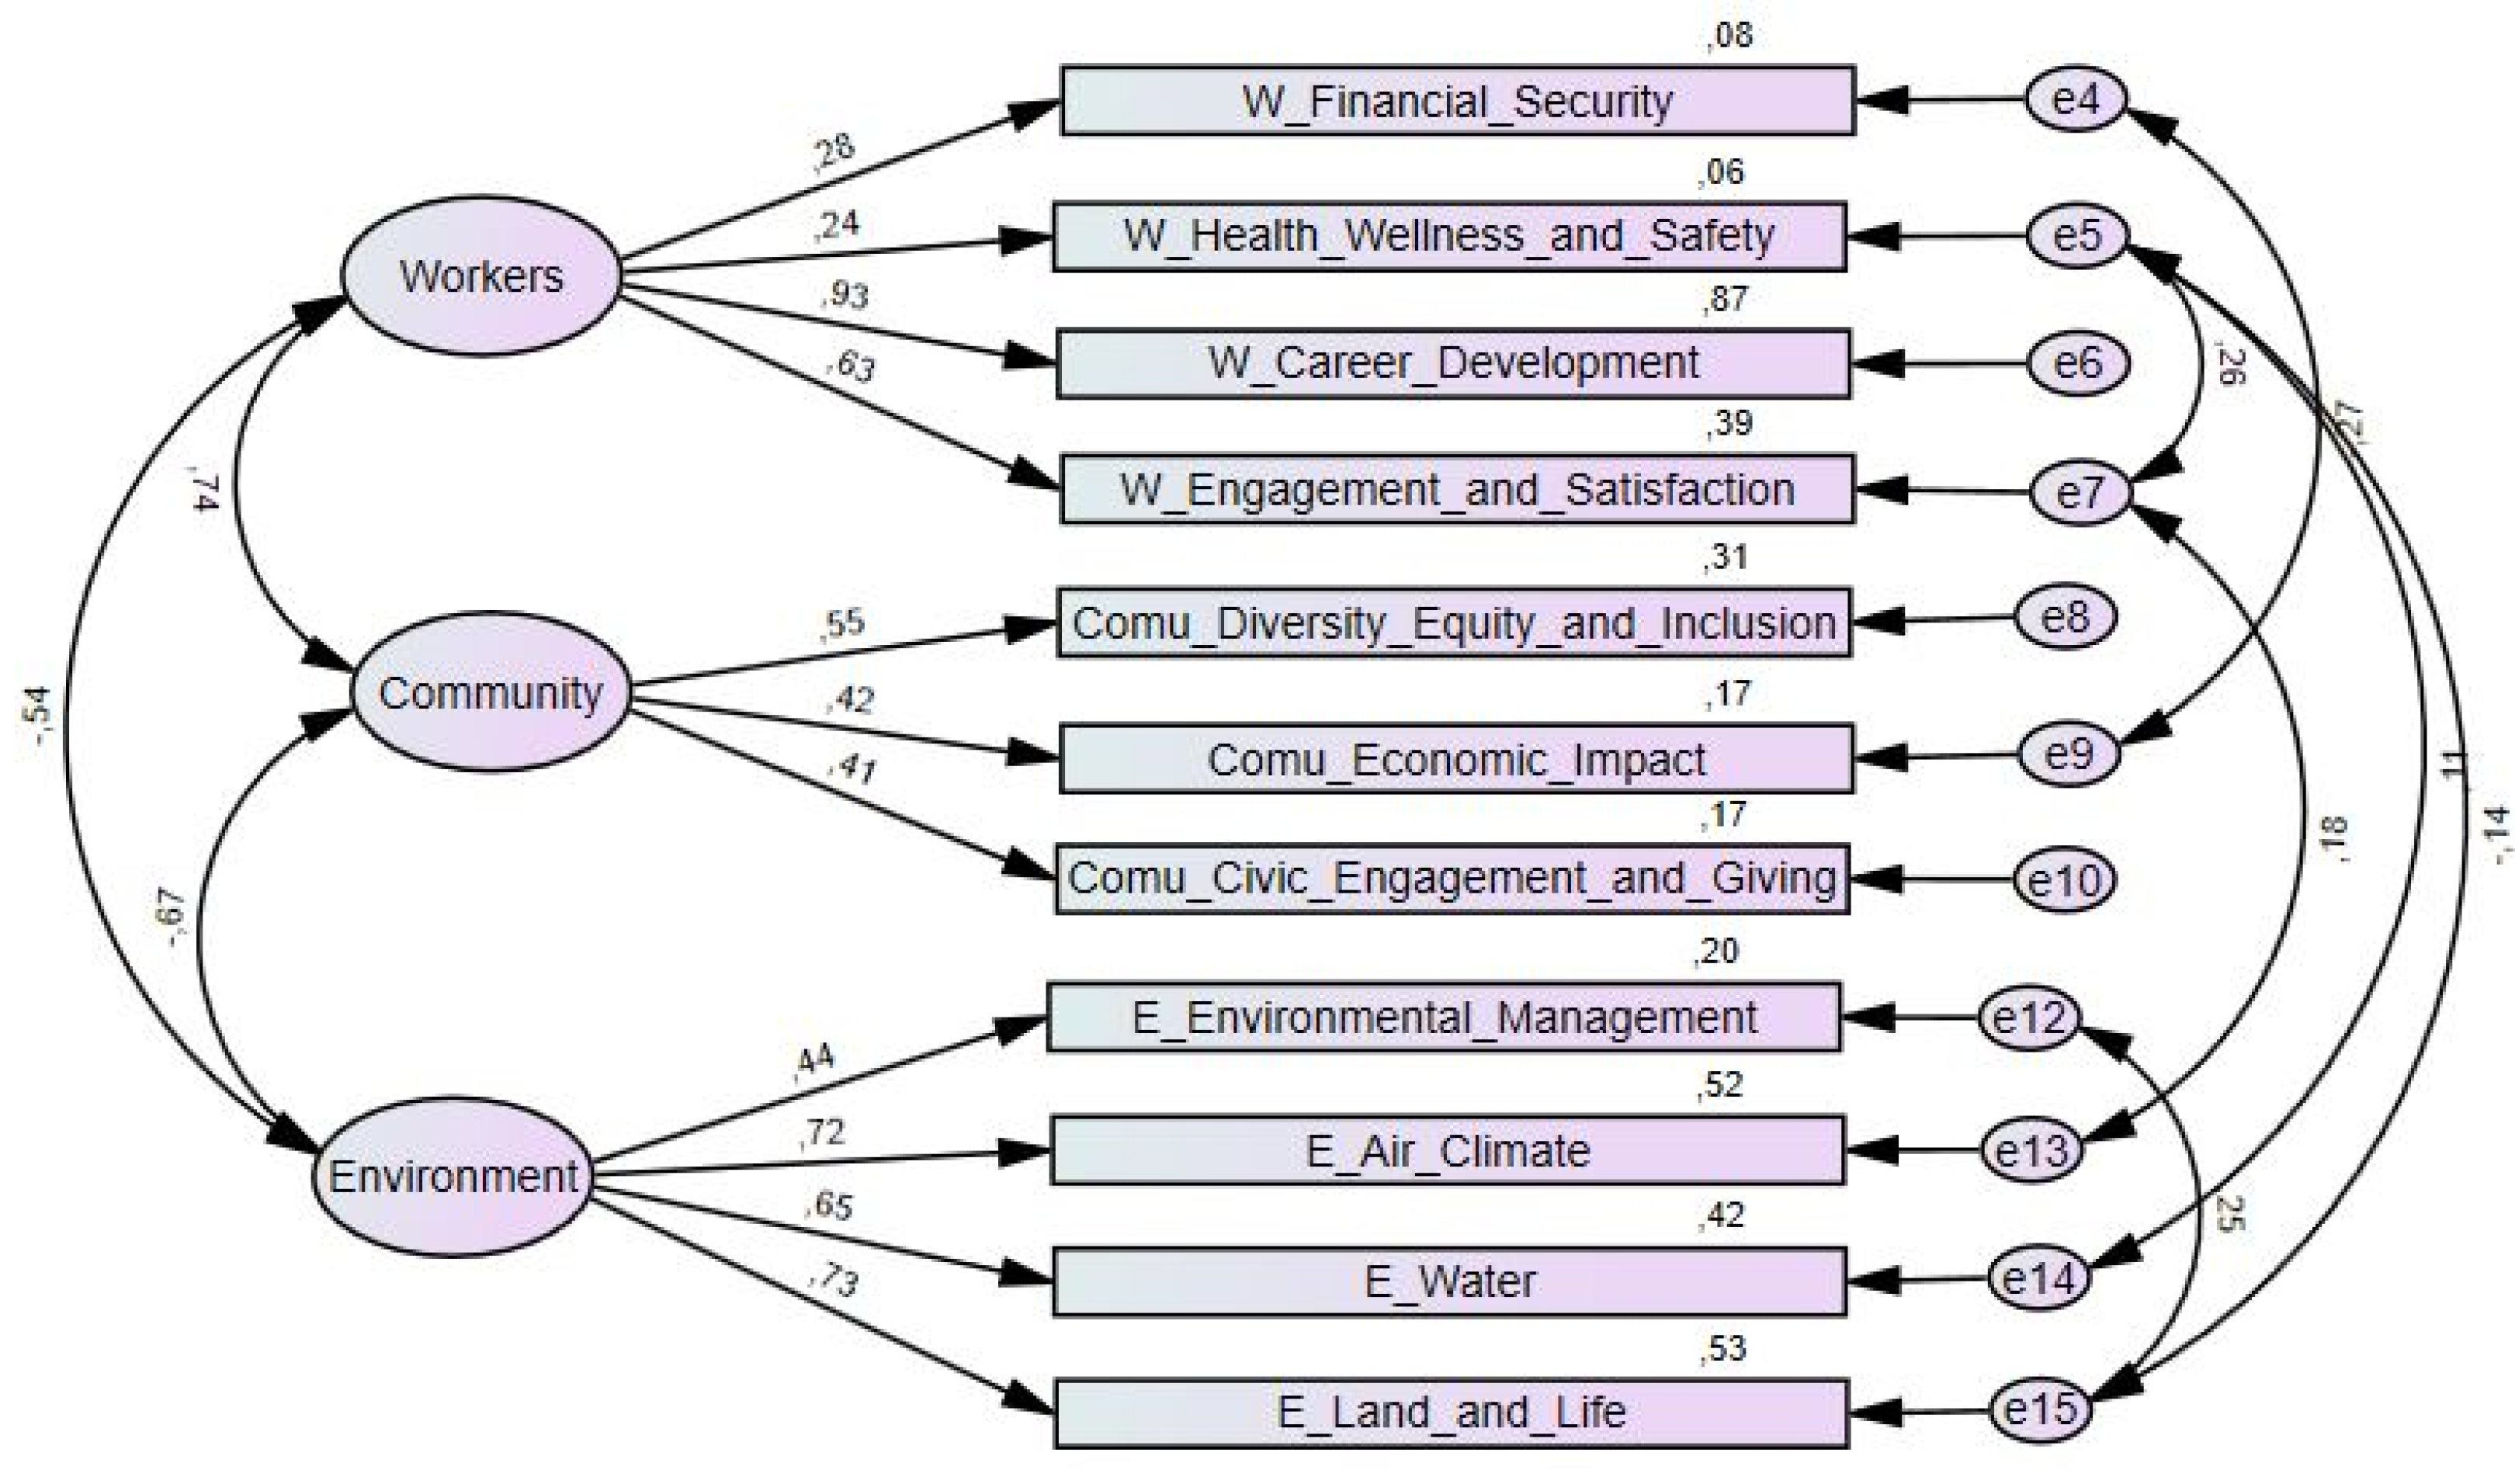
Several models were simulated in this research to understand which measurement model structure best fits the data. Of all the models studied, the one where it was possible to obtain the best adjustment indices was the following (see Figure 8):
As can be seen, this model presents significant differences from the original model that was tested. First, there was a reduction in the number of latent variables from four to three by eliminating the governance indicator. Additionally, the observed variable (customer stewardship) was removed from the model.
These changes introduced in the B Impact Assessment model, according to Figure 8, allowed us to achieve the final adjustment values mentioned in Table 12. As a result, the simplified model exhibited a significantly higher quality of fit than the original model in the sample under study.

5. Discussion

Public articles on B Corp certification have increased exponentially [8]. Some authors, such as Putnam Rankin and Matthews [22], challenge academics to focus their efforts on understanding this certification system by exploring all the perspectives surrounding it to answer fundamental questions about its evolution and importance in the pro-social field.
Although the body claims to be a pro-social movement that “meets the highest standards of social and environmental performance,” in our research, we found companies certified by the B Corporation that achieved a high final score and were therefore classified as exceptional or extraordinary, but which then reveal weaknesses in key areas such as environmental performance.
According to the data collected, it appears that there are no minimum impact scores for the main sustainability pillars of the B Corp assessment system. This can lead to a considerable imbalance in companies that manage to achieve high values in certain assessment areas, thus obtaining the B Corporation brand seal, which, on the other hand, demonstrate profound weaknesses in important areas of sustainable development.
Our research is in line with Tabares [50]. This author states that the B Corp model is highly standardized and has similarities in different areas. However, of the five main pillars of B Impact Assessment, the only one that seems to follow a standardized assessment method is the one on governance (see Figure 2). Taking into account that the B Impact Assessment evaluates how a company’s operations and business model influences their workers, community, environment, and customers, our research is also in line with Fonseca et al. [4]; Paelman, Van Cauwenberge and Vander Bauwhede [7]; Villela, Bulgacov and Morgan [28]; and Grimes, Gehman and Cao [34], among others.
Despite several attempts to adjust the B Impact Assessment model, we could not arrive at an adjusted model using all the audit variables that are part of the B Corporation certification process. Among all the models structured and studied, the only one that allowed us to reach a model with good adjustment and meeting the minimum number of three observed variables for each latent variable [43], was taking into account only the indicators of the environment, workers, and community, and therefore the governance and customers indicators are not part of this model.
Additionally, the reliability analysis allowed us to verify that the B Impact Assessment indicators present internal consistency problems, with the exception of environment. This finding should not be underestimated as it points to the possible lack of the capacity of the B Impact Assessment to provide consistent results when applied to structurally similar organizations.
Finally, it should be noted that the literature on sustainability tends to take for granted the reliability of certification practices [18]. According to [18] “we should be skeptical about the ability of certification auditing to ensure accountability of organizations with regard to sustainability, although auditing clearly plays a key symbolic role in producing order, promoting the emergence of rationality and legitimacy” (p. 345).
These findings suggest that restructuring actions should be implemented to improve the B Corp certification system, including both the measurement model and the evaluation process carried out by the evaluators of B Lab.

6. Conclusions

The announcement of certifications in sustainability is positively associated with the performance of companies [27]. In addition, B Corp certification conveys a perception of trust and effectiveness in the social, economic, and environmental fields [25], providing a seal of legitimacy for external markets, investors, and customers [28]. Nevertheless, the B Corp movement competes alongside existing sustainability models and certifications [32]. Therefore, academic research should empirically assess the B Corp model’s reliability as essential for its validation and legitimization.
According to the main objective foreseen for our study, after analyzing the data related to the B assessment process of 2262 companies, we conclude that the B Corp certification model presents some weaknesses in the measurement constructs—mainly in the governance and customers indicators, which does not allow the creation of a solid and well-adjusted model. The only indicator that showed reliability, being somewhat suitable for the purpose of this research, was the assessment of the environment, with a Cronbach’s alpha of 0.723.
The final values obtained on the adjustment of the B Impact Assessment model are outside the standards classified as good and suggested by the authors [43,47,48]. The only measurement model studied that could be classified as a good fit disregards the governance and customers indicators. These results further reinforce our argument about the weaknesses of the B Corp model with regard to the governance and customer evaluation indicators since it was possible to obtain a well-adjusted model without considering them. The variables observed in audit process B, “mission locked” and “supply chain management,” present a negative covariance value which indicates the opposite direction of construct valuation. The variable “mission locked” has a p-value equal to 0.883, which statistically leads us to consider that this variable is insignificant for the model.
By interpreting the results, everything leads us to believe that B Impact Assessment does not follow a standard measurement scale with fixed maximum and minimum values. Except for the governance indicator, all other B indicators show a high dispersion of the data. The fact that there are apparently no minimum values established for each of the five B indicators can lead to a considerable imbalance in the companies that manage to attain high values in certain assessment areas. Thus, it is possible to obtain the B Corporation label, and, on the other hand, to show profound weaknesses in important areas of sustainable development, such as the environment. Factually, looking at the results, the most valued B indicator is community, and the least is governance, which reflects some personality and objectivity traits of this certification model.
The scores of B Corps are mostly close to the minimum value for obtaining the certificate (80 points), which demonstrates that a large proportion of companies have an overall performance close to the baseline requirements.
As final remarks, it can be noted that the B Corp certification model could be improved through a more accurate specification of the indicators’ measurement scales. In addition, although the holistic perspective of the model can be pointed out as an advantage, it focuses on different social and environmental issues, which overall show measurement inconsistencies. Moreover, it is considered that the B Corp certification model can be strengthened by establishing procedures for monitoring the evaluators. It is known that the evaluators are a critical element of any certification process, so the implementation of systematic procedures for the selection, training, and monitoring of evaluators may also contribute to reducing measurement bias.
Furthermore, it should be acknowledged that models can have limitations, e.g., the context can be a significant source of influence, namely under highly unpredictable and unstable markets characterized by volatility, uncertainty, complexity, and ambiguity (VUCA). Therefore, there are risks to oversimplifying the reality in which the organizations operate [51].
As future research recommendations, in-depth analyses of the certification processes of B Corp companies, collecting primary data, are suggested to find areas for improvement that may complement the results already achieved in this research.

Author Contributions

The authors confirm their contributions to this paper as follows: Conceptualization, V.S., V.L., J.C.S., L.F. and G.S.; Data curation, V.S. and V.L.; Formal analysis, V.S., V.L., J.C.S. and L.F.; Investigation, V.S., V.L., J.C.S., L.F. and G.S.; Methodology, V.S., V.L. and J.C.S.; Writing—original draft, V.S., V.L. and J.C.S.; Writing—review and editing, V.L., L.F. and G.S. All authors have read and agreed to the published version of the manuscript.

Funding

The work of the author Vanda Lima is supported by national funds, through the FCT—Portuguese Foundation for Science and Technology under the project UIDB/04728/2020.

Institutional Review Board Statement

Not applicable.

Informed Consent Statement

Not applicable.

Data Availability Statement

Data sharing not applicable.

Conflicts of Interest

The authors declare no conflict of interest.

References

  1. Fonseca, L. ISO 14001:2015: An improved tool for sustainability. J. Ind. Eng. Manag. 2015, 8, 35–50. [Google Scholar]
  2. Ferreira, C.d.S.; Poltronieri, C.F.; Gerolamo, M.C. ISO 14001:2015 and ISO 9001:2015: Analyse the relationship between these management systems standards and corporate sustainability. Gest. Prod. 2019, 26, e3906. [Google Scholar] [CrossRef]
  3. Zimon, D.; Madzik, P.; Sroufe, R. The influence of ISO 9001 & ISO 14001 on sustainable supply chain management in the textile industry. Sustainability 2020, 12, 4282. [Google Scholar]
  4. Fonseca, L.; Silva, V.; Sá, J.C.; Lima, V.; Santos, G.; Silva, R. B Corp versus ISO 9001 and 14001 certifications: Aligned, or alternative paths, towards sustainable development? Corp. Soc. Responsib. Environ. Manag. 2021, 29, 496–508. [Google Scholar] [CrossRef]
  5. B Corporation, Certified B Corporation. 2021. Available online: https://bcorporation.net/ (accessed on 30 January 2021).
  6. Lau, C.K. The economic consequences of business sustainability initiatives. Asia Pacific J. Manag. 2019, 36, 937–970. [Google Scholar] [CrossRef]
  7. Paelman, V.; van Cauwenberge, P.; Bauwhede, H.V. The impact of B corp certification on growth. Sustainability 2021, 13, 7191. [Google Scholar] [CrossRef]
  8. Diez-Busto, E.; Sanchez-Ruiz, L.; Fernandez-Laviada, A. The B corp movement: A systematic literature review. Sustainability 2021, 13, 2508. [Google Scholar] [CrossRef]
  9. WCED (World Commission on Environment and Development). Our Common Future; Oxford University Press: New York, NY, USA, 1987. [Google Scholar]
  10. United Nations. Transforming Our World: The 2030 Agenda for Sustainable Development; United Nations: New York, NY, USA, 2015. [Google Scholar]
  11. Barbier, E.B. The Concept of Sustainable Economic Development. Environ. Conserv. 1987, 14, 101–110. [Google Scholar] [CrossRef]
  12. Purvis, B.; Mao, Y.; Robinson, D. Three pillars of sustainability: In search of conceptual origins. Sustain. Sci. 2019, 14, 681–695. [Google Scholar] [CrossRef] [Green Version]
  13. Freeman, R.E. Strategic Management: A Stakeholder Approach; Pitman: Boston, MA, USA, 1984. [Google Scholar]
  14. Freeman, R.E.; Dmytriyev, S. Corporate Social Responsibility and Stakeholder Theory: Learning From Each Other. Symph. Emerg. Issues Manag. 2017, 1, 7–15. [Google Scholar] [CrossRef] [Green Version]
  15. Fonseca, L.; Ramos, A.; Rosa, Á.; Braga, A.C.; Sampaio, P. Stakeholders satisfaction and sustainable success. Int. J. Ind. Syst. Eng. 2016, 24, 144–157. [Google Scholar] [CrossRef]
  16. Barney, J. Firm Resources and Sustained Competitive Advantage. J. Manag. 1991, 17, 99–120. [Google Scholar] [CrossRef]
  17. Di Maggio, P.J.; Powell, W.W. The iron cage revisited institutional isomorphism and collective rationality in organizational fields. In Economics Meets Sociology in Strategic Management; Emerald Group Publishing Limited: Bingley, UK, 2000. [Google Scholar]
  18. Boiral, O.; Gendron, Y. Sustainable Development and Certification Practices: Lessons Learned and Prospects. Bus. Strateg. Environ. 2011, 20, 331–347. [Google Scholar] [CrossRef]
  19. Paelman, V.; van Cauwenberge, P.; Bauwhede, H.V. Effect of B corp certification on short-term growth: European evidence. Sustainability 2020, 12, 8459. [Google Scholar] [CrossRef]
  20. Poponi, S.; Colantoni, A.; Cividino, S.R.S.; Mosconi, E.M. The Stakeholders’ perspective within the B corp certification for a circular approach. Sustainability 2019, 11, 1584. [Google Scholar] [CrossRef] [Green Version]
  21. de Mendonca, T.; Zhou, Y. What does targeting ecological sustainability mean for company financial performance? Bus. Strateg. Environ. 2019, 28, 1583–1593. [Google Scholar] [CrossRef]
  22. Rankin, C.P.; Matthews, T.L. Patterns of B Corps Certification: The Role of Institutional, Economic, and Political Resources. Societies 2020, 10, 72. [Google Scholar] [CrossRef]
  23. Moroz, P.W.; Branzei, O.; Parker, S.C.; Gamble, E.N. Imprinting with purpose: Prosocial opportunities and B Corp certification. J. Bus. Ventur. 2018, 33, 117–129. [Google Scholar] [CrossRef]
  24. Gehman, J.; Grimes, M. Hidden badge of honor: How contextual distinctiveness affects category promotion among certified b corporations. Acad. Manag. J. 2017, 60, 2294–2320. [Google Scholar] [CrossRef] [Green Version]
  25. Bianchi, C.; Reyes, V.; Devenin, V. Consumer motivations to purchase from benefit corporations (B Corps). Corp. Soc. Responsib. Environ. Manag. 2020, 27, 1445–1453. [Google Scholar] [CrossRef]
  26. Santos, G.; Sá, J.C.; Félix, M.; Barreto, L.; Carvalho, F.; Doiro, M.; Zgodavová, K.; Stefanović, M. New needed quality management skills for quality managers 4.0. Sustainability 2021, 13, 6149. [Google Scholar] [CrossRef]
  27. Feng, Y.; Lai, K.h.; Zhu, Q. Legitimacy in operations: How sustainability certification announcements by Chinese listed enterprises influence their market value? Int. J. Prod. Econ. 2020, 224, 107563. [Google Scholar] [CrossRef]
  28. Villela, M.; Bulgacov, S.; Morgan, G. B Corp Certification and Its Impact on Organizations Over Time. J. Bus. Ethics 2019. ahead of print. [Google Scholar] [CrossRef]
  29. Viswanathan, L.; Varghese, G. Greening of business: A step towards sustainability. J. Public Aff. 2018, 18, e1705. [Google Scholar] [CrossRef]
  30. Alves, W.; Silva, Â.; Rodrigues, H.S. Green Practices as a Path towards the Sustainability: Evidence from Portuguese Companies. Bus. Syst. Res. J. 2020, 11, 7–20. [Google Scholar] [CrossRef]
  31. Silva, S.; Sá, J.C.; Silva, F.J.G.; Ferreira, L.P.; Santos, G. Lean Green—The Importance of Integrating Environment into Lean Philosophy—A Case Study. Lect. Notes Netw. Syst. 2020, 122, 211–219. [Google Scholar]
  32. Nigri, G.; del Baldo, M. Sustainability reporting and performance measurement systems: How do small- and medium- sized benefit corporations manage integration? Sustainability 2018, 10, 4499. [Google Scholar] [CrossRef] [Green Version]
  33. Derqui, B. Towards sustainable development: Evolution of corporate sustainability in multinational firms. Corp. Soc. Responsib. Environ. Manag. 2020, 27, 2712–2723. [Google Scholar] [CrossRef]
  34. Grimes, M.G.; Gehman, J.; Cao, K. Positively deviant: Identity work through B Corporation certification. J. Bus. Ventur. 2018, 33, 130–148. [Google Scholar] [CrossRef]
  35. Sá, J.C.; Amaral, A.; Barreto, L.; Carvalho, F.; Santos, G. Perception of the importance to implement ISO 9001 in organizations related to people linked to quality—An empirical study. Int. J. Qual. Res. 2015, 13, 1055–1070. [Google Scholar] [CrossRef]
  36. Hoepner, A.G.F.; Schopohl, L. State Pension Funds and Corporate Social Responsibility: Do Beneficiaries’ Political Values Influence Funds’ Investment Decisions? J. Bus. Ethics 2020, 165, 489–516. [Google Scholar] [CrossRef] [Green Version]
  37. Memon, K.R.; Ghani, B.; Khalid, S. The relationship between corporate social responsibility and employee engagement-a social exchange perspective. Int. J. Bus. Sci. Appl. Manag. 2020, 15, 1–16. [Google Scholar]
  38. Badía, G.; Cortez, M.C.; Ferruz, L. Socially responsible investing worldwide: Do markets value corporate social responsibility? Corp. Soc. Responsib. Environ. Manag. 2020, 27, 2751–2764. [Google Scholar] [CrossRef]
  39. Fonseca, L. Strategic Drivers for Implementing Sustainability Programs in Portuguese Organizations–Let’s Listen to Aristotle: From Triple to Quadruple Bottom Line. Sustain. J. Rec. 2015, 8, 136–142. [Google Scholar] [CrossRef] [Green Version]
  40. Sá, J.C.; Vaz, S.; Carvalho, O.; Lima, V.; Morgado, L.; Fonseca, L.; Doiro, M.; Santos, G. A model of integration ISO 9001 with Lean six sigma and main benefits achieved. Total Qual. Manag. Bus. Excell. 2022, 33, 218–242. [Google Scholar] [CrossRef]
  41. Teixeira, P.; Sá, J.C.; Silva, F.J.G.; Ferreira, L.P.; Santos, G.; Fontoura, P. Connecting lean and green with sustainability towards a conceptual model. J. Clean. Prod. 2021, 322, 129047. [Google Scholar] [CrossRef]
  42. Quivy, R.; van Campenhoudt, L. Manual de Investigação em Ciências Sociais, 2nd ed.; Gradiva: Lisboa, Portugal, 1998. [Google Scholar]
  43. Hair, J.F.; Black, W.C.; Babin, B.J.; Anderson, R.E. Multivariate Data Analysis—A Global Perspective, 7th ed.; Pearson Education: Upper Saddle River, NJ, USA, 2010. [Google Scholar]
  44. Marôco, J. Análise de Equações Estruturais—Fundamentos Teóricos, Software e Aplicações; ReportNumber, Lda: Pêro Pinheiro, Portugal, 2010. [Google Scholar]
  45. Byrne, B.M.; Taylor, R.; York, N. Structural Equation Modeling with AMOS. Basic Concepts, Applications, and Programming, 2nd ed.; Taylor & Francis: New York, NY, USA, 2010. [Google Scholar]
  46. Jackson, D.L.; Gillaspy, J.A.; Purc-Stephenson, R. Reporting Practices in Confirmatory Factor Analysis: An Overview and Some Recommendations. Psychol. Methods 2009, 14, 6–23. [Google Scholar] [CrossRef]
  47. Kline, R.B. Principles and Practices of Structural Equation Modelling, 4th ed.; Guilford Press: New York, NY, USA, 1998. [Google Scholar]
  48. Xia, Y.; Yang, Y. RMSEA, CFI, and TLI in structural equation modeling with ordered categorical data: The story they tell depends on the estimation methods. Behav. Res. Methods 2019, 51, 409–428. [Google Scholar] [CrossRef]
  49. Pestana, M.H.; Gageiro, J.N. Análise de Dados para Ciências Sociais. A Complementaridade do SPSS, 5th ed.; Edições Sílabo: Lisboa, Portugal, 2008. [Google Scholar]
  50. Tabares, S. Certified B corporations: An approach to tensions of sustainable-driven hybrid business models in an emerging economy. J. Clean. Prod. 2021, 317, 128380. [Google Scholar] [CrossRef]
  51. Fonseca, L. The EFQM 2020 model. A theoretical and critical review. Total Qual. Manag. Bus. Excell. 2021, 1–28. [Google Scholar] [CrossRef]
Figure 1. B Impact Assessment—measurement model.
Sustainability 14 05590 g001
Figure 2. BIA scores (2262 companies).
Sustainability 14 05590 g002
Figure 3. BIA final score (2262 companies).
Sustainability 14 05590 g003
Figure 4. Sectorial distribution of B Corporation (2262 companies).
Sustainability 14 05590 g004
Figure 5. BIA observed variables (556 companies).
Sustainability 14 05590 g005
Figure 6. B Impact Assessment—Adjusted Measurement Model (original model).
Sustainability 14 05590 g006
Figure 7. B Impact Assessment—Adjusted Measurement Model (modified model).
Sustainability 14 05590 g007
Figure 8. B Impact Assessment—Measurement Model (best fit model).
Sustainability 14 05590 g008
Table 1. B Impact Assessment (BIA) information extracted from B Corp directory.
BIA Audit Information (Variable or Indicator)Designation
Name/IDCommercial name of B certified company or organization.
CountryCountry of origin of B certified company or organization.
CityCity of origin of B certified company or organization.
Year of certificationYear in which the company or organization was certified.
Activity sectorSector of activity in which the certified company or organization operates.
Governance scores:“Mission and Engagement”Score attributed to the audit variables belonging to the governance indicator.
“Ethics and Transparency”
“Mission Locked”
Workers scores:“Financial Security”Score attributed to the audit variables belonging to the workers indicator.
“Health, Wellness, and Safety”
“Career Development”
“Engagement and Satisfaction”
Community scores:“Diversity, Equity, and Inclusion”Score attributed to the audit variables belonging to the community indicator.
“Economic Impact”
“Civic Engagement and Giving”
“Supply Chain Management”
Environment scores:“Environment Management”Score attributed to the audit variables belonging to the environment indicator.
“Air and Climate”
“Water”
“Land and Life”
Customers scores:“Customer Stewardship”Score attributed to the audit variables belonging to the customer indicator.
Final scoreSummary of the final score for the 5 evaluation indicators.
Table 2. B Impact Assessment—Latent and observed variables.
Latent VariablesObserved Variables
Governance“Mission and Engagement”
“Ethics and Transparency”
“Mission Locked”
Workers“Financial Security”
“Health Wellness and Safety”
“Career Development”
“Engagement and Satisfaction”
Community“Diversity Equity and Inclusion”
“Economic Impact”
“Civic Engagement and Giving”
“Supply Chain Management”
Environment“Environmental Management”
“Air Climate”
“Water”
“Land and Life”
“Customer Stewardship”
Table 3. Univariate extreme values.
Observed VariablesNExtreme Values a
LowHighTotalPercentage
Mission and Engagement556010101.8%
Ethics and Transparency5560771.3%
Mission Locked5560000.0%
Financial Security5560000.0%
Health Wellness and Safety5560000.0%
Career Development5560000.0%
Engagement and Satisfaction5560000.0%
Diversity Equity and Inclusion556011112.0%
Economic Impact556012122.2%
Civic Engagement and Giving5560661.1%
Supply Chain Management5560440.7%
Environmental Management5560000.0%
Air Climate5560881.4%
Water556034346.1%
Land and Life5560881.4%
Customer Stewardship5560000.0%
a Number of cases outside the range (Q1 − 1.5 × (Q3 − Q1), Q3 + 1.5 × (Q3 − Q1)).
Table 4. Descriptive measures with and without extreme values.
VariableNMeanStd Deviation
WaterWith extreme values5560.91471.14065
Without extreme values5220.70400.78993
Table 5. Mahalanobis distance.
ObservationsD2D2/df
40481.336995.422466
23747.413823.160921
Table 6. B Impact Assessment—Regression Weights (original model).
Standard Estimatesp
Financial Security<---Workers0.286<0.001
Health, Wellness, and Safety<---Workers0.299<0.001
Career Development<---Workers0.913<0.001
Engagement and Satisfaction<---Workers0.647<0.001
Diversity, Equity, and Inclusion<---Community0.424<0.001
Economic Impact<---Community0.384<0.001
Civic Engagement and Giving<---Community0.270<0.001
Environmental Management<---Environment0.542<0.001
Air Climate<---Environment0.679<0.001
Water<---Environment0.622<0.001
Land and Life<---Environment0.798<0.001
Mission and Engagement<---Governance0.411<0.001
Ethics and Transparency<---Governance0.819<0.001
Supply Chain Management<---Community−0.604<0.001
Mission Locked<---Governance−0.0080.883
Table 7. B Impact Assessment—Adjustment Indices (original model).
Adjustment IndicesReference Values
CMIN/DF4.992Ratios on the order of 3:1 or lower are associated with models with good fit [43,47]
CFI0.793Values above 0.90 are usually associated with models with good fit [43]
TLI0.738Values above 0.90 indicate models with acceptable fit [47,48]
RMSEA0.088Values between 0.03 and 0.08 are associated with good fit, with 95% of confidence [43]
Table 8. B Impact Assessment—Modification indices.
M.I.Par Change
e7<-->e1314.1550.378
e5<-->e225.4710.692
e5<-->e1417.2920.306
e5<-->e1311.4770.671
e5<-->e1012.260−0.714
e5<-->e731.3670.818
e4<-->e934.866−2.270
Table 9. B Impact Assessment—Adjustment Indices (modified model).
Adjustment IndicesReference Values
CMIN/DF3.388Ratios on the order of 3:1 or lower are associated with models with good fit [43,47]
CFI0.908Values above 0.90 are usually associated with models with good fit [43]
TLI0.863Values above 0.90 indicate models with acceptable fit [47,48]
RMSEA0.068Values between 0.03 and 0.08 are associated with good fit, with 95% of confidence [43]
Table 10. Normality Assessment.
VariableMinMaxSkewKurtosis
Customers—Customer Stewardship0.0005.000−0.293−0.560
Governance—Mission Locked2.50010.000−0.473−1.734
Community—Supply Chain Management0.00010.9000.8550.292
Governance—Ethics and Transparency1.0007.8000.563−0.048
Governance—Mission and Engagement0.0006.0000.6200.178
Environment—Land and Life0.00010.2000.9890.383
Environment—Water0.0003.2001.3241.074
Environment—Air and Climate0.00012.9001.0180.911
Environment—Environmental Management0.0007.9000.154−0.416
Community—Civic Engagement and Giving0.10011.9000.7530.783
Community—Economic Impact0.00015.0000.6540.700
Community—Diversity, Equity, and Inclusion0.30012.5000.6890.815
Workers—Engagement and Satisfaction1.2009.700−0.091−0.444
Workers—Career Development0.1007.9000.244−0.625
Workers—Health, Wellness, and Safety0.00012.000−0.148−0.368
Workers—Financial Security0.80016.7000.305−0.817
Multivariate 3.088
Table 11. Reliability analysis.
Latent VariablesCronbach’s Alpha
Governance0.496 (2 items)
Workers0.505 (4 items)
Community0.403 (3 items)
Environment0.723 (4 items)
Table 12. B Impact Assessment—Adjustment Indices (best fit model).
Adjustment IndicesReference Values
CMIN/DF3.140Ratios on the order of 3:1 or lower are associated with models with good fit [43,47]
CFI0.941Values above 0.90 are usually associated with models with good fit [43]
TLI0.908Values above 0.90 indicate models with acceptable fit [47,48]
RMSEA0.064Values between 0.03 and 0.08 are associated with good fit, with 95% of confidence [43]
Publisher’s Note: MDPI stays neutral with regard to jurisdictional claims in published maps and institutional affiliations.

