1. Introduction
At present, many cities are facing more and more challenges—for example, the impacts of climate change, inadequate urban infrastructure, an increase in the migrant population, and the impact of epidemics [
1]. The population is expected to reach 8.5 billion by 2030; by 2050, it will reach 9.7 billion people. Nearly 4 billion people lived in cities as of 2019 [
2]. Asian cities are particularly vulnerable to climate change, with increased occurrence of natural disasters such as hurricanes and heatwaves. In addition, traffic congestion, flooding, and other problems will have an impact on cities [
3]. It is important to fully understand the causes of natural disasters. If human beings face and overcome difficulties actively, the damage caused by natural disasters to cities can be reduced [
4]. The disaster parameters at all levels of the city should be fully understood through disaster risk assessment and urban vulnerability assessments. Developing solutions to natural disasters can effectively reduce the damage caused by disasters to cities [
5]. In the face of any impact or pressure, it should be able to recover quickly and/or maintain basic functions, a concept known as the resilient city [
6]. To sum up, we need to build resilient cities and improve infrastructure. Complete disaster risk assessments will provide more effective solutions in the face of natural disasters and improve cities’ disaster resistance. According to statistical data, flood and wind damage are becoming more frequent in recent years, and can cause heavy casualties. At the same time, flood and wind damage cause the greatest direct economic losses [
7,
8]. Therefore, in order to enable cities to cope with floods and storms, it is necessary to improve the relevant disaster prevention measures of the city and actively promote the concept of the resilient city. Many scientific studies have pointed out that being close to nature can effectively regulate physical and mental health. At present, the epidemic is serious, so the demand for green space is increasing. Green space is good for personal physical and mental health. It can adapt to extreme climate and improve urban resilience. In addition, the “15 min city of Paris” is often mentioned, which advocates turning more gray space into green space and taking urban naturalization as a means to deal with climate and health. C40 cities also incorporated relevant concepts into the initiative of “a green and just recovery”, which can make people realize that urban green space is a key factor connecting the environment and social system [
9,
10]. Based on the above literature, green space is conducive to improving the resilience of the city, which can adapt to extreme climate and is good for physical and mental health. As shown in the “White paper on urban resilience”, there are many ways to improve the resilience of parks, such as improving infrastructure, improving biodiversity, and building resilient water systems. These ways can all improve the resilience of parks. Building a healthy and resilient urban water system is very important, including building a good drainage system and an effective flood control system, which can improve the resilience of the city. The designer tried to introduce the rainwater management system into the green space in Shanghai. After practice, it can be found that it can improve the rainwater drainage capacity of the green space and the resilience of the city [
11]. Improving infrastructure and maintaining the ecological environment can improve the resilience of the park. The construction of infrastructure is the key factor of urban resilience and plays an important role in the development of urban resilience [
12]. Based on the above literature, there are many ways to improve the resilience of parks. Through theory and practice, it can be explained that improving the resilience of parks is very important to urban resilience.
This paper will study how to improve the resilience of the park under the background of flood and wind disasters. Important research questions are as follows: how can we improve the resilience of parks? What are the key indicators of a resilience park? Which indicators are more important? What is the relative weight of each indicator? According to the theories and data found in the literature review, we plan to establish a park resilience indicator system to evaluate the resilience of each park in the future. We will also provide suggestions for how to improve the resilience and disaster prevention ability of parks.
1.1. Background and Purpose of the Study
This study attempts to find relevant data on resilience parks, including the definition, indicators, and an evaluation system. According to the research results, the current definition and indicators of a resilience park are still in development. The “Innovation Lab” activity held in Florida in 2019 had the purpose of exploring what a resilience park is and asking how we can reduce the environmental damage caused by climate change through parks? In addition, the concept of the resilience park was further explored through a design competition held in Manhattan [
13]. In addition, relevant units held workshops exploring resilience parks. However, so far, there has been no final definition or other data. As mentioned in the previous literature, providing more green space and improving the resilience of parks can reduce the damage caused by climate change to cities. Therefore, it is also necessary to study resilience parks. This study researches resilience parks from the perspective of flood and wind damage. The indicators of resilience parks are extracted by searching the domestic and foreign literature. We use the Fuzzy Delphi technique and a questionnaire to understand the importance of each indicator and perform indicator screening. Then, after the ANP network analysis and questionnaire, we calculate the weight of each indicator. Finally, an indicator hierarchy is established. The establishment of an indicator hierarchy is based on the conclusions and data related to each indicator in the literature. It is hoped that this indicator rating system can be used to evaluate the resilience of parks and put forward suggestions for improvement.
To sum up, the purpose of this study is as follows:
- (1)
Explore the relevant indicators of a resilience park from the perspective of flood and wind damage;
- (2)
From the viewpoint of flood and wind damage, calculate the weights of indicators of a resilience park; and
- (3)
Establish an indicator evaluation system for resilience parks.
We also hope to provide suggestions and references for follow-up research. The purpose of this study is to improve the resilience of parks, so that they can effectively resist the damage caused by climate change.
1.2. Literature Review
In order to mitigate the damage caused by climate change to resilient cities, it is necessary to enhance the adaptability and defensibility of cities. We pay particular attention to the construction of infrastructure and the development of parks in cities. These two methods can effectively enhance the ability of urban areas to resist disasters. We note that parks can provide urban ecological services. Parks are an infrastructure that deals with urban climate change and can improve the ability of cities to resist disasters. Parks can increase the connection of urban society, provide more sports space and microclimate, reduce urban high temperatures, and form natural habitats. A park is also a natural infrastructure of urban drainage. An increase in the number of parks can solve the problem of urban runoff, which is 8–10-fold less than in cities without parks. A park also helps to clean, filter, and absorb rainwater. Because the park’s lawn and soil are often trampled by people, its water absorption performance is reduced. Therefore, the concept of resilience needs to be introduced to form a sponge park. For example, the park can reduce urban high temperatures by planting or increasing the water space in the park. Permeable systems and other facilities can be set up to reduce the damage caused by park floods to the city [
14]. Based on the above relevant literature on resilience parks, the concept of resilience is introduced to improve the ability of parks to resist disasters. In addition, parks can provide more activity space and fresh air to alleviate the problem of the greenhouse effect.
This study explores the relevant indicators of resilience park from the perspective of flood and wind damage by means of a literature review. Finally, there are six indicators of a resilience park from the perspective of flood disaster: volume weight of soil, drainage capacity of different types of soil, proportion of lawn and permeable, permeable pavement, type of planting roots, and detention basin. From the perspective of wind damage, there are four resilience indicators: multilayer planting configuration, tree height and wind resistance, trunk and root bearing capacity, and tree species and wind resistance. The following is a brief literature review of each indicator.
From the perspective of flood disasters, the relevant indicators of a resilience park are as follows.
1. Volume weight of soil: Due to the accelerating process of urbanization, human pollution and damage to the soil are increasing. Therefore, industrial impurities and stones in urban soil are gradually increasing, which is unfavorable to planting and growth. It also affects health and degrades the living environment. Urban soils are characterized by a variety of impurities, including gravel, industrial waste, stones, and other substances [
15]. Forty-eight bases were investigated in Washington and Iowa. The results show that the volume weight of soil of a newly developed base is greater than that of the original or undeveloped base [
16]. The soil in the city is characterized by hardening and compaction. It also leads to a continuous reduction in soil porosity and a continuous increase in the volume weight of soil [
17]. If the soil is compacted, the proportion of macropores will decrease and the total porosity will decrease accordingly. As a result, the soil cannot obtain sufficient air, which hinders the drainage of rainwater, affecting the ventilation and growth of plant roots. The larger the volume weight of soil, the smaller the total porosity and the slower the soil water infiltration rate. The results show that the water infiltration rates of compacted soil and adjacent uncompacted soil are 0.8 mm/min and 3.5 mm/min, respectively. The volume weight of soil is 1.41 mg/m
3 and 1.30 mg/m
3 [
15]. The soil in urban parks and street trees in Hong Kong were studied. The results show that the soil data of urban parks and street trees are similar. The average soil porosity is 37.75%, of which 0.75–56.60% is the reference range. The average volume weight of soil of street trees is 1.65 mg/m
3. The reference range is 1.15–2.63 mg/m
3 [
18]. Therefore, it is imperative to determine the volume weight of soil. The purpose is to provide living space for plants and biosafety, as well as a healthy human environment. For example, when building a resilient park, less polluted soil can be selected. The park is far from areas with a significant volume weight of soil. We must also monitor how the random discharge of waste in cities affects the soil, etc.
2. Drainage capacity of different types of soil: Different types of soil have different drainage capacity, drainage rate, and soil adsorption capacity. In the face of flood or heavy rain, the drainage speed and other factors will affect the rainwater drainage. A park should use soil with a faster drainage rate to guide the rainwater to infiltrate faster. The index table of soil type characteristics compiled in the literature is shown as follows, where S represents soil adsorption capacity; T gravity represents the relationship between soil gravity and rainwater infiltration time; and S is an important indicator of rainwater infiltration and has reference significance, which can indicate the speed of rainwater infiltration. In addition, T gravity represents the gravity of various soils and affects the time of rainwater drainage. According to the research data, the adsorption capacity of sandy soil and sandy loam is significantly higher than that of other kinds of soil, and the rainwater infiltration time is relatively fast. In addition, sandy clay and clay have a weak adsorption capacity but a strong water-holding capacity, long rainwater infiltration time, and weak drainage capacity [
19]. According to the conclusions of most studies, soil types can be divided into three categories: sandy soil; loam; and silt, clay, and rock. Sandy soil (coarse sandy soil, fine sandy soil, very fine sandy soil, etc.) is one category, with a fast drainage speed and good permeability. Loam is another category. Loam is more common, and its drainage speed is lower than that of sandy soil, but it is better than that of silt and clay, and its permeability is ordinary. Silt, clay, and rock (clay, sandy clay, silt, sandstone, granite, etc.) are one category. They have low drainage speed and weak or no permeability. Sludge and clay have a high water-holding capacity.
3. Ratio of lawn to pervious water: In the literature, it is suggested that the proportion of lawn and water permeability should be incorporated into the design criteria of resilient parks [
20]. As stated in Article 6 of the park design criteria of Taipei city, more than 40% shall be set as the pavement or lawn space of a disaster prevention square. The park green coverage rate and grassland green coverage rate are more than 60% and more than 20%, respectively [
21]. After the investigation of the catchment area of a community and Centennial Park in New South Wales, Sydney, Australia, a survey found that the total area of the community catchment in NSW was 24 hectares. The impervious area was 73%, the permeable area was 27%, and the average catchment slope was 4.1%. The total catchment area of Centennial Park was 576 hectares. The impervious area was 56%, the permeable area was 44%, and the average catchment slope was 1.1%. The average catchment slope of NSW communities was greater than that of Centennial Park. The gradient affected the seepage capacity. The conclusions and important data of the above two documents can be used as a reference for establishing the indicator hierarchy.
4. Permeable pavements [
22]: The four most commonly used permeable pavements—concrete permeable pavement, porous concrete permeable pavement, porous concrete with turf, and concrete gap grass planting—are studied. The first kind of permeable pavement has a long gap at the joint. The gap can discharge dust, rain, and other substances on the road. The second is double-layer porous concrete permeable pavement. The first layer is used to filter pollutants. Rainwater is filtered, and afterward, the concrete is discharged into the underground drainage hole. The third kind of permeable pavement is to plant turf in the middle of a square shape (3 cm × 3 cm). The turf will also store some water. This pavement can not only effectively guide the infiltration of rainwater, but also reduce the pavement temperature. The fourth kind of permeable pavement is planted with turf at the large joint to store moisture.
5. Type of planting roots: Roots are important organs of trees. They absorb water in the soil and dissolve inorganic salts. Roots can absorb soil minerals and water. They can also produce amino acids and other substances so as to promote the growth of trees. If the roots of trees thrive, they not only improve the grip but also absorb more water. Roots can absorb and transmit nutrients and water [
23]. Plants can only rely on deep roots to absorb soil water [
24]. Deep roots grow at least 1 m down [
25]. In deep root planting, the transpiration rate and photosynthesis will also increase accordingly. A deep root system can absorb soil water at less than 1 m. The transpiration rate and photosynthesis increased by 18% and 16%, respectively [
26]. It can be concluded that planting deep root trees is beneficial to water transpiration.
6. Detention basin: Green open space is very important for cities. It can help cities mitigate natural disasters and absorb pollutants. At the same time, urban parks can build flood detention systems to prevent floods [
27]. The main type of urban rainwater control system is a detention basin or detention system [
28]. A city can effectively control the water quality and quantity after a storm by setting up a detention basin [
29]. The detention basin can be used to clean rainwater and runoff. At the same time, it can recharge the groundwater [
30]. The advantages of making a detention basin are the low construction cost, ease of maintenance, and good detention effect [
31]. According to the relevant literature, the design capacity of a grit chamber must be greater than the demand capacity. The water level range of a flood retention pond is about 1 m. When planning a detention basin, the runoff before, during, and after development should be calculated to understand the rainfall intensity of the base and evaluate the bearing capacity of the basin.
The relevant indicators of a resilience park from the perspective of wind damage are as follows.
1. Multilayer planting configuration: The configuration of multilayer planting is conducive to improving the urban heat island effect. There are many plant canopies, which can effectively filter solar radiation [
32]. Multilayer planting can change the urban temperature and form an urban microclimate [
33]. Multilayer planting configuration can increase shading, strengthen ventilation, effectively resist wind, and absorb air pollutants [
34]. Multilayer planting can also strengthen wind resistance to reduce the wind speed [
35]. The multilayer planting and the park cooperate with each other to not only improve the urban heat island effect but also resist strong winds. The multilayer planting needs to reach a certain scale, and its wind resistance can remain stable. For example, the planting range of trees should be at least 7.6 m. The upper layer is evergreen deciduous trees of different tree species and sizes. The middle layer is composed of low trees and high shrubs. The lower layer is common shrubs and herbs. The planting range of evergreen planting should be at least 3 m. Its main body is dense evergreen plants, which are planted alternately to increase contact with the ground [
36]. It is recommended to plant in multiple layers and plant wind-resistant plants. Scattered planting is required. Planting at all levels shall be considered.
2. Tree height and wind resistance: Zhang et al. [
37] studied tree height and tree stability indicators.
Bischofia polycarpa (Levl.) can be found from the relationship diagram of Airy Shaw to
Trachycarpus fortunei (Hook.) H. Wendl. The tree height is low, and its stability is high. These trees are good at resisting strong winds. Bunge hackberry,
Cinnamomum camphora (Linn) Presl,
Ligustrum lucidum,
Ginkgo biloba L., and other trees have low height but low stability. Their wind resistance is ordinary.
Swida wilsoniana (Wanger.) Sojak,
Pistacia chinensis Bunge,
Liriodendron chinense (Hemsl.) Sargent,
Zelkova serrata (Thunb.) Makino, and other trees are high, with low stability and weak wind resistance. Yu et al.’s [
38] investigation of the damage of trees at different heights after a typhoon at Huolushan Forest Park in Guangzhou studied 1787 trees in the two areas. There were 50 tree species and 23 families in the two areas. The results showed that the damage rate to trees increased with the height of the trees. The severe damage rate of trees first decreased and then increased with the height of the trees. The slight damage of trees increased with the height of trees.
3. Bearing capacity of trunk and root system [
39]: The TRU (Tree Radar Unit) root non-Invasive scanning system was used to study tree roots and measure root density. The TRU system can detect tree roots with a thickness of more than 1 cm. Roots with a thickness greater than 1 cm are usually called skeleton roots and play an important role in supporting trees against strong winds. The results showed that the root density of trees was highest in the range of 0.5–5 m in diameter. When the diameter range is 4 m, the root density of trees is the lowest. In addition, there is a significant correlation between soil porosity and root density. The study also verified that the aboveground part of trees has an important relationship with the spatial distribution of tree roots. The thicker the trunk grows on the ground, the higher the bearing capacity of the root system, which makes it more able to resist wind damage [
40].
4. Tree species and wind resistance: The wind resistance of tree species includes wood properties, tree crown structure, stem form, soil environment, and wind speed [
37]. Falling branches, uprooted trees, and broken trees are the main causes of injury or death of trees in strong winds, depending on the type of tree. The survival rate and characteristics of tree species were compared and analyzed according to the wind resistance. The results showed that tree species with a high survival rate usually had high defoliation and less branch fracturing and uprooting in the face of strong winds [
41]. Xiao and Feng [
42] studied the wind resistance of trees in South China, taking trees in residential areas, urban parks, and scenic spots as the research objects. They pinpointed wind resistance defects of particular tree species in the study area and pointed out that it is very important to choose and plant wind-resistant species.
2. Materials and Methods
The research methods used in this study include the Fuzzy Delphi method and the analytical network process. Firstly, from the literature review, 10 indicators of a resilience park from the perspective of flood and wind damage were identified. Then, we asked 10 experts from different fields to complete a Fuzzy Delphi questionnaire. The number of experts completing a Fuzzy Delphi questionnaire should be at least 5–10 [
43]. Therefore, the final number of decision-making groups in this study was 10, and 10 questionnaires were distributed. The expert group specializes in urban planning, geoengineering, landscape gardening, architectural design, and leisure and recreation.
The advantages of the Fuzzy Delphi method over other methods are described in detail below. The Fuzzy Delphi method was improved by Murray et al. (1985) by combining Fuzzy theory and the Delphi method. Compared with other methods, the Fuzzy Delphi method has the advantages of a short survey time, freedom of expression for expert opinions, the adoption of Fuzzy theory, and low costs [
44]. Scholars pointed out that the advantages of this method are that the number of investigations is low; investigation time and cost are saved; the individual opinions of experts can be fully conveyed; the semantic structure of predictors can be clearly expressed, considering the inevitable fuzziness in the process of investigation; the calculation process is simple; and it can deal with multilevel, multi-attribute, and multi-scheme decision-making problems [
45]. Using this method, Fuzzy theory can be applied to judge the opinions of experts. This can objectively present the opinions of experts, so the Fuzzy Delphi method is more accurate than other methods.
We then analyzed the Fuzzy Delphi expert questionnaire filled in by each expert. They were sorted into the most conservative cognitive values and the most optimistic cognitive values. Then, we counted the two times standard deviation of the most conservative cognitive value and the two times standard deviation of the most optimistic cognitive value of each expert’s questionnaire. We eliminated the extreme value at twice the standard deviation and calculated the ±2 times standard deviation of each indicator and the ±2 times standard deviation after elimination. Then, we calculated the minimum, geometric mean, and maximum of the most conservative cognitive value and the most optimistic cognitive value of each indicator (
Table 1 and
Table 2). After that, the convergence degree of each indicator was verified (
Table 3). When M
i < Z
i, it means that the indicator item has not reached the degree of convergence. A new round of questionnaires was needed [
46]. Finally, we tested whether the opinions given by experts reached a consensus. Using the formula that two triangular fuzzy numbers overlap, we calculated the consensus value of experts and screened the indicators, setting the threshold value to between 6 and 8. The threshold of expert consensus value is usually set as 6. If the expert consensus value of the indicator is lower than 6, then the indicator needs to be deleted [
47]. Therefore, the threshold set by reference to the above literature was 6. If the expert consensus value G
i of the indicator item was higher than the threshold value of 6, it was retained; otherwise, it was deleted. Finally, the two indicators of soil bulk density grade and planting root type were deleted, and the other indicators were retained.
In this study, the 10 experts were invited to fill in an analytical network process (ANP) questionnaire indicating the relative importance of each indicator. The purpose of this method was to obtain the final weight of each indicator. When all questionnaires were collected, Super Decisions software (Version 3.2) calculated the weight values of each dimension and each indicator. This avoided complicated calculation processes and allowed us to focus on the analysis of results [
48]. Super Decisions was used to test the inconsistency and calculate the weight value of each indicator. Firstly, an ANP hierarchical structure was established in the software, which is divided into three levels. These were the general objective (the indicator system of flood and wind damage resilience of the park), the objective criteria (flood and wind damage resilience), and the indicators of the flood and wind damage level. We performed a nonconformance verification. When the consistency ratio (CR) was less than or equal to 0.1, the consistency of the indicator items was adequate; otherwise, it did not meet the consistency verification. Afterwards, we performed a consistency test of pairwise comparison matrix. The CR value of each expert questionnaire was less than or equal to 0.1, so all of them passed the consistency test. Then, we analyzed the questionnaire data and converted the expert fuzzy evaluation value. In this study, the expert fuzzy interval value was used for data conversion [
49]. After conversion, we calculated the geometric average of each indicator item on the measurement scale. Then, Super Decisions was used for data input and pairwise fuzzy pairwise comparison. Finally, the weight of each indicator was calculated by the software. We performed a matrix operation to calculate the unweighted supermatrix. Through the software integration of the comparison matrix of various indicator items, the unweighted super matrix report of “flood and wind damage resilience indicator system of the park” was obtained. Then, we calculated the supermatrix. We multiplied the unweighted supermatrix by the matrix of each indicator item to obtain the weighted supermatrix report. Finally, the limiting supermatrix was calculated.
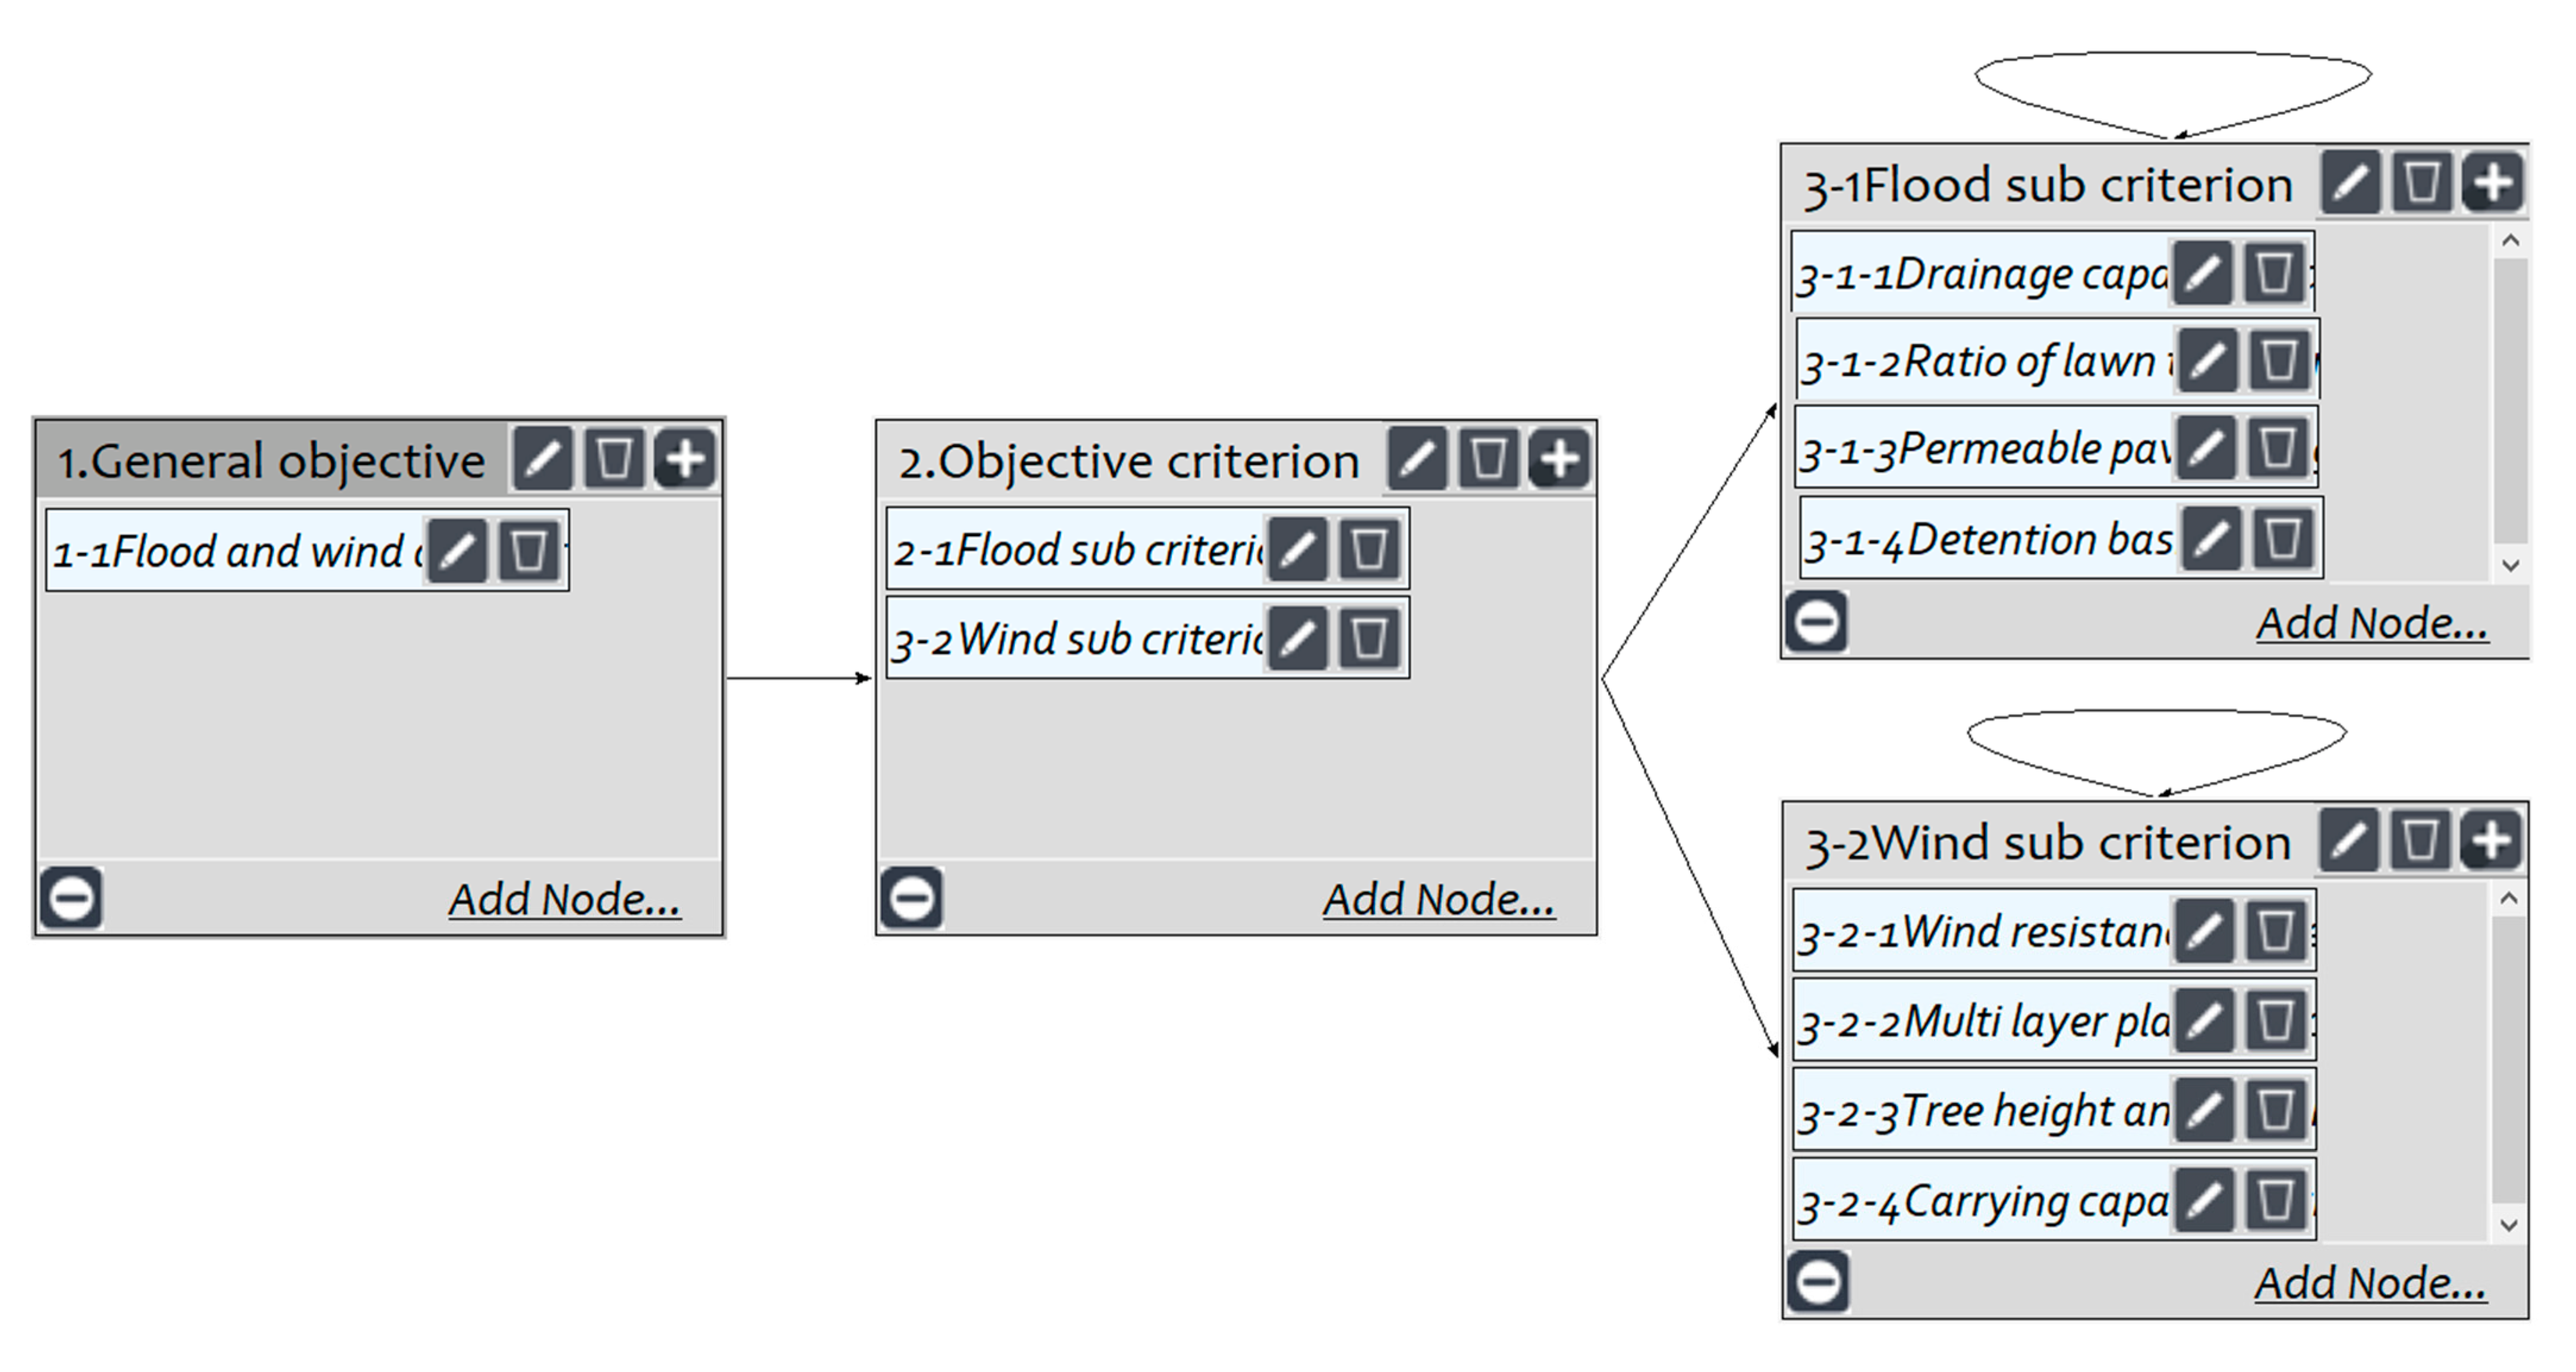
The steps of ANP are detailed below. As mentioned above, we used Super Decisions software to calculate the weight values between each dimension and each indicator. Step 1: Establish the ANP hierarchy in the software. This study is divided into three levels: the overall goal (a flood and wind damage resilience indicator system for parks), the goal criteria (flood and wind damage resilience), and the indicators of the flood and wind level (
Figure 1). Step 2: Analyze the weighted questionnaire data. Then, the expert fuzzy evaluation is converted. In this study, the expert fuzzy interval value is used for data conversion. After conversion, we calculated the geometric average of each indicator item on the measurement scale. Then, the corresponding conversion value was obtained based on the principle of rounding. Then, the software was used for data input and consistency verification (
Table A1). Step 3: Verify the inconsistency of the original data. Input the data of each expert questionnaire into the software, and the software will automatically generate the inconsistency ratio (InC.I). When the C.R. data are less than or equal to 0.1, it indicates that the consistency of the indicator items is acceptable; otherwise, it does not meet the consistency verification. Therefore, the expert questionnaire needs to be administered again or its results will be dismissed as invalid. In addition, the division between the inconsistency indicator (InC.I) and random indicator (R.I.) is equal to the consistency indicator (C.I.), which is a component of the consistency ratio (C.R.). After inputting the questionnaire data into the software, the researcher can refer to the value on the right side of consistency in the right column of the software, which is the consistency ratio (
Figure 2). After the consistency test of the ANP questionnaire in this study, the C.R. value of each expert questionnaire was less than or equal to 0.1, so all passed the consistency test (
Table A2). Finally, the weight and matrix of each indicator were calculated by the software.
4. Discussion
The purpose of this study was to explore the resilience indicator of environmental parks in Taiwan. Due to the wide gap between the rich and the poor and the resilience the city needs to develop, this study focuses on natural disasters. In the context of flood and wind damage, there is a correlation between the indicators of a resilience park, and interdependency between some indicators. There are many resilience indicators, so it is difficult to study them all. The correctness of some indicators can only be verified through repeated experiments and observations. Therefore, such indicators will not be selected temporarily, and further research can be carried out if conditions permit. For the evaluation of the wind resistance grade of tree species, we mainly refer to the relevant literature on the ranking of wind resistance of tree species. There are few references specific to Taiwan, however. This study mainly scores the resilience of parks under the condition of no disasters. The established indicator evaluation system for resilience parks does not consider regionality. Different park areas and types can affect the grading score. This study did not conduct park density or population density survey, so it is difficult to understand the regional demand for resilient parks.
This study refers to the relevant literature at home and abroad to understand the concept of the resilience park. We have explored the relevant indicators of park resilience from the perspective of flood and wind damage. Through the investigation of a Fuzzy Delphi expert questionnaire and network analysis procedure questionnaire, indicator screening and indicator weight calculation were carried out. Finally, an indicator system for the flood and wind damage resilience of parks was constructed by referring to important theories and data from the literature review. In the future, this system can be used to score the resilience of parks of different types and in different regions. We provide improvement suggestions and methods later in this paper.
In addition to being used as a general park that provides a high-quality environment and leisure space, a resilience park should have the function of disaster prevention [
50,
51]. The disaster prevention function of the park should properly address any vulnerable areas. Water bodies can be created in the park, which can achieve the function of flood retention and preventing the spread of fire. The use of a wide landscape to separate buildings can alleviate the greenhouse effect [
52]. In order to reduce flood damage, proper flood retention measures must be taken. A flood retention pond can reduce the peak flow and delay the peak. In addition, a flood retention pond has the function of water storage, so it can be used for irrigation water in the dry season [
53]. A change in the impervious rate will directly affect the surface runoff, resulting in a change in rain, flooding, and the urban microclimate. Therefore, the construction of impervious pavement can alleviate the phenomenon of ponding on the ground. According to Item 1 of Article 9 of the “urban design criteria for park development in Taipei” formulated by the Taipei Municipal Government in 2002, the pavement, waterway, and drainage system of the park should be made of permeable materials in order to avoid runoff overflow in the park during rain. It is necessary to reduce the use of impervious artificial structural materials [
54]. This study explores the indicators of a resilience park from the perspective of flood and wind damage and carries out the selection of indicators and the calculation of indicator weight. There are eight indicators in this study. According to the above literature, the resilience of a park is very important and should be given attention to effectively reduce the damage. Multilayer planting can alleviate the greenhouse effect and has the function of creating a partition. A flood retention pond can reduce flood damage. This shows that the indicators explored in this study have credibility.
Regarding the first research purpose of this paper, through a literature review, we have explored the indicators of resilience park in the context of flood and wind damage. For the first time, the indicators of a resilience park under flood disaster are different types of soil drainage capacity grade, volume weight of soil grade, lawn and permeable ratio, permeable pavement grade, planting root type, and retention pond grade. The indicators of a resilience park under wind damage are the wind resistance grade of the tree species, the multilayer planting configuration grade (tree group multilayer planting configuration and shrub multilayer planting configuration), the tree height and wind resistance grade, and the bearing capacity grade of the trunk and root system. We invited 10 experts from different fields to take part in a Fuzzy Delphi questionnaire. The purpose was to evaluate the importance and screen the relevant indicators of a resilience park. Finally, the indicator volume weight of soil and the indicator of planting root type were eliminated. We established an indicator grade evaluation system for resilience parks according to the reserved indicators. The specific evaluation criteria of each indicator were based on the research results and important conclusions of references. The ability of the park to resist floods was directly related to the soil type, the rate of soil drainage, the area of lawn in the park, the types of permeable pavement, and the presence of a flood retention pond. These indicators reflect the improved ability of the park to resist floods. The ability of the park to resist wind damage was directly related to having tree species with strong wind resistance, the reasonable allocation of multilayer planting, the influence of tree height on the wind resistance, and the bearing capacity of the trunk and root system. These factors can improve the ability of the park to resist wind damage.
In response to the second research purpose of this paper, we invited the 10 experts from the Fuzzy Delphi expert questionnaire to conduct the analytic network process questionnaire. The purpose was to understand the internal and external dependence of each indicator and calculate the relative weight of each indicator. The final conclusion was that the flood resilience indicator is more important than the wind resilience indicator. For the flood resilience indicator, the weight of lawn and permeable ratio (0.248) was the highest, and the weight of permeable pavement grade (0.125) was the lowest. For the wind damage toughness indicator, the weight of the trunk and root bearing capacity grade (0.067) was the highest and the weight of the multilayer planting configuration grade (0.053) was the lowest. The weight values of the four indicators were similar, and the degree of importance was similar.
In response to the third research purpose of this paper, we constructed an indicator system for flood and wind damage, which we hope to use to score the resilience of parks. At present, the items listed in some scoring tables are not comprehensive enough. For example, other frequently used permeable pavement types are not listed in the permeable pavement grade. For example, there is a lack of investigation into the wind resistance of many trees. Therefore, the evaluation form is not complete. If there is relevant literature produced in the future, we can continue to improve this toughness indicator system.
Through this research, we found that the park resilience indicator system constructed in this study can continue to be improved. It should be made applicable to different countries and regions. Each indicator system will be discussed below.
From the literature review, we know that gravel and sandstone have the highest permeability. The permeability of loam is average. The permeability of clay is weak [
19,
55,
56]. To use this scoring table for parks in the future, soil-related instruments need to be prepared. Otherwise, only the type of topsoil can be observed and deep soil cannot be recognized. In addition, the results of the survey will be different on sunny and rainy days (dry versus wet soil).
From the literature review, we know that more than 40% should be set aside as pavement or lawn for disaster prevention. The catchment area of Centennial Park has an impervious area of 56% and a permeable area of 44% [
20,
21]. Previous investigation into some parks in this study found that, although the permeable area of the park reached 44% of the total area and lawn accounted for more than 40% of the total area, the resilience of the parks was not high. The reason is that the lawn quality of the park is low. Some soils are seriously exposed. The soil hardens. After a rainstorm, serious ponding occurs on the lawn. Therefore, the scoring standard of the resilience indicator should be based on the premise of high-quality park soil and lawn and an ideal park drainage system. We must enhance the soil drainage and water retention capacity and improve the water circulation system of the park. Increasing green space has the functions of blocking noise, dust prevention, and promoting environmental sanitation. It can also be used as an emergency shelter for air defense and disaster avoidance. Good maintenance can enhance the permeability of the soil [
54,
57].
From the literature review, we know the permeability and performance of different types of permeable pavement. In the investigation of the park, we found that the drainage pores of some permeable pavements are blocked. If the sundries at the gap are not cleaned regularly, the drainage performance will be affected. As mentioned in the literature, if the pavement is found to be seriously blocked, it needs to be cleaned or renovated, and the water permeability needs to be tested before the rainy season every year [
58].
From the literature review, we know that, when a retention pond is full, the water level ranges from 1.2 m to 1.5 m [
59,
60]. The evaluation criteria of the indicator system include the flood retention area and flood retention height. The flood retention area is obtained by referring to the relevant literature from Taiwan. It cannot be applied to areas outside Taiwan. In addition to the indicator system, the basin state and flood peak volume can be monitored at the same time. The bearing capacity of a flood retention pond should be estimated in advance [
61].
For example, trees with strong wind resistance show a slight inclination of the trunk and partial falling off of leaves during wind [
26,
30,
31]. The resilience indicator system mainly refers to the relevant data of the ranking table of wind resistance of trees in Asia. However, some factors were not taken into account. In addition to the wind resistance of tree species, the wind force and wind direction are also very important. The key traits affecting the wind resistance of tree species include tree shape and properties (such as canopy structure), wood material, spatial form, surrounding building distribution, planting mode, community structure, soil environmental conditions, maintenance and management, and other factors [
62]. Therefore, various factors should be comprehensively weighed when evaluating the wind resistance of trees.
From the literature review, it can be concluded that the length or width of trees should be no less than 7.6 m and the length or width of shrub planting configuration should be no less than 3 m [
36]. During the park survey, we found that most parks lack a multilayer planting configuration. There is a lack of middle- and low-level configuration. Most parks are only equipped with trees. Therefore, this study reviews the literature on whether trees have wind resistance. It can be seen that five trees have the ability to resist wind [
36]. Therefore, this can be used as a reference when scoring parks.
From the literature review, it can be concluded that the thicker the trunk grows, the higher the bearing capacity of the roots. This is better for resisting wind damage [
40]. According to the relevant literature, the wind resistance of plants is directly proportional to the trunk thickness [
38]. The growth of trees’ lateral roots plays an important role in the wind resistance of the whole tree [
37]. Therefore, the indicator system includes multiple aspects such as the thickness of the trunk, the lateral roots of trees, soil quality, soil moisture, and other factors that can affect the wind resistance and root bearing capacity of trees. In the future, the indicator system can continue to be improved.
From the literature review, it can be concluded that the higher the tree, the lower the stability and the weaker the wind resistance. The damage rate of the tree increases with the height of the tree [
38]. When investigating the height of trees in a park, if there is no measuring instrument, the height can be estimated by referring to the facilities near the trees. However, a more accurate value cannot be obtained. It is suggested that reference be made to the main road materials of open data published by government departments. One can use the altimeter measurement of the APP program or similar triangulated measurement to measure the height of trees, so as to make the research data more accurate.
Based on the above discussion of each indicator system, the toughness indicator system of this study is only applicable to South China and Taiwan, particularly the plain and inland areas. The scope set by this research institute was Beitun district and Dali District of Taichung City, Taiwan. Both areas are located in the plain and are metropolitan areas, not high-altitude areas. In addition, these two areas are inland, not coastal, areas.
Many experts in Taiwan have pointed out that the number and area of parks in cities are insufficient, the development rate is low, and the distribution is uneven. There are often conflicts between general parks and resilient parks. Most parks in urban areas are in a state of decline, but there are few new parks. However, the policy has been continuously improved. For example, Taipei and Tainan give priority to planning neighborhood parks with an area of more than 1 hectare as resilient parks in their neighborhoods. Regional parks with an area of more than 1 hectare should be set up in each administrative region. In addition, because the government pays more and more attention to the planning of resilience park, there need to be general recommendations, such as the need to balance sustainability and energy conservation. Residents can participate in the planning and construction of a park and help to maintain and manage it. In addition, this study explores eight indicators of a resilience park from the perspective of flood and wind damage, which can be used as a reference for the design and construction of resilience parks in the future.
The following are suggestions for future research. 1. The indicators of park resilience need to be improved. We will continue to monitor the academic literature and books related to indicators of resilience parks and continue to extract indicators. In addition, we can seek suggestions from experts and scholars in relevant fields and, then, study the indicators. In Taiwan, the main disasters causing damage to the park are floods and wind. Therefore, we chose to study resilience parks from the perspective of flood and wind disasters. Other disasters can also cause damage to the park, but not significant damage, so they were not included in this study. If there is an opportunity in the future, the impact of other disasters on the resilience park will be studied. The wind resistance grade indicator of tree species in this study focuses on wind-resistant tree species. In the future, we can continue to study trees and shrubs with disaster resistance that meet the environmental characteristics of Taiwan. 2. During the investigation of this study, the park was mostly sunny. In the future, if possible, all-weather investigations should be carried out to assess the situation of the park after flood and wind damage and understand the disaster resistance of the park. 3. Research can be integrated into online GIS in the future. For example, one can use Web AppBuilder to establish a regional survey and statistics. The software can be used to investigate the flooded area, ring area analysis, hot spot analysis, etc., and create a 3D surround display. For example, one can use ArcGIS dashboard, a professional decision-making dashboard, to display real-time data images and provide managers a decision analysis. For example, one can use ArcGIS to create wonderful story maps.
5. Conclusions
The indicators of resilience parks under flood disasters are the soil drainage capacity grade, volume weight of soil, lawn and permeable ratio, permeable pavement grade, planting root type, and degradation pond grade. The indicators of resilience parks under wind damage are the wind resistance grade of tree species, the multilayer planting configuration grade (tree group multilayer planting configuration and shrub multilayer planting configuration), the tree height and wind resistance grade, and the bearing capacity grade of the trunk and root system. We used a Fuzzy Delphi expert questionnaire survey to select indicators. Then, we conducted a questionnaire as part of an analytical network process. Then, Super Decisions software was used to calculate the weight of each indicator. We constructed the resilience indicator system according to the literature review. Parks will be graded on their resilience in a follow-up.
In addition to exploring the eight indicators related to flood and wind disasters, other indicators were found in the research process. For example, in the context of flood disaster, the indicators of a resilient park include the site selection and planning of the park and the flow-influencing factors of grass ditches. In the context of wind disasters, the indicators of a resilient park include topographic change, tree health, and soil humidity. In the future, we can continue to explore the above indicators and establish a hierarchy of indicators.
The main limitation of this study is the difficulty of studying all toughness indicators. There is little literature on the wind resistance of trees in Taiwan, so there is a lack of knowledge about environmental characteristics in Taiwan. This study mainly scores the resilience of the park under the condition of no disasters. The established index evaluation system for resilience parks does not consider regionality. There are no park density and population density surveys, so it is difficult to understand the regional demand for resilient parks.
In the future, we will attempt to score the resilience parks of Beitun district and Dali District of Taichung city. We will seek to understand the difference in resilience between different types of parks, such as the difference between disaster prevention parks and ordinary parks, and the difference between large parks and small parks. In addition, we will seek to understand the resilience differences of parks in different regions, especially whether the degree of resilience is related to the size of the park area. After scoring the parks, we will try to use GIS to compare the parks in Beitun district and Dali District and, then, grade all the parks. If classified as a low-level park, a park is in urgent need of improvement. This study will also provide suggestions for improvement. We hope to think about how to improve the disaster prevention ability of ordinary parks.


