1. Introduction
Flood is a high-frequency natural disaster [
1], which occurs worldwide with a profound impact on national and social development [
2]. Since the 21st century, with the rapid development in China, flood disaster has caused immeasurable economic losses [
3]. According to “the water drought disaster Bulletin of China” during the decade of 2010–2019, the total value of direct financial loss due to flood disasters has exceeded 234.31 billion in the country. Flood disasters occurred in 62% of cities nationwide, and 137 cities experienced more than three episodes of flood disasters. Severe human injuries, economic losses, and traffic are often caused by heavy rainfall because of the clustering of crucial infrastructure such as population, resources, transportation, as well as power disruption.
With the development of information technology, the number of social media users is growing. The research institution We Are Social released the latest global digital reports in 2019. The report shows that the number of global social media users has increased to 3.5 billion. Each user spends one-third of their Internet time on social media every day. After a natural disaster, rescue organizations need to use extensive data in the initial phase as a decision basis to make low-risk decisions quickly [
4]. Natural disasters can cause signal interruption, and so obtaining useful data information has become an urgent problem. In the past, due to the lack of data, experts made emergency decisions mainly relying on their knowledge and experience [
5]. In recent years, with the rapid development of social networks, experts have found an essential platform for information dissemination [
6]. Therefore, after the occurrence of natural disasters, hundreds of millions of people share information on social media, forming a vast amount of data information that could serve as a basis for making emergency decisions in the literature [
7]. Behl et al. proposed that the sudden and urgent nature of emergencies requires crisis managers to remain updated and meet the critical information needs of the public, so that researchers could use social media as a source of information for crisis management [
8]. Kitazawa proposed the rapid development and application of social media in crisis communication, the effectiveness of which improved the efficiency of crisis communication, enhanced emergency response methods, reduced the cost of disasters, and increased transparency and democratism in decision-making [
9]. The author further proposed that in an emergency event, social media contains a large amount of subject matter, spatiotemporal and other emergency information, by classifying the real-time and massive emergency information, which could identify the subject matter information such as the facts, rescue, and impact of the event, so that it was beneficial to understand the status of the emergency event.
Most previous studies on social media data had focused on a single form of data (e.g., text or visual data). Piatyszek adopted a logistic regression algorithm to classify text data, and detected damage and injuries caused by Sri Lankan flooding; however, the overall accuracy of this classifier was only 0.647 because the subject sample size was too small [
10]. Yu used the CNN classifier to classify text data and detect damages caused by hurricanes by using the text data of hurricanes Sandy and Harvey, resulting in relevant recommendations for donation and assistance [
11].
To increase precision, we needed to analyze the other modal data while classifying textual information [
12]. The analysis of seismic image information, from which human body parts were examined from debris, provided an adequate basis for developing seismic rescue measures, with a precision of 0.8037. Seismic rescue efforts need to obtain geographic location information in addition to accurate image information, an effective combination of both kinds of information to obtain precise information on people trapped in earthquakes. Aznar-Crespo classified disaster social media images into three categories: severe, mild, and no damage, to analyze the effects caused by natural disasters, develop related assistance measures, and mine their corresponding text information, while classifying image information, which could further improve the accuracy of classification [
13].
Recently, the form of people’s expression views on social media platforms had significantly changed and people prefer diverse expressions, such as text, images, and video, to help multimodal data contain richer information and more accurately describe the natural disaster situation [
9]. Therefore, we must establish a model for multimodal data analysis. Multimodal data analysis was a very challenging task [
14]. Min constructed a unified cross-media word bag model for both text and image; the model acquired the representation of text and image and used a logistic regression classifier. Through the experiment, the precision of the CBM model, which could analyze both text and image modal data, was 0.80, and the precision of the logistic regression, which could analyze the text data, was 0.76. The experiment results showed that the preparation rate of information classification for analyzing both text and image modal data was 4% higher than the text-based method [
15]. Kaplan and Haenlein also used 2CNN structures, which extracted text data features and image data features separately and performed significantly better than existing models that used only text or visual content [
16].
In natural disasters, local and international studies have proven that social media data could be applied to real-time monitoring, trending the prediction of disaster events [
17]. Disaster-related text data were usually thematically classified, as in the literature [
18]. Combined LDA and SVM were used to construct a theme classification model, which divided microblogs related to the typhoon “moranti” into four themes: “early warning information”, “disaster information”, “irrelevant information”, and “rescue information”. Ghosh et al. proposed an LDA subject-based event detection model, in which multimodal information was used to increase the number of acquired event descriptions, and the multimodal data were combined into the subject model, which all achieved a classification accuracy of 81% [
19]. In addition, Wood et al. designed a system named m-trend, based on tweets containing geographic information [
20], to construct and visualize the spatiotemporal variation trends of the display theme as well as explore the trend and spatial distribution law of disaster events [
21]. Thematic model analysis of user-developed text information on microblogs generated before and after the onset of a heavy storm in Beijing in 2012 revealed differences in the temporal and spatial distribution of microblogs across themes.
Based on this, this paper proposes a multi-modal data mining method based on theme change, to perceive the development trend of disaster. This study has the following three contributions:
This study presents a multimodal system for classifying and processing multimodal data from social media.
In this study, the heavy storm disaster topic was more meticulously divided using the Latent Dirichlet Allocation (LDA) theme model, which realizes real-time extraction of information on serious storm disasters from social media.
Based on Sina Weibo, a multi-classification model was constructed using convolutional neural networks to extract storm-related disaster information [
22], such as weather, traffic, and rescue, from a large number of social media text streams. At the same time, the study visualizes and analyzes different rainstorm disaster themes in terms of relative quantity and spatial attributes as well as explores the time trend of disaster development and spatial distribution characteristics of rainstorm events.
The rest of the paper is organized as follows. In
Section 2, we present the working principle of the topic classification model and multi-modal data processing model. In
Section 3, we take the Henan rainstorm as the research object, we present the results and discussion of these experiments. In
Section 4, we discuss the conclusions and future work.
2. Methods
This study takes heavy rain in Henan in 2021 as an example. Since the night of 17 July 2021, Henan Province had experienced heavy rains. The average rainfall in the province was 73.1 mm. As of noon, 2 August 2021, 150 counties (cities and districts), 1663 townships, and 14,531,600 people were affected. The whole province had organized emergency avoidance for 933,800 people and relocation for 1,470,800 people. Heavy rain resulted in the collapse of 89,001 houses; the area affected by crops was 109.04 Square kilometres, and direct economic loss was 114.269 billion yuan. Sadly, 302 people were killed and 50 people were missing. Therefore, this study combines the Weibo API and web crawler to obtain a total of 28,099 pieces of data from 0:00 on 18 July 2021 to 23:00 on 30 July 2021, using “Henan rainstorm” as the keywords.
This study focuses on automatically locating and mining natural disaster information from images and text data on social media. A real-time classification and positioning model of emergency topics based on social text and images is proposed. The structure diagram of Multimodal data classification is shown in
Figure 1. The model consists of the following modules. The data processing module is responsible for data collection and processing. Since the correlation between images and text data is weak, this study treats text and image data separately. The topic mining module is responsible for mining hidden topics. By mining the topic information, we can fully understand emergencies. The topic analysis module is responsible for analyzing text and image data.
2.1. Acquisition and Preprocessing of Data
Weibo is used as the research object; it is a popular social-media platform. In particular, there are thousands of pieces of Weibo data on natural disasters every day. During natural disasters, people report disaster information through Weibo, express their urgent needs, and seek help. As a result, Weibo data have become an important source of data for disaster management. Text, images, and geographic location data can be used to learn more about natural disasters and provide a data basis for natural disaster management.
2.2. Topic Mining
A topic model is an essential tool for data mining on social media and has attracted extensive attention in recent years. Empirical research has found that the release of social data is closely related to the cycle of disaster occurrence, which is usually divided into three stages: pre-disaster preparation, emergency response, and post-disaster recovery. People discuss different topics on social media at different stages. In the early days of a disaster, people discussed content mainly on disaster preparedness and weather warnings. After the disaster, people focused on disaster discussions and emergency rescue. In the later stage of the disaster, people mainly focused on post-disaster recovery and reconstruction. Thus, different themes occurred in different periods.
LDA (Latent Dirichlet Allocation) is the most representative topic model [
23]. The LDA model is a typical generative model that is primarily used in text and image processing [
24]. Owing to the emergence of the BOW model, it is currently widely used for image labeling. The text uses the LDA model for topic mining of images and text data [
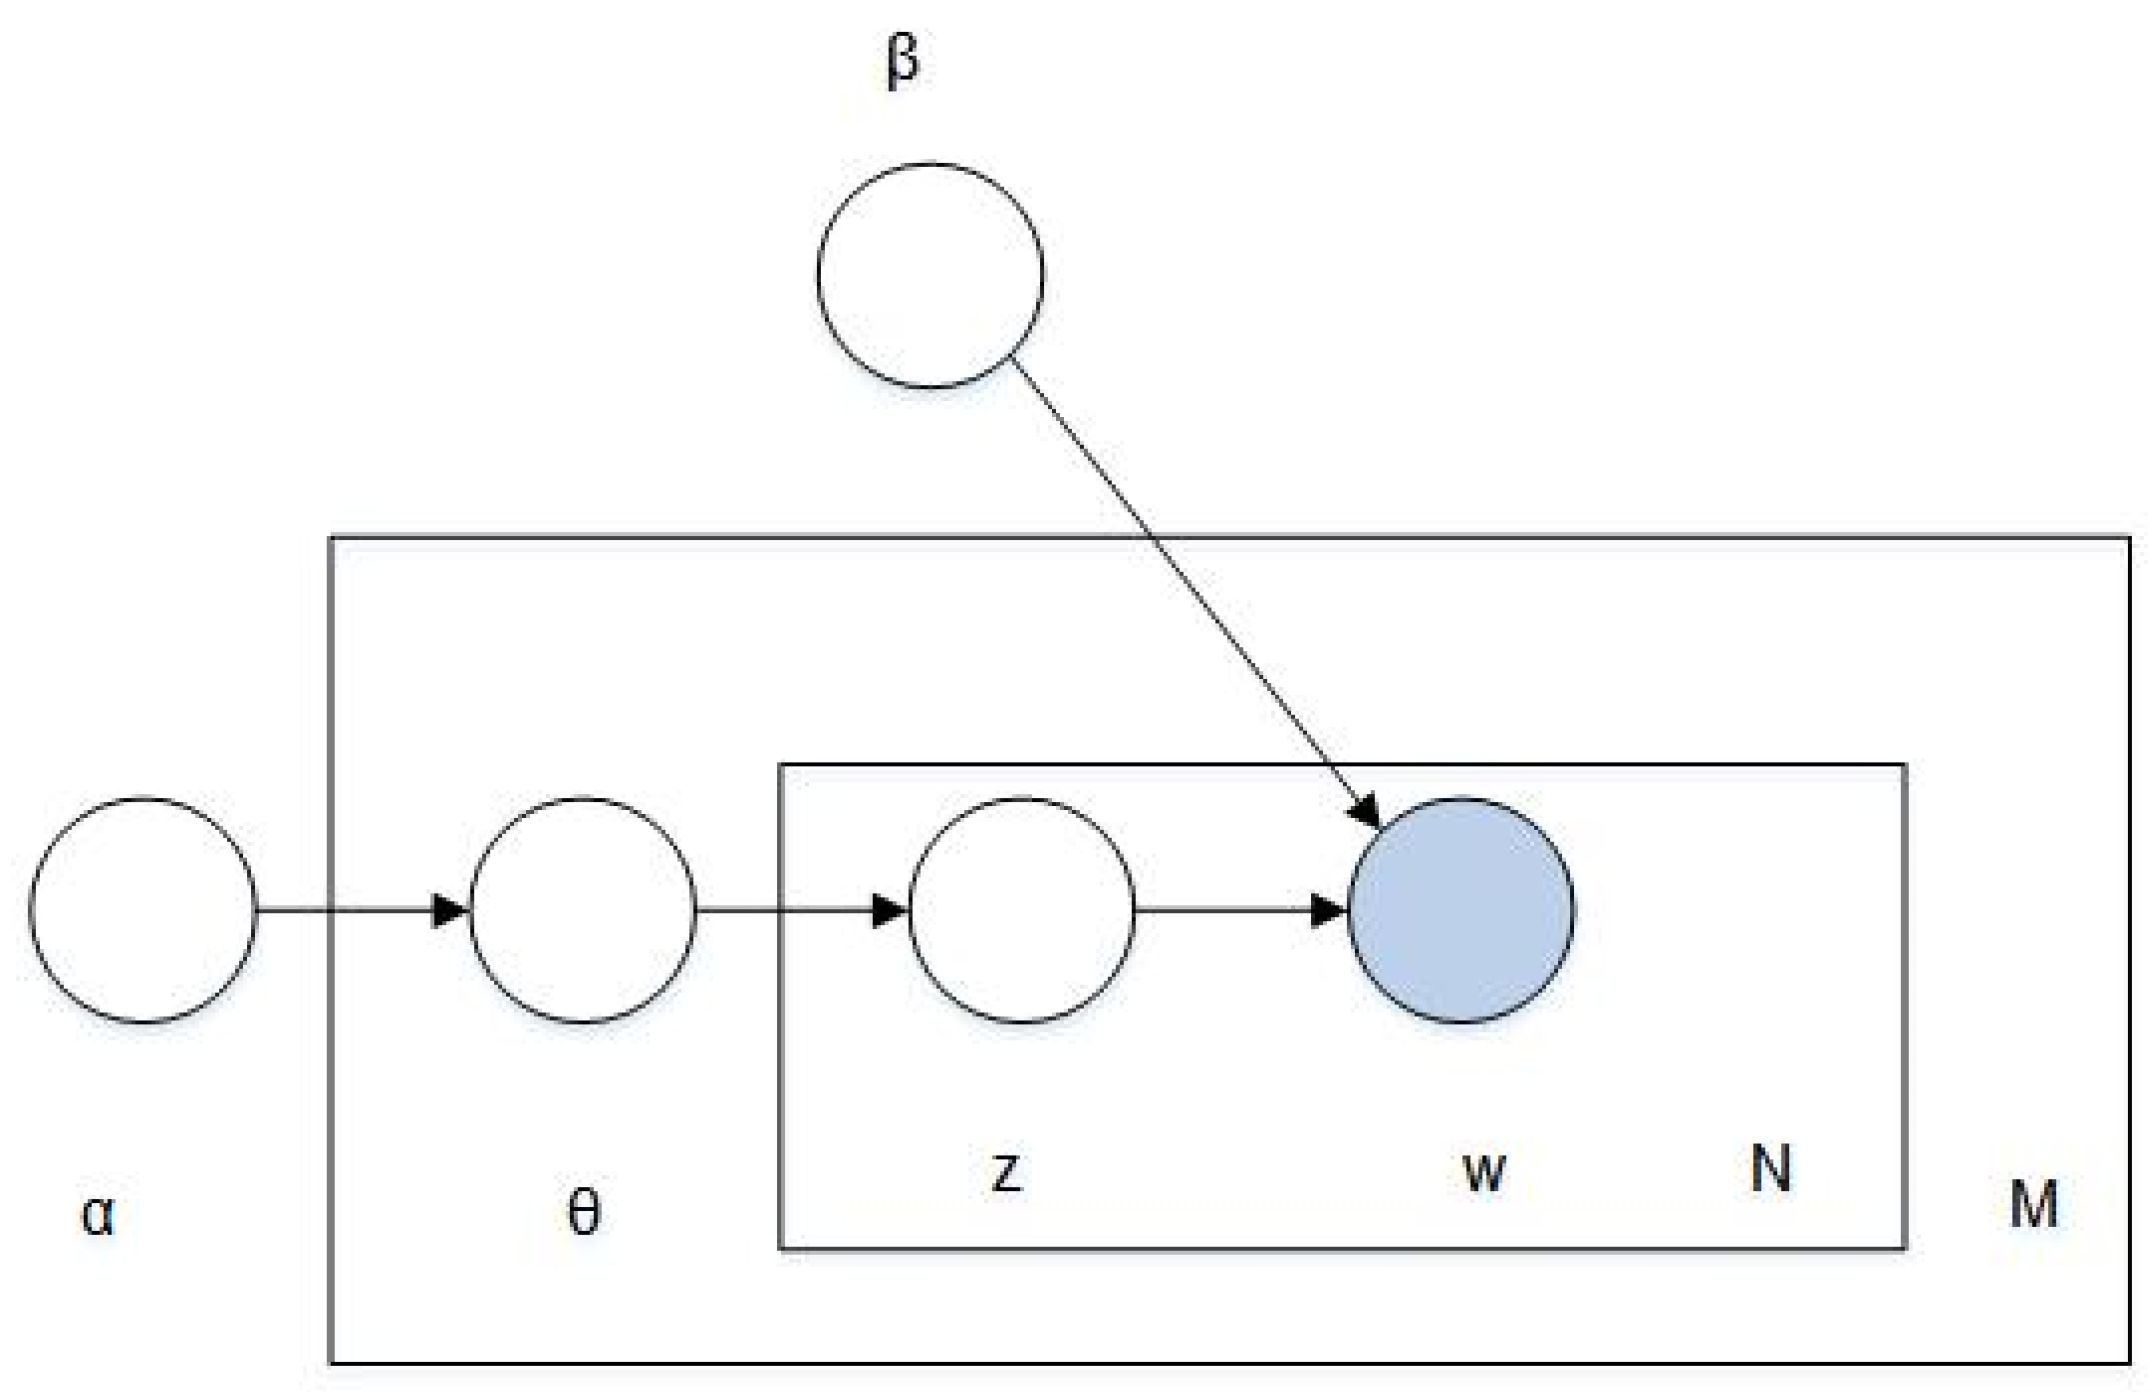
25]. The core idea of the LDA model is to regard topics as the probability distribution of text words and different topics corresponding to other text word distributions. In the field of image annotation, we need to extract the low-level features of the image and perform clustering. Then, we use the clustering algorithm to vectorize the low-level features of the image into visual words. Finally, we use the BOW model to convert the image into a set of visual words. The LDA probability graph model is shown in
Figure 2.
Table 1 lists the symbols used in the model, and their meanings are shown in
Figure 2.
2.3. Text Data Classification Model
The use of social media texts for natural disaster assessment can be divided into three areas. First, we must identify whether the tweets are related to rainstorm damage; this is a two-classification task. Second, rainstorm damage was divided into multiple categories according to the theme; this is a multi-classification task. Finally, we classified the text data according to the theme and generated a damage report.
The process of subject classification is shown in
Figure 3. First, we use Bert to build a relational classification model to identify text segments corresponding to two aspects, namely entity tags. Then, we used the predicted relationship and text to build an entity extraction model using Bert, that is, a multi-classification task. We divided each sentence into a three-tuple of description objects, damage descriptions, and damage results. Corresponding to relationships.
Bert is a large pre-trained model that shows excellent performance when generating text-entity embeddings [
26]. The Bert model improves the performance of text classification through entity embedding, so it can identify tweets and generate corresponding damage reports. Finally, we classify the damage reports into corresponding topics.
2.3.1. Damage Relationship Definition
Topic classification based on social media text data requires identifying tweets with a harmful relationship, which can be abstracted into a triad, with three aspects describing the object. Common victims of heavy rain include roads, people, houses, water, and electricity. The damage description is related to the feature words corresponding to the description object, and the damage result describes the ultimate severity of the damage. For example, 10,600 houses collapsed; this sentence describes the object as a house, the damage is described as 10,600 houses, and the result of the damage is collapsed. Thus, it is possible to classify the damage reports as corresponding. We can identify whether the tweets are related to the rainstorm based on the damage report, classify the damage report by topic, and, finally, classify the damage report into the corresponding topic.
The word collocation in this paper is based on the Chinese word collocation database SogouR, and we summarize the collocations of the Weibo texts of the rainstorm event. The construction of lexical collocation model in this paper is based on the text statistics of rainstorm events in Weibo, and the data were obtained from the “2017 Rainstorm Disaster Social Media Dataset”. We randomly selected 5000 pieces of text information from the rainstorm event, analyzed the grammatical characteristics of the disaster information, and obtained the lexical rules shown in
Table 2, thereby obtaining the collocation relationship between the expression description object and the damage result.
We present examples of identifying whether a tweet is heavy rain related based on a damage report.
Negative example: Heavy rains in Henan in 2021, the tribute to the cutest man! Tributes to people’s younger cousins.
Positive example: The father was washed away by a flood at 2 p.m. on 20 July 2021, at the Sukangcun Shi River, Takayama Town, Xingyang, from south to north and in the direction of the downstream fenggou. His upper body was covered with a white spot under the curve, and the lower body with sports pants.
Although the negative examples mention the heavy rain, they do not contain a detailed description or relevant contents of the damage, so they cannot be regarded as related to heavy rain. The positive examples include a detailed description of the subject’s father, and they include a detailed description of the damage in Baohe, Zhonggang Village, Gaoshan Town, and Xingyang City. Therefore, they were regarded as related to heavy rain.
2.3.2. Constructing Word Pairing Rules
In the study, we use the skip-gram to extract feature. Based on lexical rules to extract feature words in a small-scale annotated corpus, the feature words are used to express the object, damage description, or damage result. Then, we put the object, damage description, and damage result together as the original word pair. Based on this, the word vector model and the extended version of “Synonyms Clin” are used to enrich the collocation information of characteristic words, to realize the diversity of Chinese expressions.
In this study, based on the results of subject mining, the original words are defined as six aspects: weather warning, traffic situation, rescue information, disaster information, disaster cause, casualty, and damage. According to these six aspects, a dictionary of description objects and damage results is established, as shown in
Table 3.
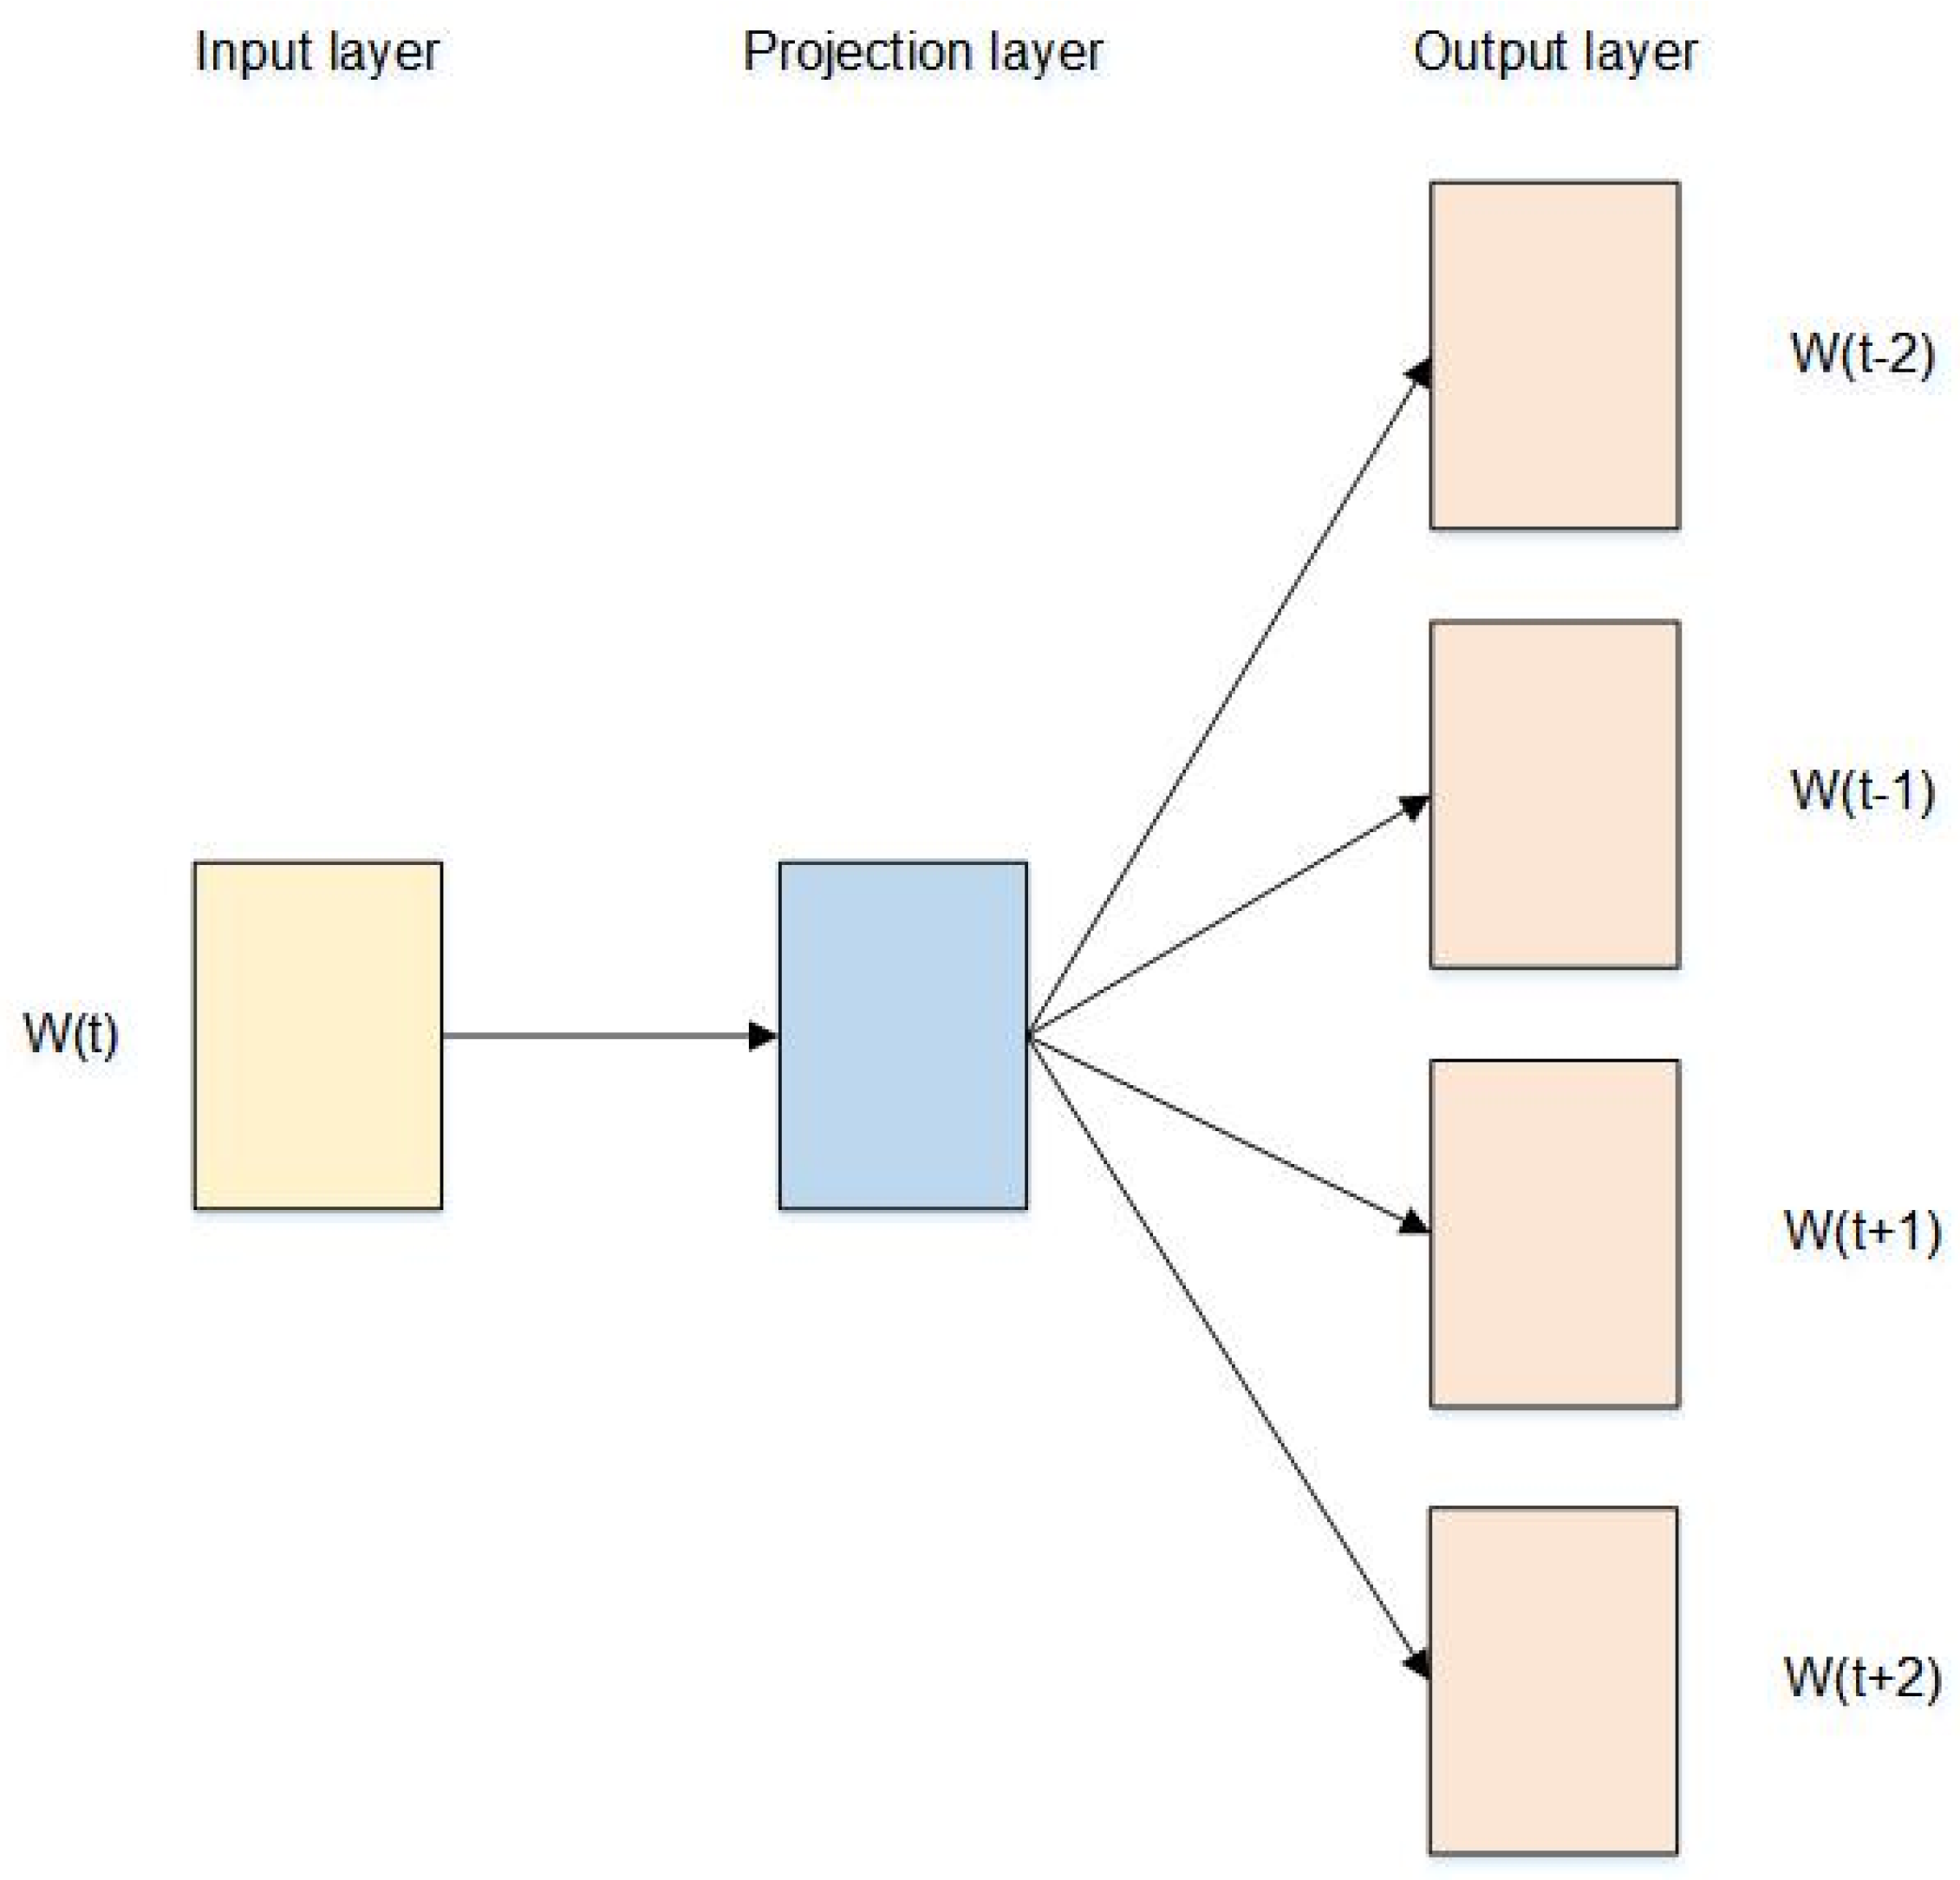
In the field of natural language processing, the word vector model is used to calculate the distance between words. Usually, two words that are close in the distance are also highly correlated, thus realizing the expansion of feature word collocation. The commonly used word vector model contains CBOW (continuous bag of words) and Skip-gram models. For data with less than 100 million words, the performance of the skip-gram model is better [
25], therefore, this study uses the skip-gram model to calculate the phase between the relevance of words. The structure of the model is shown in
Figure 4. The frontal context information is predicted by the current word W(t) for the etymological sequence in which the word resides.
2.4. Image Data Classification Model
Compared with social media text data, images convey information as more objective and valuable. Contrary to a few studies that have utilized graphical data for natural disaster damage assessment, this study uses image and text data for multimodal data analysis, to make damage assessment more objective and accurate.
Image data are processed by converting the image into a digital feature vector, and, then, using the classifier for image classification. The classifiers are responsible for different tasks that define the semantic hierarchy.
In this study, Vgg-16 was used to extract the image features. VGG-16 is a classic CNN network of convolutional neural networks. The VGG-16 convolutional neural network uses the small convolution kernel 3 × 3 and the largest pooling layer 2 × 2. The model stacks the convolutional layers several times the number of layers in the standard CNN model. With the maximum pooling layer, the parameters can be reduced, the number of calculations can be reduced, and the model’s ability to express nonlinear data can be improved [
26].
The structure of the image feature extraction model based on Vgg-16 is illustrated in
Figure 5. The input of the Vgg-16 network was fixed in size as 224 × 224. Opencv is an open-source computer vision library that utilizes the resize function, which uniformly scales the images of the dataset to 224 × 224, which can be input to the VGG-16 network.
The remaining network structure of the original VGG-16 model is encapsulated in the Keras deep learning library, except for the fully connected layer. To realize the feature-based transfer learning method in the homogeneous space, we choose the VGG-16 model parameters pre-trained by ImageNet as the initial value of the feature extraction model; that is, the weight parameters of VGG-16 is set to “image net”. The flattened layer is used to make the multi-dimensional input one-dimensional, and, then, input the one-dimensional vector into the dense layer using ReLu as the activation function. The dropout layer is, finally, added to obtain the image feature extraction model based on VGG-16.
AdaBoost Classifier
In this study, we switched the softmax classifier from the original model of Vgg-16 to an AdaBoost classifier with better classification performance. The working principle of the Adaboost classifier is to train multiple different weak classifiers from a training set and retrain them each time, by combining the last training sample with the new sample to obtain a new classifier, finally forming a stronger classifier for the model classification. The AdaBoost iteration algorithm was divided into three steps.
- (1)
Initialize the distribution of weights for the training data. If there are N samples, each is given the same weight at the very beginning: 1/N.
where
w1i is the weight of the sample,
D1 is the set of the weights.
- (2)
Train weak classifiers. In the specific training process, if a sample point has been accurately classified, its weight is reduced in the construction of the next training set; however, if a sample point has not been accurately classified, its weight is increased. Then, the sample set with updated weights is used to train the next classifier, and the entire training process proceeds iteratively in this manner, where m = 1, 2, …, M is used to indicate the number of iterations.
- (3)
The weak classifiers obtained from each training session were combined into a robust classifier. After the training process of each weak classifier is completed, the weight of the weak classifier is increased with a small classification error rate, to make it play a more significant role in the final classification function and reduce the weak classifier with a significant classification error rate. Weight plays a minor decisive role in the last classification function. In other words, a weak classifier with a low error rate occupies a more significant weight in the final classifier; otherwise, it becomes smaller.
2.5. Emergency Severity Assessment Based on Entropy Method
In this paper, social media related to events are grouped by day, and the entropy method is used to evaluate the severity of emergencies. It is mainly used to judge the degree of dispersion of a certain indicator. The calculation process for assessing the severity of emergencies in this study is as follows:
where
Xi is the data after standardized processing, the range of values of
i is from 1 to
n, and
n is the number of samples.
where
pi is the proportion of the
ith sample value.
where
fi is the entropy of the
ith indicator,
k = 1/ln(
n).
where
di is the redundancy of information entropy.
where
Wi is the weight of indicators.
where
F is the severity of the emergency.
3. Research Result
In this study, we develop the crawler program based on Python and use “Henan rainstorm” as the keywords to obtain a total of 28,099 pieces of data from 0:00 on 18 July 2021 to 23:00 on 30 July 2021. We count the number of social media posts per day during the heavy rains in Henan, and the statistical graph of the number of tweets based on time is shown in
Figure 6. Since the night of 17 July 2021, heavy rains began to attract widespread public attention, and on 20 July 2021, the emergency response level was elevated from level IV to level II by the Henan Provincial command on drought resistance, due to the severe prevention situation. According to the statistics in
Figure 6, the number of microblogs started to rise significantly on 20 July in response to the increasing severity of the forms of flooding; the mobile communication network of the province was fully restored and the supply of water was restored in most areas starting on 25 July. Thus, the public concern for heavy rains in Henan gradually declined as typhoon “fireworks” on 27 July affected Henan; as a result, the number of microblogs showed an obvious upward trend. Thus, the temporal trend of microblog data largely coincides with the real-time occurrence of the event, suggesting that Sina’s original information on microblogs has usage value when a major emergency occurs.
3.1. Topic Mining
This study extracted 2219 pictures related to the Henan rainstorm from Weibo and randomly selected 20% of the pictures as the test set, with the remaining 80% of the pictures as the training set. The image annotation results obtained using the LDA model are listed in
Table 4. The image size was set to 224 × 224 × 3, obtaining an average number of annotated words per picture of 4.5. The average number of annotated images for each annotated word is 58.6. A total of 170 annotated words in the image set and annotated words with fewer annotated images were eliminated, while the remaining 120 words formed the label vocabulary.
In
Table 4 deduplication, Chinese word segmentation, stop word removal, and emoji preprocessing were performed on the 25,880 Weibo datasets obtained from Weibo. The vocabulary expression of each Weibo dataset was obtained, and the data were manually labeled to obtain the corresponding Weibo vocabulary collection and emergency themes. To verify the accuracy of the model classification, 20% of the samples were randomly selected as the test set and the remaining 80% were used as the training set. Using the LDA model as the topic classification model, the topic distribution of the sample documents and the respective feature vocabulary distributions of all the topics were obtained. Some of these themes are shown in
Figure 7.
Through thematic classification of text data, we finally got 40 thematic categories, as shown in
Figure 7. Through lexical analysis of thematic distribution, we merge similar topics manually, such as both topic 29 and topic 33 discussion themes were about the losses and impacts caused by heavy rains in Henan. Therefore, we combined similar themes, and obtained 40 thematic categories combined to get “weather warning”, “traffic situation”, and six emergency-information-related topics including “rescue information”, “disaster information”, “disaster cause”, and “casualties and losses”. The classification of their topics is shown in
Table 5.
3.2. Disaster Type Classification as Well as Severity Information
Weibo data were classified according to the subject classification results, which ultimately yielded the natural disaster situation for each region of Henan.
Figure 8 presents the number of subject social media during heavy rains in Henan.
Figure 9 presents the change in subject microblogs overtime during heavy rains in Henan. As shown in
Figure 8 and
Figure 9, little attention has been paid to weather warnings during heavy rains, though it began on 19 July. Henan experienced a heavy storm; people started to release weather warning information via Weibo, so the number of Weibo posts with a weather warning on 19 July was significantly more than that of other subjects, and on 27 July the typhoon “fireworks” affected Henan, so the number of microblogs regarding weather warning increased on 27 July. With the development of catastrophes, the number of microblogs regarding disaster information rapidly increased on 19 July. On 24 July, as rainfall declined, people’s concerns about disaster information gradually decreased. Heavy rain caused huge damage to Henan; therefore, it can be seen in
Figure 8 that people discussed was mainly focused on rescue information and casualty loss. From 20 July, there was an explosion of social media about rescue information and casualty loss. The concern about rescue information, casualties, and loss was much higher than for other topics throughout the storm. On 26 July, as rainfall decreased, concerns about rescue information, casualties, and loss began, and the degree showed a decreasing trend. People’s attention to traffic information and the causes of disaster situations during heavy rains was generally low, and there were a few discussions about disaster information and traffic information during the period of storm disaster emergencies from 21 July to 22 July. Therefore, during heavy rains in Henan, people paid more attention to rescue information and the relationship between casualties and loss situations.
When natural disasters occur, we need to focus on the geographical distribution of disaster occurrence and disaster severity. Therefore, we fully mined the geographical location information in Weibo tweets, as shown in
Figure 10 and
Figure 11, as a regional distribution map of social media as well as a map of social media quantity distribution. As can be seen in
Figure 10 and
Figure 11, there were relatively more heavy-rain-related Weibo numbers released from the Zhengzhou and Xinxiang regions during the heavy rains in Henan. Second, Hebi, Anyang, and Luoyang released a certain amount of Weibo posts about heavy rain.
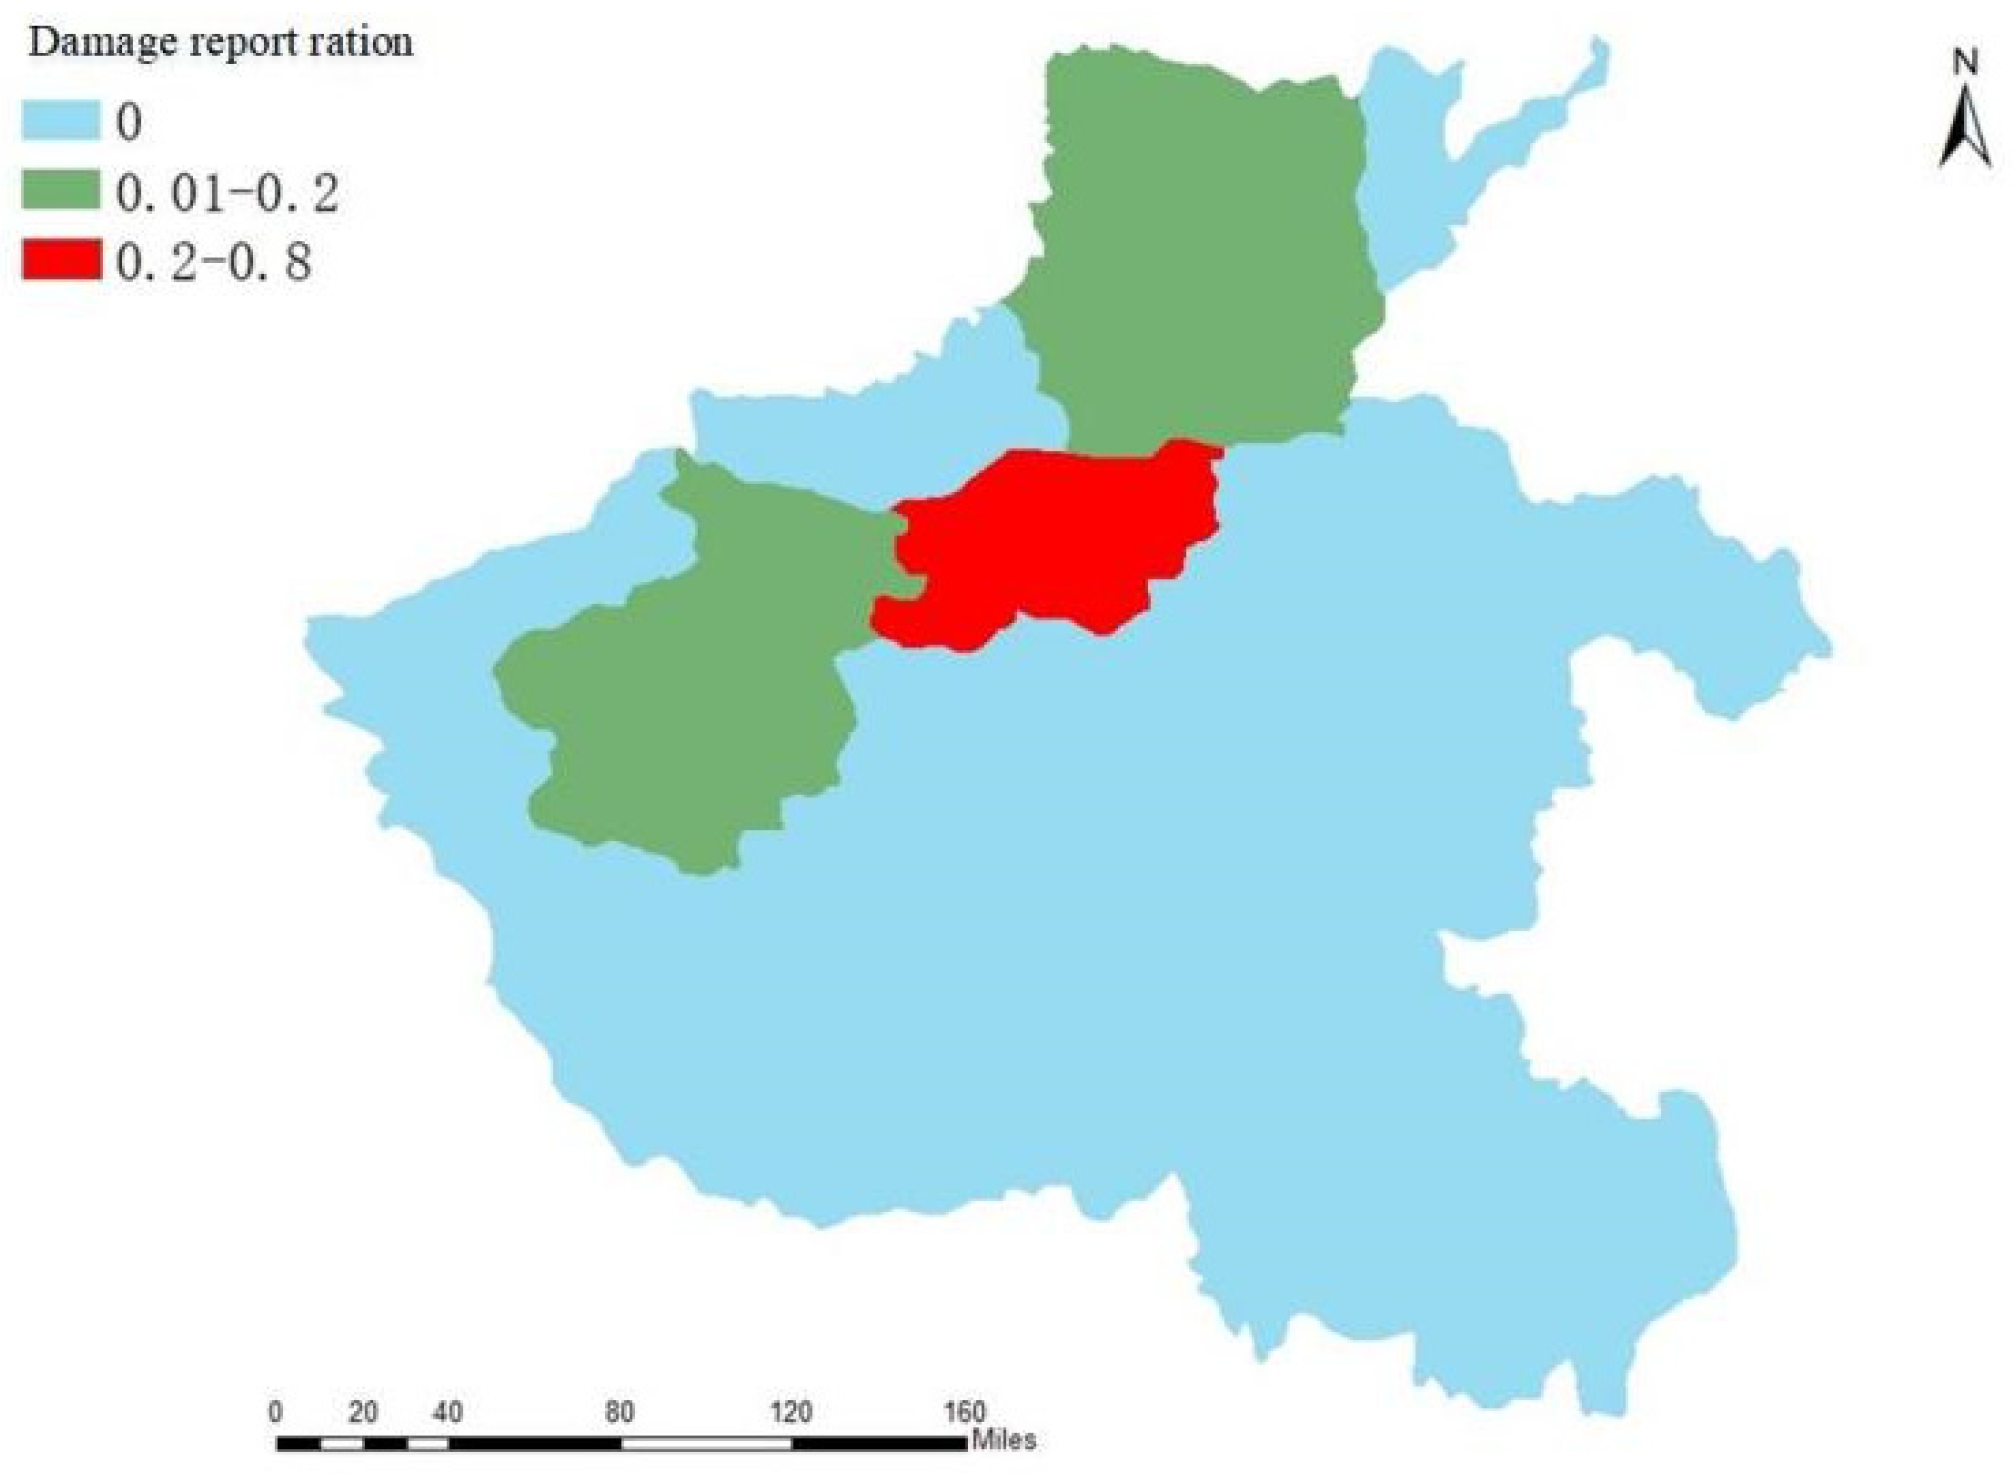
Figure 12 calculates the damage reporting ratio for all tweets in each city. In the work of Zou et al., the damage reporting ratio is considered as the ratio of disaster-related tweets to the total number of tweets, which is the damage severity metric: its value range is 0–1. Based on the data contrasted in
Figure 10,
Figure 11 and
Figure 12, on the one hand, the number of Weibo posts in each area is related to the severity of the rainstorm; on the other hand, it is related to the population density of the city. Zhengzhou is subjected to heavy rains during heavy rainfall. There are heavy rains affecting 10.352 million people, simultaneously, in Zhengzhou. Thus, Zhengzhou released the largest number of microblogs, at the same time that Xinxiang City was severely affected by heavy rains, but the population of Xinxiang was 6.043 million people. Thus, the number of microblogs in Xinxiang with regard to heavy rains is less than that of Zhengzhou. At the same time, Anyang City, Hebi City, and Luoyang City were all seriously affected by heavy rains. However, the population of Anyang City is 5.192 million, that of Luoyang City is 6.69 million, and that of Hebi City is 1.609 million. Therefore, the population of Hebi City is significantly lower than that of Hebi City and Anyang City. Although Hebi City, Anyang City, and Luoyang City have almost the same number of microblogs as rainstorms, it can be inferred that Hebi City is affected more by rainstorms than Anyang City and Luoyang City.
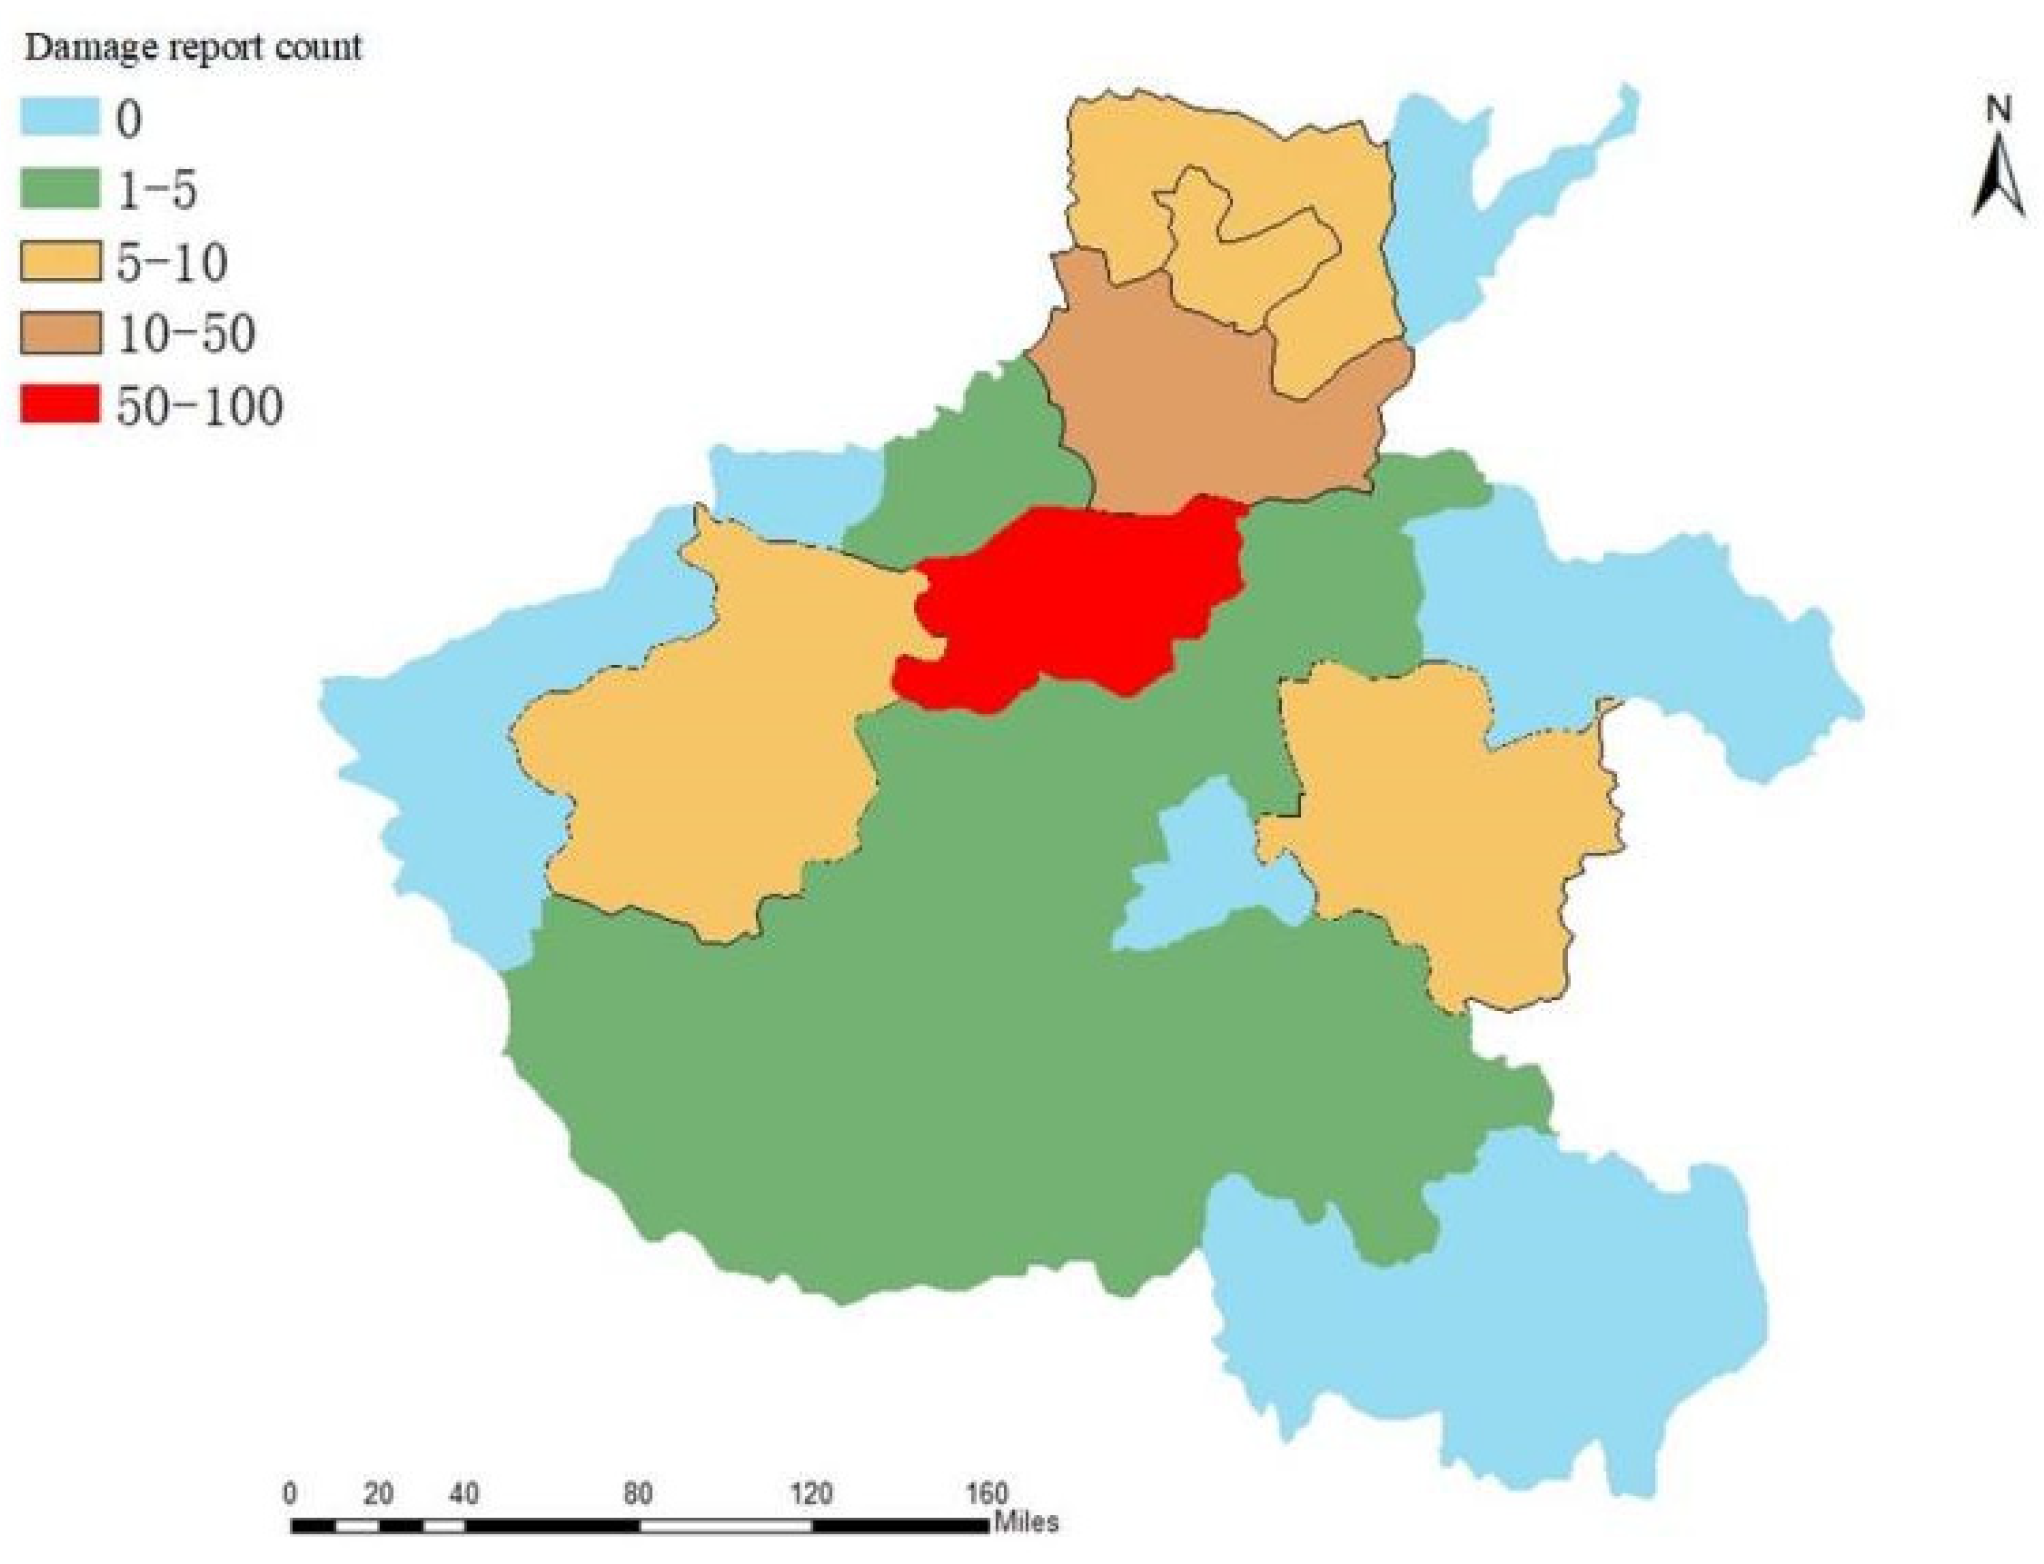
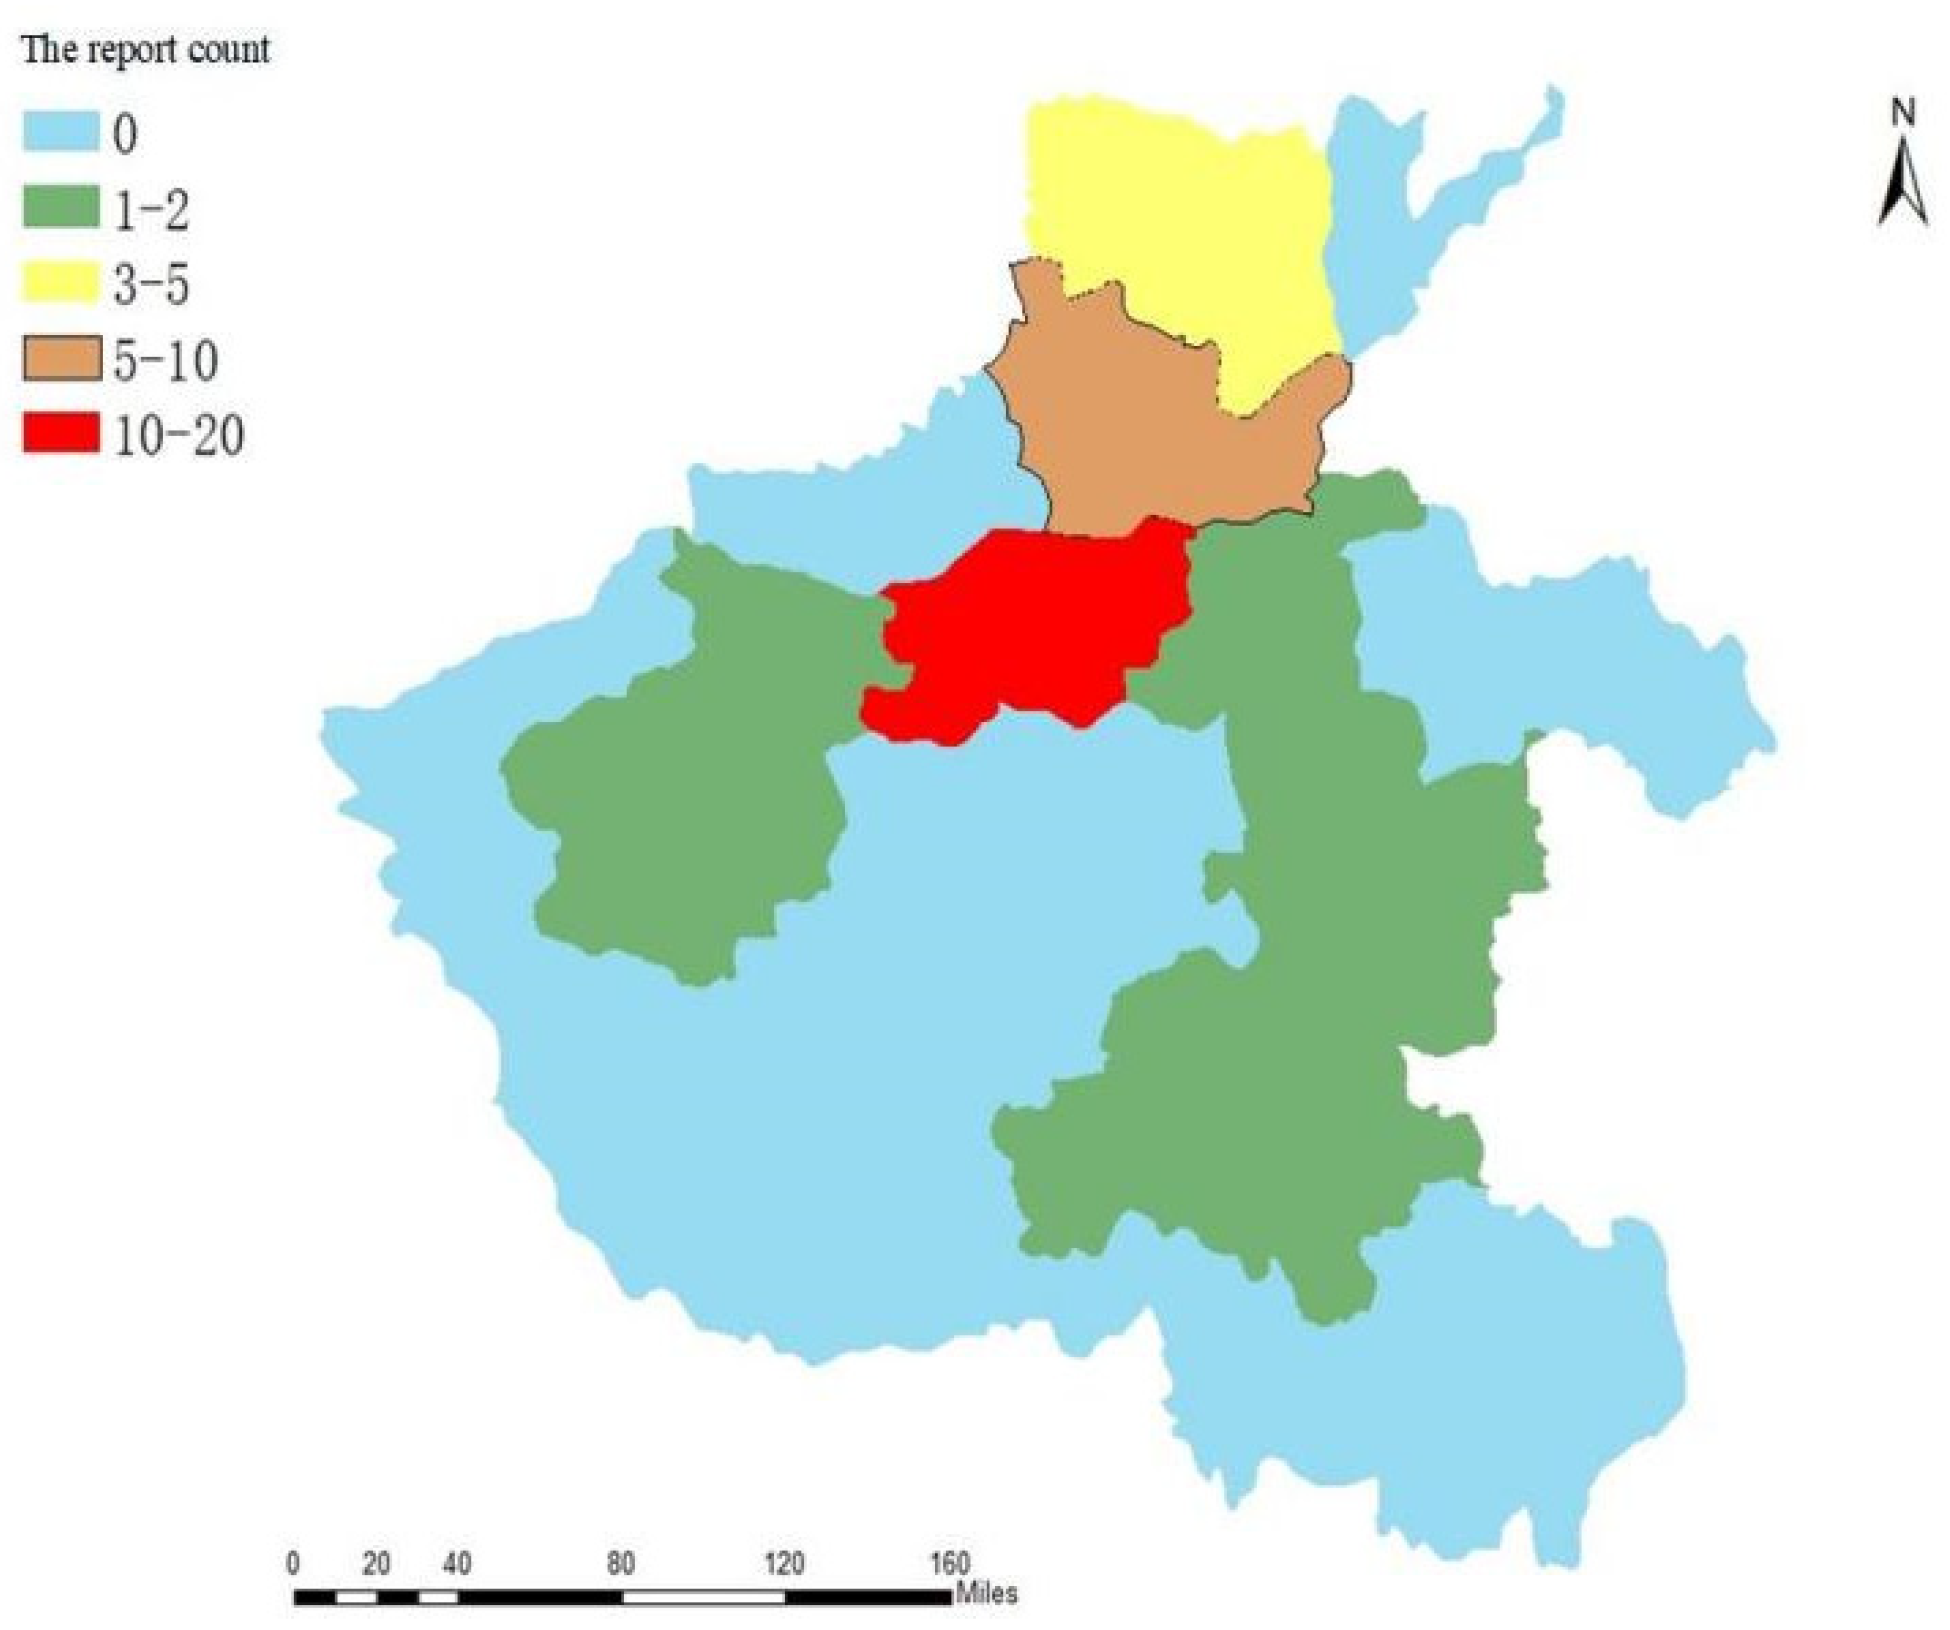
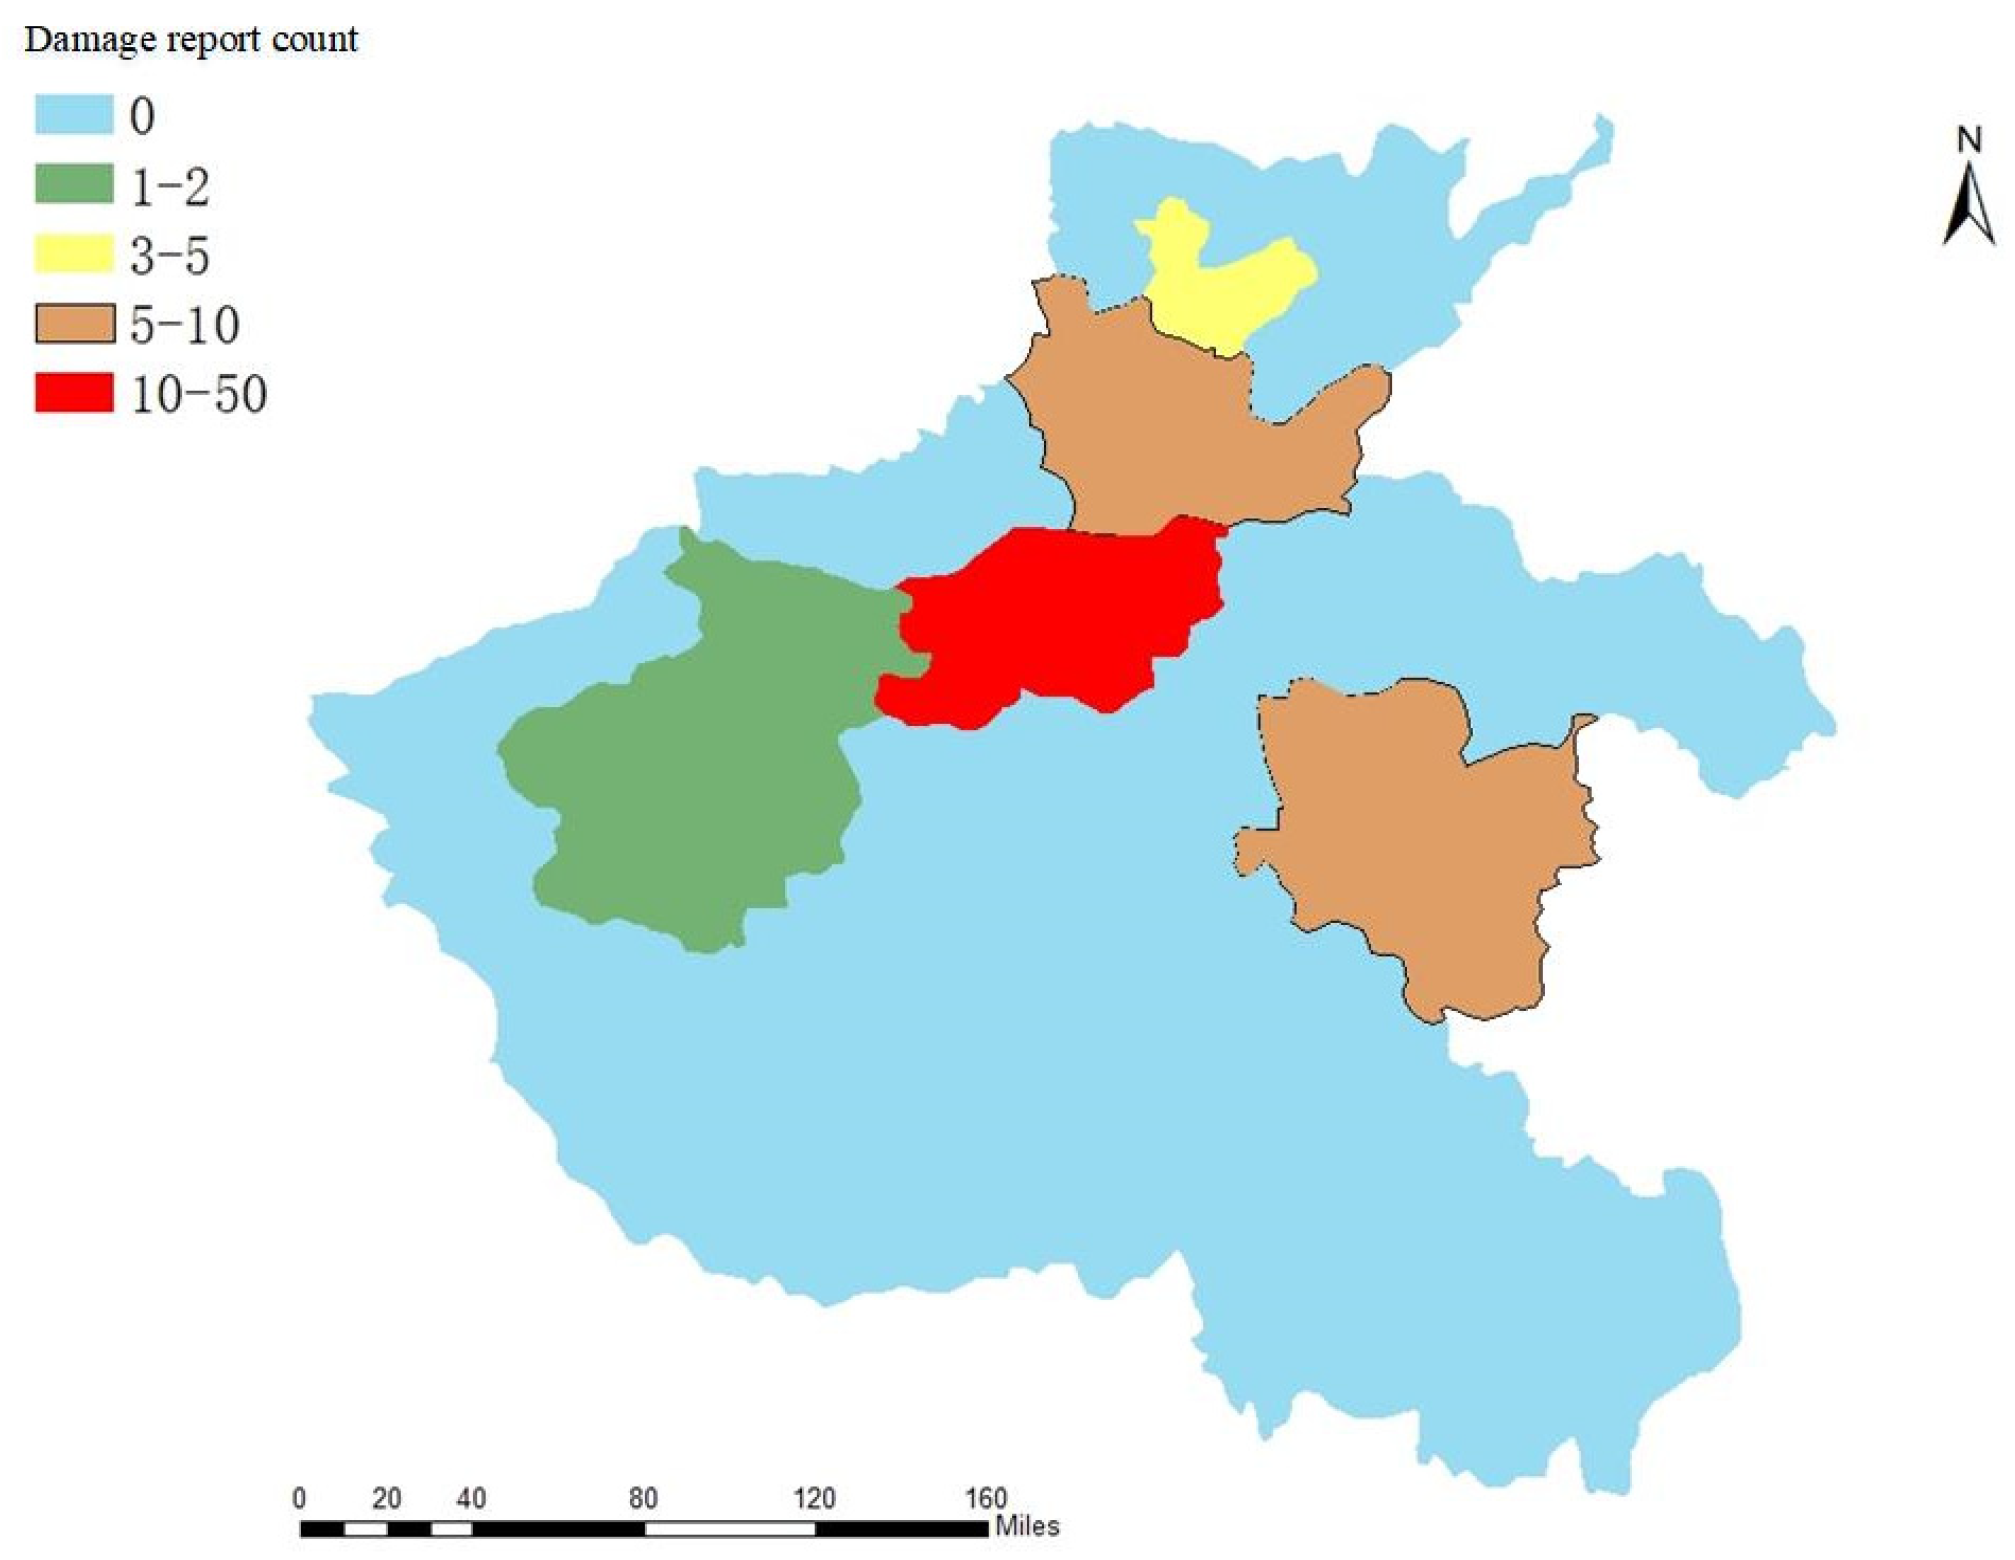
Since more attention has been paid to rescue information as well as casualties and loss information during heavy rains, the geographical location of the rescue information as well as casualty and loss information are discussed separately in this paper.
Figure 13 and
Figure 14 show the regional distribution plots of microblogs, with respect to rescue information during heavy rains, as well as the distribution plots of microblog numbers.
Figure 13 and
Figure 14 show the microblog area distribution map and the number of microblogs about rescue information during the heavy rain; the number of rescued information microblogs are larger, and there are few discussions about rescue information. The population size of Zhengzhou is 10.352 million, the population size of Xinxiang is 6.043 million, the population size of modification is 6.922 million, the population size of Anyang is 5.19 million, the population size of Zhoukou is 8.8 million, the population size of Zhu median is 6.89 million, and the population of Hebi City is 1.6 million. According to the ratio of the number of microblogs related to rescue information in
Figure 15, we can infer that Zhengzhou City, Xinxiang City, Hebi City, and Anyang City are comparable, although the number of microblogs related to rescue information in Hebi City is slightly less than in Anyang City, though the population of Hebi City is significantly less than Anyang City, so the rescue demand in Hebi City is higher than Anyang City; at the same time, Luoyang City, Kaifeng City, Zhoukou City, and Zhumadian City have issued a certain amount of rescue information, and we need to pay attention to the rescue needs of the area.
Figure 16 and
Figure 17 show the Weibo area distribution map regarding casualties and losses during heavy rain and the distribution map of the number of Weibo posts.
Figure 16 and
Figure 17 show that Weibo posts about casualties and losses are mainly concentrated in the Zhengzhou area, followed by a certain number of Weibo posts in Xinxiang and Zhoukou City, while Hebi and Luoyang also made Weibo posts about casualties and losses. By comparing the casualty and loss ratio chart in
Figure 18, we can infer that the Weibo posts of casualties and losses are mainly concentrated in Zhengzhou City because Zhengzhou City experienced a greater impact from heavy rains, and Zhengzhou has a large population. At the same time, Hebi and Anyang had a small number of casualties, and loss microblogs were posted in Zhumadian and Luoyang. It can be seen that the number of casualties and loss microblogs is related to the severity of the heavy rains in each city and the population density. At the same time, compared with the number of rescue information microblogs, the distribution of casualties and losses was more concentrated in Zhengzhou. This is because during heavy rains, people use microblogs to seek help and find missing persons, and such microblogs attract more public attention. A large number of reposts were generated. Therefore, the Weibo location information of casualties and losses is more accurate and concentrated.
3.3. Evaluating Indicator
Classification performance was evaluated by precision, recall, and F1-score. Three indicators were used to measure the accuracy of the proposed classification method. The accuracy of the calculations for each category is presented in
Table 6. From the perspective of accuracy, recall rate, and F1-score, most of them are above 0.8, indicating that most of the disaster themes can be correctly identified, and that the method used in this study has a comparative advantage. A good classification effect exists, but the poor performance of the recall rate of the weather warning category is due to a large amount of weather warning information being misidentified. This may be because of two reasons. On the one hand, the number of Weibo posts related to weather warnings is small; on the other hand, the content of Weibo posts related to weather warnings is relatively complicated and may contain various types of information, resulting in misidentification from the text.
We collect 25,880 tweets from Weibo. We perform the following standard text preprocessing steps: (1) remove the content on Weibo that is not related to the rainstorm in Henan; (2) classify the remaining text by topic; and (3) manually read and mark 3000 texts as training samples for the Bert model.
All images are resized to (224 × 224 × 3), which is the input size that Vgg-16 needs. In the dataset, 20% of samples are used to evaluate the performance of models, and the remaining 80% of them are used for training.
To prove the effectiveness of the model proposed in this study, we compare the model with several traditional models and several state-of-the-art models on our dataset. In contrast, the classification performance is measured by three indicators: accuracy, recall, and F1-score, which are shown in
Table 7.
Table 7 displays the performance of all the compared models in three categories: (1) text-based networks: the model is listed in No.1 in the table. The model was designed based on the encoder of bidirectional transformer. They were trained from scratch on our dataset; (2) imaged-based networks: these models are listed from No.2 to No.3 in the table. In our experiment, these models were initialized with weights learned from ImageNet and fine-tuned with our dataset; and (3) multimodal-based networks: these models are listed from No.4 to No.6 in the table, which uses both image and textual information for the model training. These models were also trained entirely on our dataset. The performance of our multimodal network is listed in the last line of the table.
Based on the testing results in
Table 7, we have several observations: (1) our proposed network outperforms the other multimodal based networks; (2) modes that leverage multimodal information perform better than only considering single modal information; and (3) image-based models perform better than text-based models. This is reasonable since image information is more intuitive and clearer.
3.4. The Severity Assessment of Emergencies
According to the description of the entropy method in the research, the study calculates the weights, then, we convert the indicators so that the larger of the F values represents a higher severity. At last, we expand the value of F to 100 times, thus, its range of values is transformed into [0, 100].
According to
F values, the study set the severity assessment levels in
Table 8.
As shown in
Table 9 the study judges the severity of the event, it takes the highest value of the event in the whole time period as the final evaluation level. The experiments have shown that the highest score of weather warning is 38, and the corresponding severity level is II. The highest score of traffic condition is 6, and the corresponding severity level is /. The highest score of rescue information is 73, and the corresponding severity level is ΙΙΙ. The highest score of disaster information is 49, and the corresponding severity level is ΙΙ. The highest score of the cause of the disaster is 19, and the corresponding severity level is Ι. The highest score of the casualties and losses is 81, and the corresponding severity level is ΙΙΙ.
When the post rate is less than 100, the retweet rate is less than 500, the comment rate is less than 1000, and the like rate is less than 2000, the event may be in the initial period or recession. However, we need to pay special attention to the double growth of these indicators: if they suddenly increase exponentially, the event is deteriorating.
When the post rate is between [100–300], the retweet rate is between [500–1000], the comment rate is between [1000–2000], and the like rate is between [2000–6000], the event may be in the period of outbreak and spread. At this time, the impact on the severity of emergencies tends to be general, so in order to avoid further deterioration of the incident, the government needs to start the yellow warning in time.
When the post rate is more than 300, the retweet rate is between [1000–3000], the comment rate is between [3000–6000], and the like rate is between [8000–80,000], the event may be in the period of outbreak and spread. At this time, the impact on the severity of emergencies tends to be medium, so the government needs to start the orange warning in time.
When the post rate is more than 500, the retweet rate is more than 3000, the comment rate is more than 6000, and the like rate is more than 80,000, the event may be in the period of outbreak and spread. At this time, the impact on the severity of emergencies tends to be serious, so the government needs to start the red warning in time.
4. Conclusions
In recent years, the acquisition and analysis of disaster information have become key issues for government and scientific research institutions. Social media data can enable officials and victims to be the truth and disseminators of natural disaster information, simultaneously, and social media data have the advantages of real-time and low latency. Therefore, social media has become an important source of natural disaster information. With the development of technology, scholars have optimized the methods for studying natural disaster information.
This study uses a classification model based on LDA and a multi-classification model based on Bert and Vgg-16, which are suitable for short-term social media and other types of disaster events that have caused a large-scale sensation.
In this study, we first used a web crawler combined with the Weibo API to obtain the text and graphic data for subsequent processing and classification. The LDA model was used to classify and identify topics related to emergencies. Based on the data characteristics of text and images, this study constructed a network framework suitable for microblog text and image disaster extraction. After optimization operations, such as control over-fitting and grid-parameter optimization, the accuracy of the model on the test set was improved, and the classification accuracy reached more than 80%. The results of the verification on the newly acquired Henan torrential rain dataset in 2021 further show that the application of the model to disaster information classification has a certain degree of accuracy. Finally, through the visualization and statistical analysis of the data, it was found that the disaster information is consistent with the actual disaster development stage, which shows that the method proposed in this study is effective in monitoring Henan rainstorm disaster events and can effectively help in official disaster decision-making.


