Article

Social Media and the Pandemic: Consumption Habits of the Spanish Population before and during the COVID-19 Lockdown

by
Diego Gudiño
1,
María Jesús Fernández-Sánchez
1,
María Teresa Becerra-Traver
1 and
Susana Sánchez
2,*
1
Departamento de Ciencias de la Educación, Facultad de Educación, Universidad de Extremadura, Avda. Elvas s/n, 06006 Badajoz, Spain
2
Departamento de Psicología y Antropología, Facultad de Educación, Universidad de Extremadura, Avda. Elvas s/n, 06006 Badajoz, Spain
*
Author to whom correspondence should be addressed.
Sustainability 2022, 14(9), 5490; https://doi.org/10.3390/su14095490
Submission received: 31 March 2022 / Revised: 28 April 2022 / Accepted: 29 April 2022 / Published: 3 May 2022

Abstract

:
The confinement of the Spanish population due to the COVID-19 pandemic triggered a change in patterns of electronic device usage, leading to an increase in internet traffic. This study sought to evaluate the use of social media by the Spanish population before and during the COVID-19 lockdown. An extensive ad hoc questionnaire was prepared and distributed to a total of 397 people of different ages from different Spanish provinces. The questionnaire was previously validated and was found to be reliable. The results showed that during the lockdown, the most frequently used social networks were WhatsApp and Facebook, although others, such as Telegram and TikTok, also experienced a significant increase in user registrations. There was also an increase in the number of hours spent per week using social media, especially Facebook, WhatsApp and YouTube, to share images, videos and audio messages, with a significant increase in document sharing and knowledge acquisition. The final section discusses some of the results and concludes by highlighting the importance of analyzing social behavior in times of crisis in order to design more effective and personalized communication strategies.

1. Introduction

The COVID-19 global pandemic has led to changes in media consumption. According to McQuail and Windahl [1], people’s dependency on the media tends to increase during times of conflict or instability. Such was the case during the SARS crisis in China in 2003, during which, the internet became one of the main sources of information [2]. During the months-long lockdown in various parts of the world, the media not only became a way to obtain up-to-date information but some media, such as social networking sites, also allowed citizens to communicate virtually, perform transactions, complete work or academic tasks and entertain themselves, thus helping them to cope with the negative psychological impact of isolation [3,4].
Some studies that focused on the use of technological media also alluded to an upturn in the use of more traditional media; in times of crisis, people turn to resources such as the press, radio and television [5]. This preference is likely to be due to the high credibility this type of media enjoys compared to other less traditional media [6]. A study carried out by Rodero [7] with 560 participants of all ages who regularly listened to radio shows concluded that opinions regarding this medium were bolstered during the lockdown, with 40% of those surveyed improving their assessment. The participants indicated that during the pandemic they increased the number of hours they spent listening to the radio on average and changed their listening habits, listening to different stations and shows and at more varied times than in normal circumstances. More specifically, interest in news and audiobooks increased, while the consumption of music (YouTube was used more) and sports-related content decreased. Compared to other media, it was observed that the use of the internet, newspapers and social media decreased during the lockdown, while the consumption of radio and television increased. Increased television consumption was also documented in a study by Blasco et al. [8]. A total of 1500 participants of all ages completed a questionnaire during the first days of the lockdown in Spain. Although the results showed that radio consumption did not increase during the lockdown, it is worth noting that it was considered the most credible means of communication. Nielsen et al. [9] indicated that radio was less frequently used than newspapers, with television and digital media being the most popular forms of access, although they noted that the preferred media varied depending on the age of the user, with older people using television and radio, while younger people preferred to use social media.
Several studies have documented internet traffic and digital media consumption during the months of the confinement measures imposed in different countries. For example, Ahmad et al. [10] conducted a study in Malaysia that found that social media was an important tool in reducing population anxiety. In addition, television and daily press conferences were used to keep themselves updated on COVID-19. In China, a study involving 2050 students aged 6 to 18 years was conducted, where excessive internet use was observed during the lockdown [11]. Luo et al. [12] also found that the pandemic increased social media use in China, concluding that 40% of the 10,963 participants increased social media use by three and a half hours per week.
Similar findings were obtained in European countries. A study in Switzerland found that children and teenagers with psychiatric problems increased their use of social media during the lockdown according to the perceptions of 477 parents who completed an online survey [13]. About 37% of the patients increased their use of social media, television, consoles, etc., by nearly three hours per day. This increase was especially pronounced in the case of smartphones, followed by tablets and PCs. TV and video games were used the least, although participants who already played video games slightly increased the time spent and some people who previously did not play video games began playing. Social media use also increased, with nearly 5% more of the participants using social media for more than six hours. After the lockdown, in most cases, the time spent using these media returned to previous levels, although it remained slightly higher for men. Kaya [14] conducted a study in Cyprus with 668 participants of all ages who completed an online questionnaire on the lockdown. The results also showed different use than before the confinement period, highlighting that users kept themselves informed regarding the pandemic through social media and there was high awareness of the problem of fake news. Meanwhile, Trevisan et al. [15] carried out a study in Italy that analyzed posts and comments during the months of the lockdown to see whether there were changes in the use of Instagram and Facebook. The results showed a generalized increase in the volume of posts, comments and reactions. In Germany, a total of 3245 participants of varying ages completed a survey during the lockdown, with 71.4% reporting increased consumption of online media (games, social media, etc.) [16].
As for the social media most frequently used during the lockdown in Spain, Facebook was the most popular, although Twitter, YouTube and Instagram also stood out. However, WhatsApp was used more than Facebook to share conversations about the coronavirus [9]. González-Andrío et al. [17] carried out a study involving 127 university students, 95.05% of whom were Spanish, and found that the most commonly used social network was WhatsApp, followed by Instagram, Facebook and YouTube. They used these sites three to four hours per day for numerous purposes: communication mainly with friends (and to a lesser extent with partners and family), listening to music, sharing photos, organizing trips, and other professional and academic uses. As far as educational purposes are concerned, the study results of Abdelazim et al. [18] showed that communication activities need to be modernized by employing modern technologies. Al-Qaysi et al. [19] found that WhatsApp was the most common application. However, the study reported the barriers faced by the students while using social networks, such as distractions, time-wasting or shortage of internet access.
However, the use of these media can become problematic. Cívico et al. [20] performed a study of ICT use before and after the lockdown in which the participants, namely, the families of 147 university students in Malaga, complained mainly about the increased use of smartphones and instant messaging as opposed to video games. Before COVID-19, they had already observed problematic use, but after the outbreak of the pandemic, the problem worsened. According to Hormes [21], excessive use of social media can have harmful effects on personal, social and professional lives. The fundamental reason is that people can lose sight of their priorities in life and they may become indifferent to family and friends [22] and react negatively if restrictions are placed on the use of social media [23]. This ill feeling can translate into high levels of anxiety [24] and even depression [25]. At times, news items of questionable accuracy [26] may be viewed and shared, which, in nearly half of the cases, are posted by fake profiles [27]. Some of these news items shared by friends had information on theories regarding the origin of the virus, methods for its cure and measures taken by the government during the lockdown [28]. In this regard, Shimizu [29] concluded that misinformation and fake news during the outbreak of the COVID-19 pandemic exacerbated the racism and xenophobia suffered by Chinese visitors to Japan.
Studies also showed increased consumption of internet products, with internet traffic increasing during the months of the lockdown. Several studies carried out in different countries indicated that the prolonged use of social networks may be related to psychological disorders, which are added to those caused by social isolation due to the COVID-19 quarantines. It is important to explore the media consumption habits of the population in each context during the COVID-19 lockdown confinement in order to design more effective and personalized communication strategies in times of crisis. In Spain, several studies assessed the time of use of social networks during the COVID-19 lockdown. However, few studies with the necessary scientific rigor focused on Spanish society as a whole and compared the use of digital media before and during the lockdown in detail. Some of them used invalid and unreliable questionnaires or they explored the reason for the use of social networks only during COVID-19 lockdown, without establishing a comparison with the previous uses. The participants of several studies were teenagers or a special sector of the population; we have not located any study that explored the social media activities practiced by the entire Spanish population before and during the COVID-19 lockdown in detail. Therefore, the aim of this study was to assess the impact of COVID-19 on the use of social media among the Spanish population, comparing their use of social media before and during the lockdown. This study aimed to answer the following research questions:
How did the frequency of use of social media change among users in Spain before and during the lockdown? How did the frequency of use of technological devices change?
How did the activities on social media vary among users in Spain before and during the lockdown?

2. Materials and Methods

2.1. Participants

This study used non-probabilistic sampling. The participants consisted of a total of 397 people from different Spanish provinces selected by convenience. They were classified into five age groups ranging from 10–26 years through to 72–90 years according to the generations proposed by Vilanova and Ortega [30]. The 10–26 years age group had the highest number of responses (38.04%), while the 72–90 years age group had the lowest participation (6.80%). In all age groups, except for the 72–90 years age group, there was higher participation by women. Table 1 shows the distribution of the total sample.

2.2. Data Collection Process

A previously designed and validated questionnaire was applied, which was presented via a link in Google Forms. The data were collected from 10 May to 21 July 2020. At this time, the Spanish population was trying to overcome the first wave of COVID-19, which had reached its peak on 5 April 2020 after the application of measures as restrictive as the total confinement of the population. Some data-cleaning techniques, such as the list of values technique and the logical consistency technique, were used. Any participant that gave contradictory answers or was outside the response range was not taken into account.

2.3. Instruments

The questionnaire used for data collection consisted of closed-ended Likert-type questions based on previous studies on the subject [31]. It had a total of 15 questions grouped into the dimensions indicated in Table 2:
The questionnaire was assessed by experts (university professors working in educational technology) to validate its content, scoring the relevance and appropriateness of each of the items from zero to ten. The results obtained following the quantitative evaluation of the instrument by the experts were positive. The internal consistency was adequate, with a Cronbach’s alpha index value of 0.92. The statistical program SPSS v.25 was used to calculate this index.

3. Results

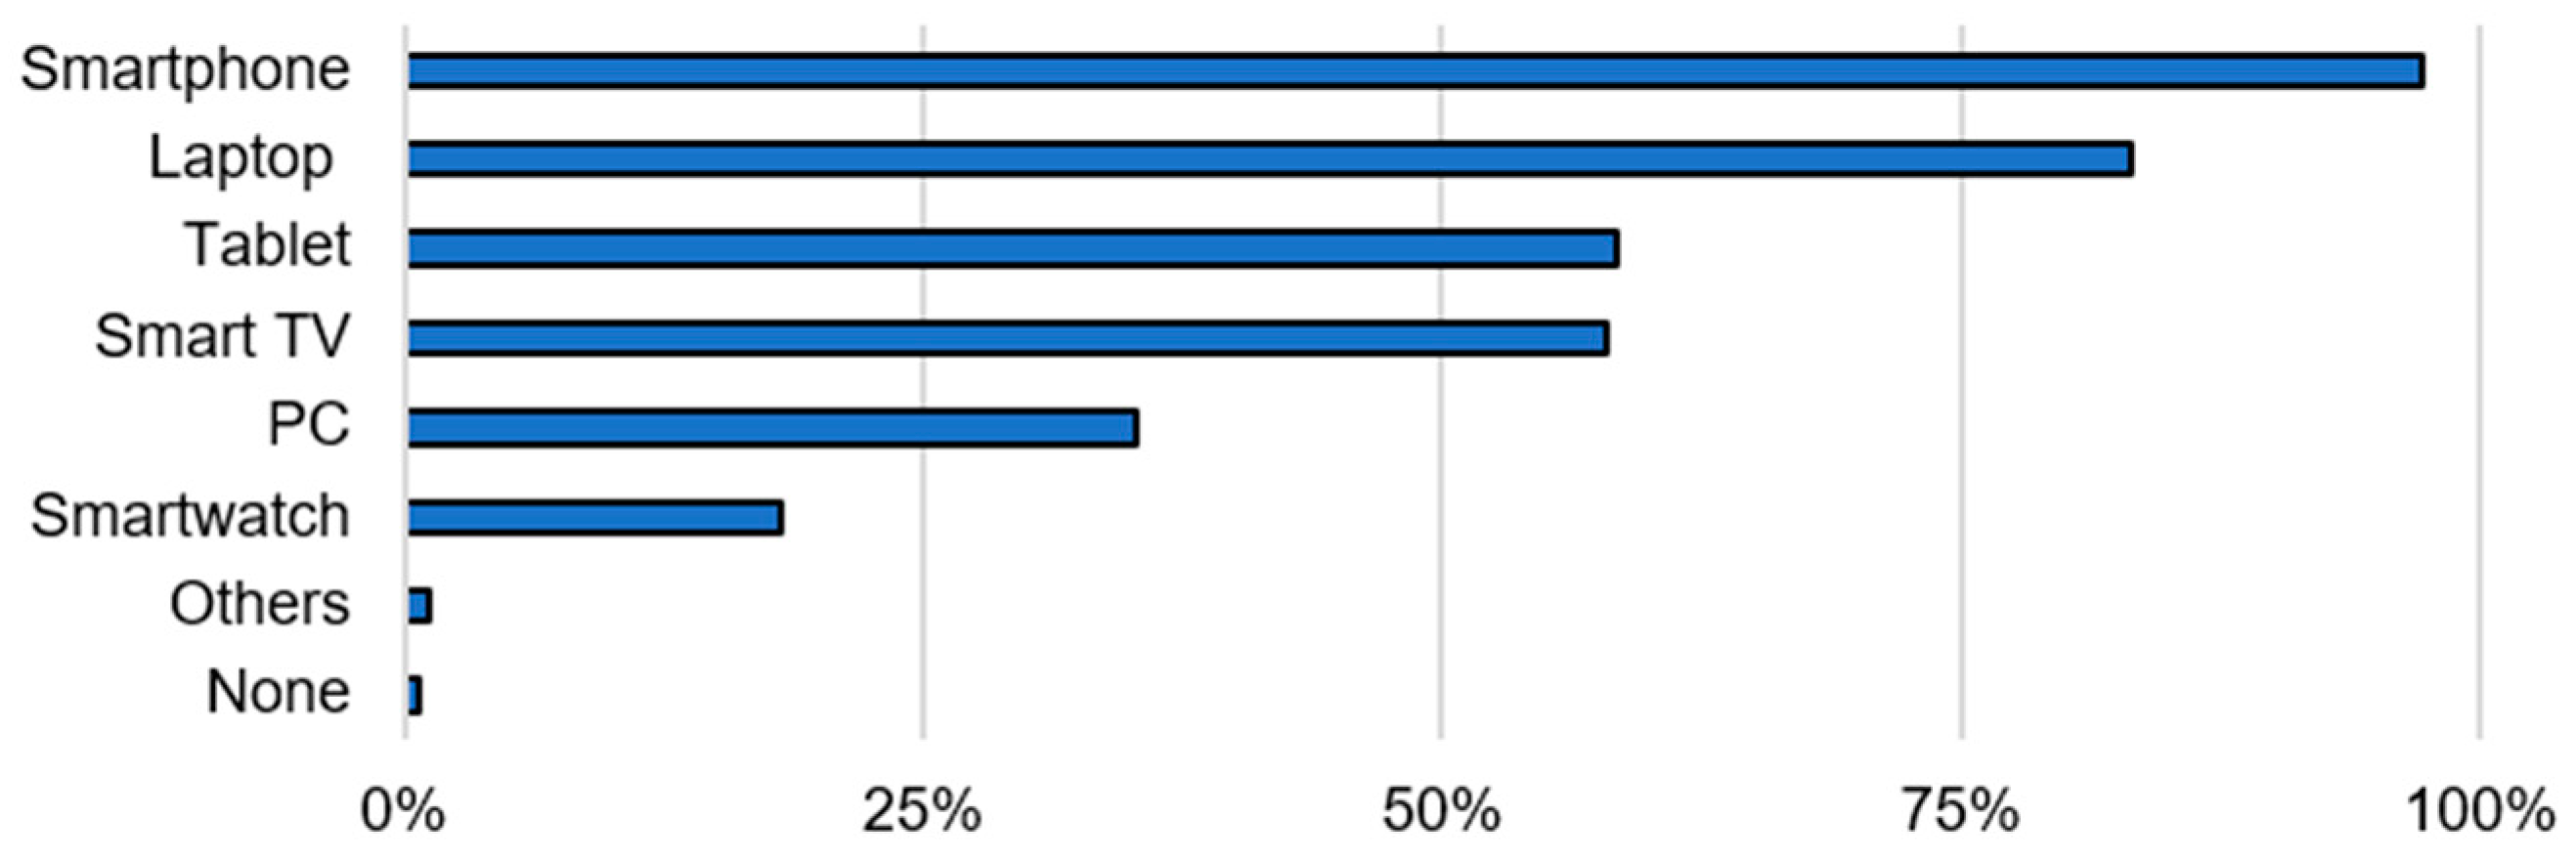
3.1. Access to and Frequency of Use of Technological Devices before and during the Lockdown

The results showed that only 0.8% of the participants did not have access to a technological device. In relation to the rest of the technological resources, the vast majority had a smartphone (97.2%) and a laptop (83.4%). It is also noteworthy that nearly 60% of the respondents had access to a tablet and nearly the same percentage owned a smart TV. These results can be seen in Figure 1.
With regard to the time spent using the devices, Table 3 shows that nearly all of them experienced a decrease in the number of users during the lockdown, except for smartphones, which maintained their levels of use, and computers, which increased in the number of users. The results also showed that for most of the devices, the percentages of users increased in the ranges for the highest number of hours of use, to the detriment of the percentages associated with ranges for fewer hours of use. For example, in the case of smartphones, the percentages of users increased in the three-to-five-hour range (nearly a 5% increase) and the over-five-hours range (more than a 10% increase) to the detriment of the one-to-two-hour range (10% decrease). Another of the most pronounced changes due to the COVID-19 pandemic was the use of laptops, with an increase in the more-than-five-hours range from 3.8% of participants before the lockdown to 17.6% during the lockdown. Tablets and smart TVs were also widely used during the lockdown, with usage increasing especially in the two-to-three-hour range.

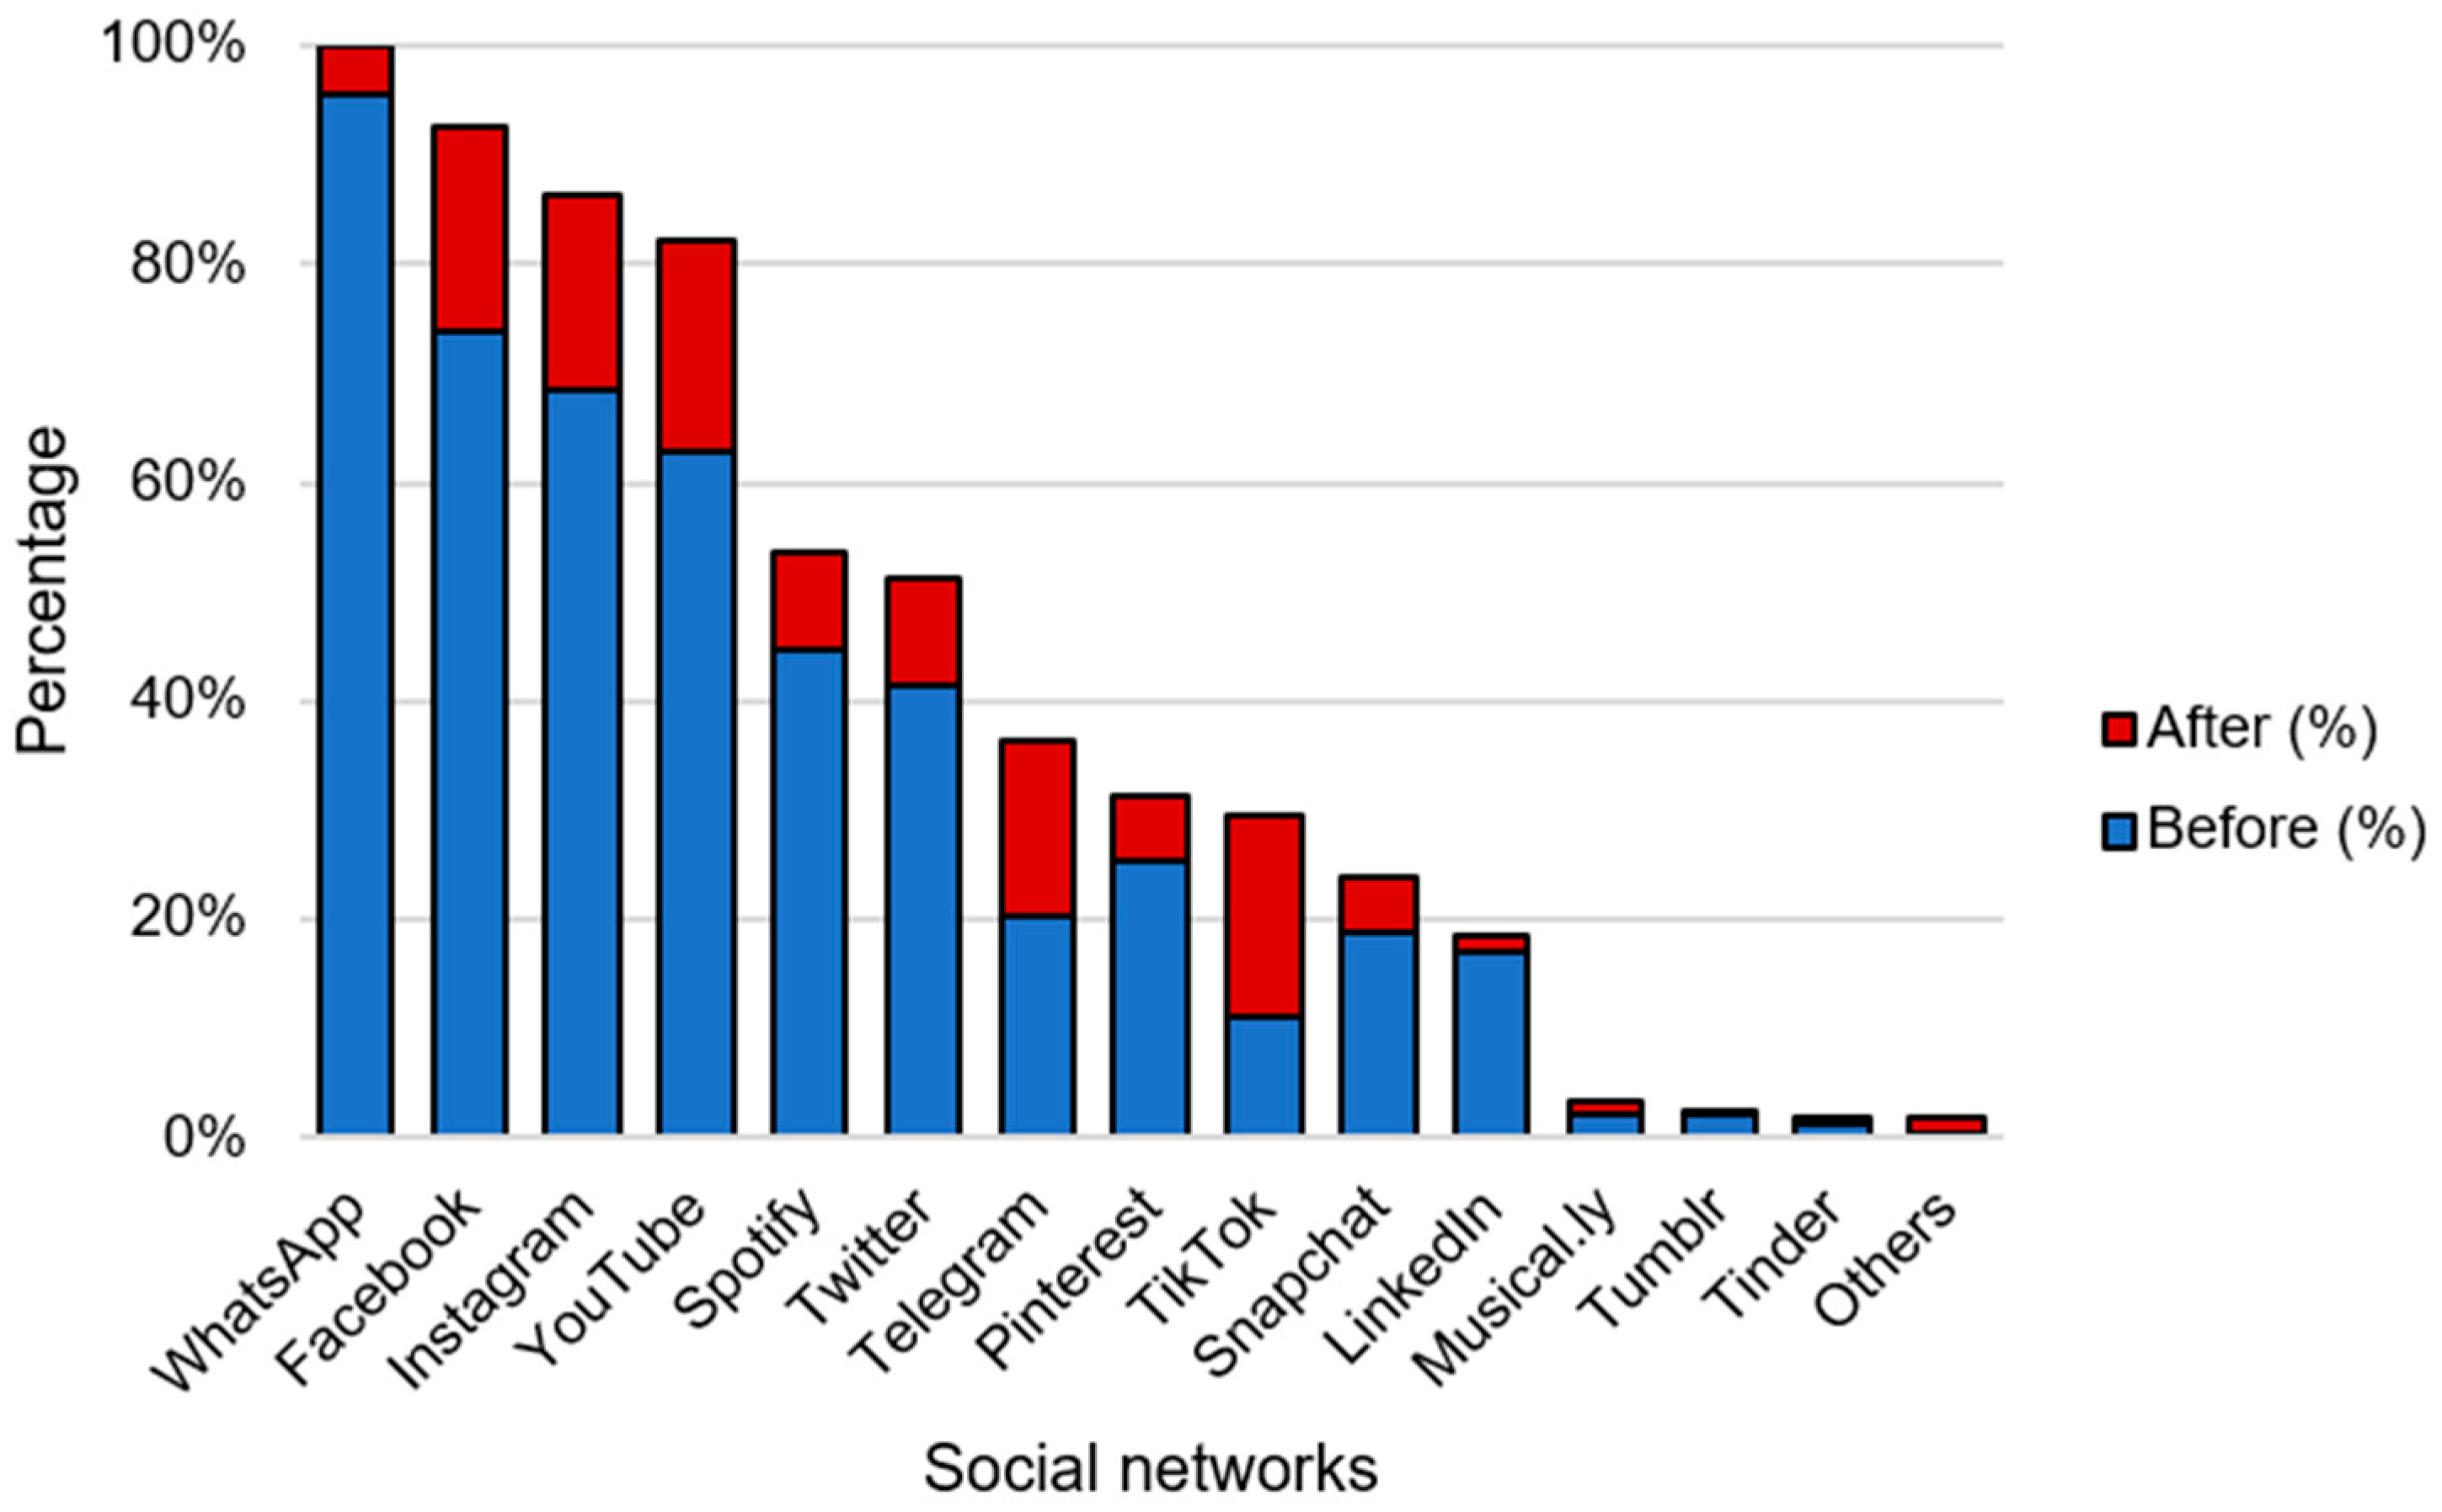
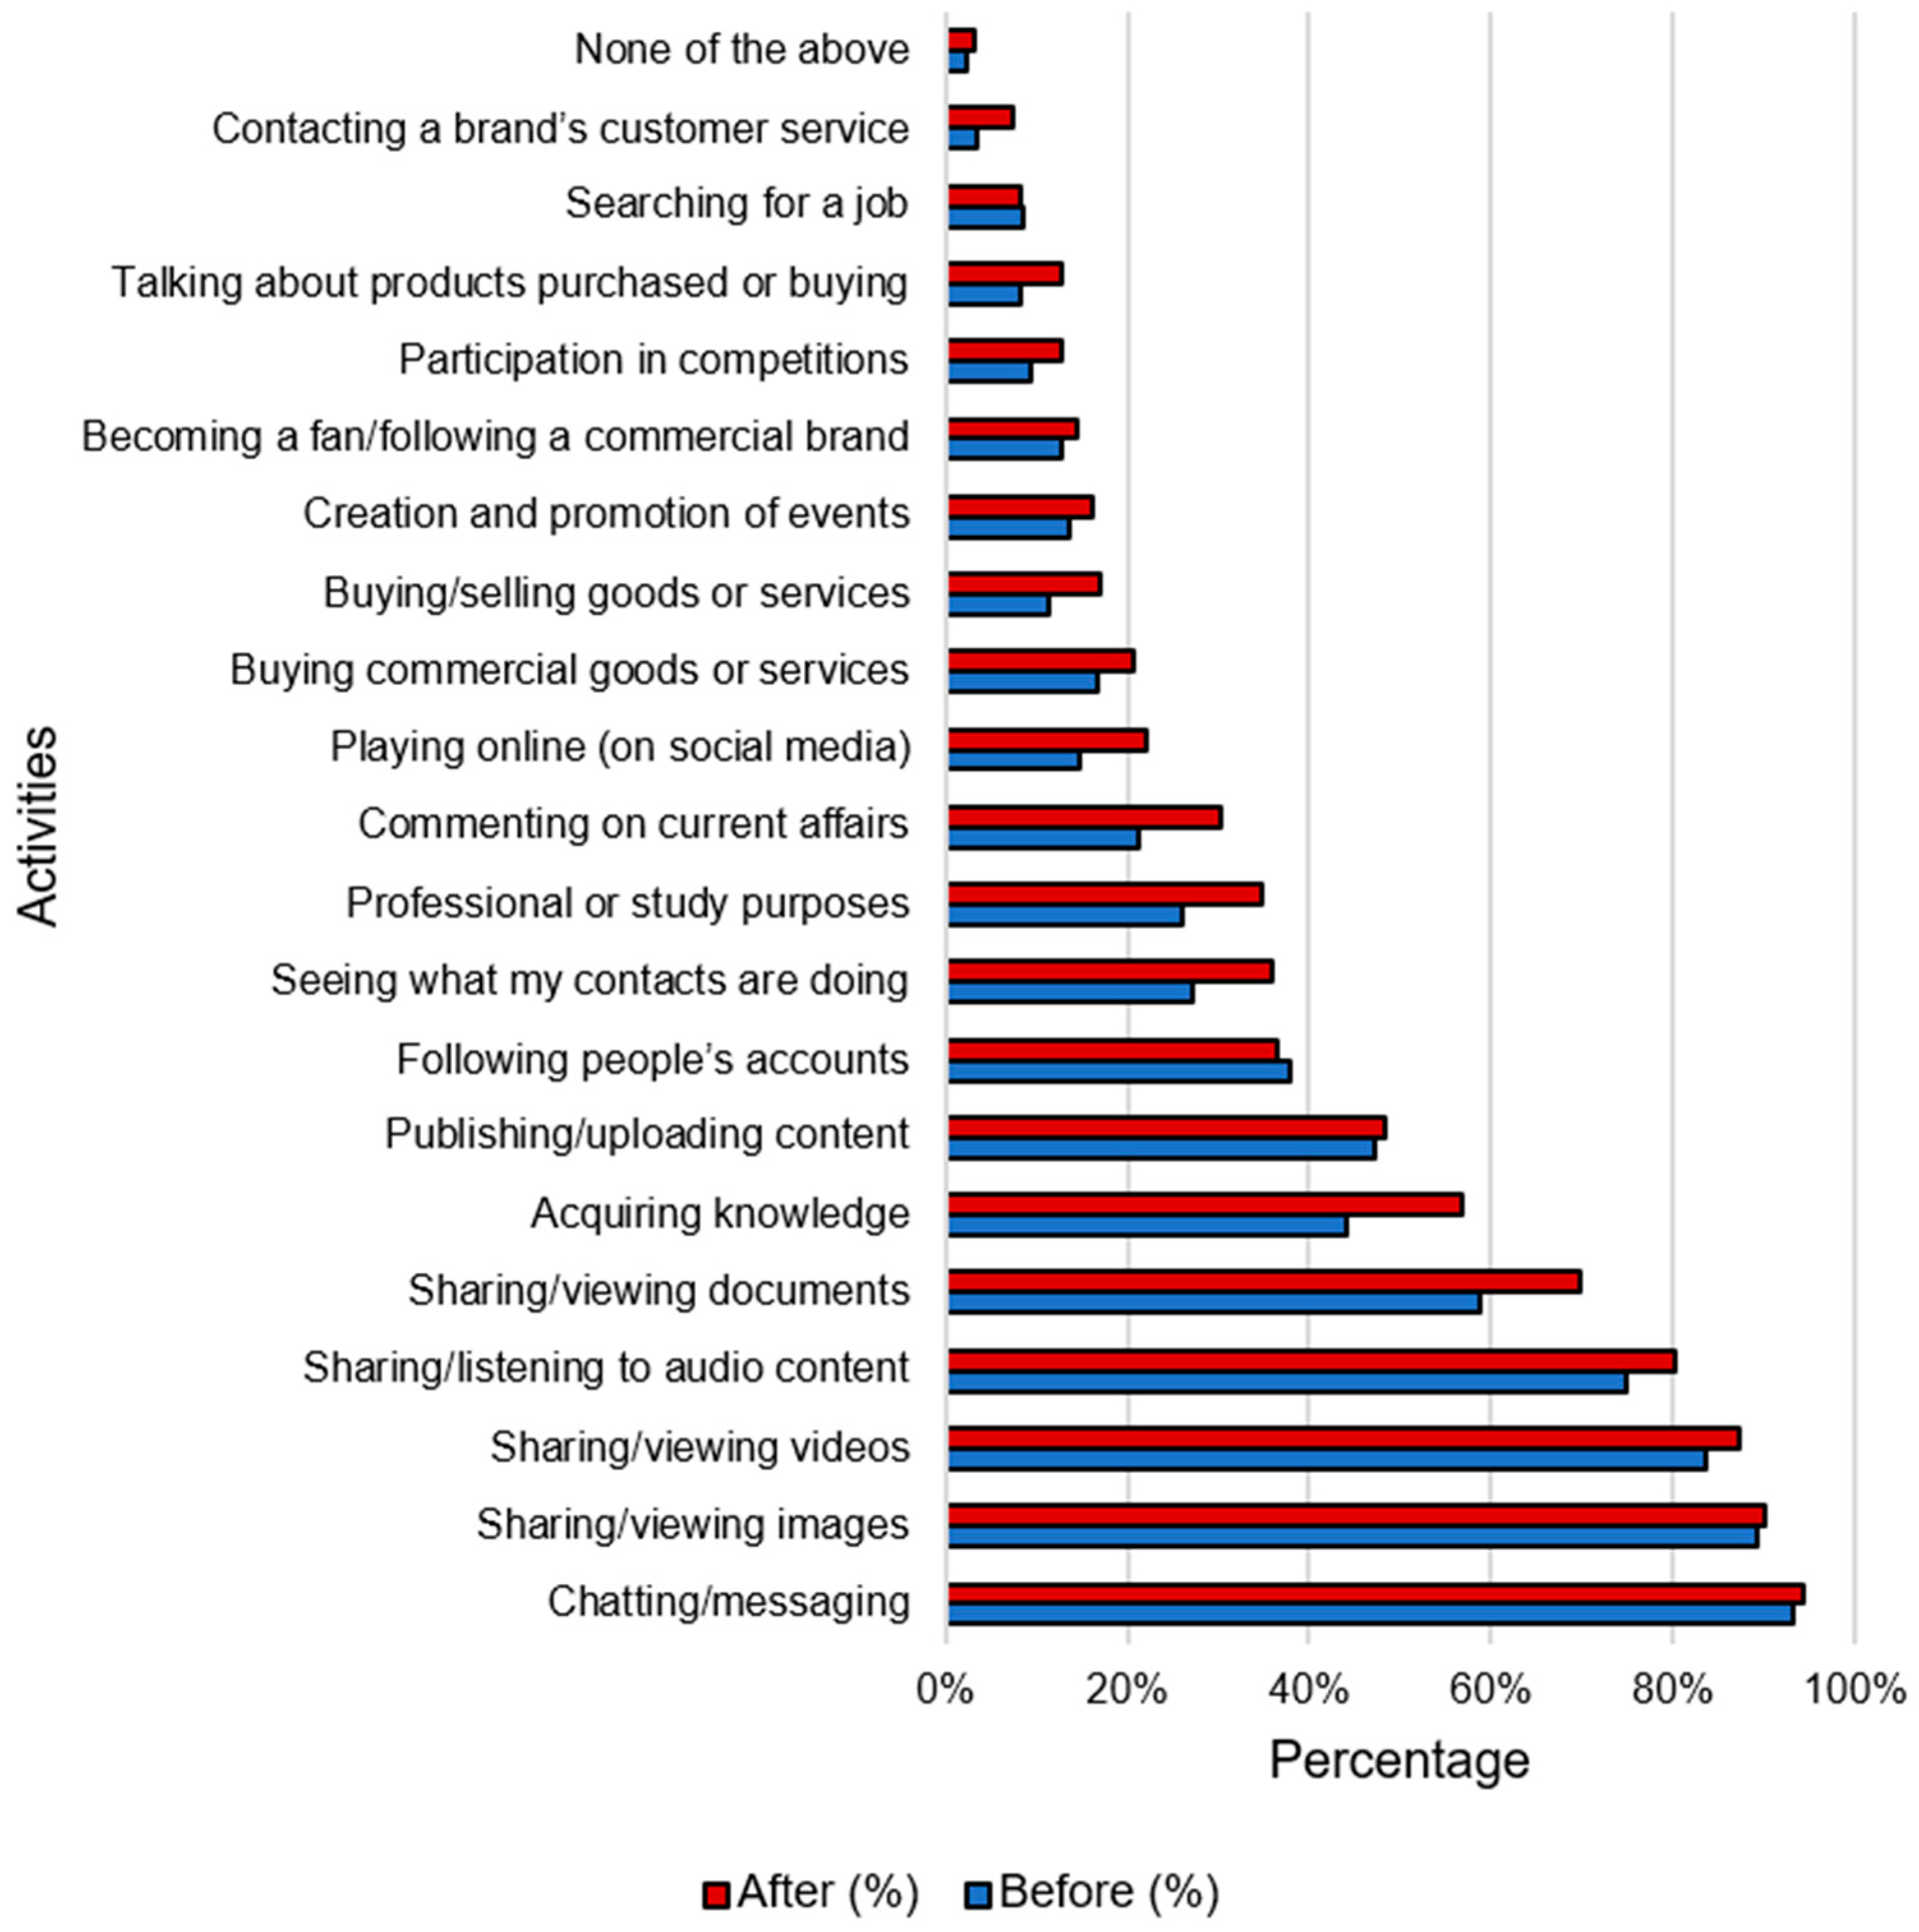
3.2. Registration, Frequency and Type of Use of Social Media

Figure 2 shows that there was an increase in the registration of users on different social networking sites during the lockdown. The social networks with the largest increase in registrations were YouTube (19.14%), Facebook (18.64%) and TikTok (18.39%). However, WhatsApp, Facebook and Instagram continued to have the most registered users.
With regard to the social media used by the participants, Table 4 shows that nearly all social networks experienced a decrease in users during the lockdown, except for Telegram and TikTok, which increased their users by nearly 6% and 13%, respectively. It can be seen that WhatsApp established itself as the most popular social networking site after the lockdown to the detriment of Facebook, which occupied second place. The same occurred with YouTube and Instagram in favor of the latter, and with Spotify and Twitter in favor of the former.
Table 4 also shows that most social networks increased the percentage of users in the ranges involving the highest number of hours of use. The largest increase in usage was for the two-to-three-hour range. For example, in the case of Facebook, 49.6% of people used it for less than an hour before the lockdown, while during the lockdown, this percentage fell to 22.9%. The two-to-three-hour and three-to-five-hour ranges experienced a growth in users. The same was true for other social networking sites, such as WhatsApp (in the two-to-three-hour range, with an increase of more than 3%), YouTube (up 8%) and Twitter (up 2%).
Figure 3 shows that the most popular activities during the lockdown were chatting (94.21%), sharing and viewing images (90.18%), watching videos (87.15%) and listening to audio content (80.35%). The least common activities included contacting brand customer services (7.30%), job searches (8.31%), participation in competitions (12.85%) and talking about products and shopping (12.85%).
During the lockdown, all activities experienced growth, except for following people’s accounts (down by nearly 1.5%) and job searches (down by 0.25%). The activities that increased the most were sharing/viewing documents (up 11%), acquiring knowledge (up 12%), seeing what my contacts are doing (up nearly 9%), playing online games (up 7%), commenting on current affairs (up nearly 10%) and academic/professional purposes (up 8%). The activities that increased the least were chatting, sharing and viewing images, publishing content and following commercial brands. These levels were possibly due to the fact that some of them were already at very high levels prior to the lockdown.

4. Discussion and Conclusions

During the global pandemic, Spanish citizens were confined to their homes. This significantly increased internet traffic and, consequently, the use of social media. This study aimed to assess the use of social media by the Spanish population before and during the lockdown due to the COVID-19 pandemic. A total of 397 people aged between 10 and 90 years from different Spanish provinces completed the ad hoc questionnaire, obtaining the results discussed.
Regarding access to technological devices, nearly all the participants had access to one such device and more than half of the respondents had a tablet, smart TV, computer and/or smartphone. With regard to the time spent using these devices, the most frequently used devices were smartphones (98%), followed by laptops (80.3%), smart TVs (59.5%) and tablets (53.8%). These usage patterns are very similar to those obtained in previous studies [31]. Furthermore, nearly all devices experienced a decrease in users during the lockdown. However, participants who were already using certain devices increased the intensity of their use, coinciding with the results obtained by previous studies [20]. Such problematic intensity of use was also documented in other countries, such as Switzerland, where adolescents with psychiatric problems increased their use of smartphones by nearly three hours per week, followed by tablets and PCs [13]. Therefore, it may be concluded that during the lockdown the most frequently used device in Spain was a smartphone, followed by a laptop. It is also noteworthy that users who already played video games slightly increased the time spent playing them and some of those who previously did not play them started playing at that time. It is expected that following the lockdown, the time spent on these media returned to previous levels.
With regard to the registration of users on the different social networks, it can be seen that the largest increases in registrations were for YouTube (19.14%), Facebook (18.64%) and TikTok (18.39%). However, WhatsApp, Facebook and Instagram continued to be the social networks with the most registered users during the lockdown. It was also observed that during this exceptional period nearly all social media suffered a decrease in users, although the number of hours of use increased. The most frequently used social network during the lockdown was WhatsApp, followed by Facebook, Instagram, YouTube, Spotify and Twitter. This result is not in accordance with the study results of Trevisan et al. [15], who found that Facebook was the most popular networking site in the world. Following this line of results, Al-Qaysi et al. [32] conducted a systematic review with respect to social media use and they obtained that Facebook was the most common social media tool used in most of the analyzed studies. However, our result is consistent with previous findings showing that WhatsApp video calls and messages increased during the COVID-19 pandemic, with 100% daily usage [33]. It also partially coincides with the study by González-Andrío et al. [17], which found that the most frequently used social network was WhatsApp, although the next most frequently used social networks differ from our results (Instagram, followed by Facebook and YouTube). In short, as Morduchowicz et al. [34] indicated, the oldest social networks are the ones that are foremost in the user’s mind and are therefore the most commonly used, although it can be seen that the popularity of Instagram is gradually increasing [35].
On the other hand, it is well known that the use of TikTok increased during the lockdown [31], while in the case of Spain, the use of Telegram also increased significantly (by 6%); however, other networks, such as Musical.ly, Tinder and Tumblr, barely changed. In the case of Musical.ly, it was replaced by the emerging social network TikTok as it was integrated into its platform. As for Tinder and Tumblr, they have lost popularity over time.
In conclusion, it could be said that the oldest social networks were the most frequently used during the lockdown, although recent arrivals, such as Telegram and TikTok, experienced the greatest increase in user registrations. It can also be seen that during the lockdown, the intensity of hours of weekly use of social media increased, especially on Facebook, WhatsApp and YouTube.
In relation to the activities carried out, leisure and entertainment activities, such as chatting and sharing and viewing images, videos and audio content, were popular during the lockdown. Eventually, other activities, such as sharing and viewing documents and acquiring knowledge, gained certain relevance, as users resorted to these tools to continue their studies or fulfill their work commitments during the lockdown, as already pointed out by López-Rico et al. [28], with the use of WhatsApp to share information standing out. Other activities, such as contacting the customer service of commercial brands, were less common during the lockdown, although they were also of minor relevance prior to the lockdown because commercial brands have a separate service for this purpose. These results confirmed the results of the study by González-Andrío et al. [17], which found that young people use social media to organize classwork, entertain themselves and promote themselves professionally.
To sum up, it could be argued that the use of digital devices and social media increased significantly during the lockdown for a variety of reasons. The main one, according to some of our findings and also those obtained by Torres-Romay and Mirón [36], is that users took refuge in these technologies to cope better with the lockdown. However, it is always advisable to ensure the quality and reliability of information sources. Although there are still barriers to the use of these tools, such as lack of interest and time or privacy issues, we believe it is vitally important for users to control the excessive use of social media, as the ease of access can lead to adverse problems for users in the form of stress, anxiety and depression. We conclude the article by pointing out the need to understand the dynamics of content consumption through social networks in order to be able to design more effective and personalized communication strategies in times of crisis.

4.1. Theoretical Contributions

To understand human behavior during a crisis, such as a COVID-19 lockdown, social networks offer researchers a unique opportunity. The present study attempted to address multiple gaps and, in doing so, makes important contributions. Our study is among the first to compare the use of digital media before and during the lockdown, describing the time of use of social networks, technical devices and activities in detail. No previous studies took into account this last element. Previous research on the use of social media during the COVID-19 lockdown in Spain focused on a specific segment of the population, for example, teenagers. This study is one of the earlier studies to take into account all segments of the population. Several studies carried out in Spain had limitations related to the validation and reliability of research instruments. The study was carried out with the necessary scientific rigor.

4.2. Practical Contributions

The data shows that during the lockdown, the intensity of hours of weekly use of social media increased. These results can help policymakers to shape an addiction prevention strategy regarding the use of social networks, especially in times of crisis. Several actions are going to be provided in order to alleviate social media addiction. First, Yue et al. [37] suggested making psychological care services available to the population because stress levels do not end overnight. Second, accessible user guides and tutorials on safe social network use could also be provided to users with little digital literacy or experience. Some suggestions could be implemented, such as turning off or muting social media notifications or inviting to place the devices in places where they are not constantly available during non-working hours. Third, to avoid the excessive use of social networks, the platform developers could integrate timers that limit their use. Finally, the possibility of chatting with a conversational agent can be useful to verify the shared information or even a system that checks false profiles that request to be added with bad intentions. For example, users of Facebook or Instagram can report a profile or content for reasons of fraud or false information.

4.3. Limitations

Finally, the conclusions of this study should be viewed with caution due to its limitations. The results can hardly be generalized to other developing or developed countries because the situation in Spain at the data collection’s moment in time was different from the rest of the world (including European countries). We recommend repeating the study using probabilistic sample selection procedures that allow for the conclusions obtained to be generalized. In addition, the sample size was relatively small; therefore, a higher number of participants could be involved in future studies.

Author Contributions

Conceptualization, all authors; Methodology, D.G., M.T.B.-T. and M.J.F.-S.; Investigation, D.G.; Analyses and Data Curation, D.G. and M.J.F.-S.; Validation, M.T.B.-T. and S.S.; Writing—Original Draft Preparation, D.G.; Writing—Review and Editing, M.T.B.-T. and M.J.F.-S.; Supervision and Funding Acquisition, S.S. All authors read and agreed to the published version of the manuscript.

Funding

This study was funded by the European Regional Development Fund (A Way to Make Europe) and the Government of Extremadura (Junta de Extremadura) (Nº Exp. GR21157).

Institutional Review Board Statement

This study was approved by the Ethics Committee of the University of Extremadura. All the information regarding bioethics and ethics in research activity at the University of Extremadura may be retrieved from http://investigalia.unex.es/#!/page36.do?acond12=es&rcond3.att2=197&kcond92.att3=229, accessed on 25 March 2022.

Informed Consent Statement

Informed consent was obtained from all subjects involved in the study.

Data Availability Statement

Not applicable.

Conflicts of Interest

The authors declare no conflict of interest.

References

  1. McQuail, D.; Windahl, S. Communication Models for the Study of Mass Communication; Longman: Harlow, UK, 1993. [Google Scholar]
  2. Tai, Z.; Sun, T. Media dependencies in a changing media environment: The case of the 2003 SARS epidemic in China. New Media Soc. 2007, 9, 987–1009. [Google Scholar] [CrossRef]
  3. Baloglu, M.; Karatas, K.; Arpaci, I. Psychological and socio-economic effects of the COVID-19 Pandemic on Turkish Population. In Emerging Technologies during the Era of COVID-19 Pandemic. Studies in Systems, Decision and Control; Arpaci, I., Al-Emran, M.A., Al-Sharafi, M., Marques, G., Eds.; Springer: Cham, Switzerland, 2021; pp. 245–258. [Google Scholar] [CrossRef]
  4. Király, O.; Potenza, M.N.; Stein, D.J.; King, D.L.; Hodgins, D.C.; Saunders, J.B.; Griffiths, M.D.; Gjoneska, B.; Billieux, J.; Brand, M.; et al. Preventing problematic internet use during the COVID-19 pandemic: Consensus guidance. Compr. Psychiatry 2020, 100, 152180. [Google Scholar] [CrossRef] [PubMed]
  5. Hornmoen, H.; Backholm, K. Social Media Use in Crisis and Risk Communication: Emergencies, Concerns and Awareness; Emerald Group Publishing: London, UK, 2018. [Google Scholar]
  6. Diezhandino, M.P. Periodismo y Poder. Políticos, Periodistas y Ciudadanos Voluntariamente Desinformados; Pearson Prentice-Hall: Madrid, Spain, 2008; pp. 296–298. [Google Scholar]
  7. Rodero, E. Radio: The medium that best copes in crises. Listening habits, consumption, and perception of radio listeners during the lockdown by the COVID-19. Prof. Inf. 2020, 29. [Google Scholar] [CrossRef]
  8. Blasco, M.M.; Castellà, C.O.; Raso, M.L. Impacto de la pandemia de COVID-19 en el consumo de medios en España. Rev. Lat. De Comun. Soc. 2020, 78, 155–167. [Google Scholar] [CrossRef]
  9. Nielsen, R.K.; Fletcher, R.; Newman, N.; Brenne, J.S.; Howard, P.N. Navegando la ‘Infodemia’: Así Consume y Califica las Noticias y la Información Sobre el Coronavirus la Gente en Seis Países; Reuters Institute: Oxford, UK, 2020. [Google Scholar]
  10. Ahmad, N.S.; Hussain, Z.; Hamid, H.S.A.; Khairani, A.Z. Roles of social media and counselling support in reducing anxiety among Malaysian during COVID-19 pandemic. Int. J. Disaster Risk Reduct. 2021, 63, 102456. [Google Scholar] [CrossRef]
  11. Dong, H.; Yang, F.; Lu, X.; Hao, W. Internet Addiction and Related Psychological Factors among Children and Adolescents in China during the Coronavirus Disease 2019 (COVID-19) Epidemic. Front. Psychiatry 2020, 11, 751. [Google Scholar] [CrossRef]
  12. Luo, T.; Chen, W.; Liao, Y. Social media use in China before and during COVID-19: Preliminary results from an online retro-spective survey. J. Psychiatr. Res. 2021, 140, 35–38. [Google Scholar] [CrossRef]
  13. Werling, A.M.; Walitza, S.; Grünblatt, E.; Dreschsler, R. Media use before, during and after COVID-19 lockdown according to parents in a clinically referred simple in child and adolescent psychiatry: Results of an online survey in Switzerland. Compr. Psychiatry 2021, 109, 152260. [Google Scholar] [CrossRef]
  14. Kaya, T. The changes in the effects of social media use of Cypriots due to COVID-19 pandemic. Technol. Soc. 2020, 63, 101380. [Google Scholar] [CrossRef]
  15. Trevisan, M.; Vassio, L.; Giordano, D. Debate on online social networks at the time of COVID-19: An Italian case study. Online Soc. Netw. Media 2021, 23, 100136. [Google Scholar] [CrossRef]
  16. Lemenager, T.; Neissner, M.; Koopmann, A.; Reinhard, I.; Georgiadou, E.; Müller, A.; Kiefer, F.; Hillemacher, T. COVID-19 Lockdown Restrictions and Online Media Consumption in Germany. Int. J. Environ. Res. Public Health 2021, 18, 14. [Google Scholar] [CrossRef] [PubMed]
  17. González-Andrío, R.; Bernal, C.; Palomero, I. Uso de las redes sociales entre los jóvenes y ciudadanía digital: Análisis tras la COVID-REIDICS. Rev. Investig. Didáctica Cienc. Soc. 2020, 7, 64–81. [Google Scholar] [CrossRef]
  18. Abdelazim, A.; Ajmi, Q.A.; AlBusaidi, H. The effect of Web 2.0 applications on the development of educational communication activities in teaching. Int. J. Inf. Technol. Lang. Stud. 2021, 5, 1–13. [Google Scholar]
  19. Al-Qaysi, N.; Mohamad-Nordin, N.; Al-Emran, M. What leads to social learning? Students’ attitudes towards using social media applications in Omani higher education. Educ. Inf. Technol. 2020, 25, 2157–2174. [Google Scholar] [CrossRef]
  20. Cívico, A.; Cuevas, N.; Colomo, E.; Gabarda, V. Jóvenes y uso problemático de las tecnologías durante la pandemia: Una preocupación familiar. Hachetetepé Rev. Científica Educ. Comun. 2021, 22, 1–12. [Google Scholar] [CrossRef]
  21. Hormes, J.M. Under the influence of Facebook? Excess use of social networking sites and drinking motives, consequences, and attitudes in college students. J. Behav. Addict. 2016, 5, 122–129. [Google Scholar] [CrossRef] [Green Version]
  22. Andreassen, C.S.; Torsheim, T.; Brunborg, G.S.; Pallesen, S. Development of a Facebook Addiction Scale. Psychol. Rep. 2012, 110, 501–517. [Google Scholar] [CrossRef]
  23. Pennycook, G.; McPhetres, J.; Zhang, Y.; Lu, J.G.; Rand, D.G. Fighting COVID-19 Misinformation on Social Media: Experimental Evidence for a Scalable Accuracy-Nudge Intervention. Psychol. Sci. 2020, 31, 770–780. [Google Scholar] [CrossRef]
  24. Chen, I.-H.; Chen, C.-Y.; Pakpour, A.H.; Griffiths, M.D.; Lin, C.-Y. Internet-Related Behaviors and Psychological Distress among School children during COVID-19 School Suspension. J. Am. Acad. Child Adolesc. Psychiatry 2020, 159, 1099–1102. [Google Scholar] [CrossRef]
  25. Wegmann, E.; Stodt, B.; Brand, M. Addictive use of social networking sites can be explained by the interaction of Internet use expectancies, Internet literacy, and psychopathological symptoms. J. Behav. Addict. 2015, 4, 155–162. [Google Scholar] [CrossRef] [Green Version]
  26. Shaw, R.; Kim, Y.-K.; Hua, J. Governance, technology and citizen behavior in pandemic: Lessons from COVID-19 in East Asia. Prog. Disaster Sci. 2020, 6, 100090. [Google Scholar] [CrossRef] [PubMed]
  27. Ahmed, W.; Vidal-Alaball, J.; Downing, J.; Seguí, F.L. COVID-19 and the 5G Conspiracy Theory: Social Network Analysis of Twitter Data. J. Med. Internet Res. 2020, 22, e19458. [Google Scholar] [CrossRef] [PubMed]
  28. López-Rico, C.; González-Esteban, J.; Martínez-Hernández, A. Consumo de información en redes sociales durante la crisis de la COVID-19 en España. Rev. De Comun. Salud 2020, 10, 461–481. [Google Scholar] [CrossRef]
  29. Shimizu, K. 2019-nCoV, fake news, and racism. Lancet 2020, 395, 685–686. [Google Scholar] [CrossRef]
  30. Vilanova, N.; Ortega, I. Generación Z: Todo lo Que Necesitas Saber Sobre los Jóvenes Que Han Dejado Viejos a los Millennials; Plataforma Editorial: Barcelona, Spain, 2017. [Google Scholar]
  31. Interactive Advertising Bureau. Estudio Anual de Redes Sociales 2020; IAB: New York, NY, USA, 2021. [Google Scholar]
  32. Al-Qaysi, N.; Mohamad-Nordin, N.; Al-Emran, M. Employing the technology acceptance model in social media: A systematic review. Educ. Inf. Technol. 2020, 25, 4961–5002. [Google Scholar] [CrossRef]
  33. Instituto Nacional de Estadística. Hogares con Conexión a Internet. Indicadores de Equipamiento y Uso de TIC en los Hogares; INE: Cáceres, Spain, 2020. [Google Scholar]
  34. Morduchowicz, R.; Marcon, A.; Sylvestre, V.; Ballestrini, F. Los Adolescentes y las Redes Sociales; Ministerio de Educación Presidencial de la Nación: Buenos Aires, Argentina, 2010. [Google Scholar]
  35. Trevisan, M.; Giordano, D.; Drago, I.; Munafo, M.M.; Mellia, M. Five Years at the Edge: Watching Internet from the ISP Network. IEEE/ACM Trans. Netw. 2020, 28, 561–574. [Google Scholar] [CrossRef]
  36. Torres-Romay, E.; Mirón, S.G. Influencers y coronavirus. Los contenidos sobre la pandemia COVID-19 en las publicaciones de prescriptores de redes sociales en España (2020): El caso de Instagram. Quad. CAC 2020, 23, 81–91. [Google Scholar]
  37. Yue, Z.; Zhang, R.; Xiao, J. Passive social media use and psychological well-being during the COVID-19 pandemic: The role of social comparison and emotion regulation. Comput. Hum. Behav. 2022, 127, 107050. [Google Scholar] [CrossRef]
Figure 1. Technological devices present in Spanish households.
Sustainability 14 05490 g001
Figure 2. Percentage of total registrations on social media before and during the lockdown.
Sustainability 14 05490 g002
Figure 3. Activities on social media before and during the lockdown.
Sustainability 14 05490 g003
Table 1. Sample distribution.
Age *GenderCount (%)Total
10–26 years (Generation Z)Female105 (26.45%)151 (38.04%)
Male46 (11.59%)
27–39 years (Generation Y)Female54 (13.60%)75 (18.89%)
Male21 (5.29%)
40–51 years (Generation X)Female37 (9.32%)54 (13.60%)
Male17 (4.28%)
52–71 years (Baby Boomer)Female64 (16.12%)90 (22.67%)
Male26 (6.55%)
72–90 years (Silent Generation)Female10 (2.52%)27 (6.80%)
Male17 (4.28%)
* Generations according to the categories proposed by Vilanova and Ortega [30].
Table 2. Dimensions and items of the questionnaire to measure the use of social media before and during the lockdown.
DimensionsItemsTotalTypology
(D1) Sociodemographic data1–77Closed dichotomous nominal (gender) and polytomous interval questions (age)
(D2) Use of social media before the lockdown8, 10, 11, 144Closed polytomous questions of a nominal nature with multiple-choice answers (several options may be chosen)
(D3) Use of social media during the lockdown9, 12, 13, 154Closed polytomous questions of a nominal nature with multiple-choice answers (several options may be chosen)
Total 15
Table 3. Frequency of use of technological devices before and during the lockdown.
UseMomentSmart PhonePCLaptopTabletSmart TVSmart WatchOthers
NoneBefore8
(2%)
253
(63.7%)
71
(17.9%)
180
(45.3%)
157
(39.5%)
312
(78.6%)
374
(94.2%)
During8
(2%)
249
(62.7%)
78
(19.6%)
183
(46.1%)
161
(40.6%)
312
(78.6%)
371
(93.5%)
Less than 1 hBefore46
(11.6%)
97
(24.4%)
144
(36.3%)
130
(32.7%)
66
(16.6%)
52
(13.1%)
15
(3.8%)
During13
(3.3%)
62
(15.6%)
59
(14.9%)
72
(18.1%)
37
(9.3%)
44
(11.1%)
10
(2.5%)
1 to 2 hBefore100
(25.2%)
21
(5.3%)
88
(22.2%)
55
(13.9%)
92
(23.2%)
10
(2.5%)
2
(0.5%)
During62
(15.6%)
24
(6%)
43
(10.8%)
58
(14.6%)
55
(13.9%)
12
(3%)
7
(1.8%)
2 to 3 hBefore131
(33%)
9
(2.3%)
49
(12.3%)
23
(5.8%)
55
(13.9%)
9
(2.3%)
3
(0.8%)
During135
(34%)
31
(7.8%)
95
(23.9%)
47
(11.8%)
83
(20.9%)
8
(2%)
4
(1%)
3 to 5 hBefore72
(18.1%)
7
(1.8%)
30
(7.6%)
8
(2%)
19
(4.8%)
4
(1%)
2
(0.5%)
During90
(22.7%)
15
(3.8%)
52
(13.1%)
20
(5%)
32
(8.1%)
7
(1.8%)
1
(0.3%)
More than 5 hBefore40
(10.1%)
10
(2.5%)
15
(3.8%)
1
(0.3%)
8
(2%)
10
(2.5%)
1
(0.3%)
During89
(22.4%)
16
(4%)
70
(17.6%)
17
(4.3%)
29
(7.3%)
14
(3.5%)
4
(1%)
TotalBefore389
(98%)
144
(36.3%)
326
(82.2%)
217
(54.7%)
240
(60.5%)
85
(21.4%)
23
(5.9%)
During389
(98%)
148
(37.2%)
319
(80.3%)
214
(53.8%)
236
(59.5%)
85
(21.4%)
26
(6.6%)
Table 4. Frequency of use of social media before (B) and during (D) the lockdown.
Social MediaNoneLess than 1 h1 to 2 h2 to 3 h3 to 5 hMore than 5 hTotal *
BDBDBDBDBDBDBD
Facebook103
(25.9%)
150
(37.8%)
197
(49.6%)
91
(22.9%)
71
(17.9%)
88
(22.2%)
19
(4.8%)
44
(11.1%)
4
(1%)
16
(4%)
3
(0.8%)
8
(2%)
294
(74.1%)
247
(62.2%)
WhatsApp17
(4.3%)
83
(20.9%)
84
(21.2%)
30
(7.6%)
127
(32.2%)
85
(21.4%)
76
(19.1%)
90
(22.7%)
52
(13.1%)
57
(14.4%)
41
(10.3%)
52
(13.1%)
380
(95.9%)
314
(79.2%)
YouTube131
(33%)
173
(43.6%)
134
(33.8%)
67
(16.9%)
76
(19.1%)
54
(13.6%)
34
(8.6%)
66
(16.6%)
16
(4%)
25
(6.3%)
6
(1.5%)
12
(3%)
266
(67%)
224
(56.4%)
Instagram127
(32%)
171
(43.1%)
99
(24.9%)
59
(14.9%)
69
(17.4%)
57
(14.4%)
52
(13.1%)
50
(12.6%)
34
(8.6%)
28
(7.1%)
16
(4%)
32
(8.1%)
270
(68%)
226
(57.1%)
Twitter241
(60.7%)
267
(67.3%)
99
(24.9%)
58
(14.6%)
34
(8.6%)
33
(8.3%)
15
(3.8%)
23
(5.8%)
5
(1.3%)
12
(3%)
3
(0.8%)
4
(1%)
156
(39.4%)
130
(32.7%)
Spotify228
(57.4%)
259
(65.2%)
78
(19.9%)
52
(13.1%)
38
(9.6%)
22
(5.5%)
22
(5.5%)
28
(7.1%)
21
(5.3%)
14
(3.5%)
10
(2.5%)
22
(5.5%)
169
(42.8%)
138
(34.7%)
LinkedIn332
(83.6%)
344
(86.6%)
57
(14.4%)
41
(10.3%)
3
(0.8%)
10
(2.5%)
3
(0.8%)
1
(0.3%)
2
(0.5%)
1
(0.3%)
0
(0%)
0
(0%)
65
(16.5%)
53
(13.4%)
Pinterest302
(76.1%)
322
(81.1%)
81
(20.4%)
48
(12.1%)
10
(2.5%)
12
(3%)
2
(0.5%)
12
(3%)
2
(0.5%)
2
(0.5%)
0
(0%)
1
(0.3%)
95
(23.9%)
75
(18.9%)
Telegram316
(79.6%)
294
(74.1%)
67
(16.9%)
54
(13.6%)
8
(2%)
18
(4.5%)
3
(0.8%)
16
(4%)
1
(0.3%)
4
(1%)
2
(0.5%)
11
(2.8%)
81
(20.5%)
103
(25.9%)
Snapchat323
(81.4%)
344
(86.6%)
67
(16.9%)
45
(11.3%)
1
(0.3%)
4
(1%)
3
(0.8%)
1
(0.3%)
2
(0.5%)
1
(0.3%)
1
(0.3%)
2
(0.5%)
74
(18.8%)
53
(13.4%)
Tinder386
(97.2%)
388
(97.7%)
9
(2.3%)
8
(2%)
1
(0.3%)
0
(0%)
0
(0%)
1
(0.3%)
0
(0%)
0
(0%)
1
(0.3%)
0
(0%)
11
(2.9%)
9
(2.3%)
Tumblr383
(96.5%)
390
(98.2%)
12
(3%)
7
(1.8%)
0
(0%)
0
(0%)
1
(0.3%)
0
(0%)
1
(0.3%)
0
(0%)
0
(0%)
0
(0%)
14
(3.6%)
7
(1.8%)
Musical.ly384
(96.7%)
385
(97%)
7
(1.8%)
6
(1.5%)
4
(1%)
0
(0%)
2
(0.5%)
6
(1.5%)
0
(0%)
0
(0%)
0
(0%)
0
(0%)
13
(3.3%)
12
(3%)
TikTok355
(89.4%)
303
(76.3%)
21
(5.3%)
43
(10.8%)
10
(2.5%)
20
(5%)
7
(1.8%)
18
(4.5%)
3
(0.8%)
11
(2.8%)
1
(0.3%)
2
(0.5%)
42
(10.7%)
94
(23.6%)
Other391
(98.5%)
388
(97.7%)
4
(1%)
8
(2%)
1
(0.3%)
1
(0.3%)
1
(0.3%)
0
(0%)
0
(0%)
0
(0%)
0
(0%)
0
(0%)
6
(1.6%)
9
(2.3%)
* This column represents the total number of users who used each social network at some point in time without taking into account users who did not use them at all (included in the ‘None’ range).
Publisher’s Note: MDPI stays neutral with regard to jurisdictional claims in published maps and institutional affiliations.

