1. Introduction
This research, based on a spatial approach, analyzes the dynamics of eco-innovation in some Italian southern regions through the data relating to the 2014–2020 ROP (Regional Operative Programs) financial programming, mainly focused on the environmental issue.
Regional operational programs (ROP) are the tools through which development initiatives and projects on the regional territory can be financed. The ROPs are co-financed through the Structural Funds of the European Union, which are the instruments of the European cohesion policy, the purpose of which is to equalize the different levels of development between the regions and between the Member States of the European Union. Unlike programs managed directly by the European Commission, these funds are managed at the regional level.
There are two main Structural Funds:
- -
The European Regional Development Fund (ERDF). It finances the construction of infrastructures and productive investments generating employment in favor of businesses.
- -
The European Social Fund (ESF) favors the professional integration of the unemployed and less favored social categories by financing in particular training actions.
Here, we analyze the first ones relative to 2014–2020 Call and, particularly, those related to eco-innovation actions for sustainability.
Starting from the scientific contextualization of eco-innovation, which embraces the paradigms linked to new technologies, particularly those enabling 4.0, and environmental issues, this study provides a territorial profile in terms of environmental fragility, which is then compared with the geographical distribution of eco-innovative activities, also identifying any spatial correlations.
This research is animated by the desire to investigate the dynamics of eco-innovation in a spatial approach through a preliminary general framework of the phenomenon and a subsequent analysis relating to some specific cases represented by some Italian southern regions.
Just as other types of innovation, eco-innovation should be investigated as a spatially embedded process. The tendency observed at both the regional and national levels, that the factors of production are accumulated in spatial proximity, implies that innovation activity is highly concentrated [
1]. The spatial approach to eco-innovation is still in an embryonic phase; however, some recent works deal with this theme [
2,
3,
4,
5,
6].
The scientific value related to the adoption of a spatial approach is recognizable, on the one hand, in testing of the geographical distribution of the response of the territories in relation to an increasingly topical issue such as the environmental one in order to detect any characteristics of homogeneity or otherwise detect possible gradients and territorial polarizations, and, on the other hand in the opportunity to combine the dynamics of propensity for environmental sustainability through technological innovation with the specific environmental fragility of the territory in which these dynamics have been developed. Indeed, as Chaminade and Randelli [
7] argue, referring to the theme of sustainability, understanding why and how transformations occur at a much faster pace in some places than in others is of fundamental importance. On the other hand, the territory in its overall value with reference to anthropic and natural aspects is the main element from which to start in the analysis of environmental sustainability. Similar approaches are recently recognizable; for example, in Celata and Coletti [
8], who investigated the role of public policies in community initiatives for environmental sustainability.
Horbach [
9] finds that eco-innovations are more likely to be implemented in areas characterized by high poverty rates and less dependent on urbanization advantages. Here, this perspective is declined in terms of possible more fragile areas from an environmental point of view.
A preliminary analysis on the regional archives relating to the calls for funding and the related projects admitted focused on environmental issues through innovative interventions and technologies and showed a fair critical mass of observation elements that constituted the leverage to start the research and to investigate it in the related dynamics in an in-depth and analytical way. Indeed, eco-innovative activities seem to require more external sources of both knowledge and information, as well as intensive R & D cooperation [
10].
A first hazard in the initial phase of the research was inherent precisely to the difficulty of codifying with a precise definition the concept—certainly current and interesting but very broad and vague—of eco-innovation.
In the MEI (Measurement Eco Innovation) project of the European Commission, eco-innovation is defined as “the production, assimilation or enhancement of a product, the production of a process and a service or the management or a new commercial method for organization (development or adoption) and which translates, throughout its life cycle, into a reduction of environmental risk, pollution and other negative impacts of the use of resources (including the use of energy) with respect to relevant alternatives” [
11].
What, then, is the scientific value of a spatial analysis on eco-innovation? A first aspect concerns the expected environmental benefits. A second driver concerns the opportunity, often necessity, to cope with the increase in costs for the production of goods, for the management of waste products and for competitiveness between companies, between regions and even between countries.
Analyzing eco-innovation trends from a microeconomic point of view helps to evaluate progress within the various industrial sectors, while in macroeconomic terms it allows for the evaluation of political orientations in the adoption of relative or absolute decoupling models, in which economic growth can be a justifying factor for the increase in environmental pollution.
Although, also due to the media lever that catalyzed its dynamics, the process of awareness of the value of environmental sustainability, both at the individual level and in terms of the organized community, is in the development phase, it has not yet reached a phase of full maturity, and, therefore, an effective push for the adoption of initiatives in this sense by companies and local authorities can be represented by the availability of ad hoc financing funds.
In recent years, there has in fact been a growing concern among academics and professionals about the slowness with which sustainability transformations are taking place.
Moreover, this evidence is well perceived by the institutions at the different scales of reference and in particular at the European level, where the President von der Leyen guidelines are based precisely on a vision linked to the Green Deal on the basis of which Europe must aim to become the first climate-neutral continent by 2050 while at the same time stimulating the economy, improving people′s health and quality of life, taking care of nature and eliminating geographical differences. Beyond the guidelines, the European economic-financial planning of resources has committed and is committing various allocations on the environmental and natural theme.
In a synchronous way with this green turn, the digital turn also takes place, and the transversality offered by the new enabling technologies makes it possible to make the technological plan and that of environmental risk more and more in osmosis. In the recent COP21 world conference on climate change held in Paris in December 2015, the key role of new generation technologies in economic and production strategies oriented towards environmental sustainability in what is now known as the circular economy was highlighted. The close link between new technologies and the sustainability of the territory can also be identified in COP26 programmatic commitments. In fact, the main objectives are: secure global net zero and keep 1.5 degrees within reach; urgently adapt to protect communities and natural habitats; mobilize public and private finance; collaboration. The first objective focuses on measures such as coal spillage and the reduction of deforestation, for example, in order to halve emissions over the next decade and reach net zero carbon emissions by the middle of the century if we are to limit global temperature rises to 1.5 degrees Celsius. The second objective is based on the awareness that the most vulnerable communities will continue to suffer the effects of climate change; therefore, we need the international community to support these people. The third objective is focused on the financial resources needed for a transition to a greener and more climate-resilient economy, focusing on technology and innovation, where private finance is called to turn the billions of public money into trillions of total climate investment. The last—perhaps the most complicated of all—underlines the need for true global collaboration to achieve the above, finalizing the rules needed to implement the Paris Agreement, called the ‘Paris Rulebook’. Also in the latter case, the geographical proximity and concentration of the activities for effective and efficient environmental funding, analyzed in the contribution, demonstrate the presence of a trend towards these dynamics.
Two main factors characterize the green market leverage, i.e., the demand for new generation technologies to improve environmental sustainability. On the one hand, there is a propensity towards sustainable spending actions by individuals who, under the increasing green media wave praising the importance of respect for the environment, show a voluntary attitude in this sense, as demonstrated, for example, by a recent survey conducted in the United Kingdom (UK) by the Department of Energy & Climate Change [
12]. On the other hand, although with the necessary distinctions between countries, the legislation imposes increasingly severe restrictions on the protection of the environment [
13].
Companies are therefore called upon to continuously invest in eco-innovation to reduce emissions [
14], save energy in production [
15], reduce waste, manage pollution [
16], exploit recycled products [
17] and, more generally, enhance their environmental performance [
18].
With reference to the first aspect, the new technologies known as enabling technologies (KETs-Key Enabling Technologies) are those that refer to the paradigms of the 4.0 revolution. The term “Industry 4.0” was officially introduced in 2011 in relation to a German government project aimed at digitizing production at all stages [
19,
20].
This family of technologies allows for an advancement in production systems and in all related phases. The various positive externalities that derive from this can be assessed in terms of environmental benefits deriving from the reduction of the impacts of the production phases both as a result of the enormous general efficiency that they entail and in the face of new potentialities made available. In
Table 1, a summary of some of the main 4.0 technologies, found in the projects analyzed as described in the third paragraph, and of the related environmental declinations according to a review of the literature, is reported.
The regions in which the greatest number of patents relating to the use of technologies for environmental purposes are concentrated are the German regions, the regions of southeast France and northwest Italy, the south of the United Kingdom and the south of the Scandinavian area. However, the southern regions still show average levels of patent intensity relating to new technologies, which have led this research to deepen new implementations through the support of regional funding. The data refer to the latest REGPAT survey of 2011 (the KET classification of patent patents was carried out through the KETS Observatory Report available at the following link:
https://ec.europa.eu/growth/toolsdatabases/ketstools/sites/default/files/library/final_report_kets_observatory_en.pdf (accessed on 1 April 2022)), to which much of the current literature refers; however, they offer a snapshot of the starting scenario in relation to the propensity to innovate through new technologies in the southern regions.
Having clarified the general framework of the phenomenon, the aim of this research is to verify whether there is greater awareness on the part of local actors (institutions and companies) in terms of their eco-innovation activities in more fragile places compared to others with innovative activities related to the environment. This objective, evaluated as a response of eco-projects in a spatial approach, represents a metric of the environmental sensitivity of the territory based on objective data. The contribution is, therefore, organized as follows: in the next paragraph, the above-mentioned theme of the relationship between environment and technology is deepened, focusing the analysis on the natural and environmental characteristics of the territories with a particular declination to the real data provided by ISPRA in relation to three southern regions. The third paragraph describes the survey methodology used, and the main results of the spatial approach used are reported. The conclusions then complete the work.
2. The Environmental Fragility of the Territory as a Benchmark Driver
The rapid increase and wide diversity of human activities that promote socioeconomic development are increasingly generating very negative impacts on natural systems which, if not contained, can induce irreversible environmental changes capable of compromising the resilience of the planet [
26]. In relation to the various forecasting scenarios, the horizon is expected to be catastrophic due to the loss of natural resources and the ecosystem services they provide [
27,
28].
Several researchers have highlighted the importance of the spatial approach in the assessment of environmental risk in order to develop methodological investigation tools with ever greater resolution and to avoid harmful generalizations. Cash et al. [
29] addressed the issue of the survey spatial perspective, working on a map of the susceptibility to avalanches for the Formigal–Peyreget area, located in the Pyrenees of central Spain and France, while Chalkias et al. [
30] highlighted the importance of a high-resolution spatial analysis by presenting a landslide susceptibility map for the Peloponnese peninsula in southern Greece.
The spatial risk assessment model developed by ISPR—Higher Institute for Environmental Protection and Research (established with Law 133/2008, converting, with amendments, the Law Decree of 25 June 2008, n.112)—provides an approach integrated with knowledge, which takes into account all the aspects that make up the complexity that nature itself presents. The ISPRA approach turns out to be integrated in relation to environmental diversity, understood as the integration between geodiversity and biodiversity, which makes it decomposable into its constituent components and hierarchical levels that take into account data on the geological heritage, ecosystems, habitats and living organisms.
In the ISPRA study, risk is approached in terms of geo-statistics, which is the science that studies natural phenomena that develop on a spatial basis starting from the information derived from their sampling. In particular, it studies the spatial variability of the parameters that describe these phenomena, defining some fundamental elements:
A regionalized variable (VR) that represents a quantity expressed as a numerical function z (x) whose value depends on the location or the vector x (x, y) of the spatial coordinates.
A field that constitutes the domain within which the variability of the variable z is studied.
A support as a geometric entity on which the values of the variable z are measured.
Biodiversity data, relating to fauna and flora, are considered by ISPRA in the habitat assessment phase. A contingent of animal and plant species is associated with each habitat on the basis of potential presence criteria starting from the national distribution areas of each species and according to species–habitat suitability criteria
Particularly, the data referred to in this research are those relating to the project called the Nature Chart. It is a national project coordinated by ISPRA (Law no. 394/91), in which Regions and Regional Agencies for the Environment participate, capable of providing a complex and at the same time synthetic representation of the territory. Bombining physical, biotic and anthropic factors, it returns an overall vision from which the basic knowledge and elements of natural value but also of the degradation and fragility of ecosystems emerge.
The environmental fragility elaborated by ISPRA is indicative of the actual state of vulnerability from the naturalistic environmental point of view of a territory.
This indicator takes into account both the natural intrinsic predisposition to the risk of possible damage by a geographical area and the anthropic effect exerted on it. Therefore, two specific sub-indices are used, ecological sensitivity and anthropic pressure, respectively, to estimate the first and second aspect.
Environmental fragility is therefore constituted by the result of the combination of ecological sensitivity and anthropic pressure.
To better understand the relationship between eco-innovation and the two components of environmental fragility, ecological sensitivity and anthropic pressure, it is necessary to consider the original definition of eco-innovation.
The term ‘eco-innovation’ was first introduced by Klemmer et al. [
31] and defined broadly as “all measures of relevant actors (firms, politicians, unions, associations, churches, private households) which develop new ideas, behaviour, products and processes, apply or introduce them and which contribute to a reduction of environmental burdens or to ecologically specified sustainability targets”.
Eco-innovation results, throughout their life cycle, consist in a reduction of environmental risk, pollution and other negative impacts of resource use (including energy use) compared to available alternatives. Therefore, greater anthropogenic pressure in certain areas induces a greater consumption of environmental resources and generates greater pollution. In the same way, the resilience of the territories, specifically expressed as environmental sensitivity to the two previous effects, induces their evolutionary or degenerative roadmaps.
The importance of innovation is, therefore, maximum where an area has strong anthropogenic pressure and high environmental sensitivity.
The evaluation ‘environmental fragility’ refers, according to the ISPRA model, to a subdivision into the “very low”, “low”, “medium”, “high” and “very high” classes. (For a detailed description of the indicators and the discussion of the calculus procedures, please refer to the
Appendix A and to the following link:
https://www.isprambiente.gov.it/it/servizi/sistema-carta-della-natura (accessed on 1 April 2022)).
For cartographic reasons, here we refer to the three classes low, medium and high.
Through the data granted by ISPRA, both the general index of Environmental Fragility and also the sub-index of Anthropic Pressure were assessed cartographically, as it is useful for the purposes of the survey conducted on the spatial distribution of eco-innovative activities from ROP 2014–2020 funding.
The results of the variability of anthropic pressure and environmental fragility show levels of spatial autocorrelation [
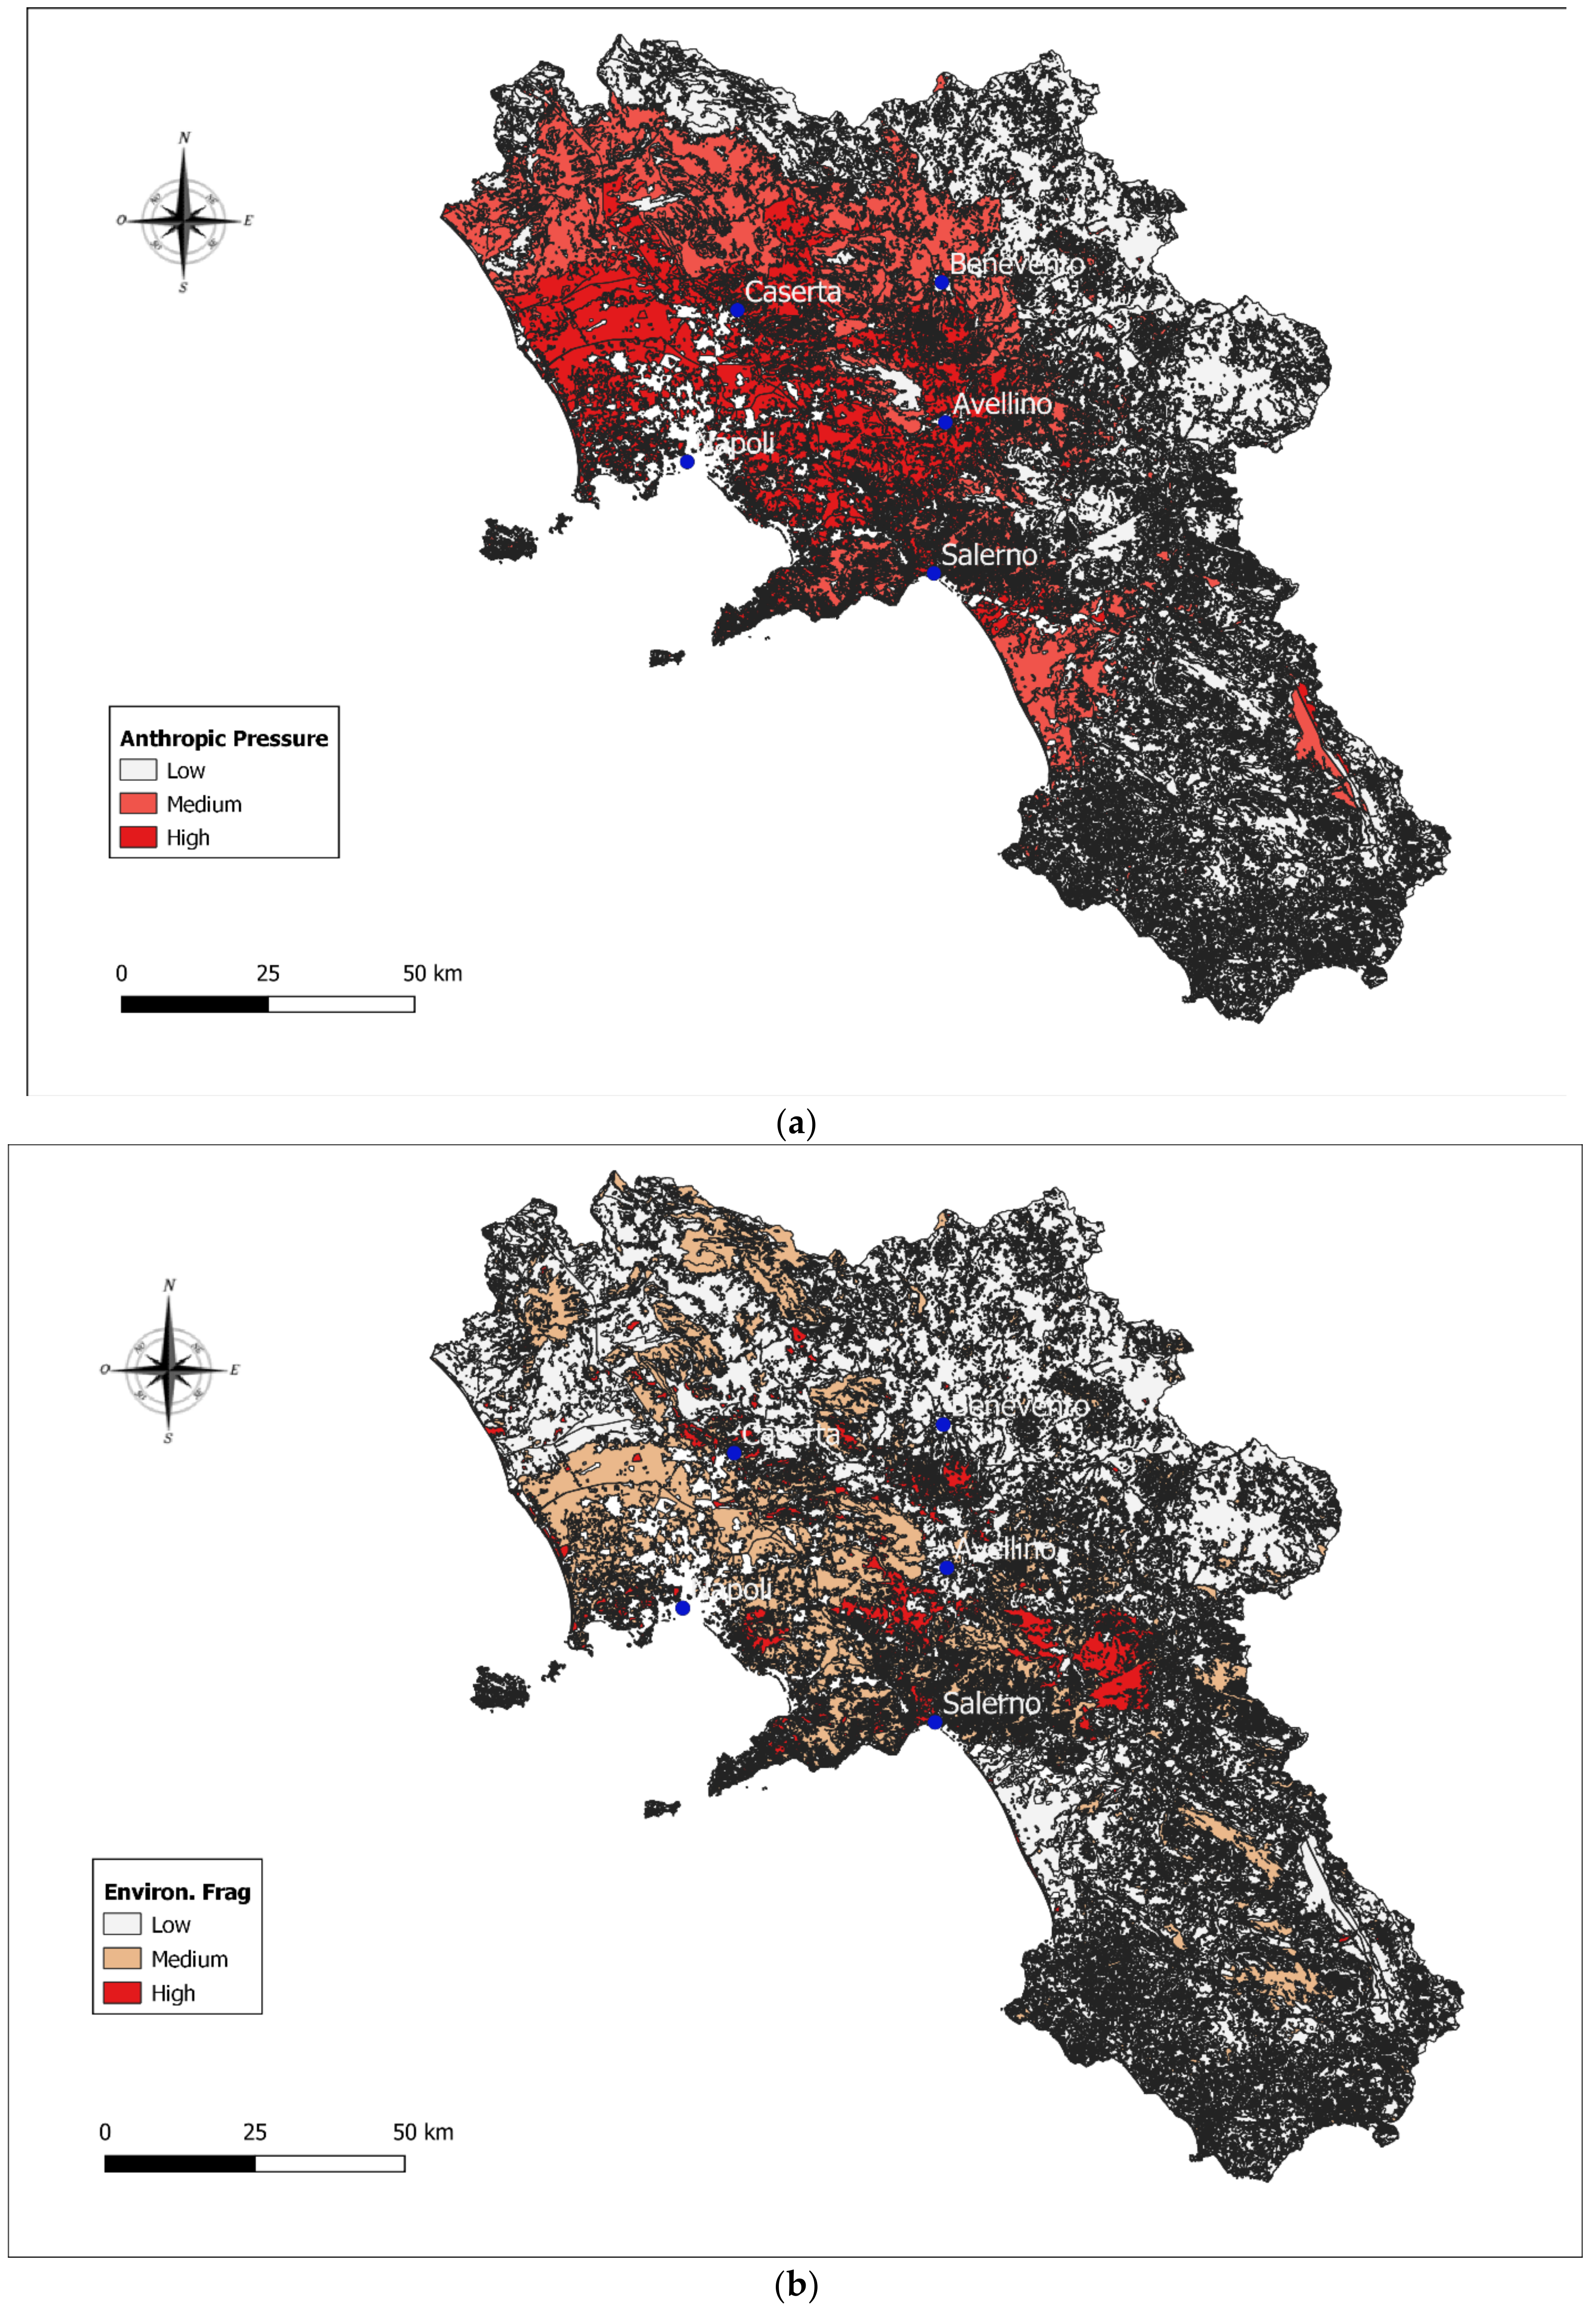
32] (autocorrelation understood in the sense of Tobler (1965), according to which territorial areas close to each other have values that are more similar to each other than those referring to more distant areas) of variable intensity in relation to the Italian analyzed regions, starting from high values for Campania (
Figure 1a,b), to average values for Puglia (
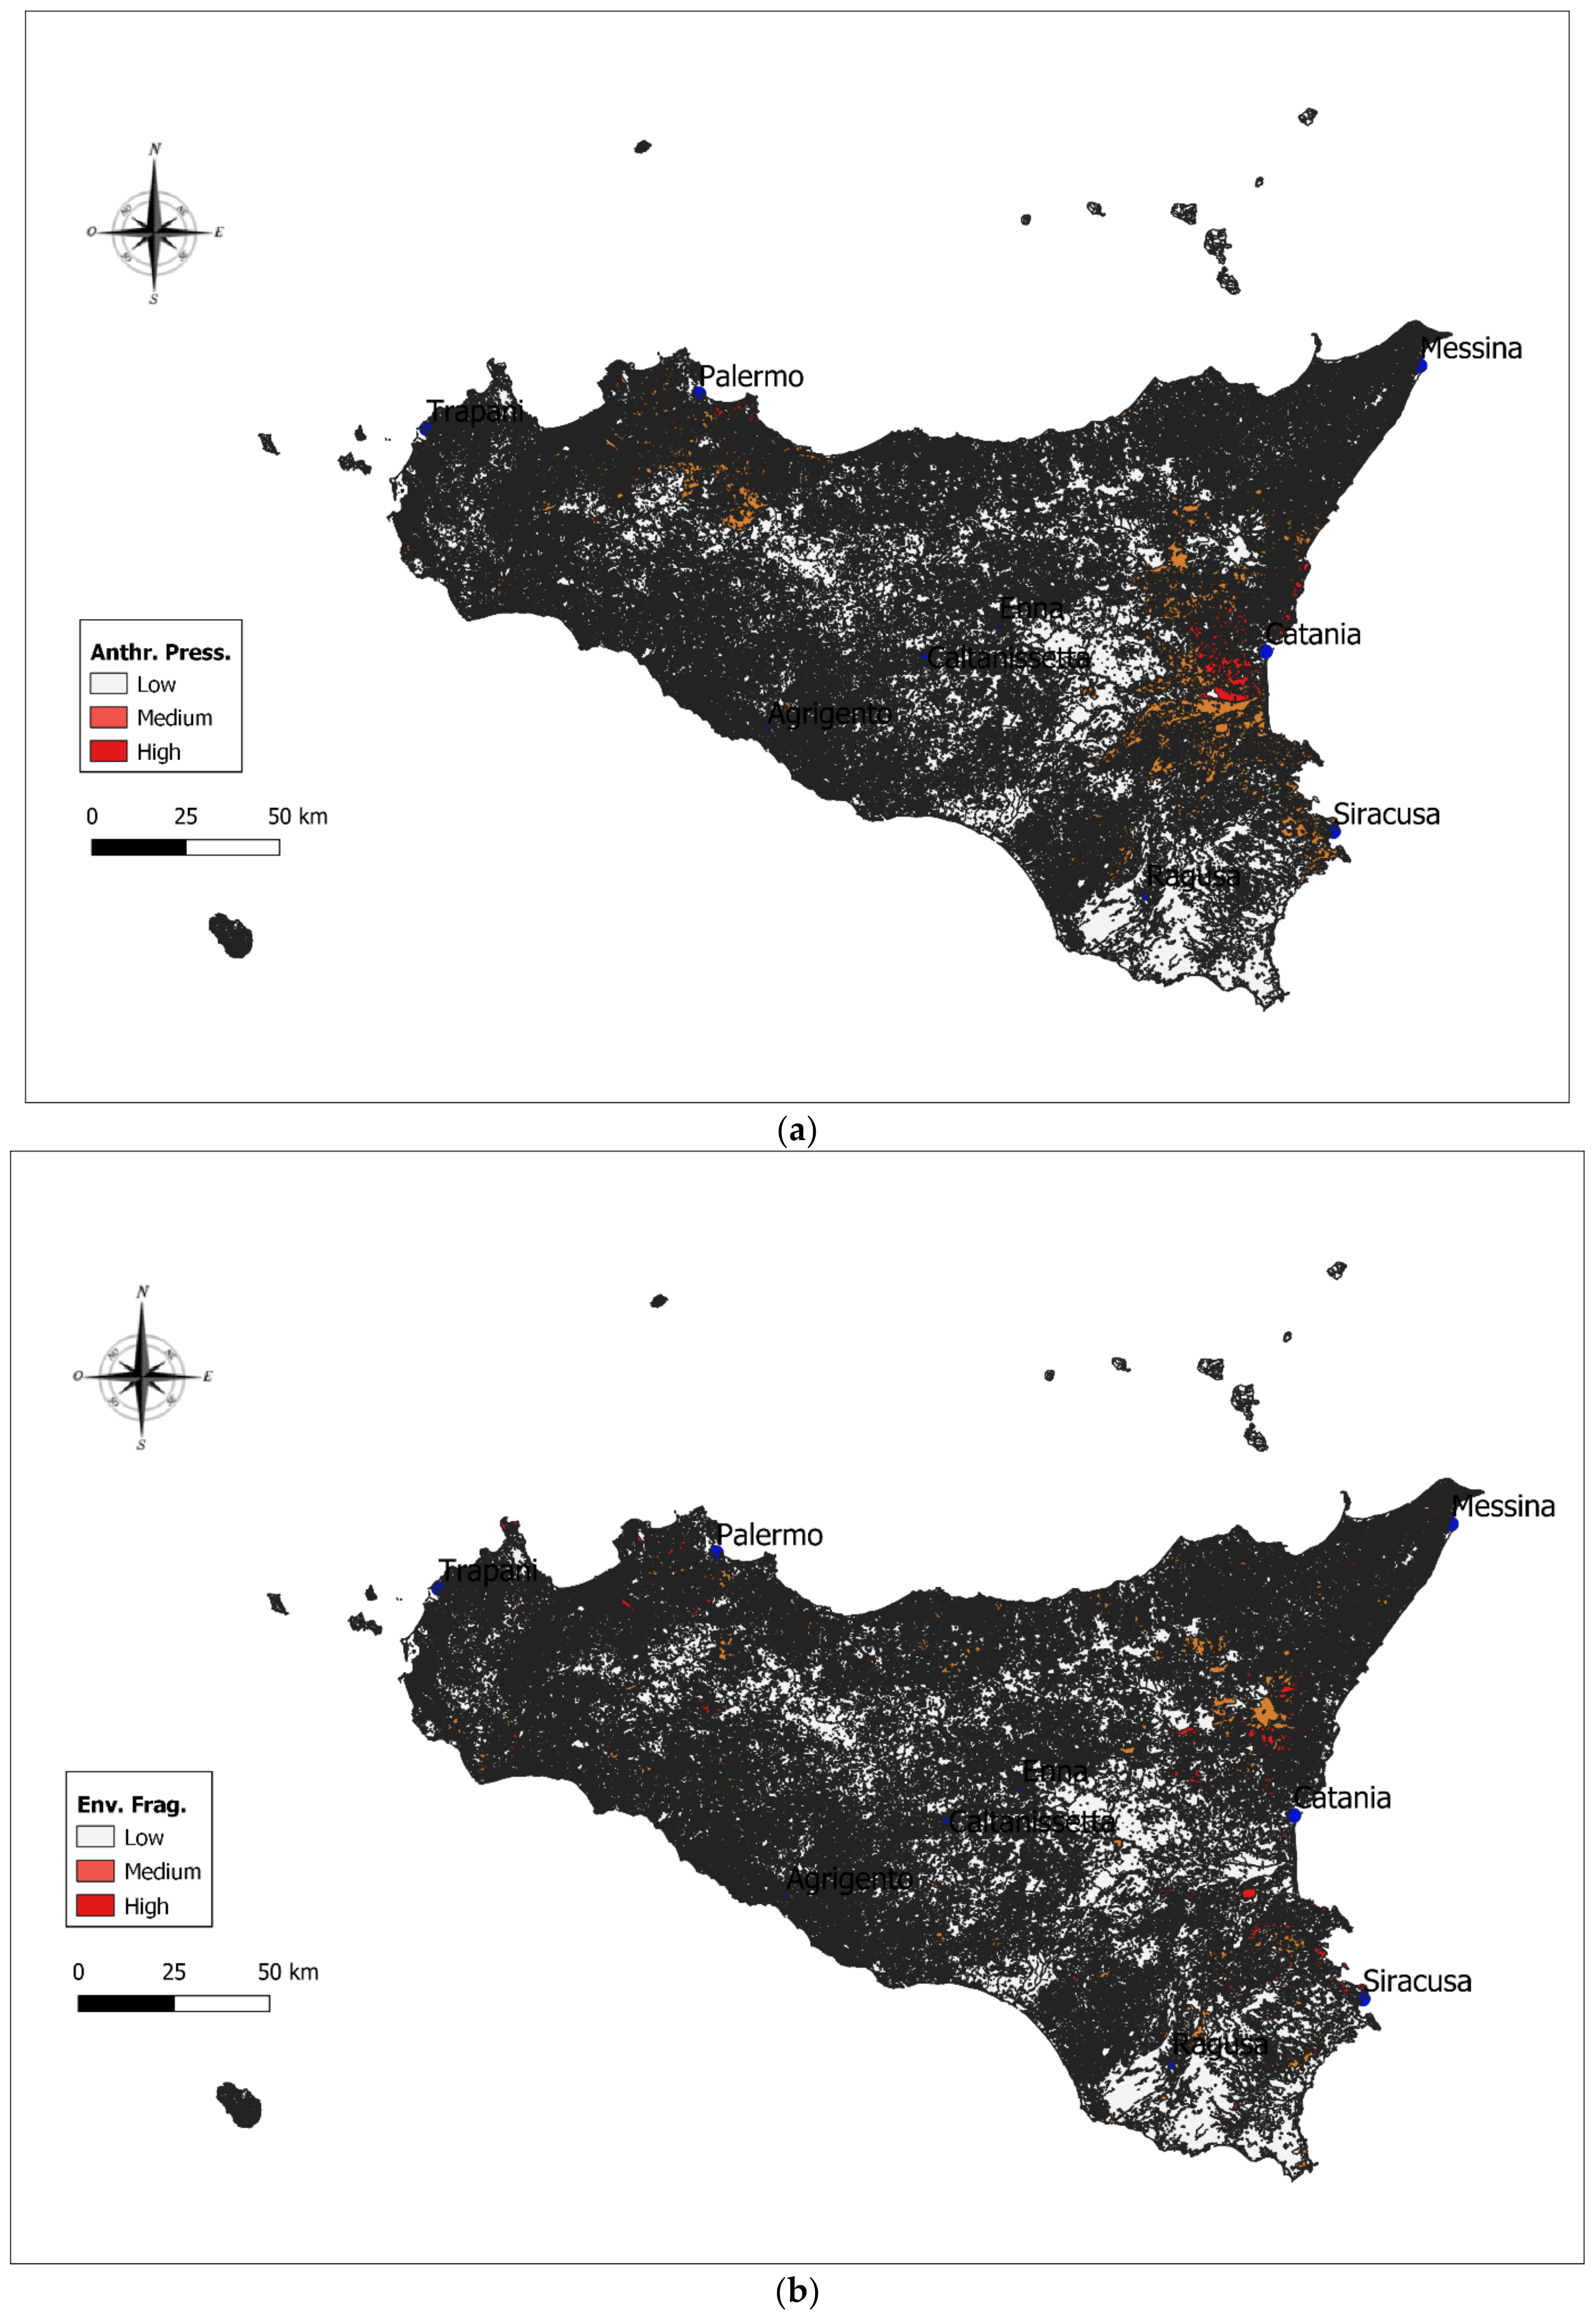
Figure 2a,b) and low values for Sicily (
Figure 3a,b).
In Campania, from the point of view of anthropic pressure, there is the well-known paradigm of “pulp and bone” [
33,
34] in relation to the contrast between the pulp, which is the productive and urbanized areas, and bone of internal areas. In fact, in the face of obvious high anthropic pressure values in the Neapolitan, Caserta and Salerno areas, very low values are found in the internal areas of Alta Irpinia and Cilento, the latter characterized, in fact, by very negative demographic trends [
35].
Environmental Fragility has profiles similar to that of Anthropic Pressure for the urban areas of Naples and Caserta, but differs for inland areas, which reach, unlike the other sub-index, even higher values.
The environmental scenario in Campania is very complex, revealing intertwined plots of polluting impacts deriving both from ordinary and legitimate production activities and from the importance of anthropic pressure and from illegal activities, which—as sadly known by now is also on a planetary scale for the effect of amplification that took place thanks to the media—regards the criminal management of waste. The criminal matrix of accumulation, disposal and waste management plans in general has in fact seen the suspension of democracy for the promotion of substantially private interests [
36].
However, even in this degraded scenario, what leads us to investigate the issue of the counter-reaction aimed at environmental sustainability in a leverage technology-based approach is the observation of the simultaneous generation of a very significant critical mass of activities to combat criminal environmental management. As the theory of adaptive systems teaches [
37], this has happened and continues to happen in a critical territory, such as that of Campania, through self-organizing movements that move regardless of the institutions and, in some cases, unfortunately, in substitution of the latter.
Against the processes of corruption and the mismanagement of the environmental and biophysical resources, movements of activists and inhabitants have arisen to demand alternative environmental management schemes [
38].
In fact, the politicization of the environmental issue manifested in Campania exemplifies the existence of a competition between different actors, uses and meanings of portions of territory carried out not in a positive sum game logic, which triggers socio-environmental conflicts that increase the fragility of the territory itself, and at the same time in a propositional wave that contrasts with these dynamics. To this second action from below, the funding with environmental purposes obtained through new technologies can provide excellent support capable of channeling and catalyzing the energies at stake.
Puglia, apart from the Gargano area, has more homogeneous values of anthropic pressure and low values of environmental fragility.
A decisive aspect to be taken into account in the assessments of Puglia concerns the Taranto case relating to the well-known events of ArcelorMittal Italy, whose effects on the territory are not directly reversible in terms of the environmental fragility of the area, as they are exogenous but deserving downstream of the data analyzed of possible influences on the concentration of eco-innovative activities.
A similar scenario to that Puglia is revealed for Sicily, where the anthropic pressure is polarized in the urban areas of Palermo and Catania, but the environmental fragility, with the exception of the Catania area, stands at low values.
The state of urbanization in Sicily is, in fact, affected by the phenomenon of urban sprawling, which, starting from the 1970s, has strongly contributed to shaping the regional territory both from a physical and functional point of view. This phenomenon has mainly affected the marginal areas around metropolitan areas where land consumption by low-density settlements amounts to 42% of the entire urbanized territory, or even 75% if we refer to coastal municipalities [
39].
3. The Case Study
The label of “eco-innovative” projects was awarded by analyzing the regional databases, taking into account
Table 1 of the previous introductory paragraph.
Particularly, the proposed methodology envisages two actions, a cartographic and analytical comparison between the distribution of environmental projects and that of environmental fragility and an analytical evaluation of the spatial autocorrelation between contiguous areas to detect any geographical determinisms.
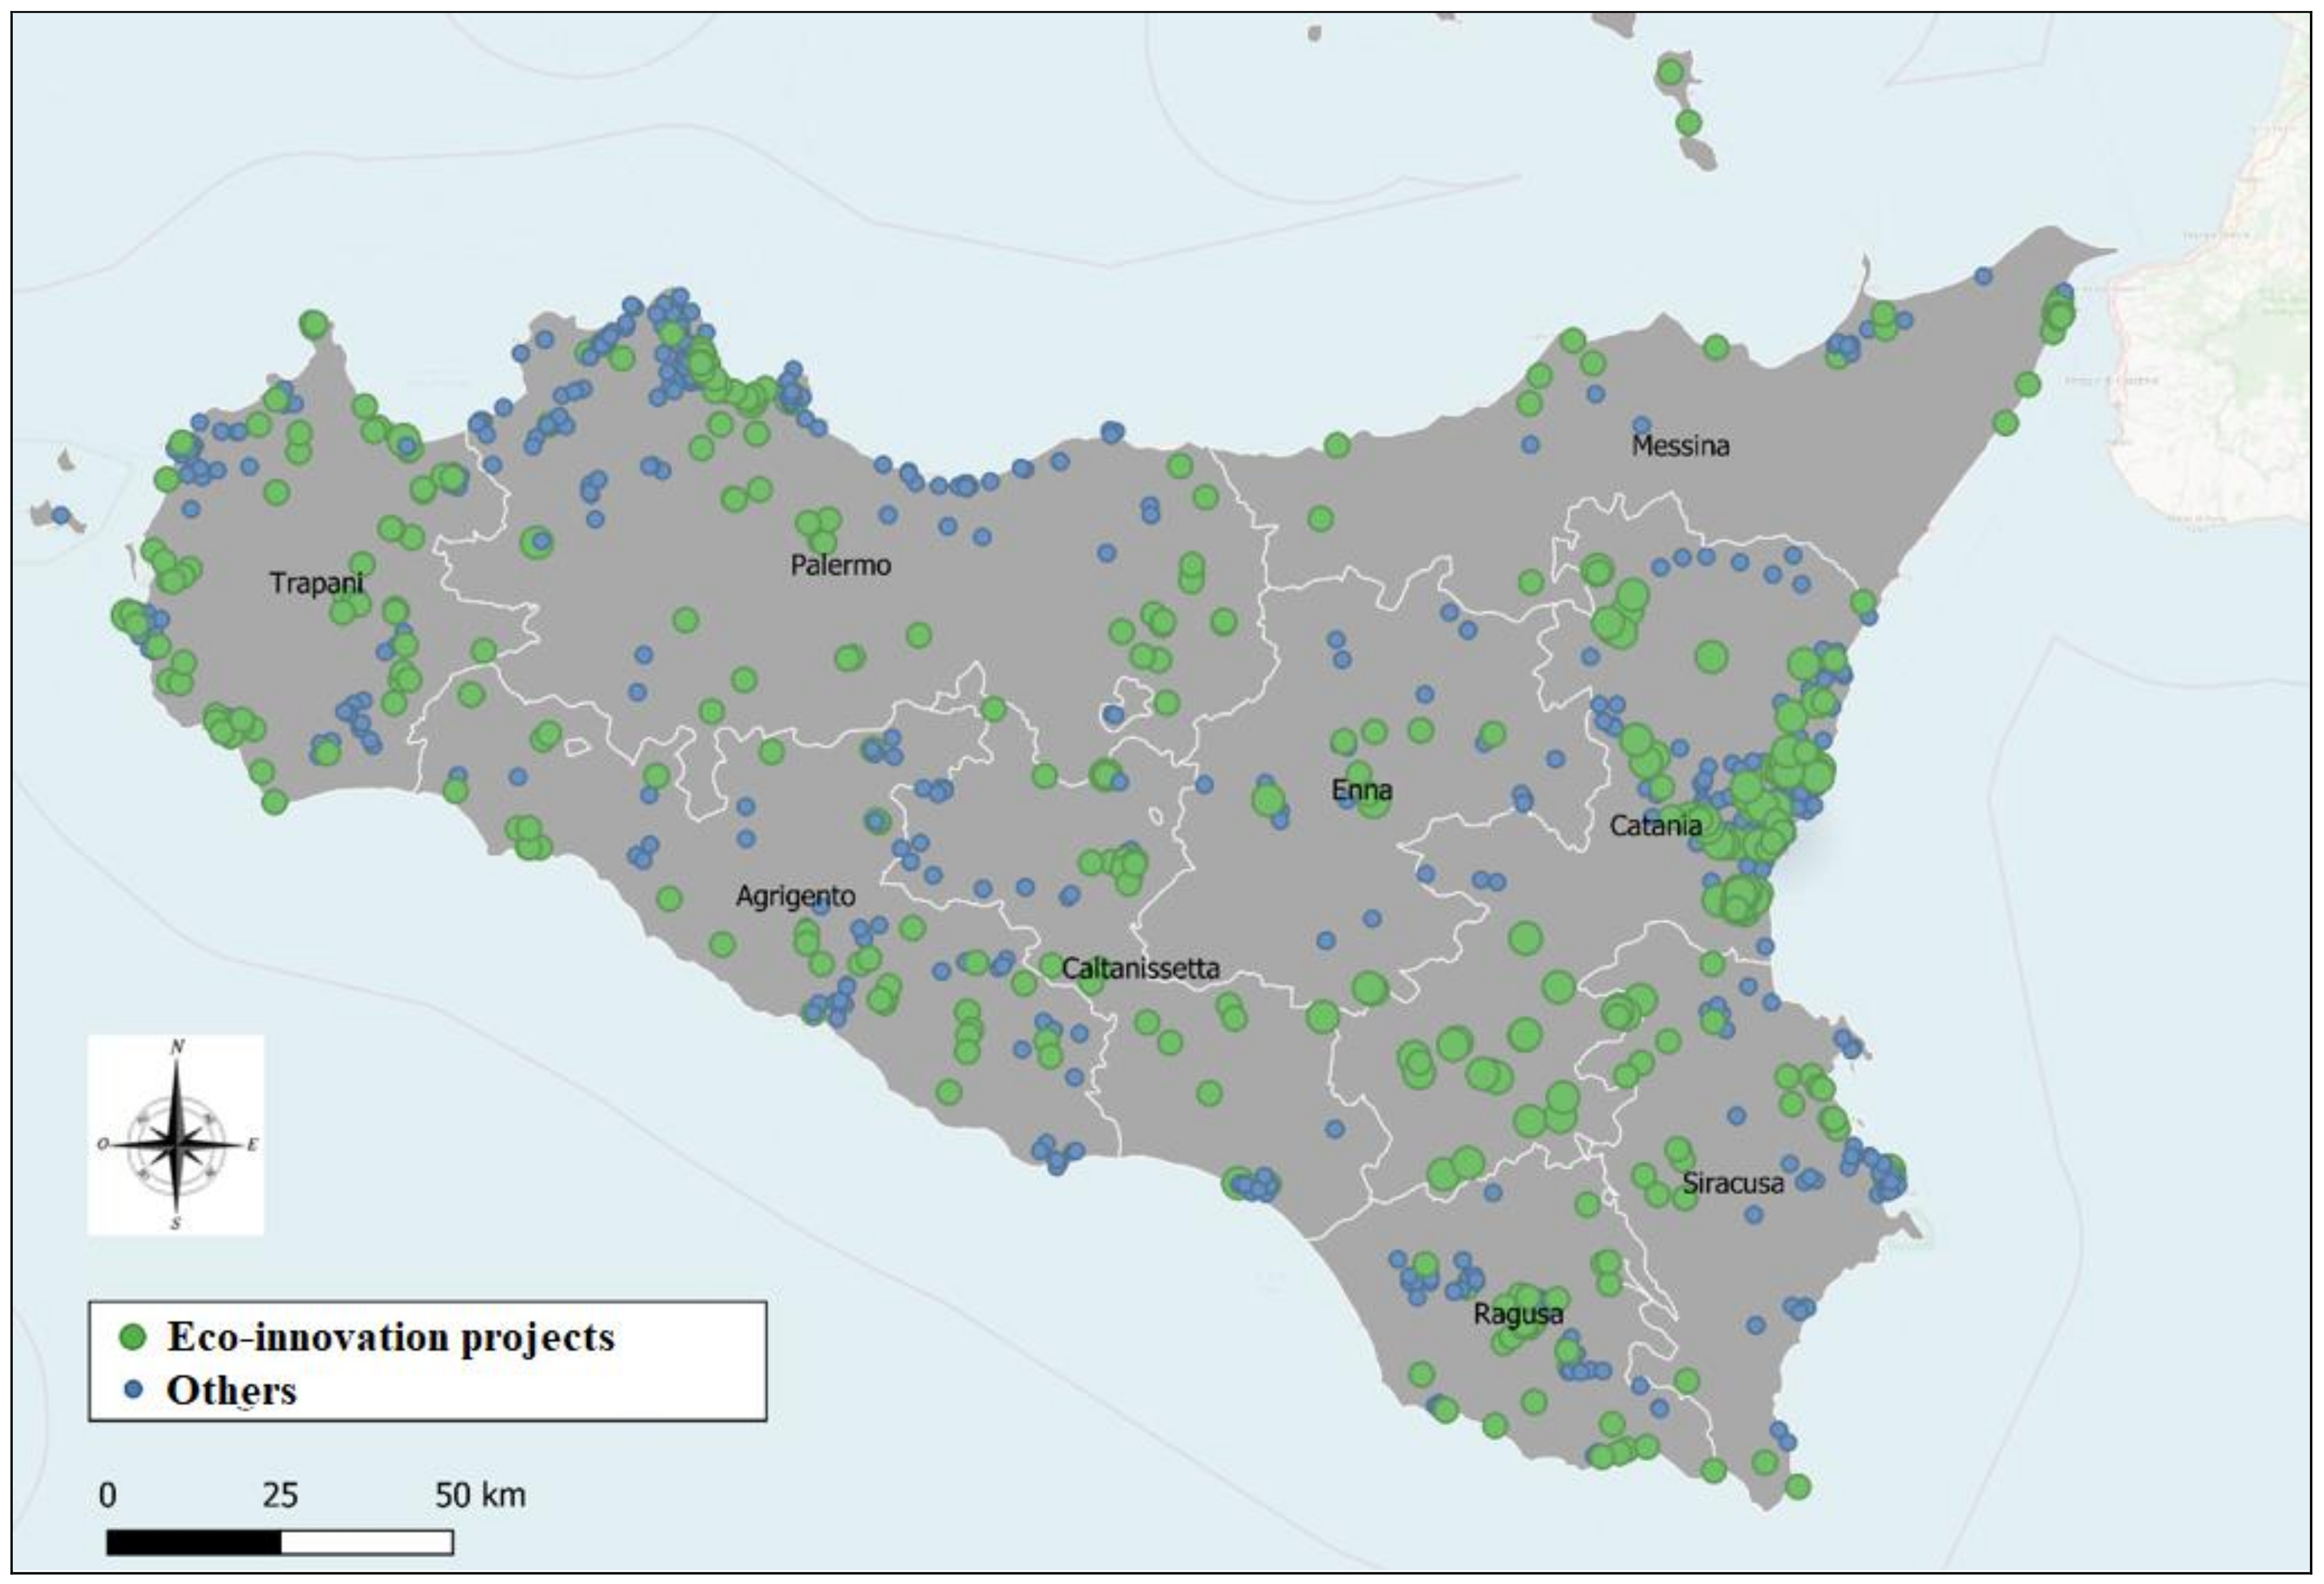
The geo-referencing of the beneficiaries, entities and businesses of the 2014–2020 ROP regional funding in relation to the entire spectrum of the issues put forward shows a rather homogeneous geographical distribution in the three regions (
Table 2;
Figure 4,
Figure 5 and
Figure 6). This evidence is indicative of a low inertia of the actors of the territory with regard to the use of funds for the development of innovative activities as a common feature of the various regions.
Comparing, respectively,
Figure 4 with
Figure 1a,b,
Figure 5 with
Figure 2a,b and, finally,
Figure 6 with
Figure 3a,b, it is possible to recognize a positive relationship between the spatial distribution of eco-innovation projects and the fragility of the territory. The region in which this relationship is the strongest is Campania in relation to high levels of fragility and the high concentration of projects, but Puglia and Sicily also show good levels of correlation between the two distributions. For these last two regions, however, the level of fragility that develops the greatest correlation in spatial terms is the medium and not the high one.
With reference to the second research question, the analysis provides answers to the double hypothesis test reported in expression (1).
For testing of the H
1 hypothesis, the NUTS-3 level and the LISA (local indicators of spatial association) method of spatial autocorrelation by Anselin [
40,
41] were used; for a purely geographical approach, see also Zaccomer and Grassetti [
42].
The percentage of regional funding granted relating to eco-innovation projects on the totality of projects admitted for funding (PECOeff indicator = % PECO/PTOT) was considered a satisfactory proxy in relation to the territorial response, at a provincial scale, by entities and companies in terms of propensity towards environmental sustainability.
This methodology is based on a so-called Moran index, which represents a measure of spatial autocorrelation by comparing differences between values of the reference variable, in this case the production concentration index, between contiguous and non-adjacent areas. The algorithm is based on the construction of a weight matrix. It is a non-stochastic square matrix whose elements wij reflect the intensity of the connection existing between each pair of areas i, j, in this case represented by the provinces of the three regions considered. The measures of this intensity, which necessarily must be non-negative and finite, can be different. In the simplest form, it is based on the concept of binary contiguity according to which the structure of proximity is expressed by values 0–1.
In the present analysis, these laborious steps were not carried out through the open source GeoDa software and the Statgraphics
® software for the construction of the dendrograms in order to determine possible similar clusters between the provinces of the various regions analyzed (
Figure 7).
With reference to the Moran I statistic, it is possible to associate a useful graph that provides complementary and supplementary information. This is the Moran Scatterplot, which shows, in a Cartesian graph, the normalized variable on the abscissa axis and the spatial delay (understood according to the proximity of the weight matrix) of said variable also normalized on the ordinate axis. The Moran statistic is represented by the angular coefficient of the linear relationship between the two variables reported on the axes of the Moran scatterplot. Therefore, if the points are dispersed among the four quadrants, this will indicate the absence of correlation (the angular coefficient is zero). If instead there is a clear relationship, the Moran Scatterplot can be used to distinguish different types of spatial correlation. The results of the Moran Scatterplot can be reported on a map in order to geographically distinguish the areas with different types of correlation (High–High, Low–Low, High–Low, Low–High). Particularly, in this way, it is possible to verify whether the provinces of the regions analyzed are united by a certain type of correlation (Spatial autocorrelation can basically have two causes: (1) measurement errors for observations referring to contiguous geographic units and (2) real spatial interaction. The former can arise whenever data are used for which there is no perfect correspondence between the territorial unit of analysis and the extension of the phenomenon under examination.) Moran′s Scatterplot also has the important function of highlighting possible outliers so that they can possibly be excluded from the analysis if they represent anomalous cases.
The results of the analysis carried out allow us to answer the formulations of hypotheses H1 and H2 of expression (1), and from them we can deduce some interesting specific elements which, in an inductive approach, give rise to some general merit evaluations.
The spatial autocorrelation, evaluated through the P
ECOeff index, is slightly present in Campania, where the Neapolitan urban pole is configured as a pole-attractor, is of low value in Puglia, with a concentration of high values in the Taranto area that goes in discontinuity with the neighboring areas, and is of even lower value in Sicily, where no province triggers phenomena of continuity or discontinuity with respect to the provinces in geographical proximity (
Figure 7).
On the other hand, on an evaluation of the results in terms of homogeneous class hierarchies, the clusters obtained from the analysis of the provincial scale dendrogram (
Figure 8) generally confirm an absence of geographic polarizations—for example, in terms of differentials of coastal areas–inland areas or in terms of urban dimension. Exceptions to this consideration are the metropolitan cities of Naples and Bari, close to each other in terms of index values. Furthermore, some isolated cases constituting territorial peculiarities are evident from the dendrogram, such as the province of Taranto. In this case, as anticipated at the beginning of the contribution, a geographical determinism can be considered prevalent in relation to the well-known environmental issues that have affected the area.
To confirm the presence of a few geographical determinisms, it is also possible to consider (correlation elaborations in the
Appendix B) a certain isomorphism between the different regions, particularly between Campania and Sicily, in relation to the values of all of their analyzed provinces.
The hypothesis H1 of (1) is therefore verified. Its formulation was put in negative terms in relation to the fact that, in the ex ante phase with respect to the reading of the data, already starting from the cartographic distribution of the beneficiaries, a homogeneous territorial response was sensed.
The second aspect relating to the possible correlation between the territorial density of eco-innovation activities and the environmental characteristics of the territory (in particular, the Environmental Fragility in its codified form used) show, on the one hand, as in the Campania case, a superimposition of the two aspects and therefore a positive spatial correlation, and, on the other hand, with reference to the other two regions considered, a fairly massive diffusion even regardless of the environmental characteristics.
In other words, hypothesis H2 of (1) could be said to be satisfied but in the classic mathematical formulation of sufficient but not necessary conditions.
This last aspect, on the one hand, lends itself very well to a positive reading of the phenomenon of eco-innovation in a preventive and therefore not only corrective key with respect to the environmental fragility of the territory, and, on the other hand, confirms some studies [
43,
44] which demonstrate a positive relationship between eco-innovation and corporate performance, a possible lever for pushing towards sustainability regardless of the context conditions.
The third possible scenario which, fortunately, has not emerged relates to the presence of areas with high environmental fragility characterized by a low response in terms of eco-innovative activities.
4. Concluding Remarks
The theme of eco-innovation has been at the center of the scientific, political and industrial debate for several years [
45,
46,
47], but the greater attention paid to environmental sustainability and the availability of cutting-edge technologies with enormous potential and, above all else, a high degree of transversality in their applicability has made it still current and open to reflective spaces.
In the present research, it was decided to analyze the topic through a theoretical framework and a subsequent case study conducted on three southern regions, drawing on the substantial data relating to the projects admitted to the ROP 2014–2020 funding call and using a spatial approach.
The choice of the database through which to investigate the phenomenon arose from the particular purpose of these calls, which perfectly matched the research objectives, also referring to the use of new technologies in the environmental field.
The study showed a good propensity of the different territories in relation both to the general response to calls and, a main element of interest, to the response in terms of eco-innovation projects, the percentage of which among the totality of projects constituted a proxy-indicator of the phenomenon observed, on a provincial scale in each region.
The importance of the spatial approach was twofold. On the one hand, we wanted to demonstrate, through the processing of data, a thesis hypothesized upstream of the research regarding the absence of particular spatial autocorrelations underlying dynamics of the urban pole-internal areas and/or linked to the urban dimension. On the other hand, we wanted to investigate the response of the territories in eco-innovative activities in relation to the fragility of the territories. This second research determinant has shown different scenarios relating both to a causality between the two phenomena and to a “positive” independence in the sense of the presence of eco-innovation even in the absence of environmental fragility but not vice versa.
Some critical issues were addressed in the start of the proposed research. In the first place, although, as shown in the work, several recent studies are going to address the issue of the spatial approach to eco-innovation, some open question remains regarding the theories of other authors who support the a-spatiality nature of innovation, the importance of technologies and the endogenous organization of companies rather than the relationship with the territory. For instance, the ‘myth of placelessness’ [
48] and the ‘exaggerated death of geography’ [
49,
50] by pointing to the distinctive geographies of the Internet [
51,
52].
Secondly, it needs to be considered whether the time period where eco-innovation activities are established is adequate to provide a valid impact assessment. The 2014–2020 beneficiaries slot indicates, in fact, a narrow time frame in order to give an activity the opportunity to flourish and impact its area.
With reference to both of these two criticalities, we believe that the research perspective of this work is indifferent, as it relates to the specific relationship between politics and eco-innovation. Since the private return on eco-innovation is lower than the social one, there is, in fact, a need for public support to encourage private investment. The empirical evidence strongly supports the idea that environmental policy is significant in driving the adoption of eco-innovations [
53].
In other words, with the empirical analysis conducted, we did not want to demonstrate in an inductive form the uniqueness and profitability of a spatial approach for eco-innovation but rather to understand the trend and orientation of beneficiaries of funds for eco-innovation and to exploit them in certain fragile areas rather than in others.
In this sense, on the one hand, the results obtained do not contrast with the theories promoting a-spatiality of innovation, and, on the other hand, the short duration of the observation window, equal to the duration of distribution of the funds, nevertheless meets the objective thus placed.


