Article

Genetic Analysis of Geothermal Resources in Deep-Seated Fault Area in Tonghe County, Northeast China and Implications of Geothermal Exploration

1
Department of Hydrological Engineering Environment, Heilongjiang Geological Science Institute, Harbin 150038, China
2
State Key Laboratory of Biogeology and Environmental Geology, China University of Geosciences, Wuhan 430078, China
*
Author to whom correspondence should be addressed.
Sustainability 2022, 14(9), 5431; https://doi.org/10.3390/su14095431
Submission received: 14 March 2022 / Revised: 18 April 2022 / Accepted: 28 April 2022 / Published: 30 April 2022

Abstract

:
Northeast China is an area with high energy consumption and high carbon emissions, and the utilization of geothermal resources can effectively overcome these problems. However, there are few geothermal manifestations in Northeast China and no systematic method for geothermal exploration at present, which hinders the utilization of geothermal resources. Here, a systematic analysis, including hydrochemistry, petrology, isotopes, controlled source audio magnetotelluric sounding, drilling, and temperature curve of two boreholes was carried out to investigate the genesis of geothermal resources in Tonghe County, Northeast China, along the Yilan-Yitong lithospheric fault (YYF). We found that the geothermal water is alkaline Na-HCO3 type water, is of local meteoric origin, and is recharged from the hilly area with an elevation of ~280 m around the study area. We established a geothermal water circulation path model: (1) cold water infiltrated along the YYF to a depth of 2–3 km, (2) cold water was heated by mantle heat, and (3) hot water was stored in sandstone/siltstone, forming a sandstone geothermal reservoir with a temperature of ~70 ℃. These results have important guiding significance for the scientific exploration of geothermal resources in Northeast China.

1. Introduction

The development of the global economy is accompanied by rapid consumption of energy, coupled with the environmental damage caused by the traditional energy consumption process, energy restructuring, new energy development, and clean energy utilization are of great importance on a global scale [1]. Geothermal energy has been gaining more and more attention in the past decade because of the huge amounts of geothermal resources and their wide distribution, as well as its environmentally friendly advantages [2,3]. Geothermal energy is becoming one of the effective ways to solve the problems faced by China, or even the world, such as energy shortages and serious air pollution. Whether the establishment of a geothermal heat pump [4] or geothermal power plant [5], geothermal energy is promising.
In general, geothermal resources are mainly located in granite distributed areas with high heat production (e.g., South China, [6]), around modern volcanoes (e.g., Krafla volcano, [7]), in a sedimentary basin (e.g., Rhine Graben, [8]), and in areas of intense tectonic activity areas (e.g., Indonesia geothermal belt, [9]). Granite with a high concentration of heat-producing elements (e.g., Th, U, and K), which undergo radioactive decay to produce heat and subsequently concentrate heat to form geothermal resources, is the major component of geothermal resources in high heat-producing locations [10]. Modern volcanic and geothermal resources are concomitant and derive their heat primarily from the release of heat from molten, high-temperature magma, including erupted magma and uncondensed magma chambers [11]. Geothermal resources in sedimentary basins are mainly formed by low thermal conductivity caps protecting reservoirs heated by geothermal warming or heat loss of inner heat [12,13]. Geothermal resources in active tectonic zones involve thermal anomalies due to frictional heat generation [14], magma upwelling [15], deep fluid circulation [16], lithospheric thinning [17,18], etc. Deciphering the genesis of geothermal resources in a region requires a combination of geological background, hydrology, fracture structure, rock geochemistry, geophysics, and other disciplines. A typical example is the Soultz-sous-Forets geothermal site; geological features [19], geophysics [20], fractures [21], numerical simulations [22], modeling [23], etc. are all focuses of the research. Therefore, a systematic geothermal genesis analysis is necessary.
Northeast China is a major source of greenhouse gases due to its extremely cold winters and its high demand for heating, which is dominated by coal-fired heating. Geothermal resources have a variety of advantages that determine their great potential for application in Northeast China. However, the available geothermal surveys show that geothermal manifestations (e.g., hot springs) in the Northeast are almost exclusively distributed in the Songliao Basin, some volcanic areas, and parts of the region’s large deep-seated fault (Figure 1). The utilization of regional geothermal energy resources is hampered by this scenario. As a result, figuring out how to conduct geothermal exploration in Northeast China is a pressing issue that must be addressed.
Here, we conducted a systematic investigation in Tonghe County (study area), which is located on the Yilan-Yitong deep-seated lithospheric fault (YYF) and almost without surface geothermal manifestations. The investigation includes hydrology, drilling, geophysics, and rock geochemistry. We propose a geothermal genesis model for this area by combining these investigation results. We believe that this systematic analysis of geothermal resources could be a good example for other geothermal explorations in NNortheast China.

2. Materials and Methods

2.1. Geological Background of the Study Area

From the perspective of regional tectonics, the NNortheast China block is located in a relatively stable area, with the Siberian Craton to the north, North China Craton to the south, Central Asia Orogenic Belt to the West, and Pacific Plate tectonic zone to the East (Figure 1). From the viewpoint of local tectonics, the Northeast China block consists of four sub-blocks, from east to west, Jiamusi block, Songliao block, Xing’an block, and Erguna block (Figure 1). These multi-plates/cratons/blocks/sub-blocks collided or combined in the Paleozoic and Mesozoic eras, forming numerous magmatism and special geological structures, for example, suture belts and fault zones [24]. Since the Mesozoic, the Northeast China block has undergone intensive extensional tectonics influenced by the subduction and roll-back of the Pacific and Izanagi plate [25], which was manifested by extensive volcanism [26], metamorphic core complexes [27], and a series of extensional basins (e.g., Songliao basin, Figure 1, [28]), as well as the large-scale deep-seated fault [29,30].
The study area is sandwiched in the Quaternary River valley between the magmatic rock mountains in the Southeast and Northwest, and located in the YYF. At the surface, the fault zone manifests as two near-parallel faults on each side of the river valley and serves as the boundary of the valley (Figure 2). This fault is a large regional strike-slip with a normal fault characteristic that belongs to the Tan-Lu deep-seated fault, and is a suture belt between the Jiamusi sub-block and the Songliao sub-block. Meanwhile, this fault has been active since its formation in the Mesozoic and has become the main factor controlling the geological structure around the fault [29,30]. Specifically, all faults and structures in the study area are secondary to and controlled by the YYF (Figure 2). The North and South of the study area are mainly composed of Mesozoic monzogranite and granodiorite. In addition, it also contains some Paleozoic and Proterozoic monzogranite, granodiorite, and gabbro. Notably, Paleogene basalts are exposed in the Southern part of the study area, implying that magmatic activity existed in this area at least during the Cenozoic.

2.2. Sampling and Analysis Methods

To study the geothermal resources in Tonghe County, two water samples (hot spring, W-1 and W-2) were collected from the Tongre-1 and Tongre-2 drilling in May 2018, respectively, 48 h after well completion. pH and TDS were measured in the field using handheld meters (HACH hqd water quality detector). SiO2 concentration of the water samples was also measured in the field using a silica meter (Hanna HI96770). The alkalinity of water samples was determined by titration on-site using 0.025 N HCl. The samples were then filtered, stored, and sent to the laboratory for testing and analysis. Refer to the study of Mao et al. [32] for a detailed process and method of testing.
A granitic rock sample (R-1) was also collected for geochemical analysis. R-1 was tested using a ZSX Primus II X-ray fluorescence spectrometer and an ICP-MS (Agilent 7700e) for major and trace elements, respectively, at the Harbin mineral resources supervision and testing center of the Ministry of natural resources.
In addition, a geophysical exploration method, controlled source audio magnetotelluric sounding (CSAMT), was used to obtain the underground structure in the study area. Four profiles were completed for this work, located in two areas, with a total length of 30 km. The dipole equatorial is used for scalar measurements, and the horizontal component Ex of the electric field parallel to the field source and the horizontal component Hy of the magnetic field orthogonal to the field source are observed simultaneously. In data processing, the impedance resistivity is calculated by using the electric field amplitude Ex and magnetic field amplitude Hy. The impedance phase (φ) is calculated by using the electric field phase Ep and the magnetic field Hp. Finally, the resistivity parameters were inversed and interpreted by impedance resistivity and impedance phase. The field data collection used the GDP-32 type II multifunctional electrical instrument produced by the Zonge company. The distance between the field source power supply electrode is 1500 m, the distance between the measuring electrode and the power supply electrode is 50 m, the power supply electrode and the measuring electrode are arranged in parallel, the transceiver distance is 7 km, the working frequency is 0.1~10,000 Hz, and the effective exploration depth is 3000 m. For the original field data, we performed the pre-processing, including eliminating distortion points, smoothing data, static correction, and near-field correction. Finally, the data were inverted in two dimensions using SCS2D and formatted using MODSECT in order to obtain the apparent resistivity sections.
Furthermore, two geothermal drillings (Tongre-1 and Tongre-2) were settled for the geothermal resource exploration and verification of the geophysical results. The drilling depth of Tongre-1 is 1800.40 m; from shallow to deep, the strata are Quaternary (0–22.44 m), Neogene (22.44–691.00 m), and Paleogene (691.00–1800.40 m). The lithology is mainly composed of sandstone, siltstone, mudstone, argillaceous siltstone, etc. The Tongre-2 drilling is similar to the Tongre-1 drilling, with basically the same strata and lithology and a depth of 2720.00 m.

3. Results and Discussions

3.1. Recharge Source and Elevation of Water Samples

Although the two water samples come from two different wells, their hydrochemical composition and even isotopic composition (δ18O and δD) are basically similar (Table 1). Both are alkaline water, and the distribution characteristics of NO3 imply they are mainly from the reduction environment in the deep. In addition, the distribution characteristics of Cl and SO42− may indicate a single source for them. Compared to W-1, W-2 contains more Na+, HCO3−, and Cl composition. The Piper diagram shows that both are Na-HCO3 type water (Figure 3).
Stable isotopes of hydrogen and oxygen can be used to track the circulation of water as well as the source of hot springs [32]. According to the comparison of the hydrogen and oxygen stable isotopes of hot springs with those of local meteoric waters, the origin of the hot spring can be determined. As shown in Figure 4, all the data points are close to the local meteoric water line (LMWL) suggested by Yan et al. [33] and are parallel with the global meteoric water line (GMWL) proposed by Craig [34], indicating that local precipitation is the major origin of the W-1 and W-2.
Hydrogen and oxygen stable isotopes have a significant elevation effect and the recharge elevations of W-1 and W-2 are calculated by the following Equation (1),
H   =   H 0 + ( δ O 18 δ O 18 r ) / g
where H is the recharge elevation of the W-1 and W-2, m; H0 is the elevation of the W-1 and W-2 sampling site, m; δ18O and δ18Or are the value of recharge of water samples and the reference point, respectively, ‰; g is the δ18O isotope height gradient, the value of g is −0.25 ‰/100 m [35]. δ18Or is the average δ18O value of local rainwater samples (−13.2‰, [35]). Thus, the theoretical values of recharge elevation of the W-1 and W-2 were estimated to be 294 m and 270 m, respectively. Considering the local topography, the main recharge area should be the granitic hilly area in the North and South of the study area.

3.2. Temperature of the Reservoir and Circulation Depth of Water Sample

The reservoir temperature can be estimated by geothermometer on the basis of the chemical and isotopic composition of the geothermal water and temperature-dependent water–rock reactions [36]. At present, cation geothermometers (e.g., Na-K and Na-K-Ca) and silica geothermometers (e.g., quartz) are widely used. The conditions for using cation geothermometers require a balanced water–rock reaction. As shown in Figure 5, W-1 and W-2 are both located in the partial equilibrium area, suggesting the two water samples did not reach the water–rock equilibrium. In other words, cation geothermometers are not suitable for measuring reservoir temperatures in the study area.
Considering that no secondary siliceous minerals were found in both drill cores, this study used conductive cooling without steam loss of quartz geothermometer to calculate the reservoir temperature as follows in Equation (2) [38],
T   = 1309 5.19 log Cs 273.15
where Cs is the concentration of the SiO2, mg/L. Based on this equation, the temperatures of the geothermal reservoir are 69 °C and 61 °C, respectively, for W-1 and W-2. The two similar temperatures indicate that the reservoir temperature in the whole study area is about 70 °C.
In general, the circulation depth of the hot spring deepens with the increasing temperature of the geothermal reservoir. The relationship between them is shown in Equation (3) [39],
d   = T r T 0 k +   h
where d is the circulation depth of the hot spring, m; Tr is the reservoir temperature, °C; T0 is the temperature of the normal temperature zone, °C—this study used the local annual mean temperature (3.6 °C); k is the geothermal gradient, °C/m; h is the thickness of normal temperature zone—this study used 15 m as the thickness. According to the temperature measurement curves of Tongre-1 and Tongre-2 (Figure 6), the geothermal gradients are 3.32 °C/100 m and 1.81 °C/100 m, respectively. Therefore, the circulation depth of the W-1 and W-2 are 1984.9 m and 3186.3 m. Notably, the temperature of the geothermal reservoir calculated by quartz geothermometer (W-1: 69 °C, 1984.9 m; W-2: 61 °C, 3186.3 m) is comparable to the temperature measured in the borehole (Tongre-1: 59.76 °C, 1800 m; Tongre-2: 67.1 °C, 2700 m). Although the calculated temperature differs slightly from the measured temperature, the difference is within acceptable range, indicating that the quartz geothermometer employed in this study is adequate.

3.3. Analysis of Geothermal Reservoirs Distribution

In the study area, the NE-trending fault zone basically controls the regional tectonic pattern, and the CSAMT sections are set with SE trending to determine the structure of the fault and the geothermal reservoir. CSAMT geophysical surveys can effectively obtain the resistivity variation characteristics of bedrock at a depth of less than 3000 m. Generally, the resistivity of geological bodies containing water is low. The resistivity of clastic rocks and mudstones is also relatively low because large pores can contain a large amount of water [40,41]. Accordingly, the fault zone, which contains a large amount of water, exhibits low resistivity. Thus, such low resistivity anomaly features can be used to interpret the deep structure and location of a fault.
According to the known geological background and borehole cores, the Quaternary strata in the area are very thin (less than 50 m), and the main strata are Paleogene and Neogene strata. Here, according to the characteristics of borehole core and our previous work in the granitic area [42], we determined that the geological body with a resistivity of 0–20 Ωm is an argillaceous rocks layer, the geological body with a resistivity of 20–2100 Ωm is a sandstone and siltstone layer, and the geological body with a resistivity more than 2100 Ωm is granitic rock. The sandstone and siltstone layer includes grayish green sandstone, gray conglomerate, grayish-green coarse sandstone, grayish-white conglomerate, yellowish-brown sandy conglomerate, and yellowish-brown siltstone. The wide variation range of resistivity of sandstones is due to the different content of sandstone and siltstone in different layers, as well as the different argillaceous components and water content. Such features of variation in resistivity could effectively interpret the deep structure of geothermal reservoirs.
In Profile 1 (Figure 7a), the occurrence of relatively high-resistivity strata in the surface layer represents the Quaternary strata with a thickness of about 50 m. A relatively high-resistivity layer appears at about 200 m, which may be a set of sandstone. With increasing depth, a layer with higher resistivity does not appear until about 1500 m. In other words, the complete set of sandstone layers appears at 1500 m, and the burial depth of sandstone layers deepens to the Southeast (towards the river). Meanwhile, the deepening trend of depression basin depth is coupled with those of the burial depth of sandstone layers. The distribution characteristics of this rock stratum are similar to those of borehole cores, indicating that the CSAMT data are genuine and believable.
Profile 2 (Figure 7b) and Profile 1 are comparable in deep structure since they are near to one another. These two profiles exhibit sandstone and siltstone as the underlying stratigraphy with a depth of more than 1500 m, overlain by Paleogene and Neogene argillaceous rocks with depths between 50–1500 m, and the uppermost part is a Quaternary sandy conglomerate with a depth of less than 50 m.
Profile 3 (Figure 7c) shows a structural framework of Quaternary sandy conglomerate, argillaceous rocks, and sandstone and siltstone, from top to bottom. Between Station 6 and Station 14, a low-resistivity geological body reaches a depth below 3000 m. This geological body is almost vertically downward in spatial distribution. Combined with the structural background of the study area, we conclude such features of structure to be the YYF rather than the disordered distribution of argillaceous rocks. For one thing, as a strike-slip shear lithospheric fault, YYF has a large dip angle; for another, the water filling in the fault zone meets the characteristics of low resistivity. Furthermore, there is a distinct layer of relatively low-resistivity geological bodies about 2500 m depth, revealing that the fluid moves laterally and upward between Station 20 and Station 26. This is an obvious fluid circulation path: surface water seeps down to about 2500 m (confirmed by water chemistry, see Chapter 3.2) along the fault zone, then moves laterally, and subsequently migrates upwards. In addition, there is a high-resistivity body between Station 30 and Station 38, which is considered to be Mesozoic concealed granitic rock. Between the granitic rock and the sandstone/siltstone, a fracture zone (F1) may exist, acting as a channel for upward fluid migration.
The subsurface structure between Stations 60–114 in Profile 4 (Figure 7d) is similar to that of Profile 3, showing characteristics of YYF, fracture zone between a granitic rock and sandstone/siltstone, and layered characteristics of argillaceous rocks and sandstone/siltstone. The entirety of Profile 4 demonstrates that there is a massive Mesozoic granitic rock beneath 700 m underground in the study area.

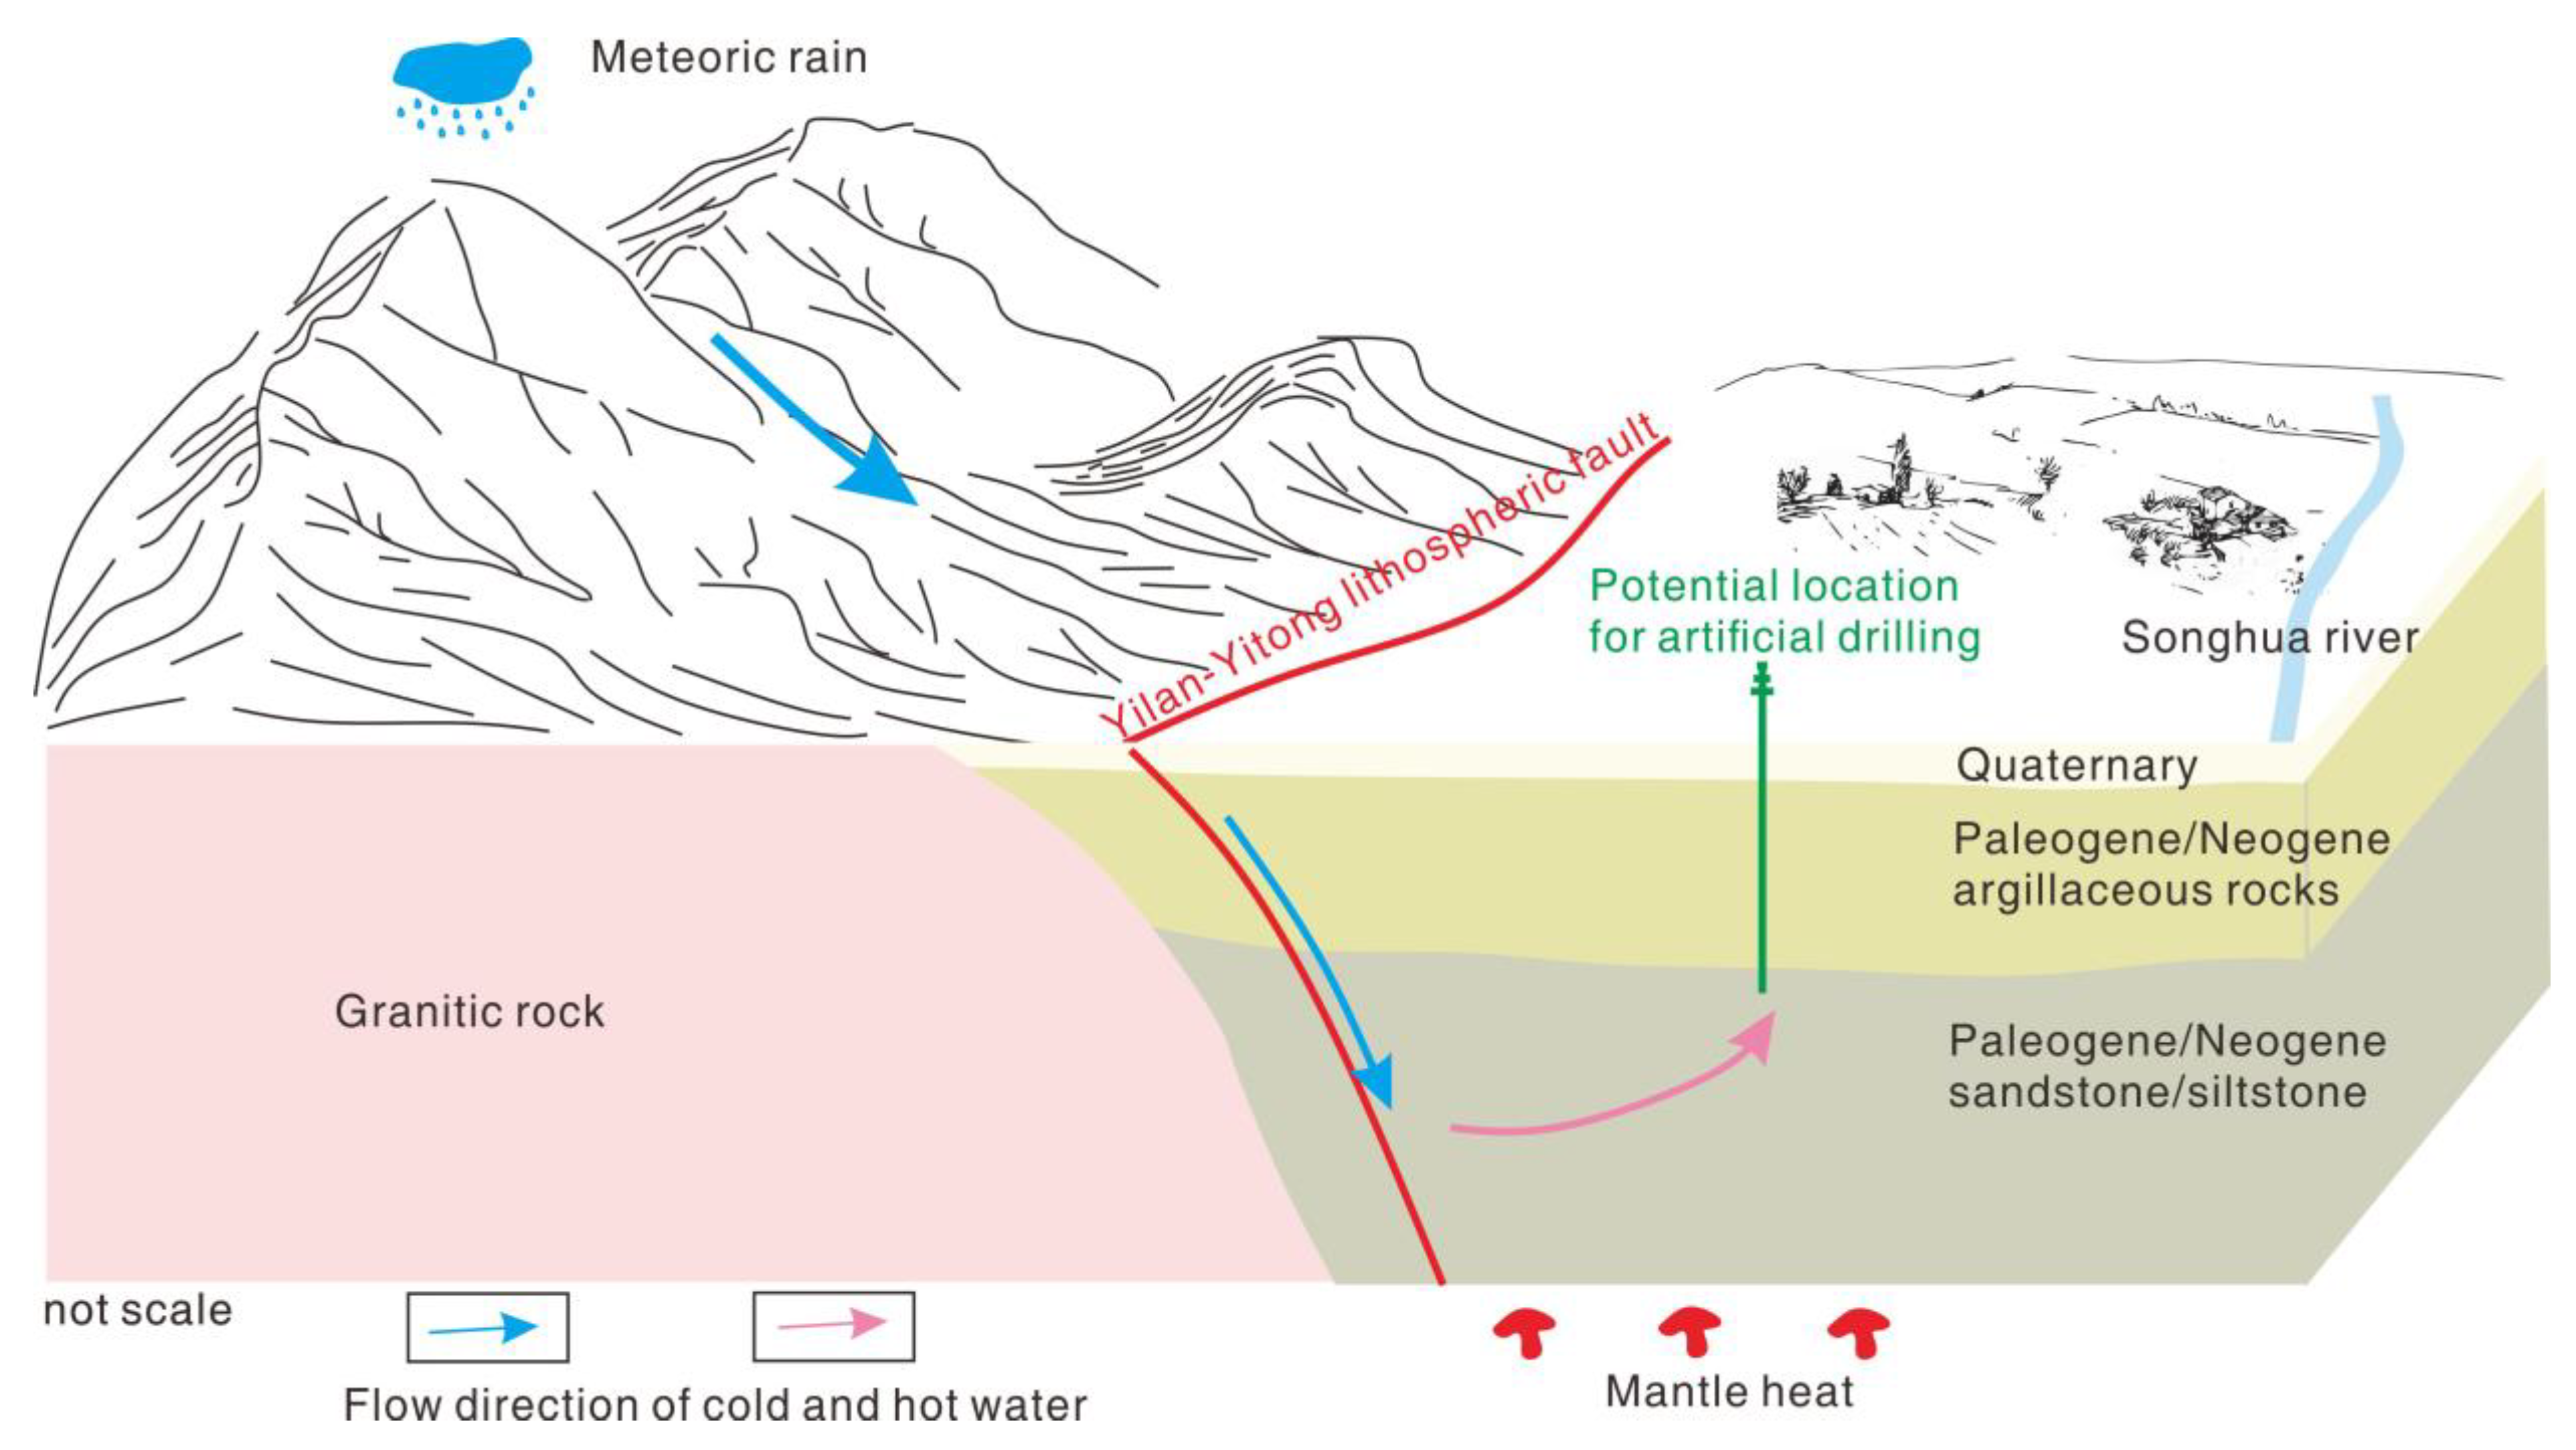
3.4. Conceptual Model of Formation and Evolution of Geothermal Waters

A conceptual model for the formation and evolution of geothermal water in the Tonghe area can be estimated based on the foregoing discussion. As shown in Figure 8, surface water originated from the hills with an elevation of about 290 m surrounding the study area, seeping down to about 2500 m along the YYF fault zone, and subsequently, the fluid begins to move laterally and is thermally heated. Hot water is stored in sandstone and siltstone of Paleogene and Neogene origin, and the covering of overlying argillaceous rock is conducive to the preservation of temperature, forming a low- to medium-temperature heat reservoir. The hot water in this thermal reservoir can be transported upward through the fracture zone between the granitic rock and the country rock (sandstone and siltstone) or can be utilized through artificial drilling.

3.5. Heat Source of Geothermal Water and Implications for Geothermal Exploration

The geothermal heat source is divided into two parts: crust and mantle. Crustal heat sources mainly come from the radiogenic decay of heat-producing elements in granite [10], frictional heat from fracture zones [43], and heat release from the magma chamber [44]. Much research has been performed to calculate the heat production of radioactive elements in rocks based on their concentration of radioactive elements. The commonly known calculating Equation (4) is employed as follows,
A   = 10 5 ×   ρ   × ( 9.52 C U + 2.56 C Th + 3.48 C K )
where A is the heat production rate, μW/m3; ρ is the density of rock—here we used 2.677 g/cm3 for the granitic rock [6]; CU, CTh, and CK are the concentrations of uranium, thorium, and K2O, in μg/g, μg/g, %, respectively. Hence, the heat production rate of the granitic rock in this study area is calculated to be 1.33–2.09 μW/m3. Such values are equivalent to the average heat production rate of the upper continental crust (1.67 μW/m3, Table 2), and are far lower than the standard of granite as an effective heat source (>3.1 μW/m3, [45]). For the friction heat of the fracture zone, despite the fact that the YYF is still active, the study area and its perimeter are mostly on the stable block with no large earthquakes reported in or around the study area throughout the historical period [46]. For the magma chamber, there are no reports of volcanoes or magma chambers in and around the study area (<100 km). In addition, combined with the geothermal gradient of the two boreholes, the geothermal heat in the study area should be caused by the conduction of mantle heat in the crust. In sum, the thermal contribution of heat generated by the crust to the study area is very small; however, contributions by the mantle dominate.
The thermal manifestation of heat from the mantle near the surface is mainly determined by the thickness of the lithosphere, as well as by the Curie point depths [48]. Recently, a numerical test combined with a geomagnetic anomaly model of NGDC-720-V3.1 was used to obtain the Curie depth and lithospheric thickness in Northeast China [49]. The study area is located in a zone with high values of depth and lithospheric thickness, about 28 and 90 km, respectively, according to the result of the numerical text (Figure 9). As a comparison, the Changchun-Siping area, which is also on the YYF fault zone, is rich in geothermal resources detected by boreholes due to its shallow Curie depth and thin lithosphere thickness (Figure 9). Similarly, the Daqing area, which is also located on a basin without granite and deep-seated fault, is extremely rich in geothermal resources [50,51] due to its shallow Curie depth and thin lithosphere thickness. Other hot waters originating from natural hot springs and boreholes are also located in areas with shallow Curie depth and thin lithosphere thickness. Thus, it appears that geothermal resources in the Northeast are more likely to be controlled by lithospheric thickness and Curie depth. Indeed, the volcanic areas must be excluded as volcanoes and geothermal resources are coupled. Additionally, we do not deny the importance of heat from the radioactive heat production of granite and fault friction for geothermal resource formation. In fact, the A of such granite must be greater than 3.1 μW/m3 or even greater than 5 μW/m3. The tectonic activity must also be much greater than the YYF in the study area. Notably, the ratio of heat flow between the mantle and crust in the Northeast area is 4:3 [52], so the heat from the radioactive heat production of granite and fault friction in Northeast China is not dominant. In contrast, mantle heat is the main source of geothermal anomalies in Northeast China. Accordingly, lithospheric thickness and shallow Curie depth dominate the geothermal energy extraction potential in Northeast China. For geothermal resource exploration in Northeast China, thin lithosphere thickness and shallow Curie depth are the first controlling factors, and high heat-producing granite and fault friction can provide additional heat sources. In sum, the area with thin lithosphere and shallow Curie depth is the practicable area of geothermal exploration in Northeast China in the future.

4. Conclusions

The hot spring obtained by drilling along the YYF is low-temperature alkaline Na-HCO3 type water. Combined with the stable hydrogen and oxygen isotopes, the recharge source of the geothermal water is local meteoric water, with a recharge elevation of about 280 m covering the hilly areas around the study area. The temperature of the geothermal reservoir is about 70 °C using a quartz geothermometer, and the corresponding circulation depth is 2–3 km. The inversion results of the four CSAMT profiles show that there is a Quaternary strata layer, a Paleogene-Neogene argillaceous rock layer, and a Paleogene-Neogene sandstone/siltstone layer, from the surface to subsurface, which was verified by drilling. Moreover, the CSAMT results clearly display that cold water infiltrates along the YYF and is stored in the Paleogene-Neogene sandstone/siltstone layer, forming a sandstone geothermal reservoir. Notably, for the heat reservoir in the study area, hot water with a temperature of 70 °C can be used in steps: heating, bathing, breeding, etc. The cost of developing a geothermal well is much lower than the coal-fired cost used for heating and income from breeding and bathing.
The heat generation rate of local granitic rock and the friction heat of the fault zone cannot serve as the main heat source. The geothermal heat in the study area should be caused by the conduction of mantle heat in the crust due to the shallow Curie depth and the thin lithosphere thickness. The relationship between the Curie depth, lithospheric thickness, geothermal manifestations, and fault tectonics reveals that the geothermally favorable areas in Northeast China are those with shallow Curie depth and thin lithospheric thickness. Future geothermal exploration in Northeast China should focus on such areas.

Author Contributions

Conceptualization, methodology, software, investigation, writing—original draft preparation, G.W.; visualization, supervision, writing—review and editing, J.K. All authors have read and agreed to the published version of the manuscript.

Funding

This study was funded by Pre-feasibility Geothermal Resource Survey for Songhua River (Qinghe and Fangzheng) Self-driving Tour Base.

Institutional Review Board Statement

Not applicable.

Informed Consent Statement

Not applicable.

Data Availability Statement

Not applicable.

Acknowledgments

We are grateful to Wang Lianguo, Su Yanmin, Kang Mingchun, Zheng Yu, Zhao Qun, and Li Zhe for their help in sampling, testing, and mapping. Figure 1 was drawn by the Generic Mapping Tools [53]. We are grateful to two anonymous reviewers for critical reviews that helped to improve the manuscript. We also thank the editor for processing our work.

Conflicts of Interest

The authors declared that they have no conflict of interest to this work.

References

  1. Alagappan, L.; Orans, R.; Woo, C.K. What drives renewable energy development? Energy Policy 2011, 39, 5099–5104. [Google Scholar] [CrossRef]
  2. Lund, J.W.; Toth, A.N. Direct utilization of geothermal energy 2020 worldwide review. Geothermics 2021, 90, 101915. [Google Scholar] [CrossRef]
  3. Moya, D.; Aldás, C.; Kaparaju, P. Geothermal energy: Power plant technology and direct heat applications. Renew. Sustain. Energy Rev. 2018, 94, 889–901. [Google Scholar] [CrossRef]
  4. Self, S.J.; Reddy, B.V.; Rosen, M.A. Geothermal heat pump systems: Status review and comparison with other heating options. Appl. Energy 2013, 101, 341–348. [Google Scholar] [CrossRef]
  5. El Haj Assad, M.; Bani-Hani, E.; Khalil, M. Performance of geothermal power plants (single, dual, and binary) to compensate for LHC-CERN power consumption: Comparative study. Geotherm. Energy 2017, 5, 17. [Google Scholar] [CrossRef]
  6. Zhou, Z.-M.; Ma, C.-Q.; Qi, S.-H.; Xi, Y.-F.; Liu, W. Late Mesozoic high-heat-producing (HHP) and high-temperature geothermal reservoir granitoids: The most significant geothermal mechanism in South China. Lithos 2020, 366–367, 105568. [Google Scholar] [CrossRef]
  7. Eggertsson, G.H.; Lavallée, Y.; Kendrick, J.E.; Markússon, S.H. Improving fluid flow in geothermal reservoirs by thermal and mechanical stimulation: The case of Krafla volcano, Iceland. J. Volcanol. Geotherm. Res. 2020, 391, 106351. [Google Scholar] [CrossRef]
  8. Vidal, J.; Genter, A. Overview of naturally permeable fractured reservoirs in the central and southern Upper Rhine Graben: Insights from geothermal wells. Geothermics 2018, 74, 57–73. [Google Scholar] [CrossRef]
  9. Stimac, J.; Nordquist, G.; Suminar, A.; Sirad-Azwar, L. An overview of the Awibengkok geothermal system, Indonesia. Geothermics 2008, 37, 300–331. [Google Scholar] [CrossRef]
  10. Bea, F. The sources of energy for crustal melting and the geochemistry of heat-producing elements. Lithos 2012, 153, 278–291. [Google Scholar] [CrossRef]
  11. Wilson, C.J.N.; Rowland, J.V. The volcanic, magmatic and tectonic setting of the Taupo Volcanic Zone, New Zealand, reviewed from a geothermal perspective. Geothermics 2016, 59, 168–187. [Google Scholar] [CrossRef]
  12. Cacace, M.; Kaiser, B.O.; Lewerenz, B.; Scheck-Wenderoth, M. Geothermal energy in sedimentary basins: What we can learn from regional numerical models. Geochemistry 2010, 70, 33–46. [Google Scholar] [CrossRef]
  13. Procesi, M.; Ciotoli, G.; Mazzini, A.; Etiope, G. Sediment-hosted geothermal systems: Review and first global mapping. Earth-Sci. Rev. 2019, 192, 529–544. [Google Scholar] [CrossRef]
  14. Hochstein, M.P.; Regenauer-Lieb, K. Heat generation associated with collision of two plates: The Himalayan geothermal belt. J. Volcanol. Geotherm. Res. 1998, 83, 75–92. [Google Scholar] [CrossRef]
  15. González-Partida, E.; Camprubí, A.; López-Hernández, A.; Santoyo, E.; Izquierdo-Montalvo, G.; Pandarinath, K.; Yáñez-Dávila, D.; González-Ruiz, L.E.; González-Ruiz, D.; Díaz-Carreño, E.; et al. Distribution of hypogene alteration and fluid evolution in the Los Humeros Geothermal Field (Puebla, Mexico): Multiple sourced fluids, interrelations, and processes in a superhot system. Appl. Geochem. 2022, 136, 105159. [Google Scholar] [CrossRef]
  16. Jiang, Z.; Xu, T.; Owen, D.D.R.; Jia, X.; Feng, B.; Zhang, Y. Geothermal fluid circulation in the Guide Basin of the northeastern Tibetan Plateau: Isotopic analysis and numerical modeling. Geothermics 2018, 71, 234–244. [Google Scholar] [CrossRef]
  17. Qiu, N.; Zuo, Y.; Chang, J.; Li, W. Geothermal evidence of Meso-Cenozoic lithosphere thinning in the Jiyang sub-basin, Bohai Bay Basin, eastern North China Craton. Gondwana Res. 2014, 26, 1079–1092. [Google Scholar] [CrossRef]
  18. Gessner, K.; Markwitz, V.; Güngör, T. Crustal fluid flow in hot continental extension: Tectonic framework of geothermal areas and mineral deposits in western Anatolia. Geol. Soc. Lond. Spec. Publ. 2018, 453, 289–311. [Google Scholar] [CrossRef]
  19. Hooijkaas, G.R.; Genter, A.; Dezayes, C. Deep-seated geology of the granite intrusions at the Soultz EGS site based on data from 5km-deep boreholes. Geothermics 2006, 35, 484–506. [Google Scholar] [CrossRef]
  20. Portier, N.; Hinderer, J.; Riccardi, U.; Ferhat, G.; Calvo, M.; Abdelfettah, Y.; Heimlich, C.; Bernard, J.-D. Hybrid gravimetry monitoring of Soultz-sous-Forêts and Rittershoffen geothermal sites (Alsace, France). Geothermics 2018, 76, 201–219. [Google Scholar] [CrossRef]
  21. Kushnir, A.R.L.; Heap, M.J.; Baud, P. Assessing the role of fractures on the permeability of the Permo-Triassic sandstones at the Soultz-sous-Forêts (France) geothermal site. Geothermics 2018, 74, 181–189. [Google Scholar] [CrossRef]
  22. Baujard, C.; Rolin, P.; Dalmais, É.; Hehn, R.; Genter, A. Soultz-sous-Forêts Geothermal Reservoir: Structural Model Update and Thermo-Hydraulic Numerical Simulations Based on Three Years of Operation Data. Geosciences 2021, 11, 502. [Google Scholar] [CrossRef]
  23. Mahmoodpour, S.; Singh, M.; Turan, A.; Bär, K.; Sass, I. Hydro-Thermal Modeling for Geothermal Energy Extraction from Soultz-sous-Forêts, France. Geosciences 2021, 11, 464. [Google Scholar] [CrossRef]
  24. Liu, Y.; Li, W.; Feng, Z.; Wen, Q.; Neubauer, F.; Liang, C. A review of the Paleozoic tectonics in the eastern part of Central Asian Orogenic Belt. Gondwana Res. 2017, 43, 123–148. [Google Scholar] [CrossRef]
  25. Li, S.; Suo, Y.; Li, X.; Zhou, J.; Santosh, M.; Wang, P.; Wang, G.; Guo, L.; Yu, S.; Lan, H.; et al. Mesozoic tectono-magmatic response in the East Asian ocean-continent connection zone to subduction of the Paleo-Pacific Plate. Earth-Sci. Rev. 2019, 192, 91–137. [Google Scholar] [CrossRef]
  26. Li, S.; Weng, A.; Li, J.; Shan, X.; Han, J.; Tang, Y.; Zhang, Y.; Wang, X. Deep origin of Cenozoic volcanoes in Northeast China revealed by 3-D electrical structure. Sci. China Earth Sci. 2020, 63, 533–547. [Google Scholar] [CrossRef]
  27. Liu, J.; Davis, G.A.; Lin, Z.; Wu, F. The Liaonan metamorphic core complex, Southeastern Liaoning Province, North China: A likely contributor to Cretaceous rotation of Eastern Liaoning, Korea and contiguous areas. Tectonophysics 2005, 407, 65–80. [Google Scholar] [CrossRef]
  28. Meng, Q.-R.; Zhou, Z.-H.; Zhu, R.-X.; Xu, Y.-G.; Guo, Z.-T. Cretaceous basin evolution in northeast Asia: Tectonic responses to the paleo-Pacific plate subduction. Natl. Sci. Rev. 2022, 9, nwab088. [Google Scholar] [CrossRef]
  29. Gu, C.; Zhu, G.; Zhai, M.; Lin, S.; Song, L.; Liu, B. Features and origin time of Mesozoic strike-slip structures in the Yilan-Yitong Fault Zone. Sci. China Earth Sci. 2016, 59, 2389–2410. [Google Scholar] [CrossRef]
  30. Xu, M.; Li, Y.; Hou, H.; Wang, C.; Gao, R.; Wang, H.; Han, Z.; Zhou, A. Structural characteristics of the Yilan–Yitong and Dunhua–Mishan faults as northern extensions of the Tancheng–Lujiang Fault Zone: New deep seismic reflection results. Tectonophysics 2017, 706–707, 35–45. [Google Scholar] [CrossRef]
  31. Wu, F.-Y.; Sun, D.-Y.; Ge, W.-C.; Zhang, Y.-B.; Grant, M.L.; Wilde, S.A.; Jahn, B.-M. Geochronology of the Phanerozoic granitoids in northeastern China. J. Asian Earth Sci. 2011, 41, 1–30. [Google Scholar] [CrossRef] [Green Version]
  32. Mao, X.; Zhu, D.; Ndikubwimana, I.; He, Y.; Shi, Z. The mechanism of high-salinity thermal groundwater in Xinzhou geothermal field, South China: Insight from water chemistry and stable isotopes. J. Hydrol. 2021, 593, 125889. [Google Scholar] [CrossRef]
  33. Yan, J.; Chen, J.; Zhang, W. Study on the groundwater quality and its influencing factor in Songyuan City, Northeast China, using integrated hydrogeochemical method. Sci. Total Environ. 2021, 773, 144958. [Google Scholar] [CrossRef] [PubMed]
  34. Craig, H. Isotopic Variations in Meteoric Waters. Science 1961, 133, 1702–1703. [Google Scholar] [CrossRef] [PubMed]
  35. Chen, Z.; Wei, W.; Liu, J.; Wang, Y.; Chen, J. Identifying the recharge sources and age of groundwater in the Songnen Plain (Northeast China) using environmental isotopes. Hydrogeol. J. 2011, 19, 163–176. [Google Scholar] [CrossRef]
  36. Muffler, L.J.P. Assessment of geothermal resources of the United States, 1978; USGS-CIRC-790; Geological Survey: Reston, VA, USA, 1979. [Google Scholar]
  37. Giggenbach, W.F. Geothermal solute equilibria. Derivation of Na-K-Mg-Ca geoindicators. Geochim. Cosmochim. Acta 1988, 52, 2749–2765. [Google Scholar] [CrossRef]
  38. Fournier, R.O. Chemical geothermometers and mixing models for geothermal systems. Geothermics 1977, 5, 41–50. [Google Scholar] [CrossRef]
  39. Luo, L.; Pang, Z.; Liu, J.; Hu, S.; Rao, S.; Li, Y.; Lu, L. Determining the recharge sources and circulation depth of thermal waters in Xianyang geothermal field in Guanzhong Basin: The controlling role of Weibei Fault. Geothermics 2017, 69, 55–64. [Google Scholar] [CrossRef]
  40. Keating, K.; Binley, A.; Bense, V.; Van Dam, R.L.; Christiansen, H.H. Combined Geophysical Measurements Provide Evidence for Unfrozen Water in Permafrost in the Adventdalen Valley in Svalbard. Geophys. Res. Lett. 2018, 45, 7606–7614. [Google Scholar] [CrossRef] [Green Version]
  41. Hussain, Y.; Uagoda, R.; Borges, W.; Nunes, J.; Hamza, O.; Condori, C.; Aslam, K.; Dou, J.; Cárdenas-Soto, M. The Potential Use of Geophysical Methods to Identify Cavities, Sinkholes and Pathways for Water Infiltration. Water 2020, 12, 2289. [Google Scholar] [CrossRef]
  42. Kuang, J.; Wang, S.; Qi, S.; Xiao, Z.; Zhang, M.; Wang, Y. Cenozoic tectonic evolution of South China: A brief review, and new insights from the Huangshadong-Shiba area, south-east China. Geol. J. 2020, 55, 7716–7737. [Google Scholar] [CrossRef]
  43. Tian, J.; Pang, Z.; Guo, Q.; Wang, Y.; Li, J.; Huang, T.; Kong, Y. Geochemistry of geothermal fluids with implications on the sources of water and heat recharge to the Rekeng high-temperature geothermal system in the Eastern Himalayan Syntax. Geothermics 2018, 74, 92–105. [Google Scholar] [CrossRef]
  44. Gillis, K.M. The roof of an axial magma chamber: A hornfelsic heat exchanger. Geology 2008, 36, 299–302. [Google Scholar] [CrossRef]
  45. Paternoster, M.; Oggiano, G.; Sinisi, R.; Caracausi, A.; Mongelli, G. Geochemistry of two contrasting deep fluids in the Sardinia microplate (western Mediterranean): Relationships with tectonics and heat sources. J. Volcanol. Geotherm. Res. 2017, 336, 108–117. [Google Scholar] [CrossRef]
  46. Zhang, P.; Deng, Q.; Zhang, G.; Ma, J.; Gan, W.; Min, W.; Mao, F.; Wang, Q. Active tectonic blocks and strong earthquakes in the continent of China. Sci. China Ser. D Earth Sci. 2003, 46, 13–24. [Google Scholar]
  47. Rudnick, R.L.; Gao, S. Composition of the Continental Crust. In Treatise on Geochemistry; Holland, H.D., Turekian, K.K., Eds.; Pergamon: Oxford, UK, 2003; pp. 1–64. [Google Scholar]
  48. Jaupart, C.; Labrosse, S.; Lucazeau, F.; Mareschal, J.-C. Temperatures, Heat, and Energy in the Mantle of the Earth. In Treatise on Geophysics, 2nd ed.; Elsevier: Amsterdam, The Netherlands, 2015; pp. 223–270. [Google Scholar]
  49. Wang, J.; Li, C.-F. Curie point depths in Northeast China and their geothermal implications for the Songliao Basin. J. Asian Earth Sci. 2018, 163, 177–193. [Google Scholar] [CrossRef]
  50. Jiang, G.; Wang, Y.; Shi, Y.; Zhang, C.; Tang, X.; Hu, S. Estimate of Hot Dry Rock Geothermal Resource in Daqing Oilfield, Northeast China. Energies 2016, 9, 731. [Google Scholar] [CrossRef] [Green Version]
  51. Yang, F.; Li, D.; Zhou, X.; Zhan, T.; Ma, Y.; Wang, X.; Dong, J.; Liu, L.; Shi, Y.; Su, Y. Microbial Community Composition in Thermal Waters from the Lindian Geothermal Field (Songliao Basin, North-Eastern China). Water 2022, 14, 632. [Google Scholar] [CrossRef]
  52. Jiang, G.; Hu, S.; Shi, Y.; Zhang, C.; Wang, Z.; Hu, D. Terrestrial Heat Flow of Continental China: Updated Dataset and Tectonic Implications. Tectonophysics 2019, 753, 36–48. [Google Scholar] [CrossRef]
  53. Wessel, P.; Luis, J.F.; Uieda, L.; Scharroo, R.; Wobbe, F.; Smith, W.H.F.; Tian, D. The Generic Mapping Tools Version 6. Geochem. Geophys. Geosyst. 2019, 20, 5556–5564. [Google Scholar] [CrossRef] [Green Version]
Figure 1. Tectonic framework of NNortheast China (modified from [24]), showing the distribution of major blocks, sutures (dashed purple line), faults (red line), Songliao basin, and geothermal manifestations. The inset shows the location of NortheastNortheast China. F1, Derbugan Fault; F2, Nenjiang-Balihan Fault; F3, Chifeng-Kaiyuan Fault; F4, Yilan-Yitong Fault; F5, Dunhua-Mishan Fault. S1, Xinlin-Xiguitu Suture zone; S2, Heihe-Hegenshan Suture; S3, SolonKer-Xar Moron Suture; S4: Mudanjian-Yilan Suture.
Sustainability 14 05431 g001
Figure 2. Tectonic map of the study area (modified from 1:100,000 geological map of Heilongjiang Geological Bureau). The Yilan-Yitong Fault zone has two branches in the study area (YYF-1 and YYF-2). For comparison, this study marked the sampling site of previous work (blue star with a green core, [31]).
Sustainability 14 05431 g002
Figure 3. Piper diagram of the W-1 and W-2.
Sustainability 14 05431 g003
Figure 4. Relationship between δD and δ18O of W-1 and W-2. The black line represents the global meteoric water line (GMWL) [34]. The blue line represents the local meteoric water line (LMWL) [33]. The solid square in the plot represents the hot spring samples.
Sustainability 14 05431 g004
Figure 5. Na-K-Mg ternary diagram of W-1 and W-2 [37]. The solid square in the plot represents the hot spring samples.
Sustainability 14 05431 g005
Figure 6. Borehole temperature measurement curve of Tongre-1 (blue-purple line) and Tongre-2 (black line).
Sustainability 14 05431 g006
Figure 7. CSAMT data inversion result of the four profiles. (a,b) share the same legend, as well as (c,d). F1 in (c) and F2, F3 in (d) are the fracture zone between granitic rock and country-rock.
Sustainability 14 05431 g007
Figure 8. The conceptual geothermal water circulation path of Tonghe County (study area).
Sustainability 14 05431 g008
Figure 9. Averaged Curie depths (a) and thermal lithospheric thickness (b) of Northeast China (Aadapted with permission form from [49]), clearly showing the relationship between geothermal manifestations and averaged Curie depth and thermal lithospheric thickness. Copyright (2022/2018) by the Elsevier—https://doi.org/10.1016/j.jseaes.2018.05.026.
Sustainability 14 05431 g009
Table 1. Hydrochemical characteristics and major chemical constituents of water samples.
Sample IDElevation
(m)
pHT
(°C)
TDS
(mg/L)
SiO2
(mg/L)
δ18O
(‰)
δD
(‰)
HCO3
(mg/L)
CO32−
(mg/L)
F
(mg/L)
Cl
(mg/L)
NO3
(mg/L)
SO42−
(mg/L)
Na+
(mg/L)
K+
(mg/L)
Mg2+
(mg/L)
Ca2+
(mg/L)
W-11148.535.0404.4323.08−11.4−84.0188.37 15.65 0.20 1.59 0.15 1.50 77.25 0.60 0.07 2.66
W-21207.939.0543.2818.74−11.7−87.0324.92 30.73 0.40 17.58 2.12 0.50 140.12 0.69 1.22 6.01
Table 2. Th, U, and K concentration of rock sample.
Sample IDK
(%)
Th
(ug/g)
U
(ug/g)
A
(μW/m3)
References
R-13.8814.52.892.09This study
9757-34.418.762.011.52[31]
9757-44.2991.241.33[31]
9757-4-14.3510.31.921.60[31]
AUCC2.810.52.71.67[47]
AUCC, Average of upper continental crust. A is the heat production rate, which was calculated by Equation (4).
Publisher’s Note: MDPI stays neutral with regard to jurisdictional claims in published maps and institutional affiliations.

