Article

Assessing Coastal Reclamation Success in the East China Coast by Using Plant Species Composition

1
College of Economics and Management, Zhejiang A&F University, Hangzhou 311300, China
2
Research Academy for Rural Revitalization of Zhejiang Province, Zhejiang A&F University, Hangzhou 311300, China
3
Institute of Ecological Civilization, Zhejiang A&F University, Hangzhou 311300, China
4
Shanghai Academy of Landscape Architecture Science and Planning, Shanghai 200232, China
5
Nanjing Institute of Technology, Nanjing 211167, China
6
School of Geography and Ocean Science, Nanjing University, Nanjing 210023, China
*
Authors to whom correspondence should be addressed.
Sustainability 2022, 14(9), 5118; https://doi.org/10.3390/su14095118
Submission received: 25 February 2022 / Revised: 2 April 2022 / Accepted: 17 April 2022 / Published: 24 April 2022
(This article belongs to the Special Issue Frontier Research on Sustainable Coastal Wetland Ecosystem)

Abstract

:
Quantitative analysis of the species composition and succession law of a plant community in a coastal reclamation area is of great significance for revealing the community construction and species coexistence mechanisms, and provides a basis for the rational use and conservation in coastal reclamation areas. Through the investigation of natural plant communities in Dongtai reclamation area and the adjacent national nature reserves in Jiangsu Province, eastern China, the composition and succession of plant communities were studied. A quantitative method was explored to analyze the process of plant succession and its representative species. The results showed that (1) A total of 65 species were found in the vegetation survey. These belonged to 26 families and 61 genera, and Poaceae is the most common plant species. The plant communities in the unreclaimed areas were mainly composed of Poaceae and Cyperaceae. The plant species increased after reclamation, which were mainly composed of Poaceae and Asteraceae; (2) The plant coverage greatly reduced after three years of reclamation, from 80% of the tidal flat to 37.34%, then gradually increased, and remained generally between 50% and 70%; (3) The above-ground biomass of the plant community was sharply reduced after reclamation, from 1.823 kg/m2 in the tidal flat to 0.321 kg/m2 in three years of reclamation, and then maintained at 0.11~0.27 kg/m2; (4)The species succession process of the plant community in the coastal wetland ecosystem that was affected by the reclamation activities transformed from a halophyte community that was dominated by a salt marsh plant community (Suaeda salsa, Spartina alterniflora, Scirpus mariqueter, and Phragmites australis) to a mesophyte plant community that was constructed with pioneer species such as Setaria viridis, Eleusine indica, etc., and eventually succeeded to a xerophyte plant community that was dominated by Humulus scandens and Cyperus difformis, etc. Reclamation activities have a profound impact on the characteristics and succession rules of natural vegetation communities along coastal wetland ecosystems. The period of seven years is presumed to be the tipping point in the succession of the plant community in coastal reclamation areas. The results of this study can provide a basis and reference for ecological protection and restoration in coastal reclamation areas.

1. Introduction

Coastal wetland ecosystems support abundant biodiversity and supply various products and services, which provide the foundation for regional development and play an important role in the sustainability of the coastal zone [1]. Coastal wetland ecosystems are located in the land–sea interaction zone and have high ecological vulnerability and ecological sensitivity [2]. Coastal reclamation has been launched in many coastal regions and countries worldwide [3,4,5]. Urbanization and land use/cover change that are led by human beings in the coastal wetland ecosystem depleted over 90% of formerly important species, destroyed wetland habitat, and exacerbated many ecological and environmental problems [6,7,8,9,10]. Coastal reclamation activities have massively launched in China [11]. Research indicates that over 7500 km2 of coastal wetlands have been reclaimed from 1985 to 2010 [12]. The booming economy, associated with urbanization and industrial development, and resulting in population growth are the main driving factors of reclamation in China’s coastal region [12]. The public and governments have recognized the importance of coastal wetlands over the past decades and developed coastal restoration projects [13,14,15,16]. The increased conservation and restoration efforts have significantly improved saltmarsh areas and tidal flat areas since 2012 in China [17]. What’s more, China published the Master Plan for Major National Ecological System Protection and Restoration Projects (2021–2035) in 2020, including 9 major projects and 47 specific tasks. The coastal ecological protection and restoration project is one of the nine major projects, which aims to carry out the ecological protection and restoration of the sea and tidal flats, the shoreline, the estuary bay, typical marine ecosystems (such as mangroves and coral reefs), tropical rainforest protection, and the prevention of invasive species such as Spartina alterniflora [18]. Plant species composition and floristic development has long been used to assess the coastal restoration/reclamation success as reported elsewhere [19,20], as this indicator is easy to measure and the measurement of this indicator is associated with low cost and time [21].
In areas with high levels of human disturbance, such as coastal wetland ecosystems, vegetation succession refers to the formation, transformation, and extinction of vegetation that is influenced by natural or anthropogenic factors [22]. Theoretically, disturbances are necessary to sustain ecosystems and are the mechanisms by which diversity in the kinds and ages of species and habitats is maintained [23,24]. However, in coastal reclamation areas, the disturbances from human activities are big, frequent, and irreversible, which have been verified as harmful to the sustainability of the coastal wetland ecosystems [25,26]. Previous research has mainly applied the two-way indicator species analysis (TWINSPAN) to analyze the composition and characteristics of natural plants community in the coastal wetland ecosystem, such as the Fengxian area of the Yangtze River estuary of China and the southwestern coast of South Korea [27,28]. In the coastal reclamation areas, plant communities are gradually transformed from salt-marsh communities to mesophytic communities after reclamation. What’s more, researchers have pointed out that focal species can be bio-indicators of soil properties in coastal wetland ecosystems [29], and focused on finding ecologically representative species to enhance the efficiency of data analysis in the research, which could also be useful for ecosystem assessment and management [30]. However, the representative species in different stages of coastal reclamation areas has not been explored quantitatively.
Yancheng Coastal Wetland is one of the most typical and representative distribution areas of muddy coastal wetlands in China and even the world [31], which is located on the central coast of Jiangsu Province of China. The Yancheng Yellow Sea wetland was listed as a World Natural Heritage site in 2019 [32], which is a key hub on the East Asian-Australian migratory bird migration route with the most endangered species and the highest degree of threat. It is also a stop, molt, and wintering place for millions of migratory birds worldwide. The plant communities in coastal wetlands are especially important for waterbirds, which can provide protection and roosting habitat. Therefore, the species composition and succession rule of the plant community in this area should be comprehensively analyzed and mastered, which is of importance for the coastal protection and restoration. The objectives of this study were to (i) describe the composition of plant communities along with 60-year reclamation chronosequence, (ii) analyze the characteristics of plant communities, (iii) reveal the succession process of plant community, and (iv) quantitatively find the representative species during the different stages of the succession process.

2. Materials and Methods
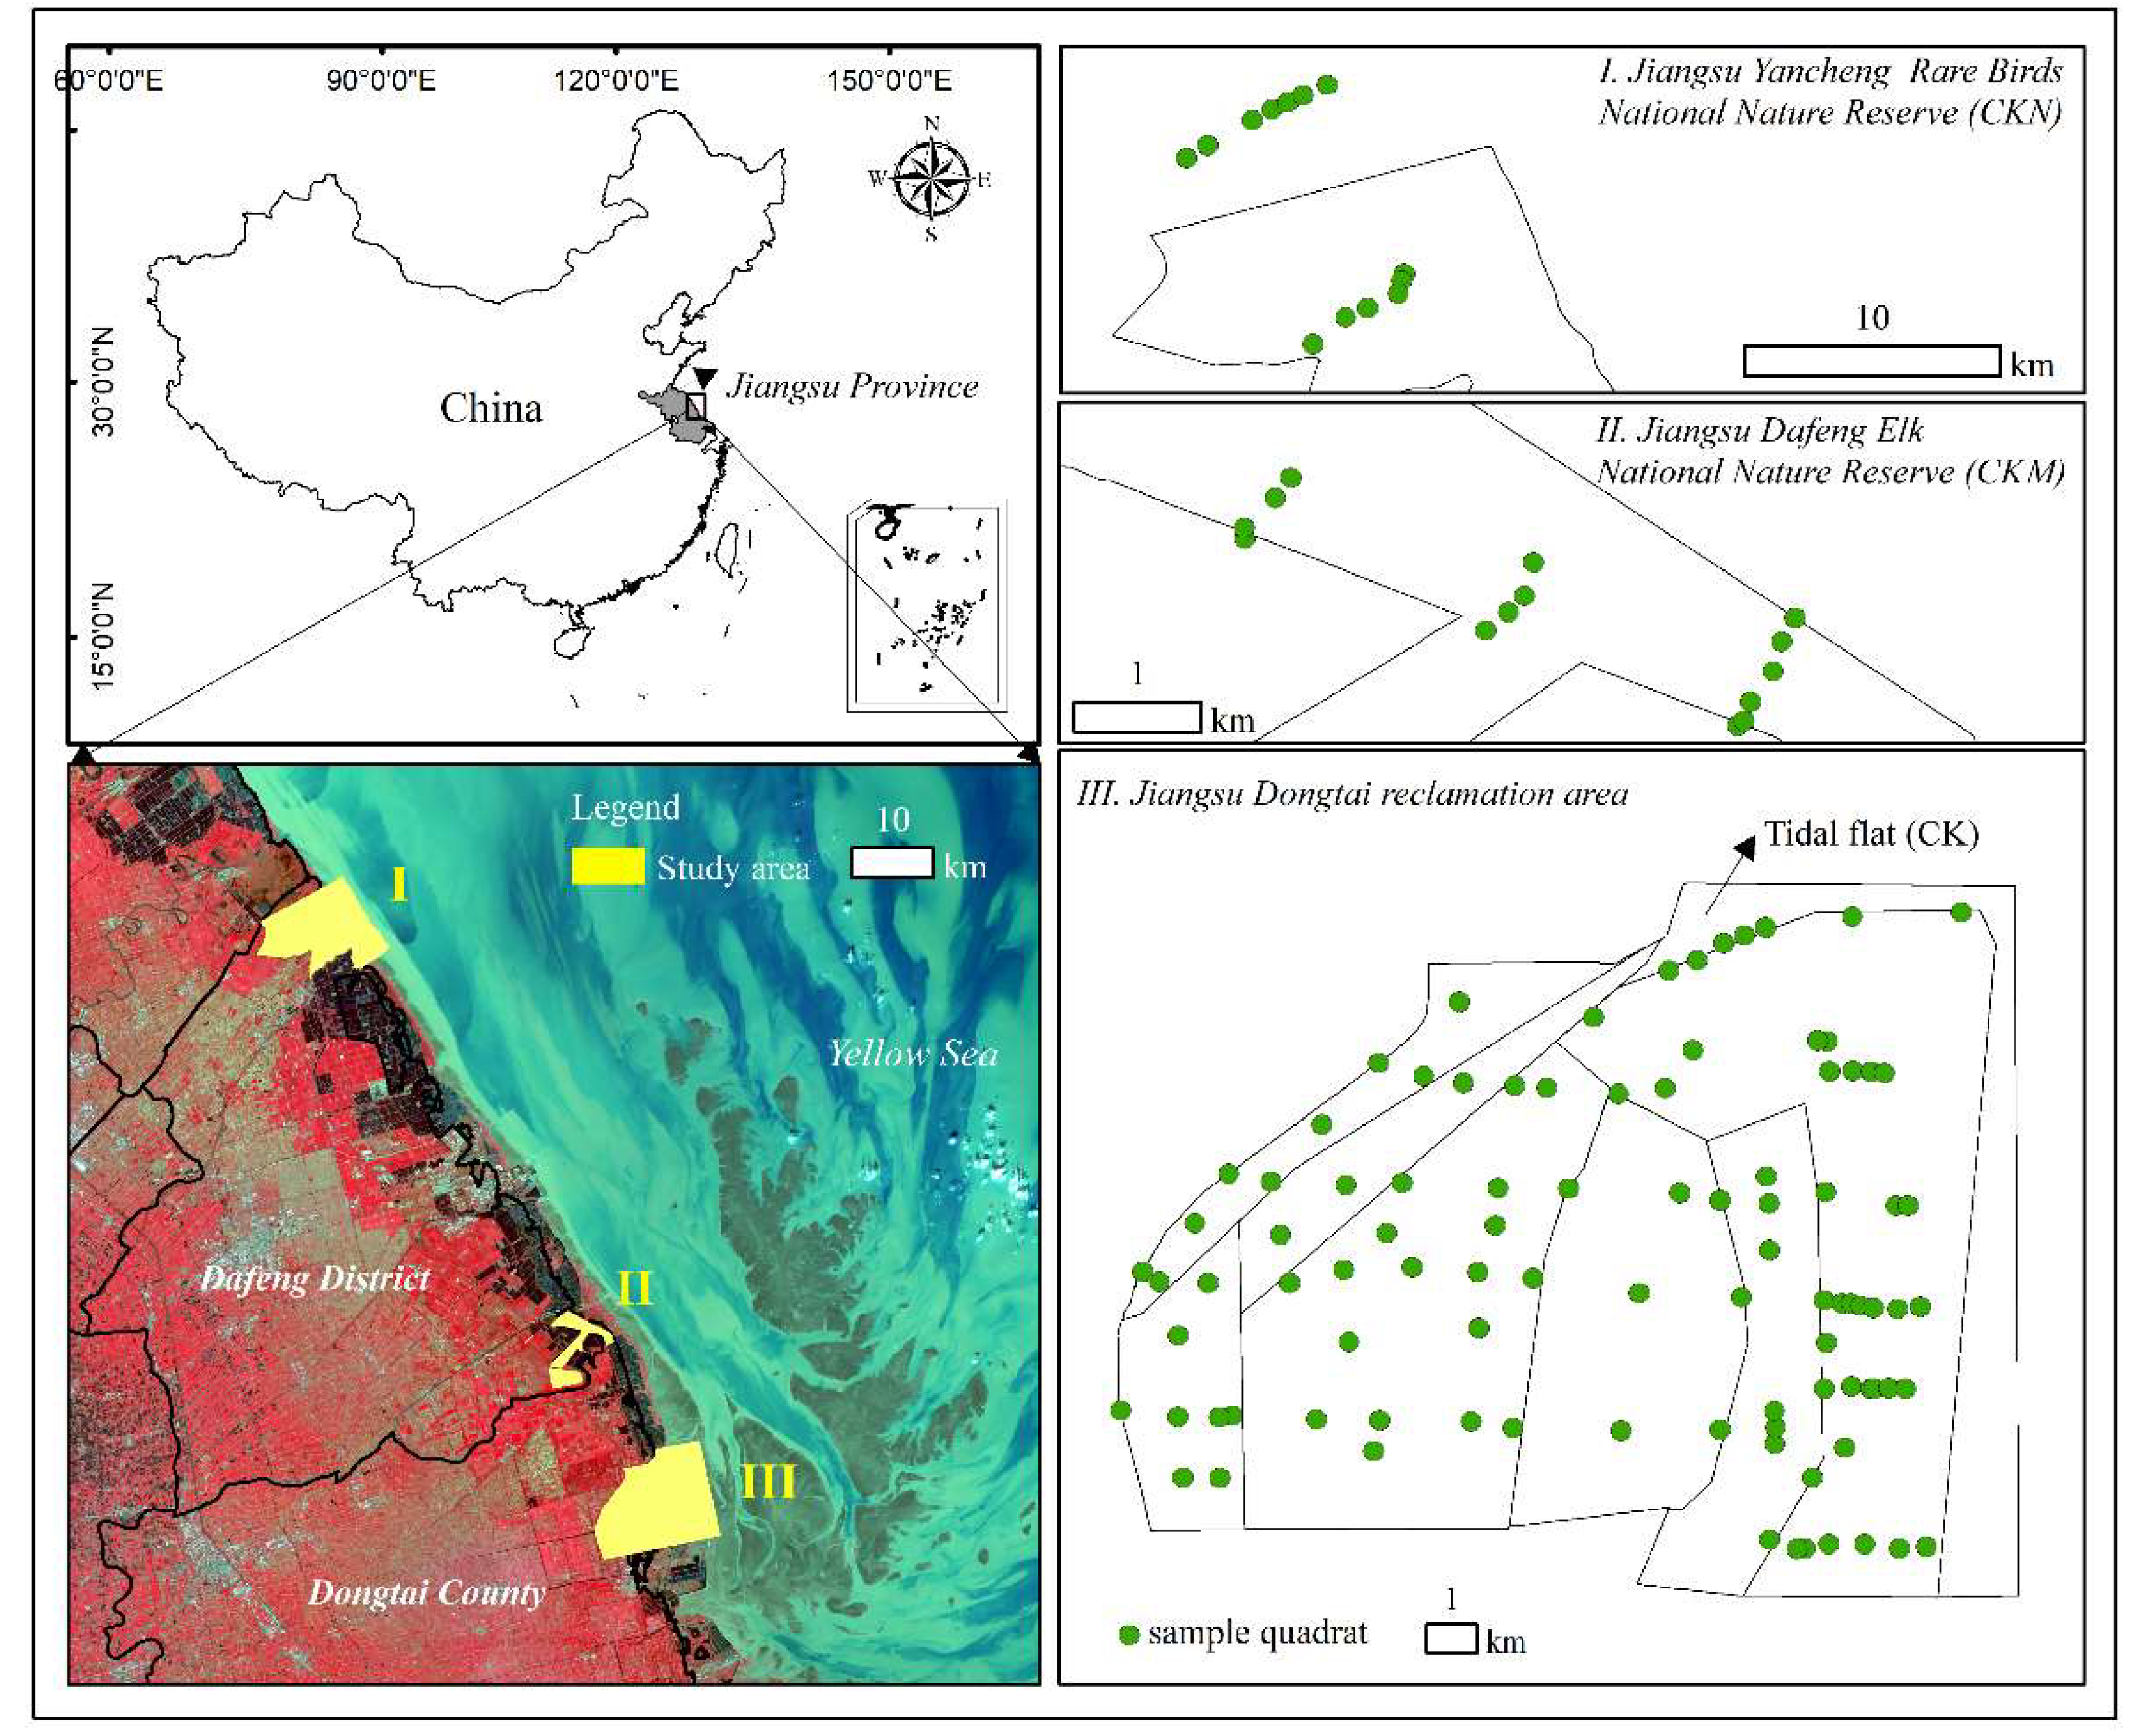
2.1. Study Area

This study was mainly conducted in the central region of Yancheng Coastal Wetland, which is located in Dongtai County, Jiangsu Province, eastern China (120°45′–120°57′ E, 32°40′–32°52′ N). This area is situated in the coastal plain of the Yangtze River Delta, and its north and east borders are the south Yellow Sea (Figure 1). Jiangsu Province has the largest area of coastal wetlands in China [33]. Dongtai, adjacent to the largest alluvial coastal zone in the mid-latitude region, has a total land area of 3175.67 km2, and the reclamation area in Dongtai accounted for one-fifth of this area. The climate is affected by subtropical and marine monsoons with a mean annual temperature and precipitation of 14~15 °C and 1026~1051 mm, respectively. The Outline of Jiangsu Coastal Reclamation Development Plan has been implemented from 2009 to 2020 [34]. The planned area of cropland, ecological land, and construction land would account for 60%, 20%, and 20%, respectively. Figure 1. The land use and cover change of the study area has been analyzed, which can be seen from Xu et al. (2021) [18]. In a nutshell, the land-use types of the study area with the effect of reclamation activity in the past decades had gradually transformed from being dominated by natural types (e.g., tidal flat, halophytic vegetation) to artificial types (e.g., cropland, aquaculture pond, and construction land). The vegetation community along the coast of Jiangsu Province is successed with a certain pattern from the coast to inland [35]. Specifically, Spartina alterniflora dominates in the bare tidal flats, followed by Suaeda salsa, Phragmites australis, and other xeromorphic vegetation [35,36]. The core area of Jiangsu Yancheng Wetland Rare Birds National Nature Reserve (very low disturbance, close to zero disturbance) and the third core area of Dafeng Elk National Nature Reserve (low disturbance, mostly from elk) had been surveyed and regarded as a comparison with the natural wetland of Dongtai reclamation areas. The Dafeng Elk National Nature Reserve (120°47′–120°53′ E, 32°59′–33°03′ N) is located in the eastern part of Jiangsu province, near the Yellow Sea, and is the largest elk nature reserve worldwide with the largest number of wild elk populations [37]. Jiangsu Yancheng Wetland Rare Birds National Nature Reserve (119°80′–120°60′ E, 32°40′–34°80′ N), a Ramsar wetland in China, is the largest wintering area for the globally endangered red-crowned crane (Grus japonensis) and has the characteristics of a monsoon marine climate with the annual average precipitation of 980~1070 mm [38].

2.2. Vegetation Investigation

The space-for-time substitution method was used to determine the characteristics of the plant community following reclamation. Vegetation investigations were conducted in September 2016 and October 2016. The plant community survey in the coastal reclamation area mainly focused on herbs that can reflect the coastal reclamation success in the natural state. The sampling quadrats were designed based on the random uniform grid method and belt transect method. The plant community was dominated by herbaceous plants. Thus, the plant samples were acquired by a quadrat method (1 m × 1 m) in each reclamation area during the vegetation investigation. The number of plant sampling quadrats in CKM, CKN, 1956 (60-year reclamation area), 1972 (44-year reclamation area), 1980 (36-year reclamation area), 1982 (34-year reclamation area), 1997 (19-year reclamation area), 2005 (11-year reclamation area), 2009 (7-year reclamation area), 2013 (3-year reclamation area), and the tidal flat (natural wetland, as control, CK) was 12, 13, 3, 9, 8, 3, 20, 7, 11, 34, and 3, respectively (Table 1). The information of the plant community in the quadrat (e.g., plant species name, abundance, coverage, height, frequency, aboveground biomass), and the sampling quadrats (e.g., longitude, latitude, reclamation years, land use around) had been recorded in the vegetation investigation. The plant species nomenclature was in accordance with the Flora of China (http://www.iplant.cn/foc, accessed on 24 February 2022) and the database of NCBI (https://www.ncbi.nlm.nih.gov/Taxonomy/, accessed on 24 February 2022).

2.3. Analysis of Characteristics and Succession of Plant Community

2.3.1. Plant Community Characteristics

In this study, the aboveground biomass and species importance value was used to characterize the plant communities. The fresh plant samples were dried in an oven at 65 °C to a constant weight for calculating the biomass. The importance value (IV) can describe the role and importance of plant species in the community, and the calculation formula is:
R A = ( A i i = 1 S A i ) × 100
R C = ( C i i = 1 S C i ) × 100
R F = ( F i i = 1 S F i ) × 100
I V = ( R A + R C + R F ) / 3
where RA is relative abundance (%), Ai is the ratio of the number of individuals of species i to the total number of individuals of all species, RC is relative coverage (%), Ci is the ratio of the coverage of species i to the total coverage of all species, RF is the relative frequency (%), Fi is the ratio of the frequency of species i to the total frequency of all species, ni is the number of individuals of species i, N is the total number of individuals of all species, S is the total number of species, and IV is the importance value of certain species.

2.3.2. Plant Community Succession

The reclamation time is an important factor in the variation of the coastal wetland ecosystem [39]. Thus, the reclamation time was applied as the distinguishing sign of different reclamation areas, and also was used to be the clustering object. The method of cluster analysis was used to explore the succession process of the plant community and its inflection point time. Specifically, the reclamation areas with different reclamation times (3a, 7a, 11a, 19a, 34a, 36a, 44a, and 60a), CK, CKN, and CKM. The important values of plant species were used in the cluster analysis. Common hierarchical clustering methods are available through the function hclust of the stats package on the R platform (version 4.1.2, R Development Core Team, Vienna, Austria).
Comparing and choosing clustering methods is the first step. Cluster analysis is an exploratory research method that results in multiple possible scenarios, each of which can provide unique insights. In this study, a variety of clustering methods were selected for comprehensive comparative analysis, including single linkage agglomerative clustering (also called nearest neighbor sorting), complete linkage agglomerative clustering (also called furthest neighbor sorting), and UPGMA (unweighted pair-group method using arithmetic averages, belonging to average agglomerative clustering) and Ward’s minimum variance clustering (referred as “Ward”). The Cophenetic correlation is the Pearson correlation coefficient between the original distance matrix and the cophenotype distance matrix, and the clustering method with the highest cophenotype correlation coefficient can be regarded as the best clustering of the original matrix [40]. Thus, the correlation coefficients of the above four clustering methods were calculated using the function cophenetic of package stats in the R (version 4.1.2, R Development Core Team). The single linkage agglomerative clustering was 0.724, the complete linkage agglomerative clustering was 0.871, the UPGMA was 0.878, and the Ward was 0.740. Therefore, the correlation coefficient of the UPGMA was the highest.
The silhouette width and Mantel comparison methods were used to help identify the optimal number of groups in the four clustering methods. The Mantel correlation is the equivalent of a Pearson r correlation between the values in the distance matrices [40], which can be computed using the function cor of package vegan [41] in the R (Version 4.1.2). The silhouette width is a measure of the degree of membership of an object to its cluster, based on the average distance between this object and all the objects of the cluster to which is belongs, compared to the same measure that is computed for the next closest cluster [40]. It can be calculated using the function silhouette of the package cluster on the R platform (version 4.1.2, R Development Core Team). The silhouette widths range from −1 to 1 and can be averaged over all objects of a partition. In short, the greater the value is, the better the object is clustered. Negative values mean that the corresponding objects have probably been placed in the wrong cluster [40].

2.3.3. The Representative Species in the Process of Plant Community Succession

Mastering the representative species at different succession stages can allow for a clearer understanding of the replacement status of plant community species under the influence of reclamation activities. This study mainly discussed the relationship between species and reclamation areas. Since it only reflects the ordering relationship between the species and reclamation areas, it is not required to preserve the actual distance among the objects to the greatest extent, the nonmetric multidimensional scaling (NMDS) method can be the solution [42].

2.4. Statistical Analysis

The effects of reclamation time on vegetation coverage and aboveground biomass were analyzed with one-way ANOVA using the Student–Newman–Keuls post hoc test or the Games–Howell test with significance defined at 0.05. The homogeneity of variance was examined by Levene’s test before an ANOVA. R (version 4.1.2, R Development Core Team) was used to conduct the analysis and construct the figures. The NMDS analysis was performed using the metaMDS function in the vegan package [41] on the R (version 4.1.2, R Development Core Team).

3. Results

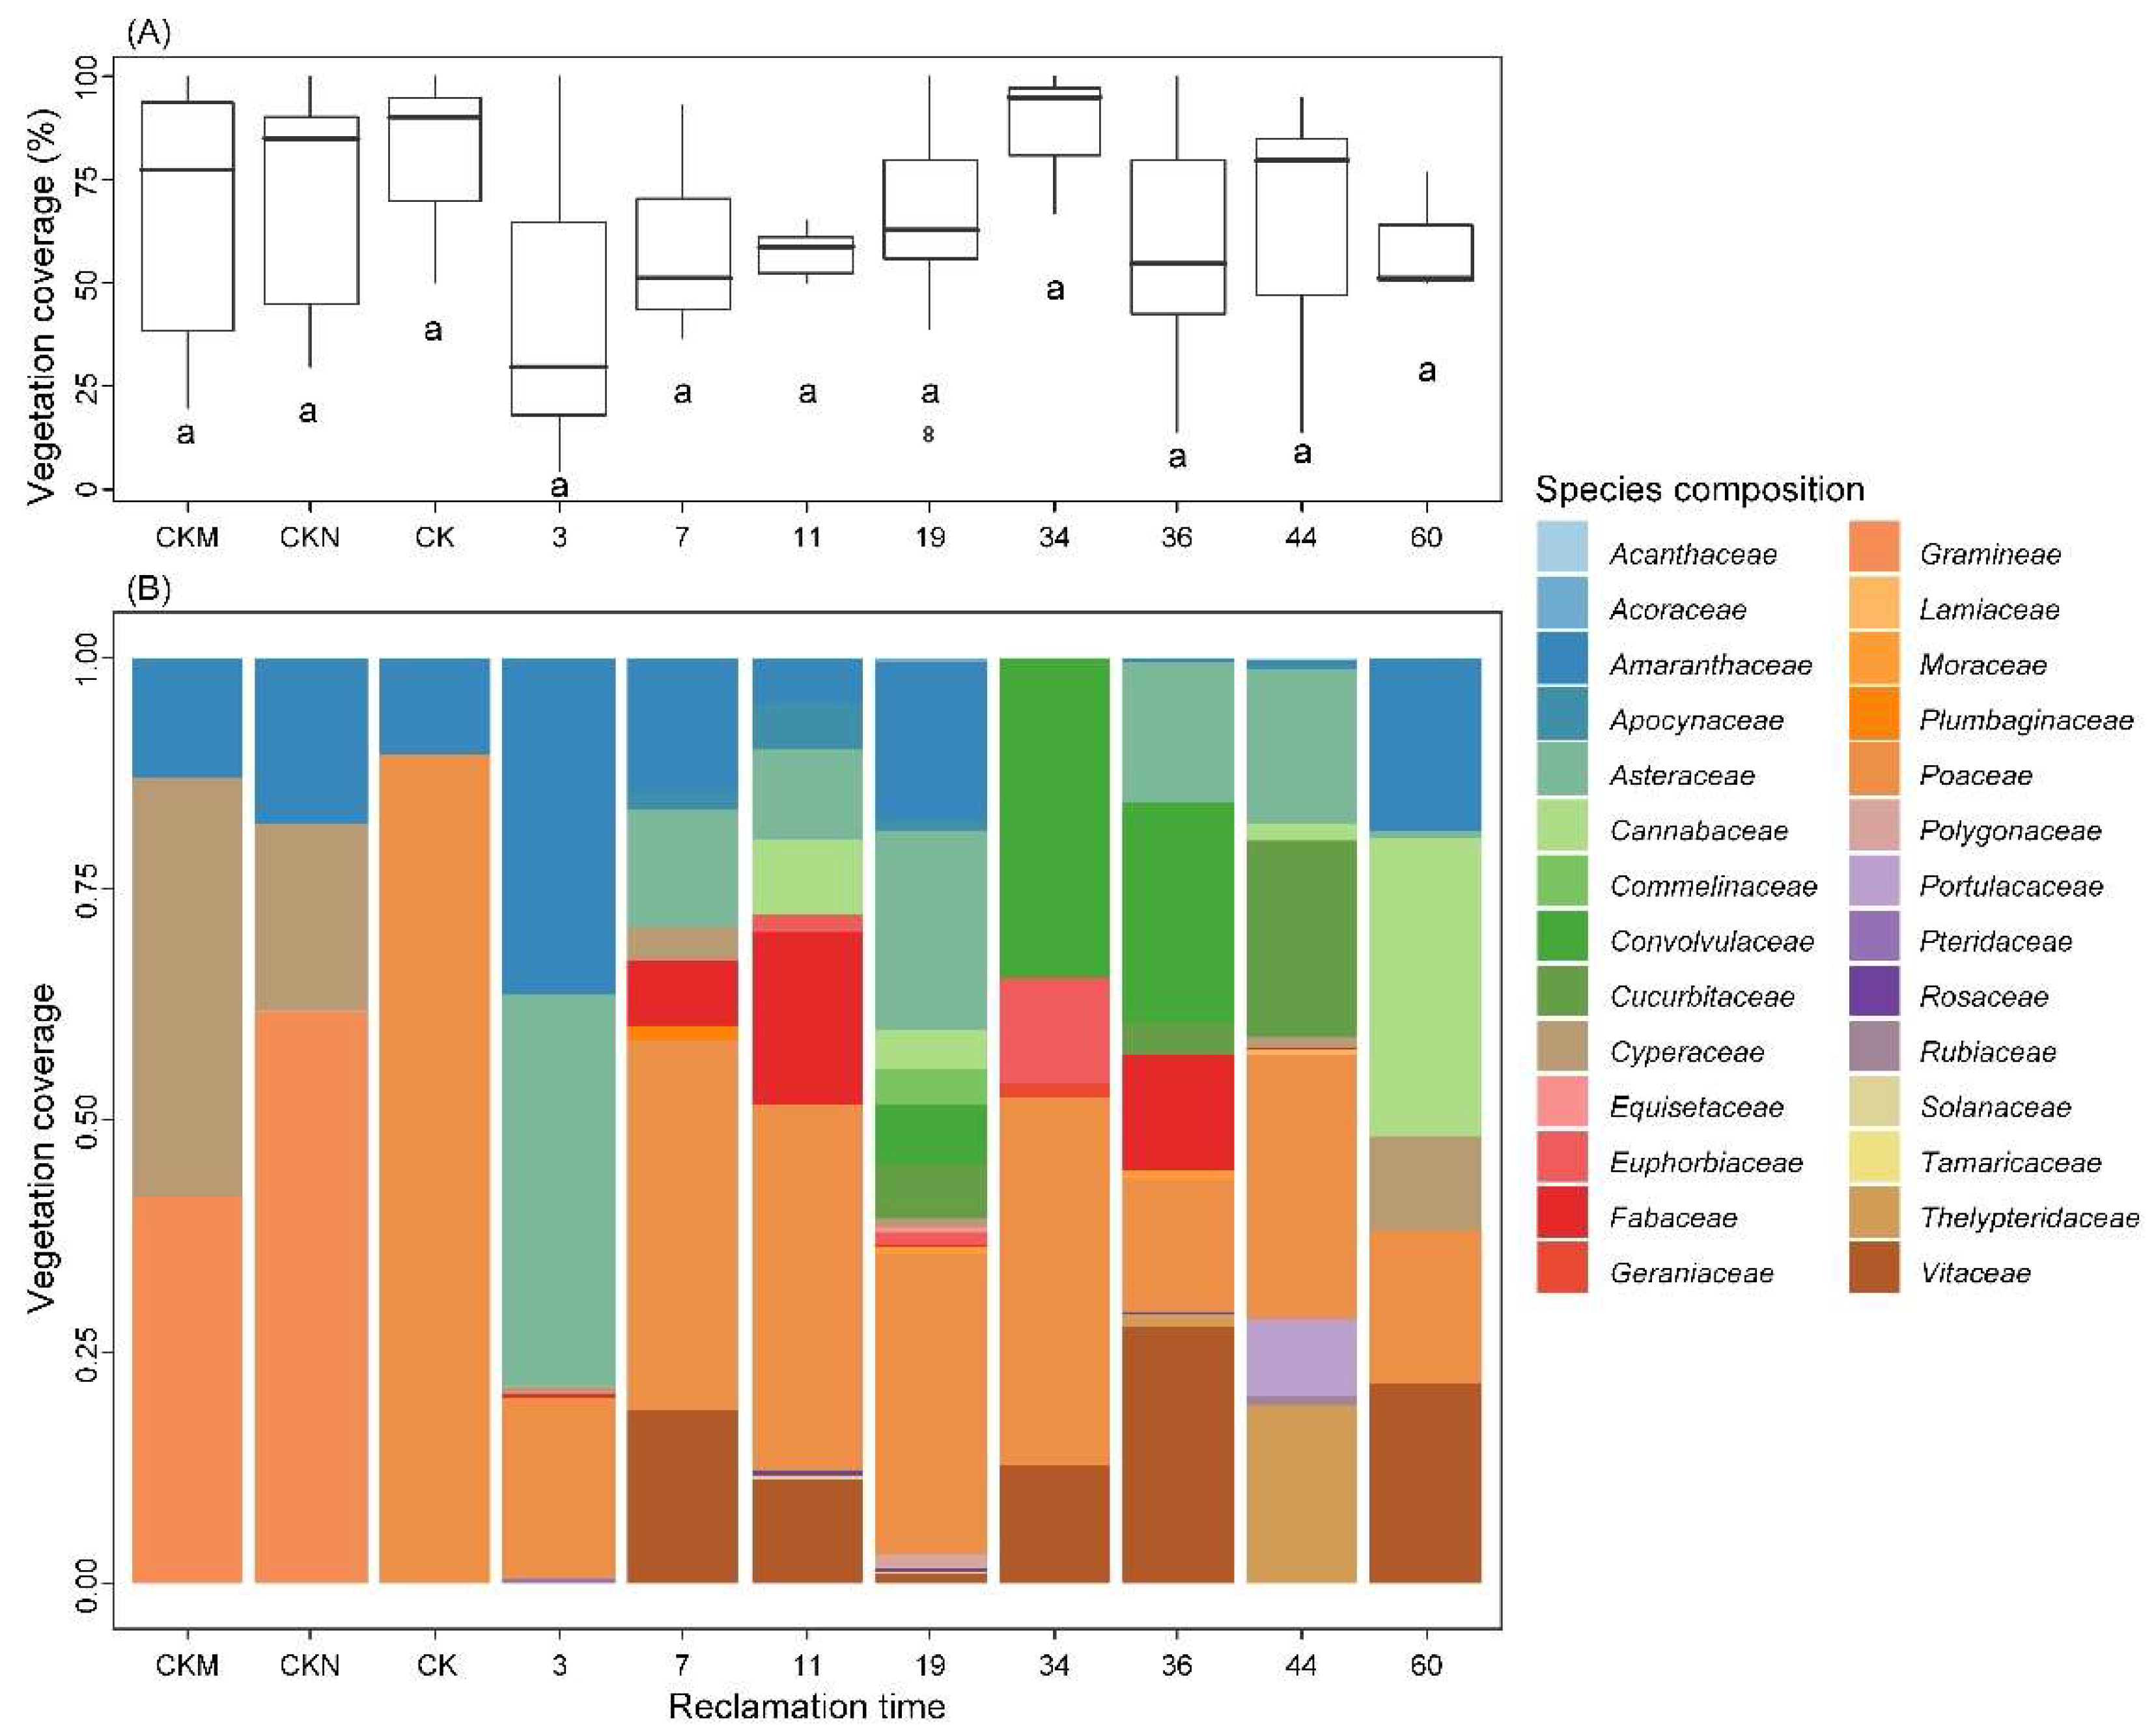
3.1. Species Composition

A total of 65 species were recorded in the study area, belonging to 26 families (Figure 2) and 61 genera. The species list is displayed in Table S1 in the supplementary file.
In the Jiangsu Yancheng Wetland Rare Birds National Nature Reserve (CKN), a total of 5 species were recorded in the 13 plots, namely Spartina alterniflora, Phragmites australis, Suaeda salsa, Salicornia europaea, and Scirpus mariqueter, which belonged to 3 families and 5 genera, including 2 species of Poaceae, 2 species of Amaranthaceae, and 1 species of Cyperaceae.
In the Jiangsu Dafeng Elk National Nature Reserve (CKM), a total of 5 species were recorded in the 12 plots that were surveyed, namely Spartina alterniflora, Phragmites australis, Suaeda salsa, Cynodon dactylon, and Scirpus mariqueter, which belonged to 3 families and 5 genera, including 3 Poaceae, 1 Amaranthaceae, and 1 Cyperaceae.
In the Dongtai reclamation area, A total of 65 species were recorded in the 98 plots that were surveyed, which belonged to 26 families and 61 genera, including 15 species of Poaceae, 10 species of Asteraceae, 6 species of Amaranthaceae, and Fabaceae 5 species, Euphorbiaceae 3 species, Cyperaceae 3 species, Apocynaceae 2 species, Polygonaceae 2 species, Solanaceae 2 species, Plumbaginaceae 1 species, Acoraceae 1 species, Tamaricaceae 1 species, Cucurbitaceae 1 species, Thelypteridaceae 1 species, Acanthaceae 1 species, Rubiaceae 1 species, Rosaceae 1 species, Lamiaceae 1 species, Portulacaceae 1 species, Geraniaceae 1 species, Equisetaceae 1 species, 1 species in Cannabaceae, 1 species in Vitaceae, 1 species in Moraceae, 1 species in Convolvulaceae, and 1 species in Commelinaceae.
Poaceae is the most common species in the study area. The plant community in the unreclaimed area was mainly composed of Poaceae and Cyperaceae, such as CKM, CKN, and CK. After reclamation, the number of plant species increased, and Poaceae and Asteraceae were the dominant species. In terms of the average plant coverage, as shown in Figure 2, the average coverage in CKM and CKN was 65.83% and 73.15%, respectively, which was lower than 80% of the Dongtai unreclaimed area (CK). That was because most of the Dongtai tidal flat was covered mainly by Spartina alterniflora, and the biomass of Spartina alterniflora is large. The plant coverage dropped sharply to 37.34% in the three-year reclamation area, and then gradually increased. The overall plant coverage in the reclamation areas with different reclamation times remained at 50–70%.

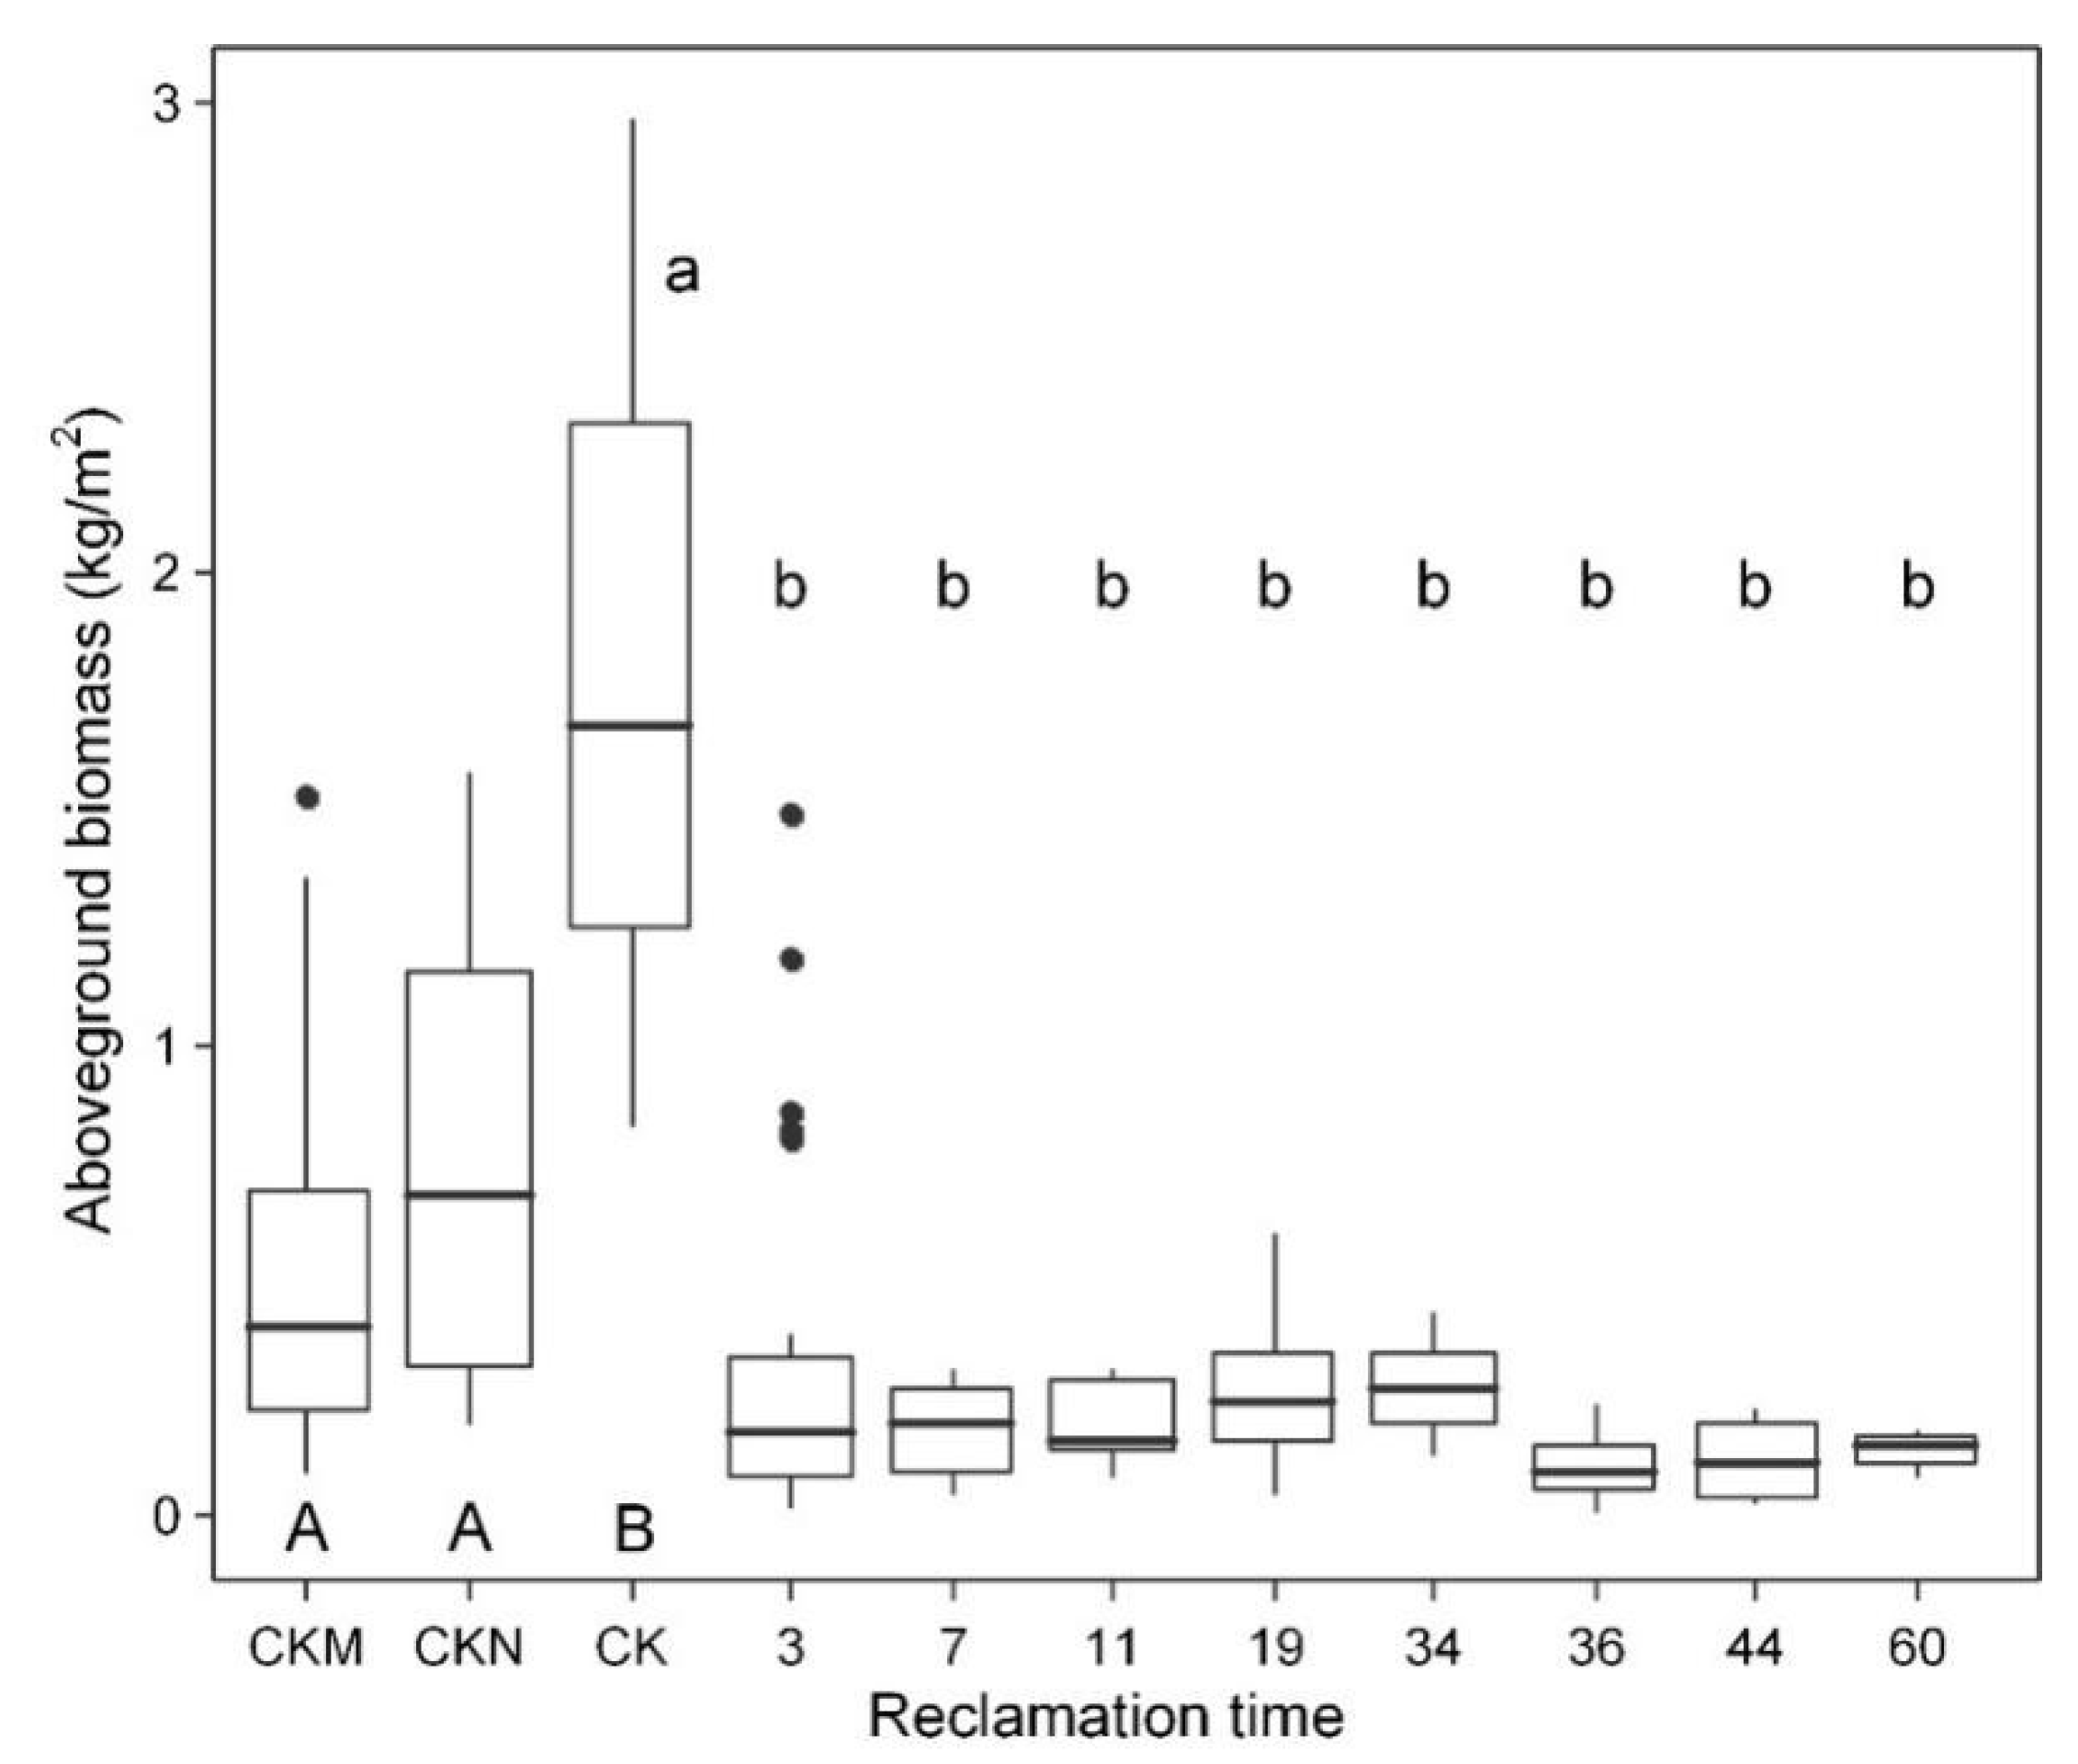
3.2. Plant Community Characteristics

The aboveground biomass of the vegetation community greatly reduced after reclamation (p < 0.05), from 1.823 kg/m2 in the CK to 0.321kg/m2 in the three years of reclamation, and then maintained at 0.11~0.27 kg/m2 (Figure 3). There was no significant difference in the aboveground biomass between the reclamation areas with different reclamation years after reclamation (p > 0.05). There was no significant difference in aboveground biomass between CKM, CKN, and CK (p > 0.05).
The results of the species importance values of the main species (top 10) that were classified according to the subareas with different reclamation times are shown in Figure 4. The hygrophyte community gradually succeeded the mesophyte community. Specifically, the main halophytes in the coastal wetland ecosystem were Spartina alterniflora, Phragmites australis, Suaeda salsa, and Salicornia europaea. The main species in CK were Spartina alterniflora and Suaeda salina, and the important value of Spartina alterniflora in CK was as high as 2.21. The main species were Spartina alterniflora, Phragmites australis, and Suaeda salina in CKM, with important values of 1.22, 0.75, and 0.68 respectively. The main species were Phragmites australis, Scirpus mariqueter, Suaeda salina, and Spartina alterniflora in CKN, with important values of 1.12, 0.8, 0.55, and 0.49, respectively. Comparing the importance values of the main species, it could be found that Spartina alterniflora had the highest importance value in CK. It could still grow in the early stage of reclamation (three-year reclamation area) and then did not appear. Suaeda salsa had the highest importance value in the three-year reclamation area, and there was still a small amount of distribution until the 19-year reclamation area. Phragmites australis appeared until the 19-year reclamation area. Non-halophyte species with strong growth, such as Setaria viridis and Eleusine indica, had emerged in the seven-year reclamation area. As pioneer species, they had become the basis for the transformation of soil properties in the reclamation area. According to the above analysis, it can be roughly speculated that the seven years after reclamation is the turning point in the succession of the plant community in the coastal reclamation area from the hygrophyte community dominated by halophytes to the mesophyte community.

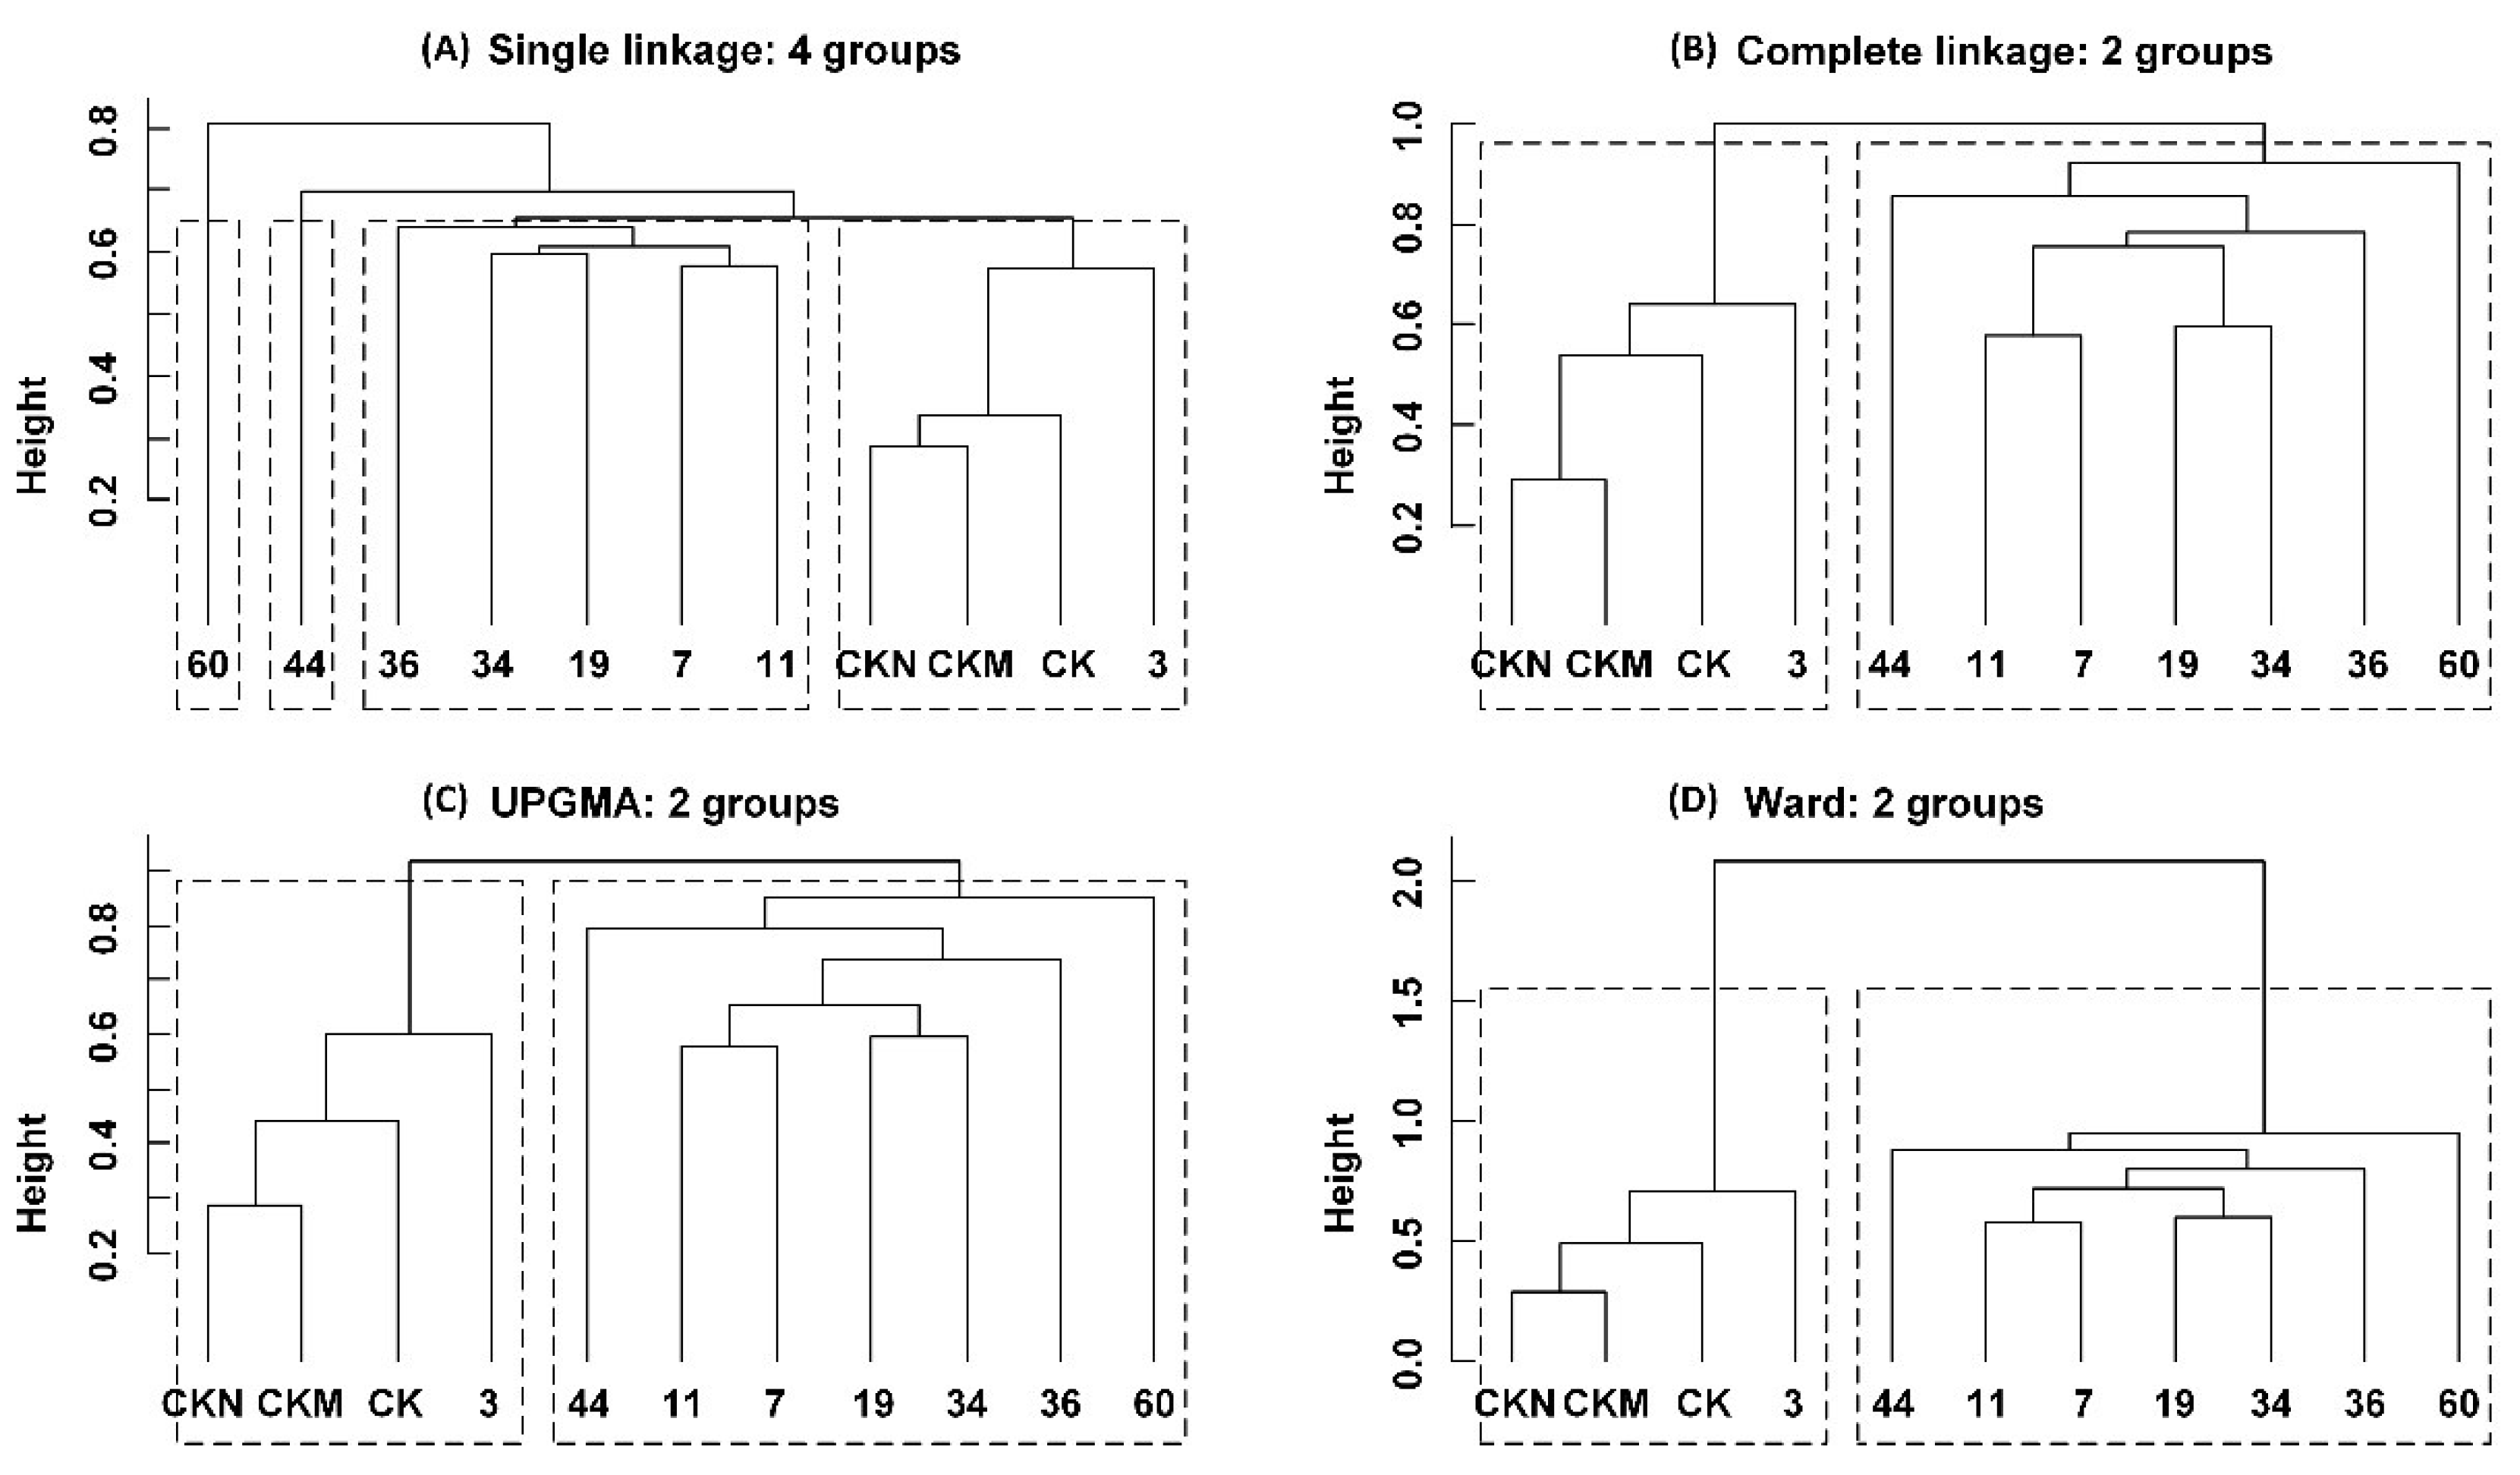
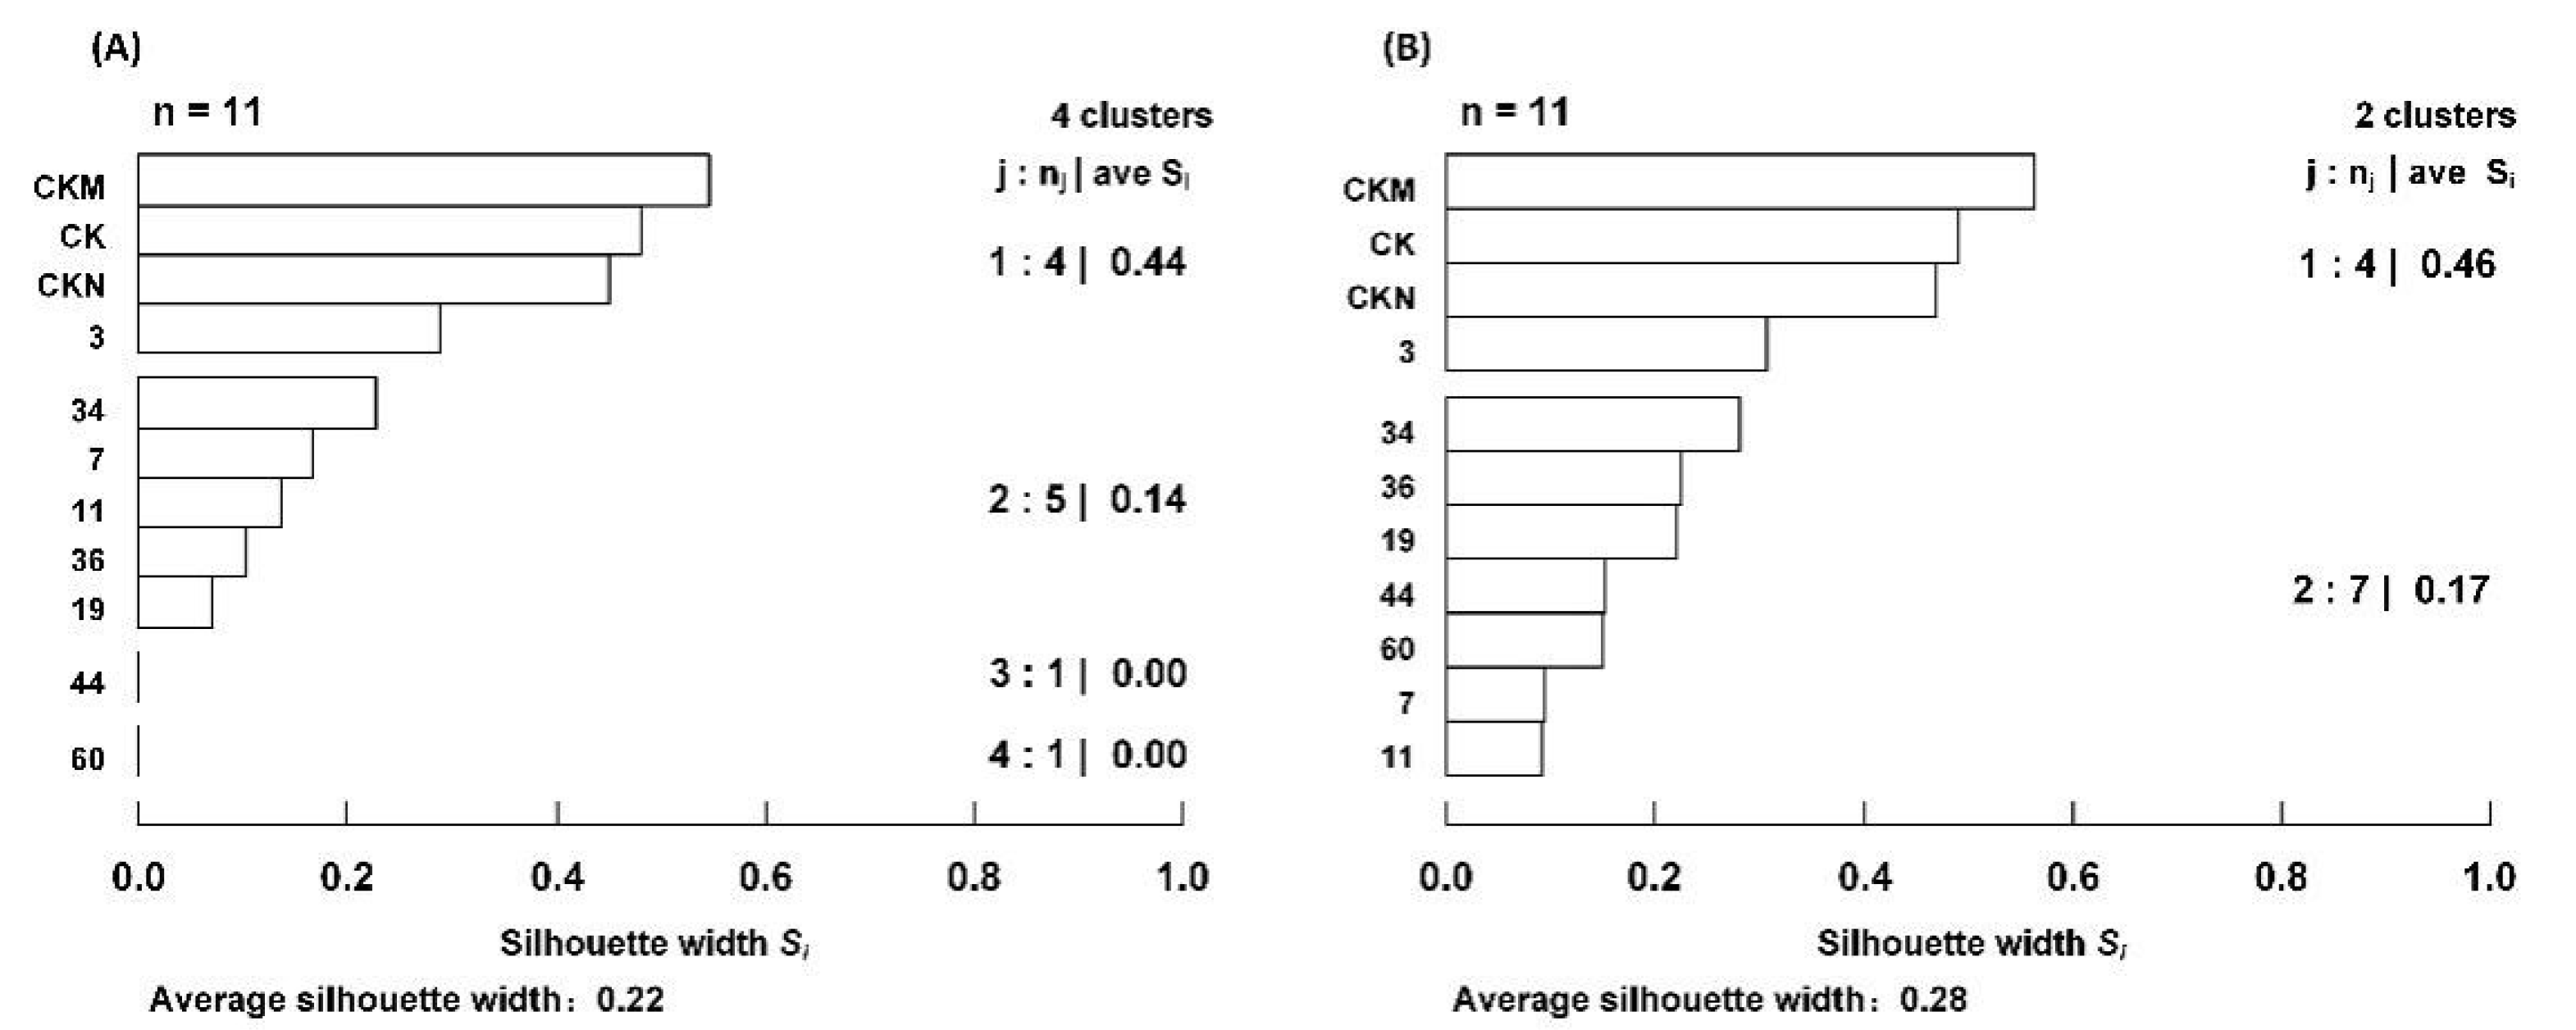
3.3. Plant Community Succession Process

The optimal grouping scheme of each clustering method was obtained through the analysis of the Mantel correlation coefficient method. The results showed that the optimal grouping scheme of single linkage agglomerative clustering, complete linkage agglomerative clustering, UPGMA, and Ward was 4, 2, 2, and 2 groups, respectively. Based on the optimal grouping scheme, the clustering trees that were obtained by each clustering method were cut accordingly, and the results are shown in Figure 5. The grouping results of the above four clustering methods (i.e., two groups and four groups) were tested using a silhouette width plot (Figure 6). The average silhouette width value of the two groups and four groups were 0.28 and 0.22, respectively. Therefore, combining the cophenotype correlation coefficient that was calculated above in 2.3.2 and the silhouette width value, the UPGMA clustering should be selected as the final choice, which indicated that CKN, CKM, CK, and the three-year reclamation area were grouped, and the 7a, 11a, 19a, 34a, 36a, 44a, and 60a reclamation area were in the second group.

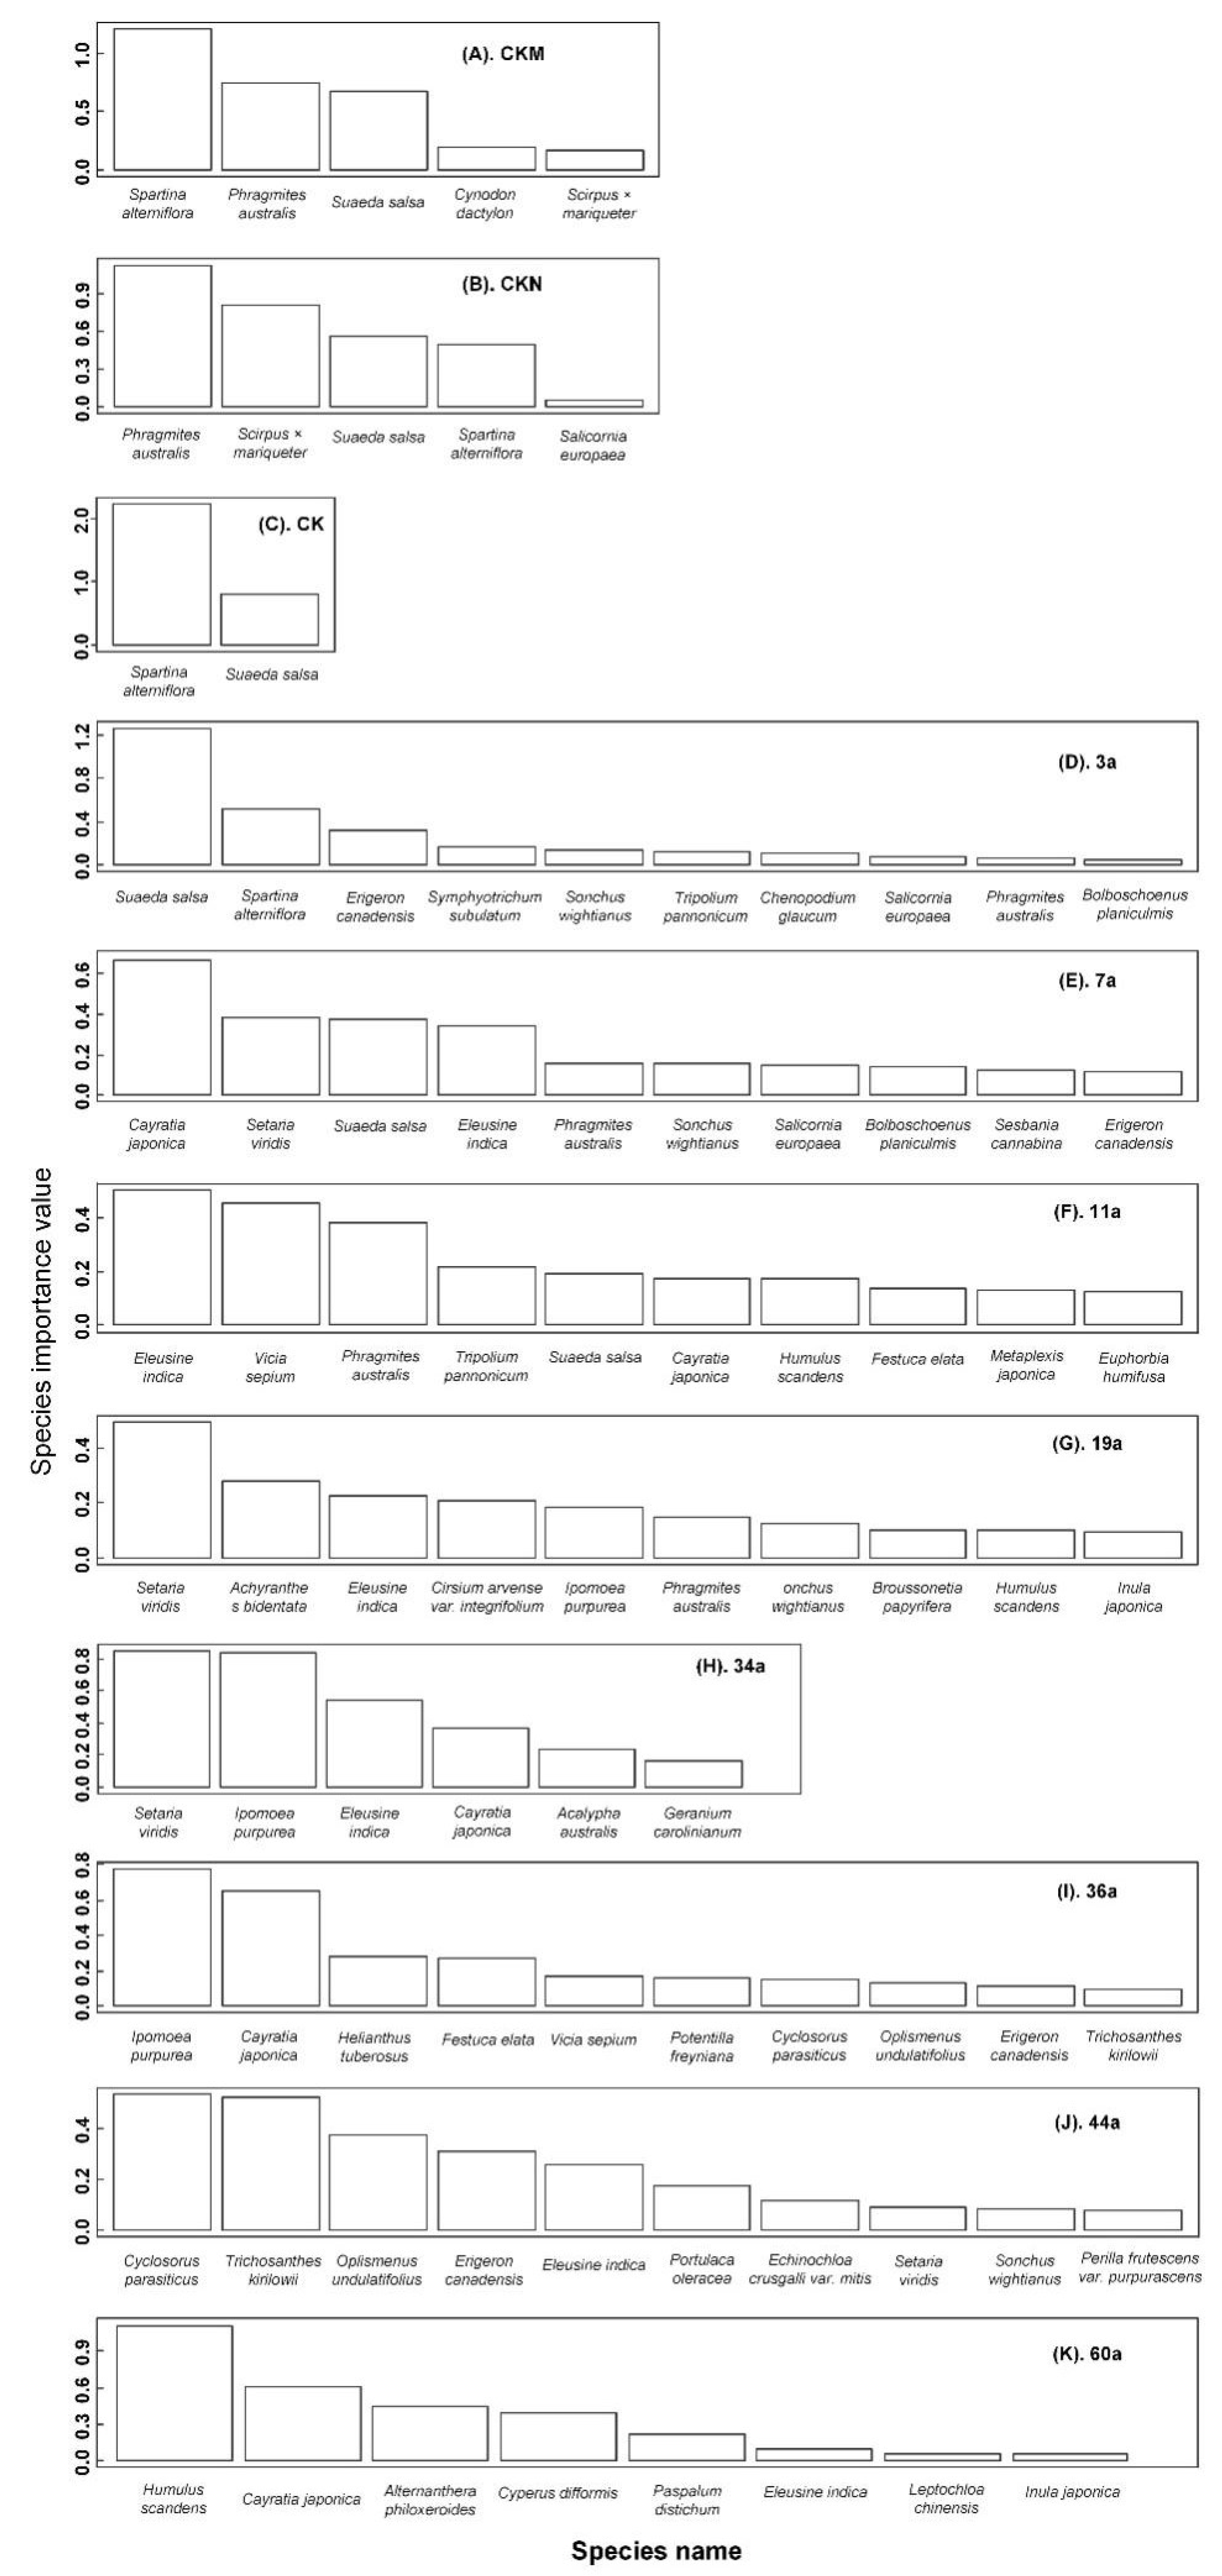
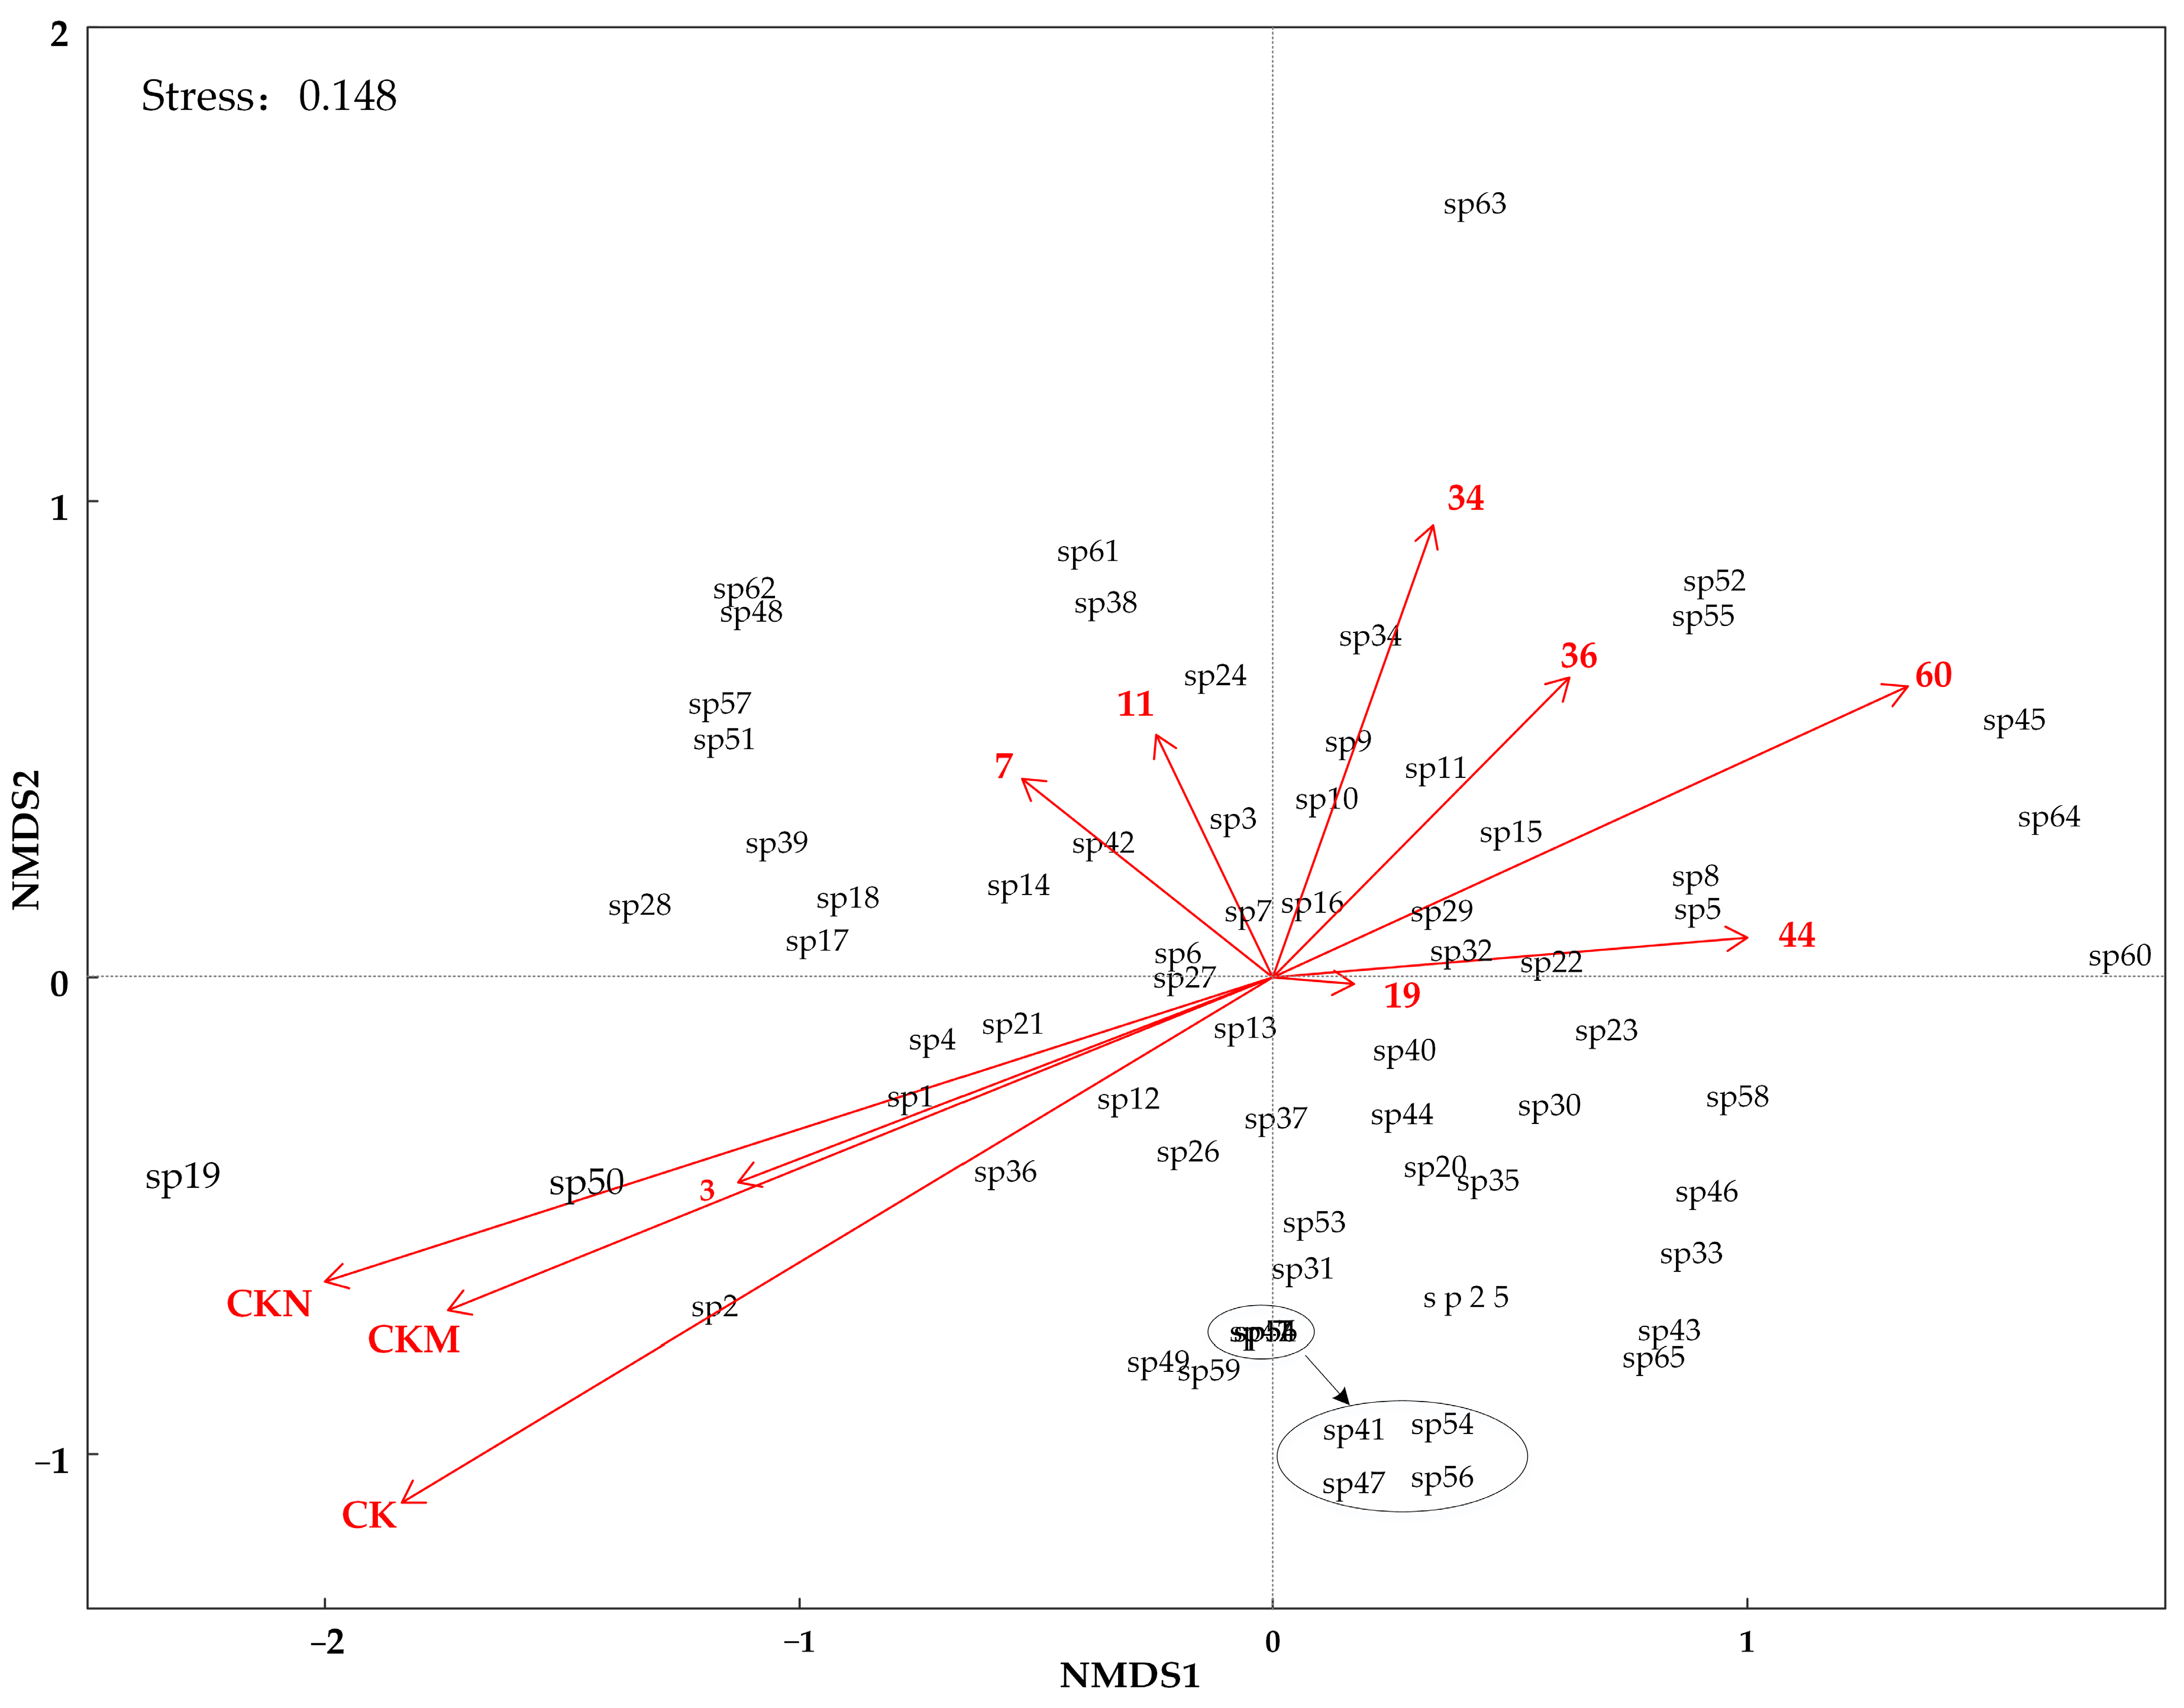
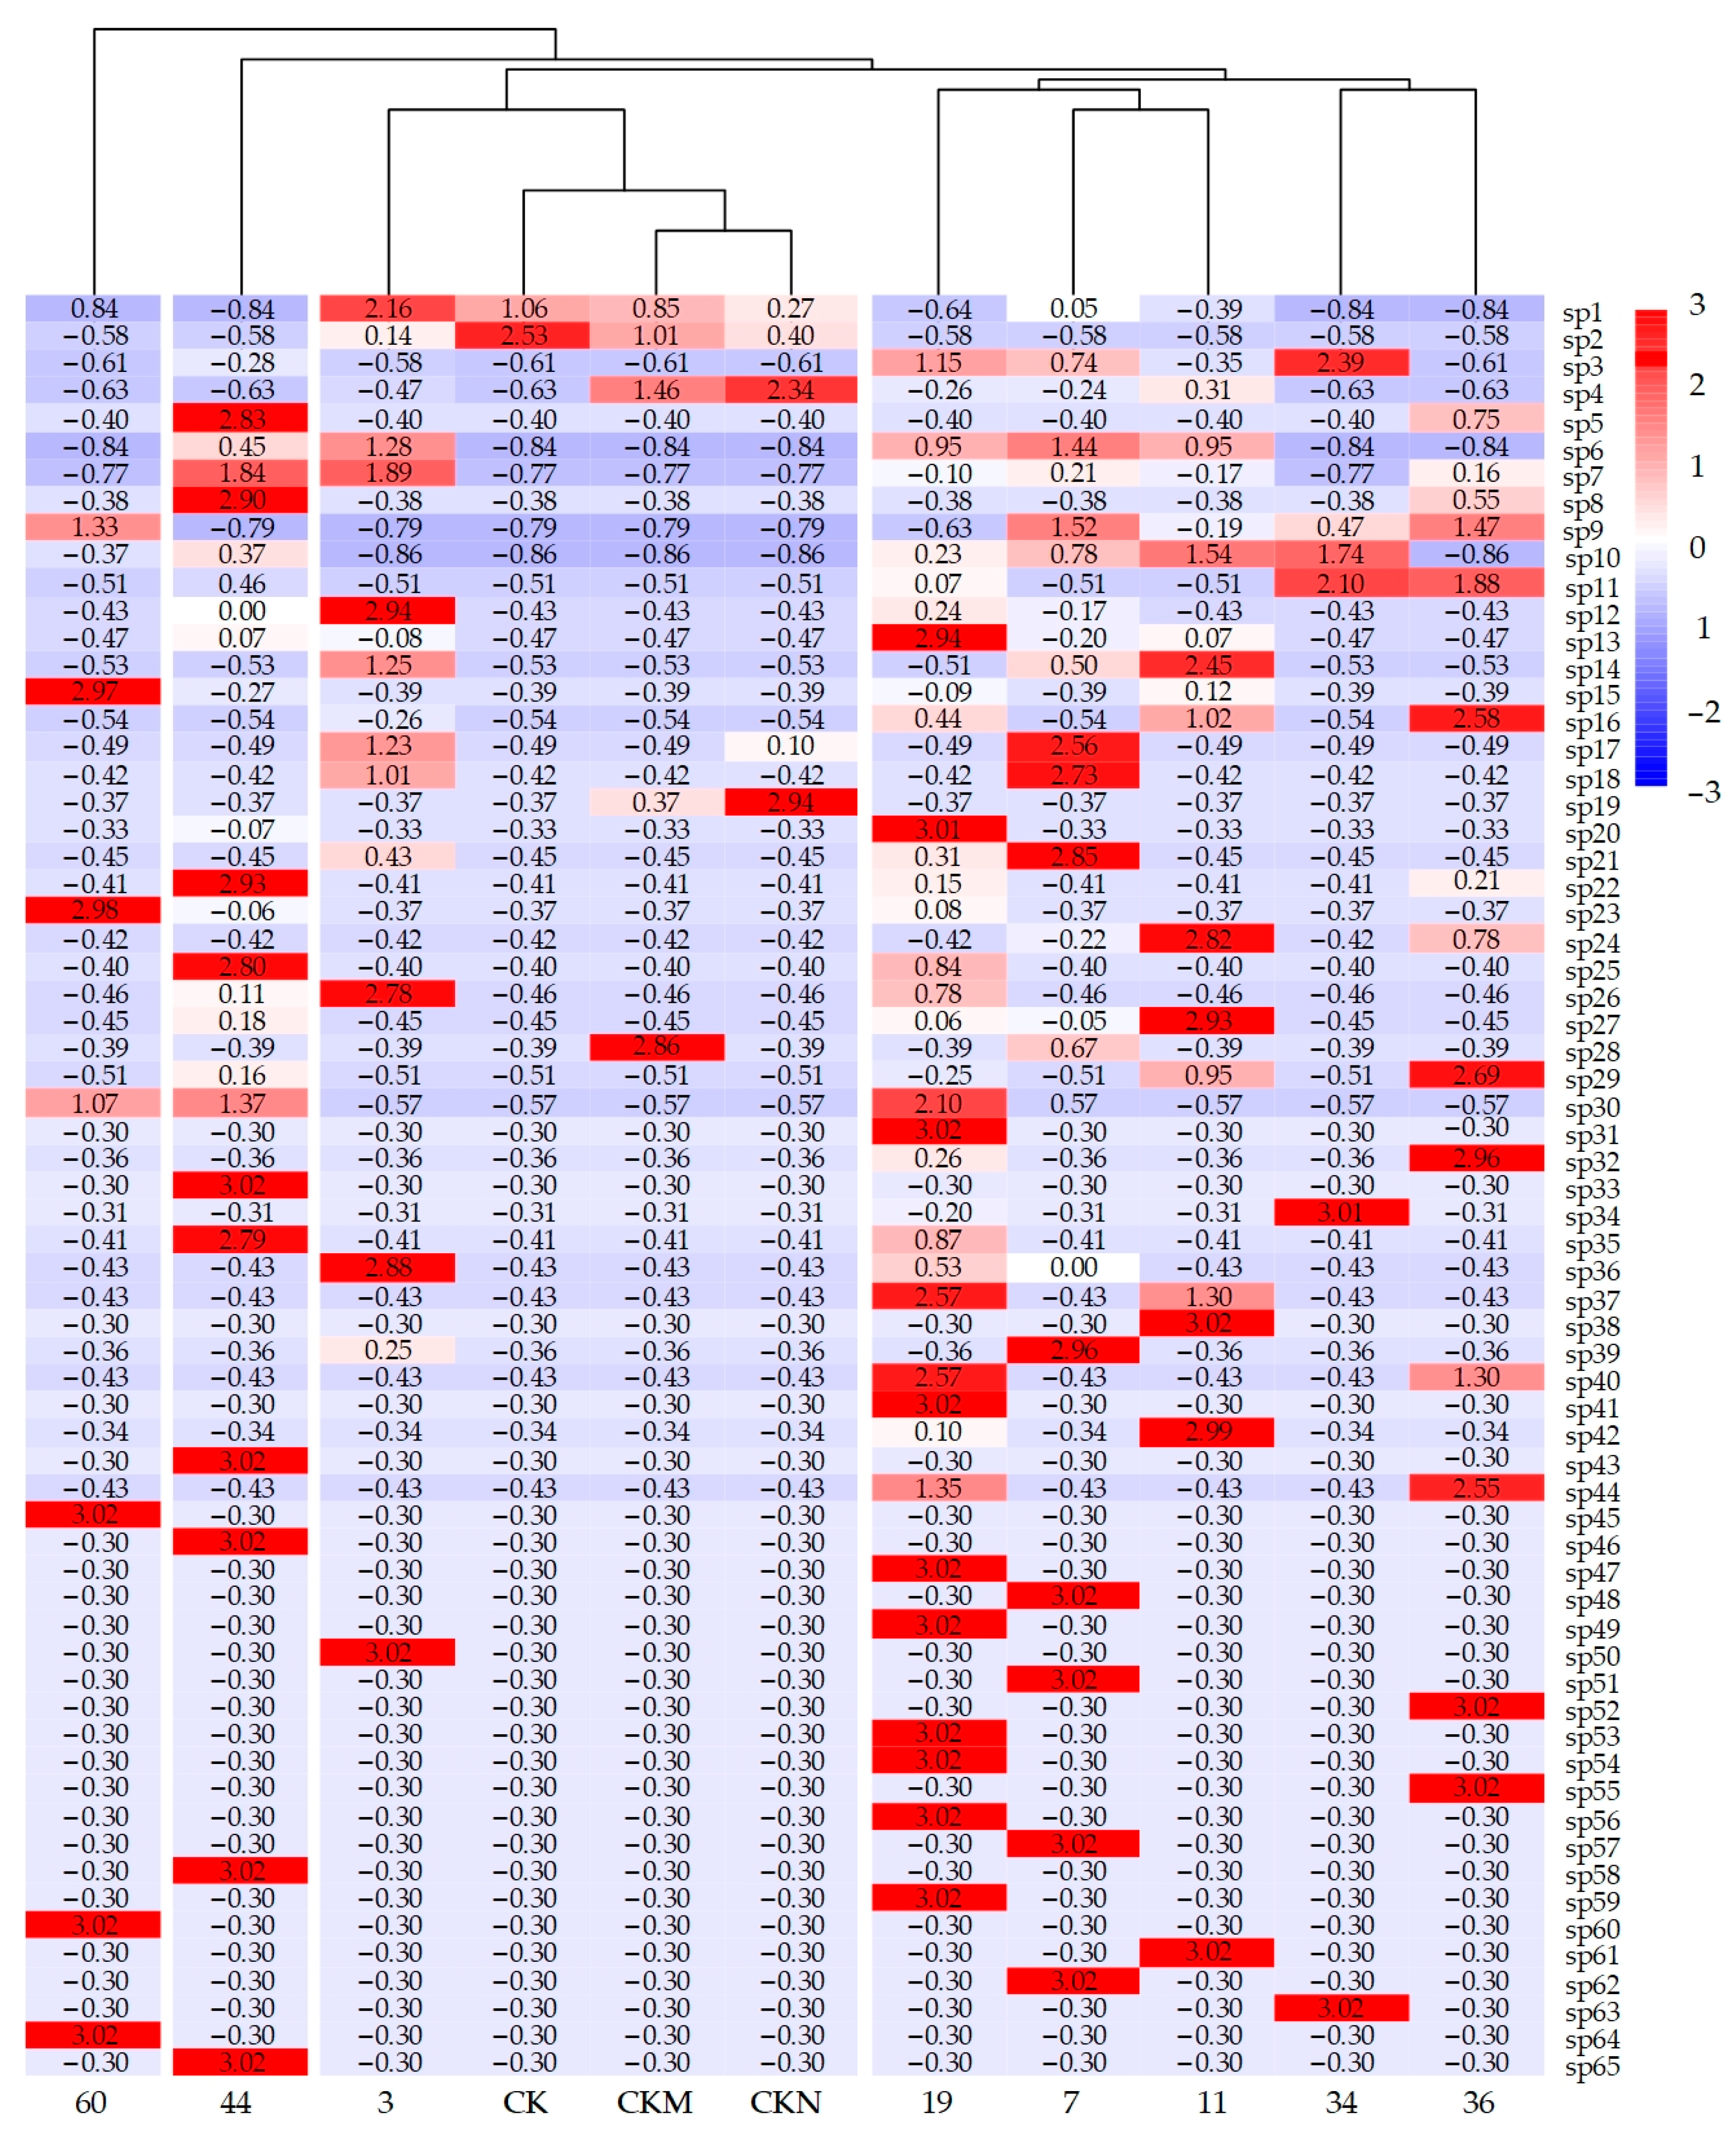
3.4. The Representative Species in the Process of Plant Community Succession

The representative species of the plant communities in the tidal flat reclamation area during the succession process of different years were further explored by using NMDS (Figure 7). At the same time, the relationship between the species and reclamation areas could be more clearly identified by showing the relationship between the species and reclamation areas in the form of a heatmap (Figure 8). The results showed that sp4 and sp19 were the typical species of CKN, while sp28 mainly appeared in CKM, sp2 was a typical species of CK. Sp50, sp12, sp36, sp26, and sp1 were mainly distributed in the three-year reclamation area. Sp48, sp51, sp57, sp62, sp39, sp17, sp18, and sp21 were mainly distributed in the seven-year reclamation area. Sp61, sp38, sp42, sp27, sp24, and sp14 were the representative species in the 11-year reclamation area. Sp31, sp41, sp47, sp49, sp53, sp54, sp56, sp59, sp20, sp13, and sp30 were mainly distributed in the 19-year reclamation area. Sp63, sp34, sp3, and sp11 were the typical species in the 34-year reclamation area. Sp52, sp55, sp32, sp29, sp16, and sp44 were mainly distributed in the 36-year reclamation area. Sp65, sp58, sp46, sp43, sp33, sp22, sp8, sp5, sp25, and sp35 were the representative species in the 44-year reclamation area. Sp64, sp60, sp45, sp23, and sp15 were mainly distributed in the 60-year reclamation area. The species succession process of plant communities in the coastal wetland ecosystem from sea to land under the influence of reclamation activities could be roughly summarized: Suaeda salina, Spartina alterniflora, Phragmites australis (CK) → Tamarix chinensis, Aster subulatus and Chenopodium glaucum, etc. (3-year reclamation area) → Calamagrostis epigeios, Salicornia europaea, Bolboschoenus planiculmis, and Sesbania cannabina, etc. (7-year reclamation area) → Euphorbia humifusa, Metaplexis japonica, and Tripolium pannonicum, etc. (11-year reclamation area) → Equisetum ramosissimum, Echinochloa colona, Trifolium repens, etc. (19-year reclamation area) → Geranium carolinianum, Acalypha australis, Setaria viridis, etc. (34-year reclamation area) → Amaranthus retroflexus, Bidens biternata, Helianthus tuberosus, etc. (36-year reclamation area) → Vigna minima, Portulaca oleracea, Perilla frutescens var. purpurascens, etc. (44-year reclamation area) → Paspalum distichum, Leptochloa chinensis, Alternanthera philoxeroides, etc. (60-year reclamation area). Combining the above cluster analysis results and further sorting out the succession process of the plant community, it could be seen that the plant community of the coastal wetland ecosystem under the influence of reclamation activities was first composed of salt-tolerant plants (such as Suaeda salsa, Spartina alterniflora, etc.), going through a species transition zone (a mesophytic plant community that was constructed with Setaria viridis, Eleusine indica, etc. as pioneer species), and finally succeeded to the xerophyte plant community that was dominated by Humulus scandens, Cyperus difformis, etc.

4. Discussion

4.1. Species Composition and Characteristics of Plant Community with Coastal Reclamation Activities

A total of 65 species were recorded, belonging to 26 families and 61 genera. Poaceae was the most common plant species in the plant community in the study area. Specifically, the plant communities in the core area of Jiangsu Yancheng Wetland Rare Birds National Nature Reserve (CKN), the third core area of Jiangsu Dafeng Elk National Nature Reserve (CKM), and the unreclaimed area of Dongtai (CK) were mainly composed of Poaceae and Cyperaceae. After reclamation, the plant community was dominated by Poaceae and Asteraceae. The composition of the plant community in this study was consistent with the research of Wu Baocheng et al. (2015) [43] and was consistent with the species composition of the plant community in other coastal reclamation areas of China. For example, a total of 50 species were recorded in the Fengxian reclamation area of Yangtze River Estuary, belonging to 20 families and 50 genera, among which Poaceae and Asteraceae accounted for 46% [28]. A total of 49 species belonging to 20 families and 45 genera were recorded in Dongtan reclamation areas of Chongming Island, Shanghai, among which Asteraceae and Poaceae accounted for about 45% [44]. What’s more, the vegetation survey in the Yueqing Bay and Hangzhou Bay found that the plant species were mostly composed of Spartina alterniflora, Phragmites australis, Tripolium pannonicum, Suaeda salsa, etc., among which Spartina alterniflora and Phragmites australis were the dominant species in the new reclamation area; and the proportion of Asteraceae (Erigeron annuus, Sochus wightianus) and Poaceae (such as Setaria viridis, Cynodon dactylon, and Eragrostis Pilosa) gradually increased [45]. In other countries, the plant community on the coast shows a similar pattern, which was dominated by Poaceae and Cyperaceae in the tidal flat and Poaceae and Asteraceae in the reclamation area. For example, the plant zonation pattern on the coast of South Korea could be described as [Suaeda japonica]–[Phacelurus latifolius]–[Phacelurus latifolius and Phragmites australis]–[Phragmites australis and other xerophyte plants] from the relatively lower to upper tidal zone [46,47]. In Tyrrhenian coastal dunes, central Italy, 61 species were recorded, which mainly were Poaceae and Asteraceae [48].
The characteristics of plant communities by analyzing the coverage, above-ground biomass, and species importance values of plant communities in coastal reclamation areas were further studied. The plant coverage in the reclamation area decreased sharply after three years of reclamation, then gradually increased, and was maintained at 50–70% in the reclamation area. The aboveground biomass decreased significantly after reclamation, from 1.823 kg/m2 in CK to 0.321 kg/m2 after three years of reclamation, and then maintained at 0.11–0.27 kg/m2. As for the importance values, Spartina alterniflora had the highest importance value in CK, while Suaeda salina had the highest importance value in the three-year reclamation area, and Phragmites australis had the high importance value in CKM and the 11-year reclamation area. Considering the importance values, the variation of aboveground biomass could be explained. Spartina alterniflora has many superior traits, such as fast growth, great productivity, and high tolerance to salt [49], which resulted in the high aboveground biomass in CK. Furthermore, many studies have shown that Spartina alterniflora mainly competed with mangroves, Suaeda salina, Scirpus mariqueter, Tamarix chinensis, and other native species in coastal wetlands [50,51]. Thus, Spartina alterniflora occupied the ecological niche of the native species, resulting in the compression of the living space of the native species.

4.2. The Succession Process of Plant Community with Coastal Reclamation Activities

Through the comprehensive comparison of the four clustering methods that were used in this study, the analysis of the succession process of plant communities based on species importance values suggested that the UPGMA clustering method was superior methodologically. Previous studies have shown that the sediments and soils in coastal reclamation areas would gradually transform into arable soils, and the soil property tends to be stable about 30 years after reclamation [39,52]. Therefore, the result of the single linkage agglomerative clustering (four groups) was superior theoretically. Specifically, the 11 subareas in the study area could be clustered into four groups. Group 1 was the distribution area of salt marsh, which mainly included CKN, CKM, CK, and the three-year reclamation area. This area was mainly composed of typical salt-tolerant plants (Spartina alterniflora, Suaeda salsa, Salicornia europaea, Phragmites australis, etc.). Group 2 was the species transition area, including the reclamation area from 7a to 36a, where pioneer species with mesophyte characteristics appeared. At this time, the plant community included salt marshes and mesophytes simultaneously, and the plant community transformed from salt marshes in coastal wetlands to mesophyte communities. The third group was the species-stable area, which mainly included the 44-year reclamation area, and the plant community was completely composed of xerophytes. The fourth group was the community-stable area, which mainly included the 60-year reclamation area, and the plant community biomass at this time (Figure 2) reached a stable state. Combined with the ranking of species importance values (Figure 3), the species succession process showed that seven years of reclamation was a key time point for the transformation of coastal wetland ecosystems to terrestrial ecosystems, and the ecosystems gradually reached a new steady-state along with 60 years of reclamation.
This study applied a quantitative methodology combining cluster analysis and NMDS to explore the process of plant succession and the representative species of different phases. The plant community of the coastal wetland ecosystem was dominated by the halophyte community of salt marshes (such as Suaeda salsa, Spartina alterniflora, Scirpus mariqueter, Phragmites australis, Tamarix chinensis, etc.), then turned to be the mesophytic plant community that was constructed by pioneer species such as Setaria viridis and Eleusine indica, eventually succeeded to the xerophytic plant community that was dominated by Humulus scandens and Cyperus difformis. What’s more, coastal reclamation activity with the sea embankment plays an important role in vegetation succession [22,53]. In general, the succession process of the plant community in the coastal reclamation area is mostly external succession. Specifically, the dynamic conditions of the tidal flat, the elevation gradient, and the soil salinity determine the distribution and composition of the plant community [22,54,55]. Moreover, human activities resulting in different land-use types and soil physical and chemical properties are important factors affecting the growth and succession of vegetation in coastal reclamation areas [18,52,56]. Further analysis should focus on the impact of environmental factors on plant community characteristics and species diversity, and an in-depth analysis of the coupling relationship between human activities, environmental factors, and plant community characteristics, and reveal the effect of reclamation activities on the coastal wetland ecosystems.

5. Conclusions

In this study, a quantitative analysis method combining cluster analysis and NMDS was used to explore the succession process and the representative species of plant communities in a coastal reclamation area. A total of 65 species were recorded in 123 sampling quadrats belonging to 26 families and 61 genera. The plant community from the coast to inland was dominated by a halophyte community of salt marshes, then turned to be a mesophyte plant community, and eventually succeeded to a xerophyte plant community. Under the influence of 60 years of reclamation activities, the plant succession pattern in the coastal ecosystem could be summarized as the salt marsh area, the species transition area, the species-stable area, and the community-stable area. A total of seven years after reclamation may be the tipping point in the succession of the plant community in the coastal reclamation area, which indicated the transformation of coastal wetland ecosystems into terrestrial ecosystems. The results of this study can provide a basis and reference for the ecological protection and restoration in coastal reclamation areas.

Supplementary Materials

The following are available online at https://www.mdpi.com/article/10.3390/su14095118/s1, Table S1: Species list, Table S2: Vegetation coverage of the sampling quadrats.

Author Contributions

Data collection and analysis, C.X. and X.W.; writing—original draft, C.X.; writing—review & editing, C.X., L.P., F.K. and B.L.; research design and methodology, C.X., X.W., L.P. and F.K.; constructive suggestions, B.L. and F.K. All authors have read and agreed to the published version of the manuscript.

Funding

This research was funded by the Major Research Project of Humanities and Social Sciences in Colleges and Universities of Zhejiang Province (Grant No. 2021QN062), Zhejiang Soft Science Research Program of China (Grant No. 2022C35104), Research Development Fund of Zhejiang A&F University (Grant No. 2020FR066), Zhejiang Provincial Natural Science Foundation of China (Grant No. Z22D010686), and the National Natural Science Foundation of China (Grant No. 41871083, 42171245, and 42071283).

Institutional Review Board Statement

Not applicable.

Informed Consent Statement

Not applicable.

Data Availability Statement

Not applicable.

Acknowledgments

Thanks to the anonymous reviewers and editors for their comments and suggestions which helped improve the manuscript.

Conflicts of Interest

The authors declare no conflict of interest.

References

  1. Ma, Z.J.; Melville, D.S.; Liu, J.G.; Chen, Y.; Yang, H.Y.; Ren, W.W.; Zhang, Z.W.; Piersma, T.; Li, B. Rethinking China’s new great wall. Science 2014, 346, 912–914. [Google Scholar] [CrossRef] [PubMed] [Green Version]
  2. Seminara, G.; Lanzoni, S.; Cecconi, G. Coastal wetlands at risk: Learning from Venice and New Orleans. Ecohydrol. Hydrobiol. 2011, 11, 183–202. [Google Scholar] [CrossRef]
  3. Glaser, R.; Haberzettl, P.; Walsh, R.P.D. Land reclamation in Singapore, Hong Kong and Macau. GeoJournal 1991, 24, 365–373. [Google Scholar] [CrossRef]
  4. Boesch, D.F.; Josselyn, M.N.; Mehta, A.J.; Morris, J.T.; Nuttle, W.K.; Simenstad, C.A.; Swift, D.J. Scientific assessment of coastal wetland loss, restoration and management in Louisiana. J. Coast. Res. 1994, 20, 1–103. [Google Scholar]
  5. Cho, D.O. The evolution and resolution of conflicts on Saemangeum Reclamation Project. Ocean Coast Manag. 2007, 50, 930–944. [Google Scholar] [CrossRef]
  6. Lotze, H.K.; Lenihan, H.S.; Bourque, B.J.; Bradbury, R.H.; Cooke, R.G.; Kay, M.C.; Kidwell, S.M.; Kirby, M.X.; Peterson, C.H.; Jackson, J.B.C. Depletion, Degradation, and Recovery Potential of Estuaries and Coastal Seas. Science 2006, 312, 1806–1809. [Google Scholar] [CrossRef] [PubMed]
  7. Gibson, R.; Atkinson, R.; Gordon, J. Loss, Status and Trends for Coastal Marine Habitats of Europe. Annu. Rev. 2007, 45, 345–405. [Google Scholar] [CrossRef]
  8. Xu, C.; Pu, L.; Zhu, M. Effect of reclamation activity on coastal ecological environment: Progress and perspectives. Acta Ecol Sin 2018, 38, 1148–1162. (In Chinese) [Google Scholar] [CrossRef]
  9. Wang, L.; Li, Q.; Bi, H.; Mao, X.-Z. Human impacts and changes in the coastal waters of south China. Sci Total Env. 2016, 562, 108–114. [Google Scholar] [CrossRef]
  10. Lee, C.-H.; Lee, B.-Y.; Chang, W.K.; Hong, S.; Song, S.J.; Park, J.; Kwon, B.-O.; Khim, J.S. Environmental and ecological effects of Lake Shihwa reclamation project in South Korea: A review. Ocean Coast Manag. 2014, 102, Pt B, 545–558. [Google Scholar] [CrossRef]
  11. Wang, W.; Liu, H.; Li, Y.Q.; Su, J. Development and management of land reclamation in China. Ocean Coast Manag. 2014, 102 Pt B, 415–425. [Google Scholar] [CrossRef]
  12. Tian, B.; Wu, W.T.; Yang, Z.Q.; Zhou, Y.X. Drivers, trends, and potential impacts of long-term coastal reclamation in China from 1985 to 2010. Estuar. Coast. Shelf Sci. 2016, 170, 83–90. [Google Scholar] [CrossRef]
  13. Verhoeven, J.T.A. Wetlands in Europe: Perspectives for restoration of a lost paradise. Ecol. Eng. 2014, 66, 6–9. [Google Scholar] [CrossRef]
  14. Liu, Z.; Cui, B.; He, Q. Shifting paradigms in coastal restoration: Six decades’ lessons from China. Sci Total Environ. 2016, 566–567, 205–214. [Google Scholar] [CrossRef] [PubMed] [Green Version]
  15. Nam, J.; Ryu, J.; Fluharty, D.; Koh, C.-H.; Dyson, K.; Chang, W.K.; Choi, H.-J.; Kang, D.; Khim, J.S.; Lee, C.-H. Designation processes for marine protected areas in the coastal wetlands of South Korea. Ocean Coast Manag. 2010, 53, 703–710. [Google Scholar] [CrossRef]
  16. Smith, C.M.S.; Bowie, M.H.; Hahner, J.L.; Boyer, S.; Kim, Y.N.; Zhong, H.T.; Abbott, M.; Rhodes, S.; Sharp, D.; Dickinson, N. Punakaiki Coastal Restoration Project: A case study for a consultative and multidisciplinary approach in selecting indicators of restoration success for a sand mining closure site, West Coast, New Zealand. Catena 2016, 136, 91–103. [Google Scholar] [CrossRef]
  17. Wang, X.; Xiao, X.; Xu, X.; Zou, Z.; Chen, B.; Qin, Y.; Zhang, X.; Dong, J.; Liu, D.; Pan, L.; et al. Rebound in China’s coastal wetlands following conservation and restoration. Nat. Sustain. 2021, 4, 1076–1083. [Google Scholar] [CrossRef]
  18. Xu, C.Y.; Pu, L.J.; Kong, F.B.; Li, B.W. Spatio-Temporal Change of Land Use in a Coastal Reclamation Area: A Complex Network Approach. Sustainability 2021, 13, 8690. [Google Scholar] [CrossRef]
  19. Thom, R.M.; Zeigler, R.; Borde, A.B. Floristic Development Patterns in a Restored Elk River Estuarine Marsh, Grays Harbor, Washington. Restor. Ecol 2002, 10, 487–496. [Google Scholar] [CrossRef]
  20. Wolters, M.; Garbutt, A.; Bakker, J.P. Salt-marsh restoration: Evaluating the success of de-embankments in north-west Europe. Biol. Conserv. 2005, 123, 249–268. [Google Scholar] [CrossRef]
  21. Billah, M.M.; Bhuiyan, M.K.A.; Islam, M.A.; Das, J.; Hoque, A.T.M.R. Salt marsh restoration: An overview of techniques and success indicators. Environ. Sci. Pollut. Res. 2022, 29, 15347–15363. [Google Scholar] [CrossRef] [PubMed]
  22. Zhang, X.; Zhang, Z.; Wang, W.; Fang, W.T.; Chiang, Y.T.; Liu, X.; Ju, H. Vegetation successions of coastal wetlands in southern Laizhou Bay, Bohai Sea, northern China, influenced by the changes in relative surface elevation and soil salinity. J. Environ. Manag. 2021, 293, 112964. [Google Scholar] [CrossRef] [PubMed]
  23. Clements, F.E. Plant Succession: An Analysis of the Development of Vegetation; Carnegie Institution of Washington: Washington, DC, USA, 1916. [Google Scholar]
  24. Connell, J.H.; Slatyer, R.O. Mechanisms of Succession in Natural Communities and Their Role in Community Stability and Organization. Am. Nat. 1977, 111, 1119–1144. [Google Scholar] [CrossRef]
  25. Wu, W.; Yang, Z.; Tian, B.; Huang, Y.; Zhou, Y.; Zhang, T. Impacts of coastal reclamation on wetlands: Loss, resilience, and sustainable management. Estuar. Coast. Shelf Sci. 2018, 210, 153–161. [Google Scholar] [CrossRef]
  26. Lewis, C.J.E.; Baldock, J.A.; Hawke, B.; Gadd, P.S.; Zawadzki, A.; Heijnis, H.; Jacobsen, G.E.; Rogers, K.; Macreadie, P.I. Impacts of land reclamation on tidal marsh ‘blue carbon’ stocks. Sci Total Environ. 2019, 672, 427–437. [Google Scholar] [CrossRef]
  27. Ihm, B.-S.; Lee, J.-S.; Kim, J.-W.; Kim, J.-H. Coastal plant and soil relationships along the southwestern coast of South Korea. J. Plant Biol. 2007, 50, 331–335. [Google Scholar] [CrossRef]
  28. Sun, Y.G.; Li, X.Z.; He, Y.L.; Jia, Y.; Ma, Z.G.; Guo, W.Y.; Xin, Z.J. Impact factors on distribution and characteristics of natural plant community in reclamation zones of Changjiang River estuary. Chin. Geogr. Sci. 2012, 22, 154–166. [Google Scholar] [CrossRef]
  29. Angiolini, C.; Bonari, G.; Landi, M. Focal plant species and soil factors in Mediterranean coastal dunes: An undisclosed liaison? Estuar. Coast. Shelf Sci. 2018, 211, 248–258. [Google Scholar] [CrossRef]
  30. Park, Y.-S.; Tison, J.; Lek, S.; Giraudel, J.-L.; Coste, M.; Delmas, F. Application of a self-organizing map to select representative species in multivariate analysis: A case study determining diatom distribution patterns across France. Ecol. Inf. 2006, 1, 247–257. [Google Scholar] [CrossRef]
  31. Zhang, H.B. Spatial and Temporal Changes of Habitat Quality in Jiangsu Yancheng Wetland National Nature Reserve—Rare Birds of China. Appl. Ecol. Environ. Res. 2019, 17, 4807–4821. [Google Scholar] [CrossRef]
  32. Sun, X.; Liu, W.; Li, S.; Chen, P.; Cao, M.; Randhir, T.O.; Zhang, Y. Species richness patterns of waterbirds overwintering on the Jiangsu coast for coastal reclamation. Ocean Coast. Manag. 2021, 205, 105488. [Google Scholar] [CrossRef]
  33. Wang, X.; Xiao, X.; Zou, Z.; Hou, L.; Qin, Y.; Dong, J.; Doughty, R.B.; Chen, B.; Zhang, X.; Chen, Y.; et al. Mapping coastal wetlands of China using time series Landsat images in 2018 and Google Earth Engine. ISPRS J. Photogramm. 2020, 163, 312–326. [Google Scholar] [CrossRef] [PubMed]
  34. Jiangsu Coastal Areas Development Office. Outline of Jiangsu Coastal Reclamation Development Plan. Available online: http://www.china.com.cn/photo/zhuanti/jsyhkf/2009-08/27/content_18408884.htm (accessed on 25 February 2022). (In Chinese).
  35. Fang, S.; Jia, X.; Qian, Q.; Cui, J.; Cagle, G.; Hou, A. Reclamation history and development intensity determine soil and vegetation characteristics on developed coasts. Sci Total Environ. 2017, 586, 1263–1271. [Google Scholar] [CrossRef] [PubMed]
  36. Fang, S.B.; Xu, C.; Jia, X.B.; Wang, B.Z.; An, S.Q. Using heavy metals to detect the human disturbances spatial scale on Chinese Yellow Sea coasts with an integrated analysis. J. Hazard. Mater. 2010, 184, 375–385. [Google Scholar] [CrossRef]
  37. Zuo, X.; Cui, L.; Li, W.; Lei, Y.; Dou, Z.; Liu, Z.; Cai, Y.; Zhai, X. Spartina alterniflora Leaf and Soil Eco-Stoichiometry in the Yancheng Coastal Wetland. Plants 2021, 10, 13. [Google Scholar] [CrossRef]
  38. Xu, P.; Zhang, X.; Zhang, F.; Bempah, G.; Lu, C.; Lv, S.; Zhang, W.; Cui, P. Use of aquaculture ponds by globally endangered red-crowned crane (Grus japonensis) during the wintering period in the Yancheng National Nature Reserve, a Ramsar wetland. Glob. Ecol. Conserv. 2020, 23, e01123. [Google Scholar] [CrossRef]
  39. Sun, Y.G.; Li, X.Z.; Mander, Ü.; He, Y.L.; Jia, Y.; Ma, Z.G.; Guo, W.Y.; Xin, Z.J. Effect of reclamation time and land use on soil properties in Changjiang River Estuary, China. Chin. Geogr. Sci. 2011, 21, 403–416. [Google Scholar] [CrossRef]
  40. Borcard, D.; Gillet, F.; Legendre, P. Cluster Analysis. In Numerical Ecology with R; Borcard, D., Gillet, F., Legendre, P., Eds.; Springer: New York, NY, USA, 2011; pp. 53–114. [Google Scholar] [CrossRef]
  41. Oksanen, J.; Kindt, R.; Legendre, P.; O’Hara, B.; Wagner, H. The VEGAN Package: Community Ecology Package. Available online: https://cran.r-project.org/web/packages/vegan/vegan.pdf (accessed on 24 February 2022).
  42. Borcard, D.; Gillet, F.; Legendre, P. Unconstrained Ordination. In Numerical Ecology with R; Borcard, D., Gillet, F., Legendre, P., Eds.; Springer: New York, NY, USA, 2011; pp. 115–151. [Google Scholar] [CrossRef]
  43. Baocheng, W.; Qixin, L.; Jun, H.; Yuning, X.; Zhenguo, D. Variation of characteristics of plant community in tidal flats during different reclamation periods in Dongtai City, Jiangsu Province. J. Hohai Univ. (Nat. Sci.) 2015, 43, 548–554. (In Chinese) [Google Scholar]
  44. Yang, J.; Yu, H.G.; Xu, F.J.; Ma, M.R.; You, W.H. Species composition and diversity of herb communities in Dongtan reclamation areas of Chongming Island, Shanghai. Chin. J. Ecol. 2013, 32, 1748–1755. (In Chinese) [Google Scholar]
  45. Shen, J.; Hu, R.; Li, M.; Ding, P.; Yu, M.; Ding, B. Influence of reclamation on plant diversity of beach wetlands in Hangzhou Bay and Yueqing Bay in East China. J. Zhejiang Univ. (Sci. Ed.) 2006, 33, 324–328, 332. (In Chinese) [Google Scholar]
  46. Nam, B.E.; Hong, M.G.; Park, H.J.; Kim, J.G. Soil factors determining the distribution of Phragmites australis and Phacelurus latifolius in upper tidal zone. J. Ecol. Environ. 2018, 42, 25. [Google Scholar] [CrossRef]
  47. Lee, J.-S.; Kim, J.-W.; Lee, S.H.; Myeong, H.-H.; Lee, J.-Y.; Cho, J.S. Zonation and soil factors of salt marsh halophyte communities. J. Ecol. Environ. 2016, 40, 4. [Google Scholar] [CrossRef] [Green Version]
  48. Landi, M.; Angiolini, C. Soil-Plant Relationships in Mediterranean Salt Marshes across Dune-Cultivated Land Gradient. J. Coast. Res. 2013, 31, 588–594. [Google Scholar] [CrossRef]
  49. Li, B.; Liao, C.-H.; Zhang, X.-D.; Chen, H.-L.; Wang, Q.; Chen, Z.-Y.; Gan, X.-J.; Wu, J.-H.; Zhao, B.; Ma, Z.-J.; et al. Spartina alterniflora invasions in the Yangtze River estuary, China: An overview of current status and ecosystem effects. Ecol. Eng. 2009, 35, 511–520. [Google Scholar] [CrossRef]
  50. Zuo, P.; Zhao, S.; Liu, C.A.; Wang, C.; Liang, Y. Distribution of Spartina spp. along China’s coast. Ecol. Eng. 2012, 40, 160–166. [Google Scholar] [CrossRef]
  51. Liao, C.; Luo, Y.; Jiang, L.; Zhou, X.; Wu, X.; Fang, C.; Chen, J.; Li, B. Invasion of Spartina alterniflora Enhanced Ecosystem Carbon and Nitrogen Stocks in the Yangtze Estuary, China. Ecosystems 2007, 10, 1351–1361. [Google Scholar] [CrossRef]
  52. Xu, C.Y.; Pu, L.J.; Li, J.G.; Zhu, M. Effect of reclamation on C, N, and P stoichiometry in soil and soil aggregates of a coastal wetland in eastern China. J. Soil Sediments 2019, 19, 1215–1225. [Google Scholar] [CrossRef]
  53. Bi, X.; Wen, X.; Yi, H.; Wu, X.; Gao, M. Succession in soil and vegetation caused by coastal embankment in southern Laizhou Bay, China—Flourish or degradation? Ocean Coast. Manag. 2014, 88, 1–7. [Google Scholar] [CrossRef]
  54. Huo, H.; Guo, J.; Li, Z.-L.; Jiang, X. Remote Sensing of Spatiotemporal Changes in Wetland Geomorphology Based on Type 2 Fuzzy Sets: A Case Study of Beidagang Wetland from 1975 to 2015. Remote Sens. 2017, 9, 683. [Google Scholar] [CrossRef] [Green Version]
  55. Yang, H.; Xia, J.; Cui, Q.; Liu, J.; Wei, S.; Feng, L.; Dong, K. Effects of different Tamarix chinensis-grass patterns on the soil quality of coastal saline soil in the Yellow River Delta, China. Sci Total Environ. 2021, 772, 145501. [Google Scholar] [CrossRef]
  56. Min, B.M.; Kim, J.-H. Plant succession and interaction between soil and plants after land reclamation on the west coast of Korea. J. Plant Biol. 2000, 43, 41–47. [Google Scholar] [CrossRef]
Figure 1. The location of the study area and sampling quadrats.
Sustainability 14 05118 g001
Figure 2. The species composition and coverage of the plant community along with reclamation time in the coastal area. The mean vegetation coverage of each subarea was the absolute value in (A), while it was the relative value in (B). The error bars at the upper and lower ends of each box represent the maximum and minimum values of the data, respectively, the upper and lower ends of the box represent the upper quartile and the lower quartile, and the horizontal line in the box represents the median value. Different lowercase letters mean a significant difference between CKM, CKN, CK, and the reclamation areas at the 0.05 level. The species composition in (B) represents the distribution of the family in each subarea. The exact value of the vegetation coverage of each family in different subareas can be found in Table S2 in the supplementary file.
Sustainability 14 05118 g002
Figure 3. The aboveground biomass of the plant community along with the reclamation time in the coastal area. Different lowercase letters mean a significant difference between CK and reclamation subareas at the 0.05 level. Different capital letters mean a significant difference between CKM, CKN, and CK at the 0.05 level.
Sustainability 14 05118 g003
Figure 4. The species’ importance value. (AK) respectively represents the important values of species in different plots. If the number of species that were recorded in the sample plot exceeds 10, only the top 10 species are displayed. If the number of species that were recorded in the sample plot is less than 10, all species are displayed.
Sustainability 14 05118 g004
Figure 5. Final dendrogram with boxes around the two or four selected groups of the four clustering methods. Cluster analysis was calculated based on the distance between the sample plots. The "height" of the ordinate is the relative distance between the different subareas, mainly based on the importance value of the different species in the sampling plots to calculate the Bray–Curtis distance.
Sustainability 14 05118 g005
Figure 6. Silhouette plots of the four-group and two-group partition from the four clustering methods. (A) described the silhouette width value of the four-cluster. (B) described the silhouette width value of the two-cluster. In the figure, n is the total number of plots, i is the plot, j is the cluster, nj is the number of plots that were included in the j-th cluster, Si is the silhouette width value of different plots, and ave Si is determined by the average silhouette width value of the clusters composed of the plots.
Sustainability 14 05118 g006
Figure 7. NMDS of vegetation that were based on the Bray–Curtis dissimilarity of important values. sp1: Suaeda salsa; sp2: Spartina alterniflora; sp3: Setaria viridis; sp4: Phragmites australis; sp5: Oplismenus undulatifolius; sp6: Sonchus wightianus; sp7: Erigeron canadensis; sp8: Cyclosorus parasiticus; sp9: Cayratia japonica; sp10: Eleusine indica; sp11: Ipomoea purpurea; sp12: Symphyotrichum subulatum; sp13: Cirsium arvense var. integrifolium; sp14: Tripolium pannonicum; sp15: Humulus scandens; sp16: Festuca elata; sp17: Salicornia europaea; sp18: Bolboschoenus planiculmis; sp19: Scirpus mariqueter; sp20: Achyranthes bidentata; sp21: Sesbania cannabina; sp22: Trichosanthes kirilowii; sp23: Cyperus difformis; sp24: Vicia sepium; sp25: Paederia cruddasiana; sp26: Chenopodium glaucum; sp27: Metaplexis japonica; sp28: Cynodon dactylon; sp29: Potentilla freyniana; sp30: Inula japonica; sp31: Equisetum ramosissimum; sp32: Helianthus tuberosus; sp33: Justicia procumbens; sp34: Acalypha australis; sp35: Echinochloa crusgalli var. mitis; sp36: Erigeron bonariensis; sp37: Euphorbia helioscopia; sp38: Euphorbia humifusa; sp39: Calamagrostis epigeios; sp40: Broussonetia papyrifera; sp41: Echinochloa colona; sp42: Panicum bisulcatum; sp43: Eclipta prostrata; sp44: Miscanthus sinensis; sp45: Alternanthera philoxeroides; sp46: Perilla frutescens var. purpurascens; sp47: Trifolium repens; sp48: Melilotus officinalis; sp49: Acorus calamus; sp50: Tamarix chinensis; sp51: Limonium bicolor; sp52: Amaranthus retroflexus; sp53: Commelina benghalensis; sp54: Polygonum perfoliatum; sp55: Bidens biternata; sp56: Capsicum annuum; sp57: Apocynum venetum; sp58: Portulaca oleracea; sp59: Polygonum lapathifolium var. salicifolium; sp60: Leptochloa chinensis; sp61: Solanum americanum; sp62: Eragrostis minor; sp63: Geranium carolinianum; sp64: Paspalum distichum; sp65: Vigna minima. The following is the same.
Sustainability 14 05118 g007
Figure 8. Heatmap of the relationship between species and subareas based on the cluster tree. In this figure, the abscissa is the sample plot, and the ordinate is the species. The cluster tree that is shown at the top is from the result of the single linkage agglomerative clustering in Figure 4, and the heat map is partitioned based on the optimal grouping result. Based on the analysis results of NMDS, the relationship (relative distance) between the species and sample plot is quantitatively displayed by the value of relative distance. Figure 8 was drawn by using the pheatmap package on the R platform (version 4.1.2, R Development Core Team).
Sustainability 14 05118 g008
Table 1. Basic characteristics of the subareas and sampling quadrats.
SubareaReclamation YearReclamation Time
(Based on 2016)
Number of Sampling Quadrats
A195660 years3
B197244 years9
C198036 years8
D198234 years3
E199719 years20
F200511 years7
G20097 years11
H20133 years34
CK3
CKN13
CKM12
A: Dunmen reclamation zone. B: Changsanjiao reclamation zone. C Xindong reclamation zone. D: Xinsanjiao reclamation zone. E: Sancang reclamation zone. F: Wumingchuan reclamation zone and Cangdong reclamation zone. G: Liangnan reclamation zone. H: Tiaozini 1st reclamation zone. CK: Dongtai coastal tidal flat. CKN: Jiangsu Yancheng Wetland Rare Birds National Nature Reserve. CKM: Jiangsu Dafeng Elk National Nature Reserve.
Publisher’s Note: MDPI stays neutral with regard to jurisdictional claims in published maps and institutional affiliations.

