Article

Estimation for Potential of Agricultural Biomass Sources as Projections of Bio-Briquettes in Indian Context

1
Research Scholar, I.K. Gujral Punjab Technical University Jalandhar, Kapurthala 144603, India
2
Faculty of Engineering, I.K. Gujral Punjab Technical University Jalandhar, Kapurthala 144603, India
3
Sardar Swaran Singh National Institute of Bioenergy, Kapurthala 144602, India
*
Author to whom correspondence should be addressed.
Sustainability 2022, 14(9), 5077; https://doi.org/10.3390/su14095077
Submission received: 24 February 2022 / Revised: 17 March 2022 / Accepted: 18 March 2022 / Published: 23 April 2022
(This article belongs to the Topic Solid Waste Management)

Abstract

:
Energy is an indicator of the socio-economic development of any country and has become an indispensable part of modern society. Despite several renewable sources of energy generation, biomass sources are still under-utilized due to the absence of standard policies of estimation of resources at the country level. This paper attempts to estimate the gross crop residue and surplus residue potential for all provinces of the agricultural country, India. In India, the total area under crop production is 94,305 thousand hectares and the yield from all significant crops is 309,133 kg per hectare. It is estimated that total gross crop residue generation in the country is 480 million tonnes. Subsequently, after consumption of crop residues for numerous applications, the surplus crop residues are 121 million tonnes. The bioenergy potential from the surplus residues is estimated as 1988 PJ, which offers a huge potential energy source, from materials otherwise treated as waste. The Indian province Punjab, rich in agricultural sources and covering only 7% of the total cropping area of the country, generates 11% of the total surplus crop which could be used for further efficient use as bio briquettes.

1. Introduction

Globally, mostly government agencies have introduced subsidies, incentives, feed in tariff schemes, or many others, as a part of an effective policy to enhance investments in the renewable energy sector. India, being a fast developed country with increasing economy and industrial growth, requires additional energy sources. The present national energy scenario has according to the Ministry of Power, a total installed capacity for India of near 395,075 MW, out of which the contribution by central, state, and private sectors are approximately 98,327 MW (24.9%), 105,314 MW (26.7%) and 191,434 MW (48.5%) respectively, up to 31 January 2022 [1]. The electricity generation from these installed capacities thermal 11,385.33 BU, nuclear 43.880 BU, hydro 140.357 BU, RES 105.01 BU, and Bhutan import 7.230 BU (2020–2021) [2]. The all-of-India total generation for 2019–2020 was 1623 TWh, generated as follows: hydro 156 TWh, Thermal 1043 TWh, Nuclear 46 TWh and RES 138 TWh, with the non-utilities contributions in generation 240 TWh. The Indian government’s13th five-year plan shows a commitment for an addition of 100 GW from conventional sources, and the targets set for grid connected renewable electrical energy are 175 GW, out of which the highest is 100 GW solar, followed by 60 GW wind, 10 GW biomass, 5 GW small hydro by 2022 [3,4,5]. The total estimated potential of renewable power in the country is 1,097,465 MW, distributed as solar 68.2%, wind 27.5%, small hydro 1.9%, biomass 1.6%, cogeneration and bagasse 0.5%, and waste to energy 0.2%, as of 31 January 2022 [1]. The total installed capacity of renewable power plants in country is 105,854 MW, and contributions as cumulative achievements from renewable energy sources are solar power 50,304 MW, wind power 40,101 MW, biopower 10,176 MW, small hydro 4840 MW, waste to power 199 MW and waste to energy 235 MW as on 31 January 2022 [2]. Renewable energy in the Indian context is evolving as an important source for power generation, and biomass is the second major energy source.
Globally, all agricultural countries have promoted the use of biomass sources for many household applications and biomass energy generation. Biomass is defined as the bio residue available from the sum of crop production, agricultural waste, vegetation, forestry waste and organic waste. Biomass is a renewable source of energy and contains a complex mixture of carbon, nitrogen, hydrogen, and oxygen [6]. Various biomass resources are available in different parts of countries and are classified based on their availability. The broad classification of biomass energy is in three formats; residue of agricultural crops, energy plantations, and municipal and industrial waste. Agriculture residues are organic materials produced as the by-product from processing and harvesting of agriculture crops. Energy plantations are wastes from agro-based industries, road-side shrubs, plantations, vegetable markets, etc. The municipal and industrial wastes include those from water and industrial, food industry, solid and liquid waste, municipal, sewage and animal waste. These biomass resources can be used as fuel to avoid burning, burying, storage or inefficient usage. The carbon neutrality of biomass sources has made it an ideal renewable for usage in domestic, industrial, and power generation applications [7,8]. With this chief property of biomass sources, the possibility of another biomass fuel named biomass briquettes was explored. Biomass briquettes are a combination of two or more biomass sources or fuels, purposely combined to augment the properties of biomass materials for efficient use as fuel. The technology followed for the preparation of briquettes is a compaction process in which raw biomass is compressed under high pressure, which causes the lignin in the biomass to be liberated so that it binds the material into a firm briquette. Briquetting requires the collection of combustible unused biomass and its compression into a solid block to use as a fuel, that is similar to wood or charcoal. The chief idea behind briquetting is to prepare a fuel with high bulk density, uniform shape and size, low moisture content, and above all else, with good burning properties [9,10].
Research Gap and Motivation: Earlier research on the biomass resource assessment in India was carried out using most data sources, but provincial factual data sheets are insufficient for a comprehensive analysis of all fuel sources. Research also falls short in projections of biomass briquettes as a biomass fuel in the highly agricultural provinces of India. A research gap was identified in the assessment of unused biomass fuels as a massive source for the preparation of briquettes in the agricultural country India. This research gap motivated the authors to review the availability of biomass resources in Indian provinces, with an emphasis on the agricultural province of Punjab as a major biomass briquette source.
Organization of Paper: In Section 2, the renewable power scenario, and the use of crop residues for biomass energy in India, was assessed from published research. Section 2 also included the agricultural scenario in the Indian Province Punjab. Section 3 deals with material and methods adopted for this study. Section 4 included all estimations as the results of this study. Section 5 projects the surplus residue of Punjab as bio briquettes. Section 6 has details of biomass waste management policies in Punjab. Section 7 includes discussion on significant findings of this study and Section 8 is the conclusion.

2. India at a Glance

India is the seventh largest land mass with an area of 328 million hectares and is nearly the most populous nation. Presently, India is subdivided into 36 provinces and union-territories (UTs). India has six main climatic sub-types, ranging from deserts in the west, glaciers in the north, tropical humid climate in the southwest, and a long coastline because the subcontinent is a geographic peninsula. The rich geographical and geological features make the climate quite conducive to a range of ecological habitats. These geographies are added to by agricultural, aquatic, vegetative, animal life forms and have enormous contributions to generating huge biomass sources and can be taken out as potential renewable energy sources.

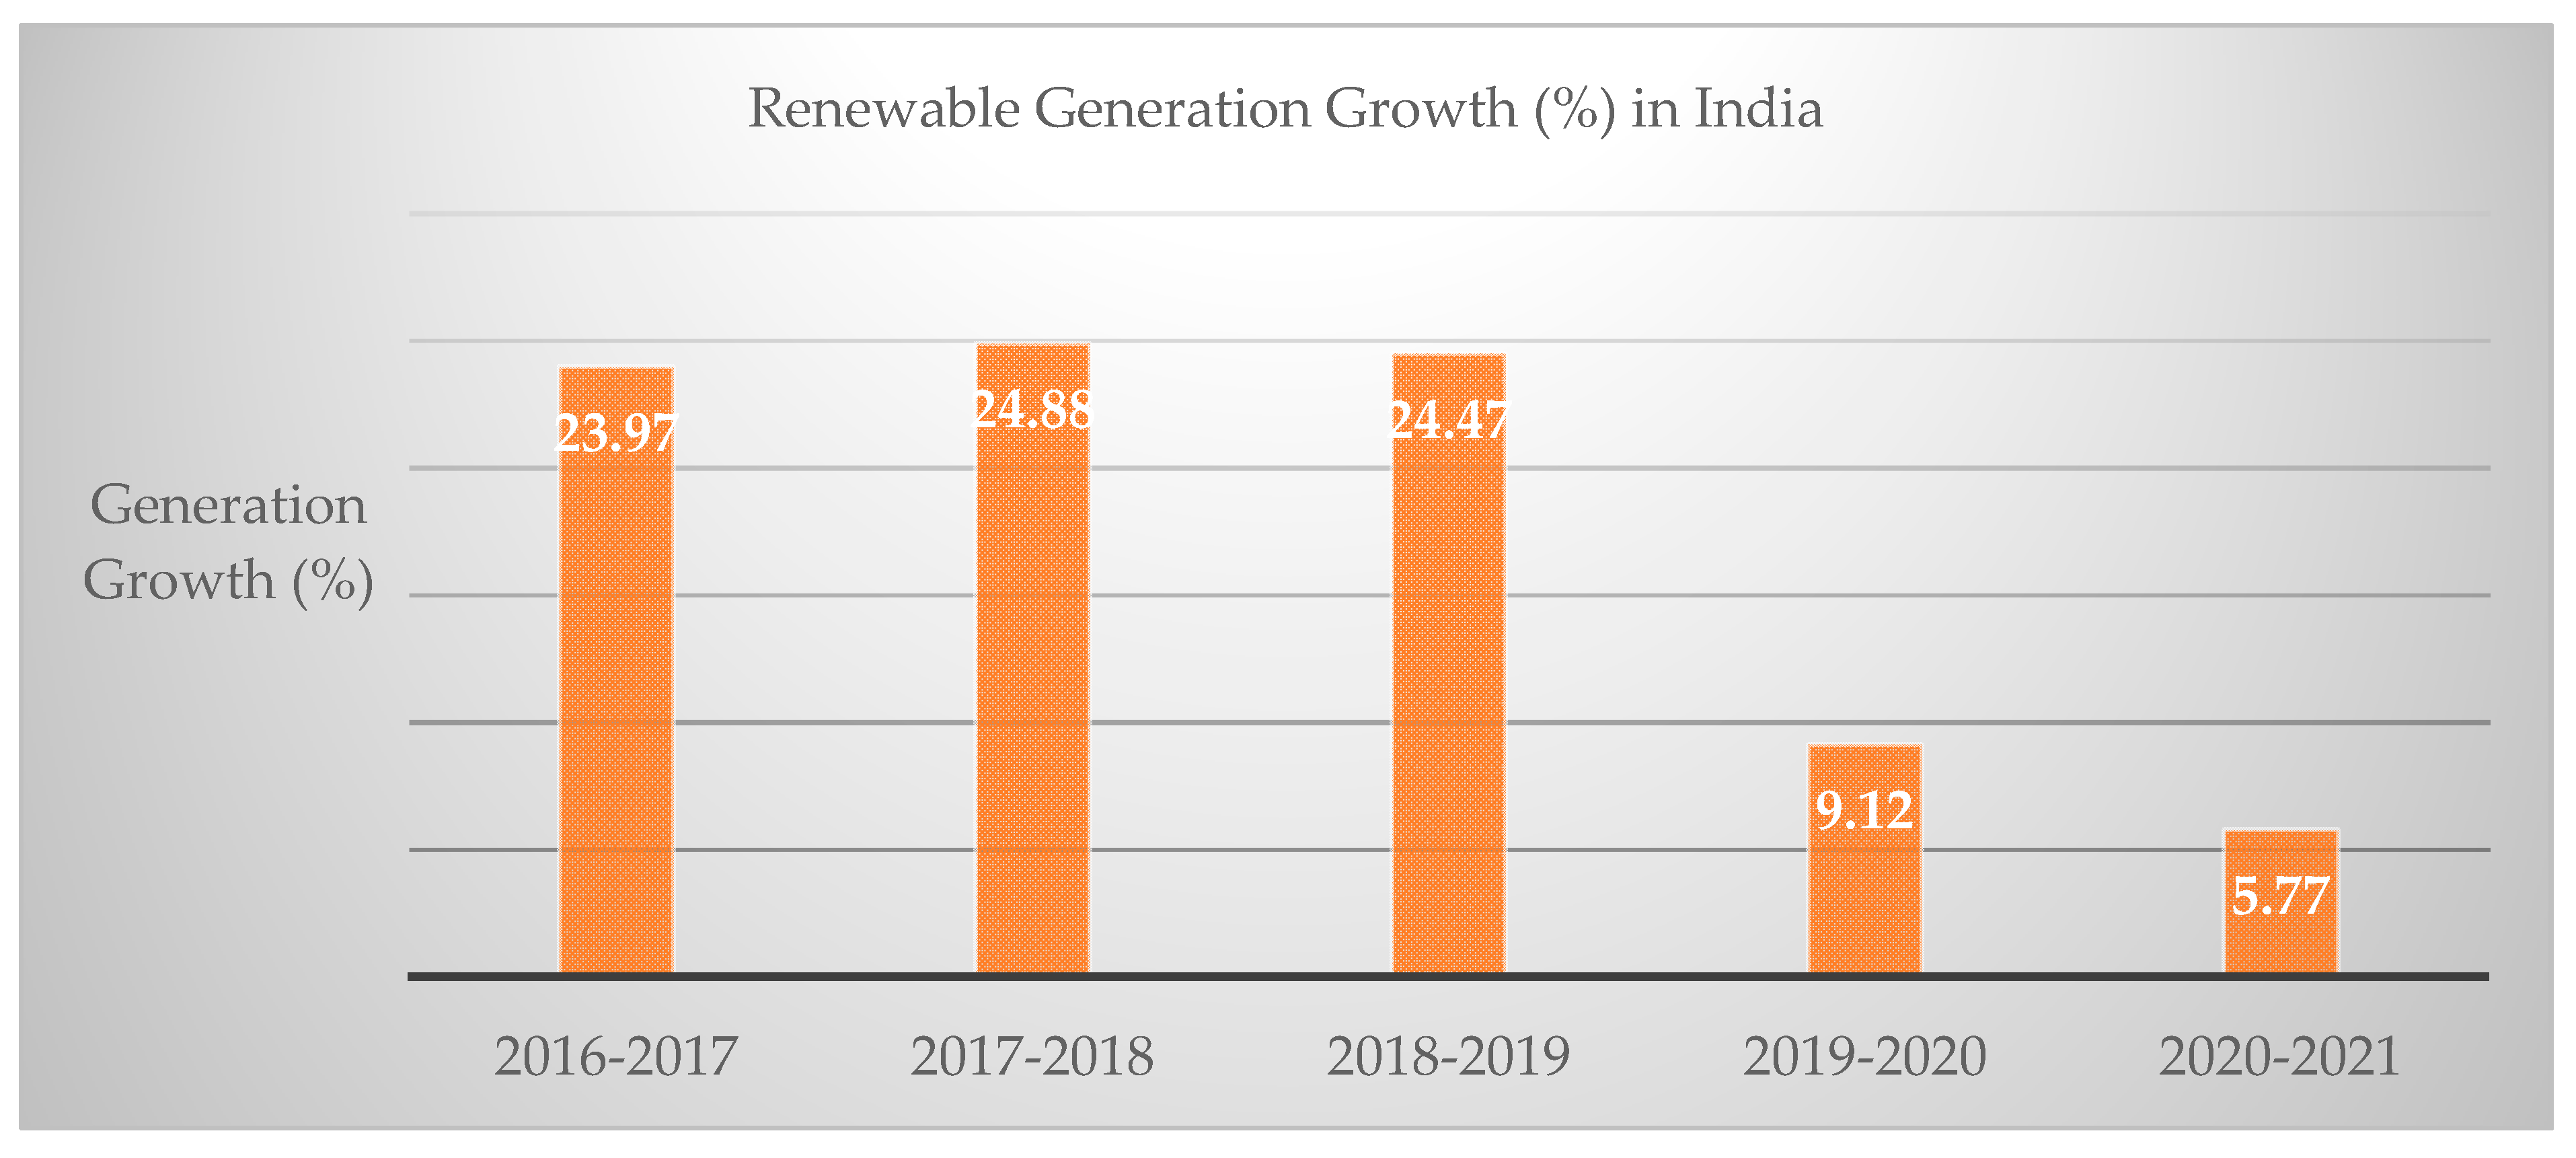
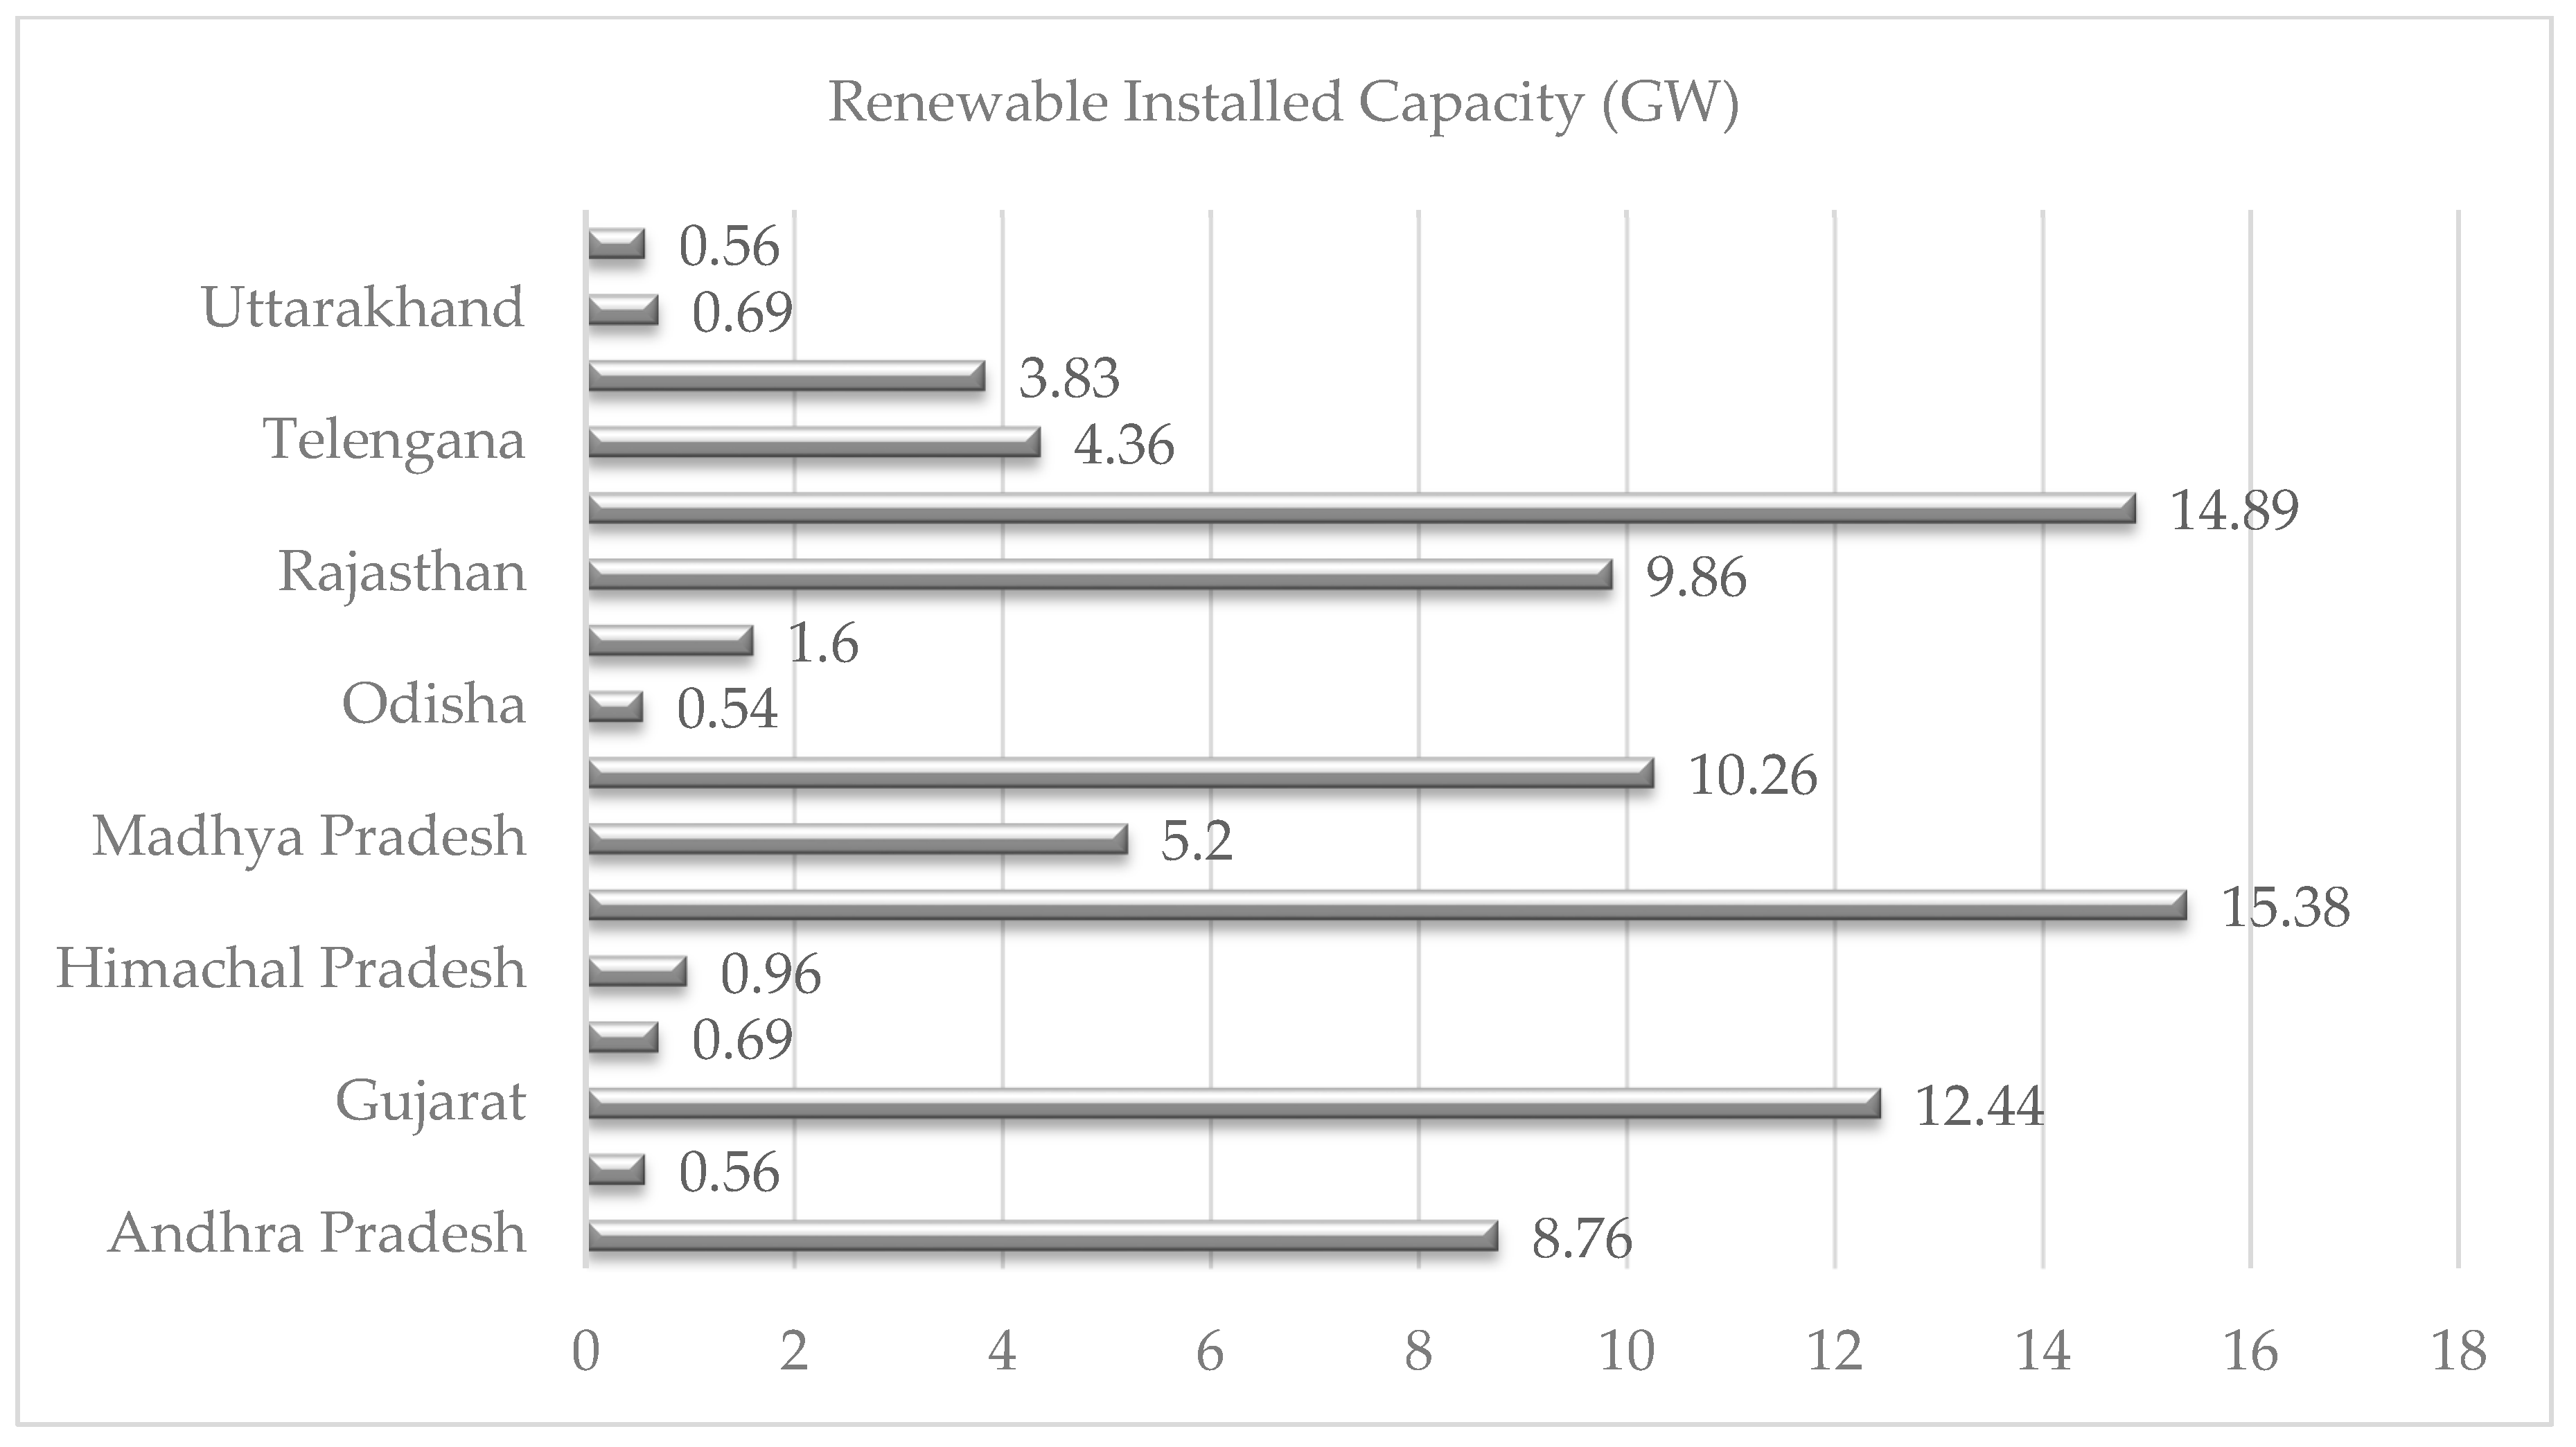
2.1. Renewable Energy Scenario
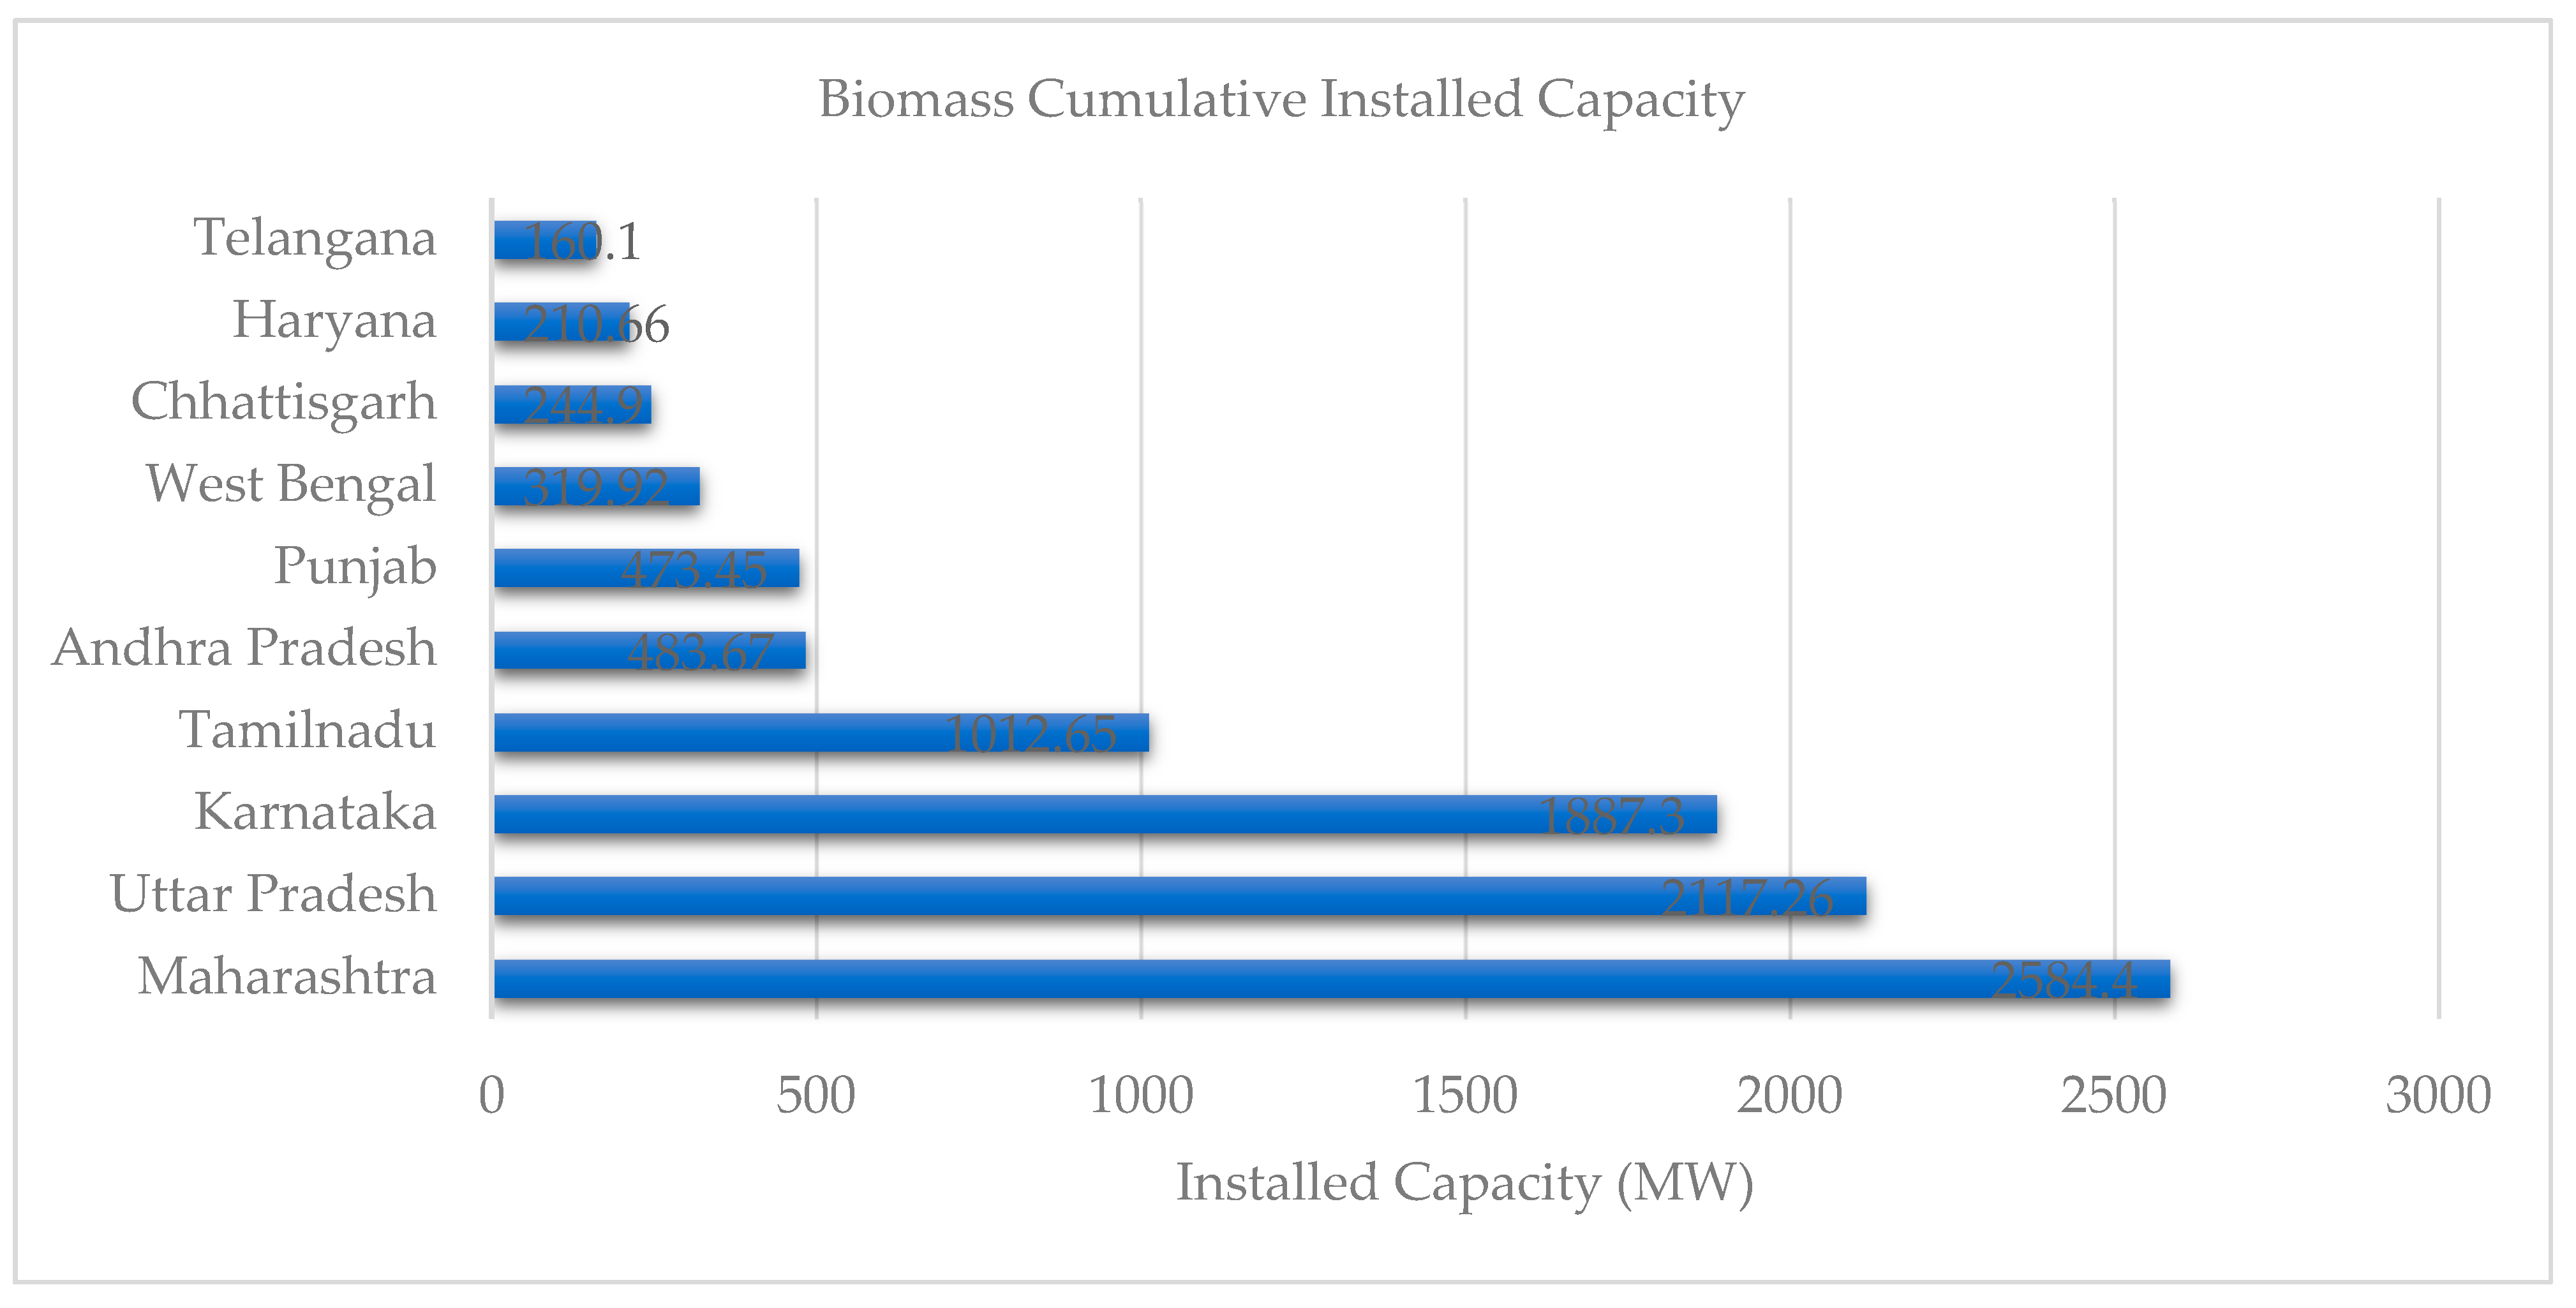
The Ministry of New and Renewable Energy (MNRE), Government of India, has extensively encouraged renewable energy generation, and the notable rise whenever required as per demand in renewable generation is presented in Figure 1. The total renewable installed capacity for all provinces/UTs of India is 105,854 MW, with the installed capacity of potential provinces shown in Figure 2. At the country level, the sectors that contribute to renewable installed capacity are stated are provinces (2.72%), private (95.3%) and central sectors (1.89%); the private sector players in different provinces/UTs are the leaders in cumulative renewable capacity. The grid connected renewable energy programs cumulatively are of 92,970.48 MW as of February 2021, having contributions of solar 42%, wind 41.7%, biomass 11%, hydro 5% and waste to power 0.18% [1,3].

2.2. Biomass Energy

Biomass has always been a significant energy source for India and has immense socio-economic benefits. It is renewable, carbon-neutral, available in a wide range, provides firm energy and the means to offer large employment in the rural sector. India, being an agricultural country, has 70% of the population involved in agricultural and allied activities, and depends on biomass for their necessities. Biomass power and cogeneration programmes in the country have been shaped to encourage biotechnologies and the most efficient use of biomass for grid-connected power generation. Biomass availability projections in the country are over 500 million metric tonnes per year. Rendering to MNRE data, additional biomass from agriculture and forestry leftovers is likely to be 120–150 million metric tonnes per year, equal to a capacity of roughly 18 GW. A total biomass power capacity of 10,145 MW has been established across the country to supply electricity to the power grid. Figure 3 shows the total installed biomass power generation capacity of the top ten biomass rich Indian provinces [3,11].

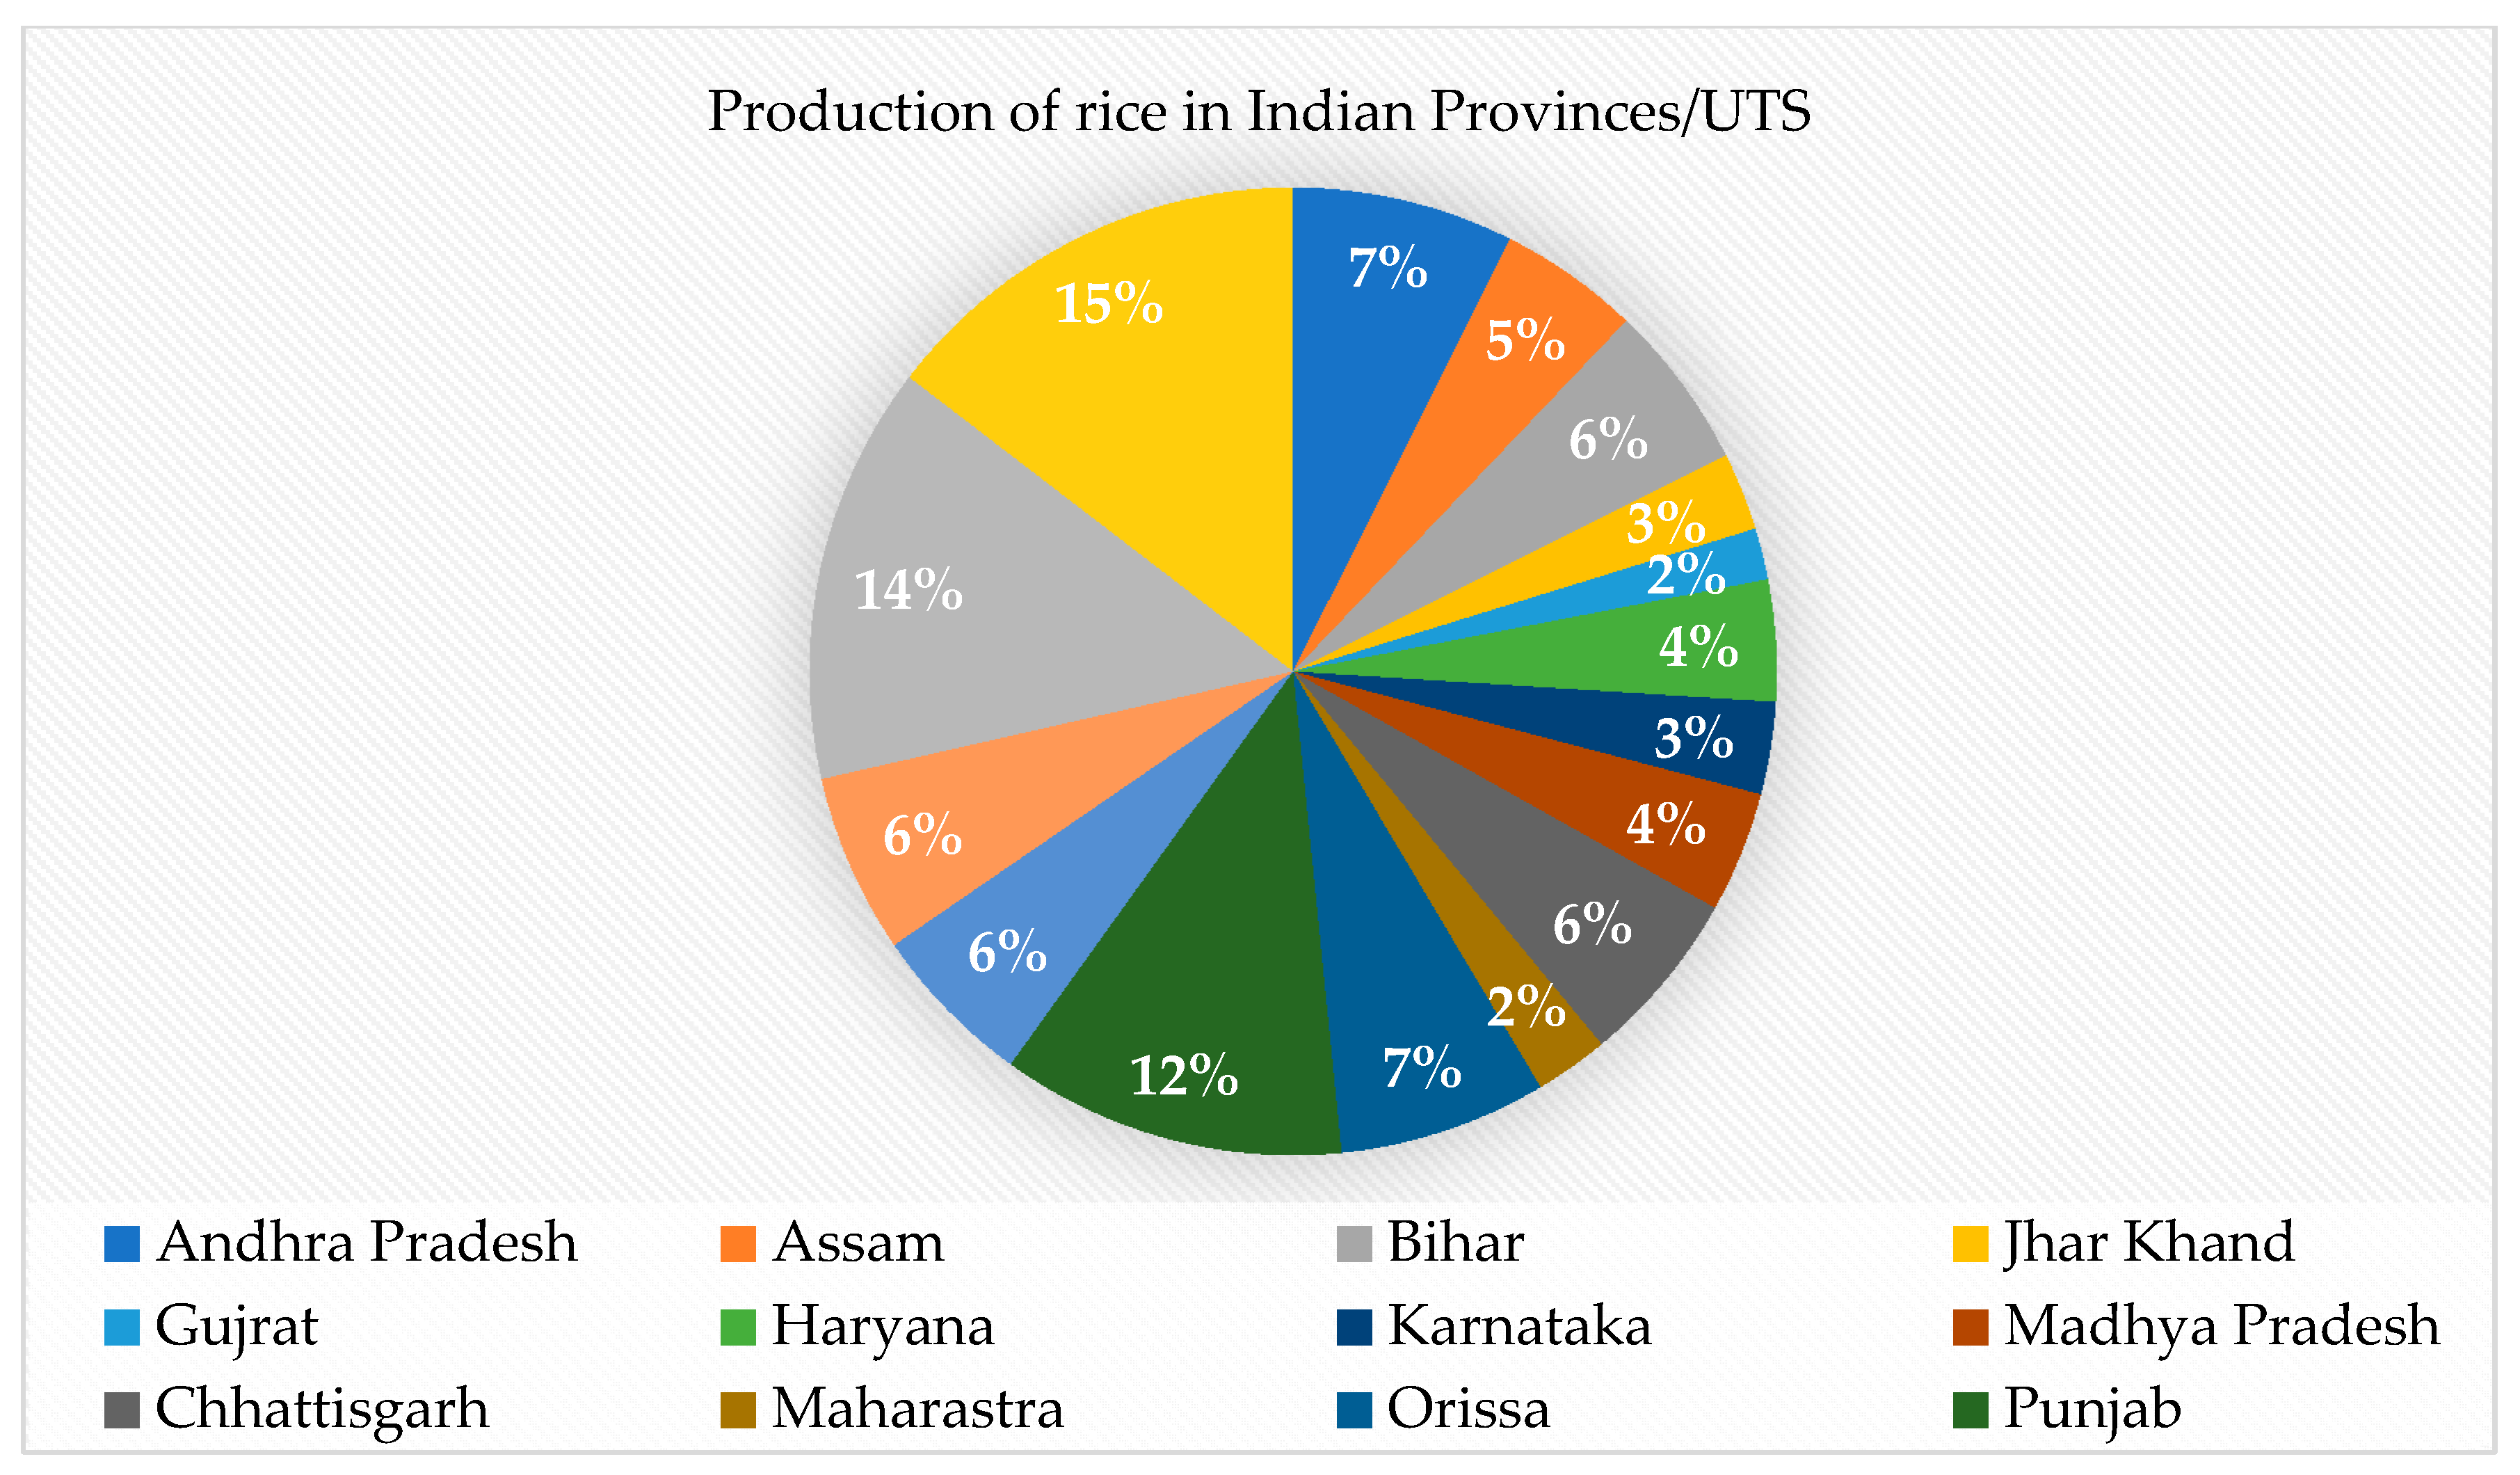
2.3. Agriculture and Allied Biomass Resources in India

2.3.1. Crop Residue

There is a large area of agricultural land in India, so there is a correspondingly huge amount of crop residues produced. These residues have the potential to be the biomass feed stock for use in energy generation applications. These agricultural residues are organic and are the by-products from harvesting and processing of crops. Primary residues are generated in the fields at the time of harvesting crops, and comprise rice straw, sugar cane tops etc. Secondary residues, co-produced by the processing of crops, include rice husk, bagasse etc, and are obtained in large quantity at the harvesting site and can be used as a captive energy source. Several authors have presented the cumulative crop residues in India. Jasvinder et al. (2010) presented the production from different crops and their respective available residues were: rice 464 MT, wheat 140 MT, maize 43 MT, bajra 22 MT, sugarcane 105 MT [6]. Anil et al. 2015 showed that renewable biomass feedstock available for power generation (in MT) were: rice 170, wheat 112, maize 27, jowar 24, bajra 16 and sugarcane 12 [7]. Hiloidhari et al. (2014) presented the crop residue production for rice, wheat, maize, jowar, bajra and sugarcane (in MT): 154, 131, 36, 18, 24 and 111 respectively [12]. Venkatramanan et al. (2021) presented equivalent values for rice 157 MT, wheat 149 MT, maize 43 MT, jowar 10 MT, bajra 5 MT, and sugarcane 119 MT [13]. Purohit (2021) presented a model for assessment of crop residue potential and presented data for year 2020–2021: rice 198 MT, wheat 173 MT, maize 62 MT, jowar 12 MT, bajra 23 MT and sugarcane 163 MT [14].
The report of the Statistical Abstract for the Indian Province Punjab 2020 published by the Department of Planning, Government of Punjab India, presented the statistics for India for the production and yield of significant crops. The total area under principal crops in India was 94,305.32 thousand hectares. The individual areas (in thousand hectares) cropped in kharif were: rice 44,156, jowar 4093, bajra 7105, maize 9027; and in Rabi were, wheat 29,319 and barley 606. The corresponding total yield in India from these crops was 315,472 thousand hectares. The significant yields in kgs/hectare were as follows: rice 85,168, jowar 20,293, bajra 26,943, maize 83,201, wheat 70,029, and barley 29,838 [15].
The leading provinces for the production of rice were Andhra Pradesh, West Bengal, Uttar Pradesh and Punjab, and for wheat, Uttar Pradesh, Punjab, Madhya Pradesh, Haryana and Rajasthan. The potential production of rice in the leading provinces is projected in Figure 4 with the leader West Bengal 15%, followed by Uttar Pradesh 14% and Punjab 12%. Similarly, the production of jowar was high in Uttar Pradesh 32% and Punjab 18%, but occurs in others (Jharkhand, Himachal Pradesh, Jammu and Kashmir, Karnataka, Chhattisgarh, West Bengal, Uttarakhand) and was minimal elsewhere (Arunachal, Assam, Manipur, Meghalaya, Telangana, Nagaland, Delhi) (Figure 5). For bajra, the highest was Punjab 44% followed by Uttar Pradesh 21%, with others producing less (Andhra Pradesh, Bihar, Jammu & Kashmir, Nagaland, Orissa, Punjab, Telangana, Delhi, Daman & Diu) (Figure 6). The wheat production country leaders were Uttar Pradesh 32%, Punjab 18%, and Madhya Pradesh 16%, but other producers included Jharkhand, Himachal Pradesh, Jammu and Kashmir, Uttarakhand, West Bengal, with minimal production in others (Arunachal, Assam, Meghalaya, Karnataka, Chhattisgarh, Manipur, Nagaland, Telangana and Daman and Diu (Figure 7). Maize production in most of provinces was of low order, but the leaders were Madhya Pradesh 15% and Karnataka 14%, but it was important in others (Assam, Jharkhand, Chhattisgarh, Nagaland, Orissa and Punjab) and was minimal in some (Arunachal Pradesh, Haryana, Manipur, Meghalaya, Mizoram, Sikkim, Tripura and Uttarakhand) (Figure 8). The others in the figures have been used for the sum of production from the minimal potential provinces. The estimation of residue potential for many applications and further surplus for other bio-generation application was the motive behind this study and the modelling for the estimations are presented in Section 3.

2.3.2. Animal Dung

Domesticated or diary animals’ dung is a biowaste, which is comprised of more excreta and less urine, whose potential has still to be realised for its use as an important, renewable, and sustainable bio-fertilizer, biogas, and dung cakes [16]. In rural areas, the biogas-based energy generation from these biowastes is more common, as the biggest constraint there is the non-availability of conventional fuel [17]. Rao et al. [18] have identified and estimated the biogas generation potential in India as a renewable energy option by including all possible biomass sources i.e., municipal solid waste, agriculture waste, wastewater, animal manure, and industrial waste. Surendra et al. [19] studied biogas as a sustainable energy source from biomass resources. Kaur et al. [8] evaluated and estimated the potential of livestock biomass for biogas and further power generation in the provinces of India for 2012. Mittal et al. [20,21] reviewed the barrier to biomass technologies in India and in another paper made a bottom-up analysis of biogas potential in India up until 2040, considering all biomass resources. Estimation of this untapped bio energy source as a fuel for biogas generation and the corresponding electricity generation is the real objective to strengthen the cumulative potential of biofuels in India.

2.4. Indian Province Punjab

2.4.1. Profile of Punjab Province

The Indian province Punjab is popularly known as the food basket of India. Punjab, with its capital at Chandigarh, shares borders with other Indian provinces like Rajasthan, Haryana, Himachal Pradesh, the union territory of Jammu and Kashmir. The western side of the province shares a long stretch of about 300 km of international border with Pakistan. The geographical area of the province is 50,362 square kilometres, which is 1.53% of India’s total geographical area, and it is located between 73°53′ to 76°56′ E longitude and 29°33′ to 32°32′ N latitude [22]. The climate of Punjab is both hot and cold and normally bears hot and humid temperatures up to 48–50 °C in the summer and chilling temperature of 0 °C in the winter. The average annual rainfall varies from 480 to 960 mm. Rainfall is high in hilly and sub mountainous areas located in the northeastern parts of the state and is low in the southwestern sandy areas of the state. Punjab is a highly agricultural province and 83% of the geographical area is under use of agriculture, with only 6.12% under forestry. Of the agricultural area, 98% is cultivated and irrigated using ground water or canal water. The cropping intensity of the state is 189%, which is one of the highest in the country. Administratively, the Punjab province has been divided into five divisions, 22 districts, 91 tehsils, 150 blocks, 74 towns and cities and 12,581 villages. As of 2011, the census provincial population was 27.74 million, having a density of 484 people per square kilometre with 75.8% rate of literacy [22,23].

2.4.2. Agriculture Scenario in Punjab

Punjab province is the leader in grain production, being the largest contributor of grain to the central grain-pool of India. Punjab has two main agricultural seasons, “Kharif” or the summer-cropping season, and “Rabi” or the winter-cropping one. The chief crops produced during the kharif season are rice, maize, bajra, sugarcane, and moong. On the other hand, the major crops of the rabi season are wheat, mustard, sunflower, and cotton. A remarkable production of food grains in the province has been witnessed in the last few decades. The report of the Statistical Abstract of Punjab 2020 published by the Department of Planning, Government of Punjab India, presents the statistics for Punjab based on data for the year 2018–2019, and shows that the principal crops are rice 3103 thousand hectares and wheat 3530 thousand hectares. The yield of these crops is rice 4132 kg/hectare and wheat 5788 kg/hectare [15,24,25]. These data show that only Punjab has enough potential crop residue to be a rich source of biofuels. In the Punjab area, 11 biomass power projects with a combined capacity of 97.50 MW have been commissioned and are in service, consuming 8.8 million metric tonnes of paddy straw each year as shown in Figure 9. An initiative of the MNRE, Government of India, is planning for 100 MW of standalone biomass power projects and 25 MW of biomass solar hybrid power projects with a CFA of Rs. 3.00 crore per MW [26].

3. Materials and Methods

Estimation of the Potential Crop Residue, Surplus, and Bioenergy

The by-product of crop production is crop residue, and the gross crop residue potential or estimation is the actual residue available before any use or application. The surplus crop residue potential is the residue potential left over after usage of gross residue for various applications and is then treated as crop residue waste. The estimation of bioenergy from surplus crop residue projects the potential of this source for bio power generation. The model designed by Hiloidhari et al. (2014) [12] is adopted for estimation of the potential in various provinces of India.
Gross crop residue potential of a selected crop depends on area under crop, crop yield and RPR of crop, and the further estimation of gross residue potential is presented in Equation (1)
C R g ( j ) = i = 1 n A ( i ,   j ) × Y ( i ,   j ) × R P R ( i . j )
where, C R g ( j ) denotes Gross Crop Biomass Residue Potential at jth State from n , Number of Crops, tonne; A ( i ,   j ) denotes Area under ith Crop at jth State, ha; Y ( i ,   j ) Yield of ith Crop at jth State, tonne ha−1 and R P R ( i ,   j ) denotes Biomass Residue Production ratio of ith Crop at jth State.
The surplus crop residue potential depends on the gross residue potential and the surplus residue fraction, which vary from crop to crop and are presented in Equation (2).
C R s ( j ) = i = 1 n C R g ( i , j ) × S F ( i . j )
where, C R s ( j ) denotes the Surplus Biomass Residue Potential at jth State from n , Number of Crops, tonne; C R g ( i , j ) denotes Gross Crop Biomass Residue Potential at jth State, tonne and S F ( i . j ) is Surplus Biomass Residue Fraction of ith Crop at jth State. The bioenergy potential from the surplus crop residue is presented in Equation (3)
E ( j ) = i = 1 n C R s ( i . j ) × H H V ( i . j )
where, E ( j )   denotes the Biomass Bioenergy Potential of n Crops at jth State, MJ; C R s ( i . j ) denotes the Surplus Biomass Residue Potential of ith Crop at jth State, tonne and H H V ( i . j ) denotes the High Heating Value of ith Crop at jth State, MJ tonne−1.
For this study, the values of the residue to product ratio (RPR) are taken as follows: rice 1.7, wheat 1.8, maize 2.3, bajra 2.6, barley 1.3, jowar 2.4, sugarcane 0.38, and cotton 6. The values for the surplus residue fraction for crops are taken as per reference [12]. The HHV for this study as per crop in MJ/kg are as follows: rice 15.54, wheat 17.27, maize 17.03, bajra 17.67, barley 18.16, jowar 17.67, sugarcane 20, and cotton 17.47.

4. Results

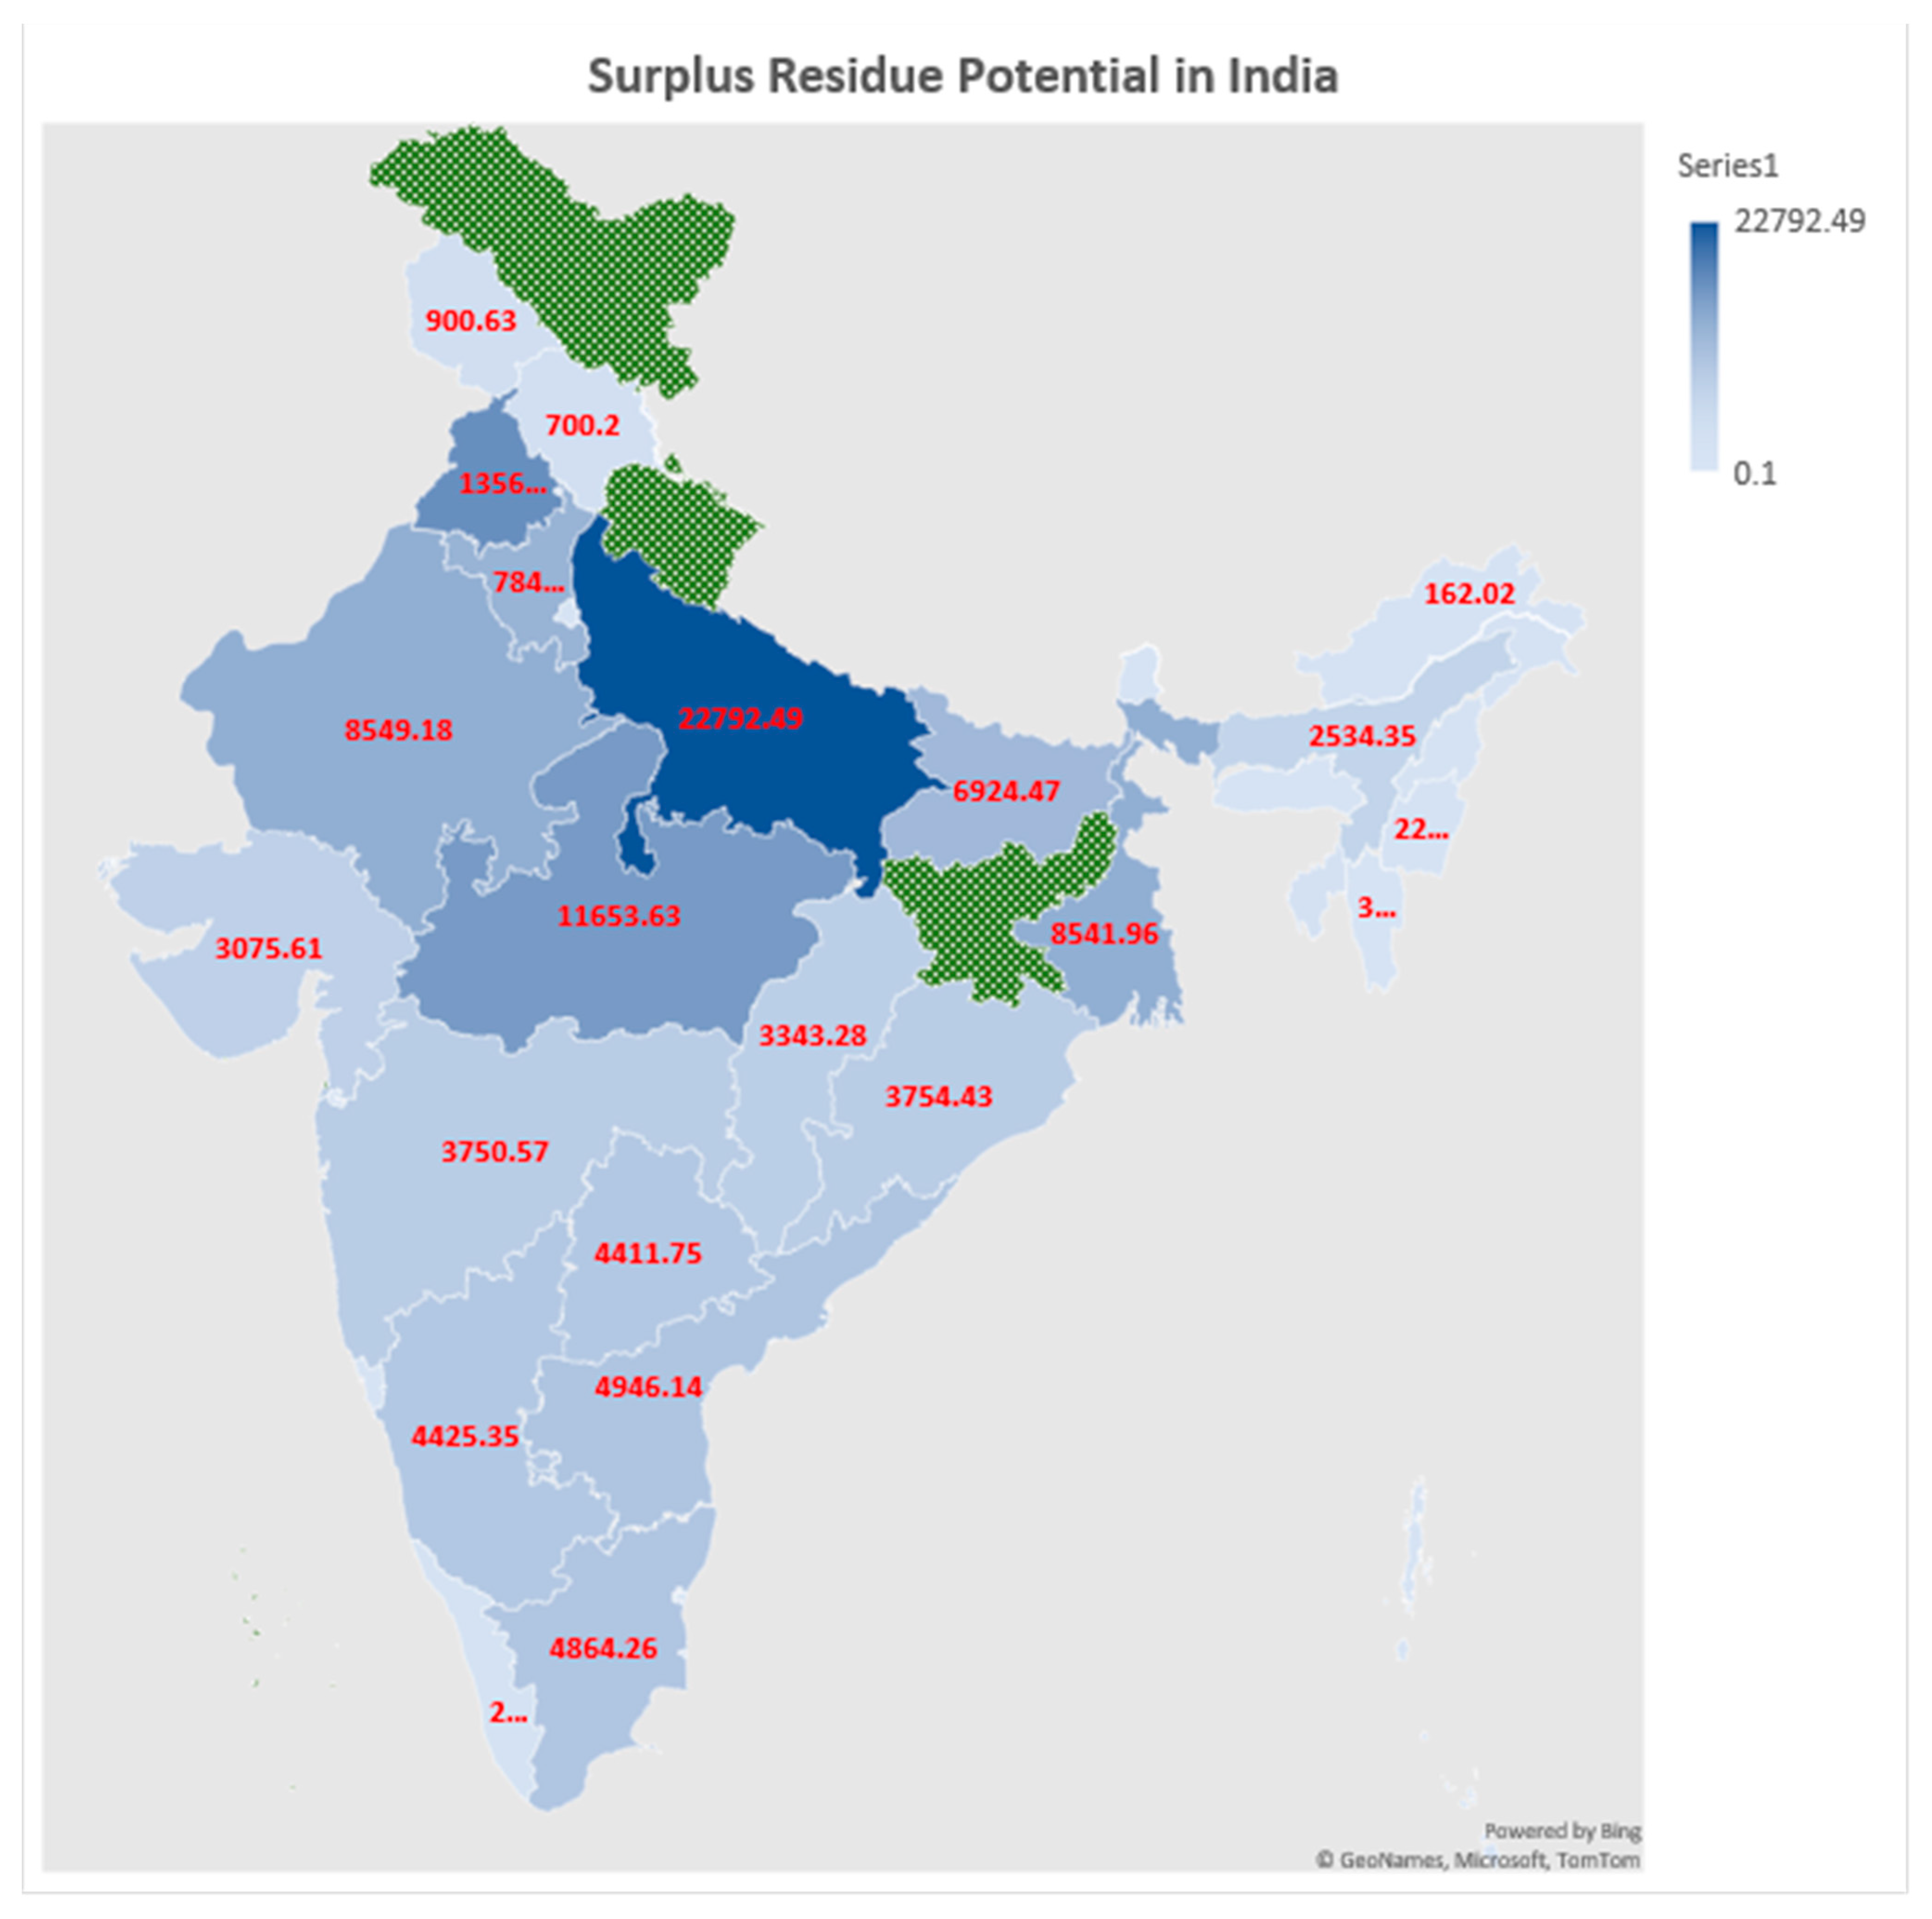
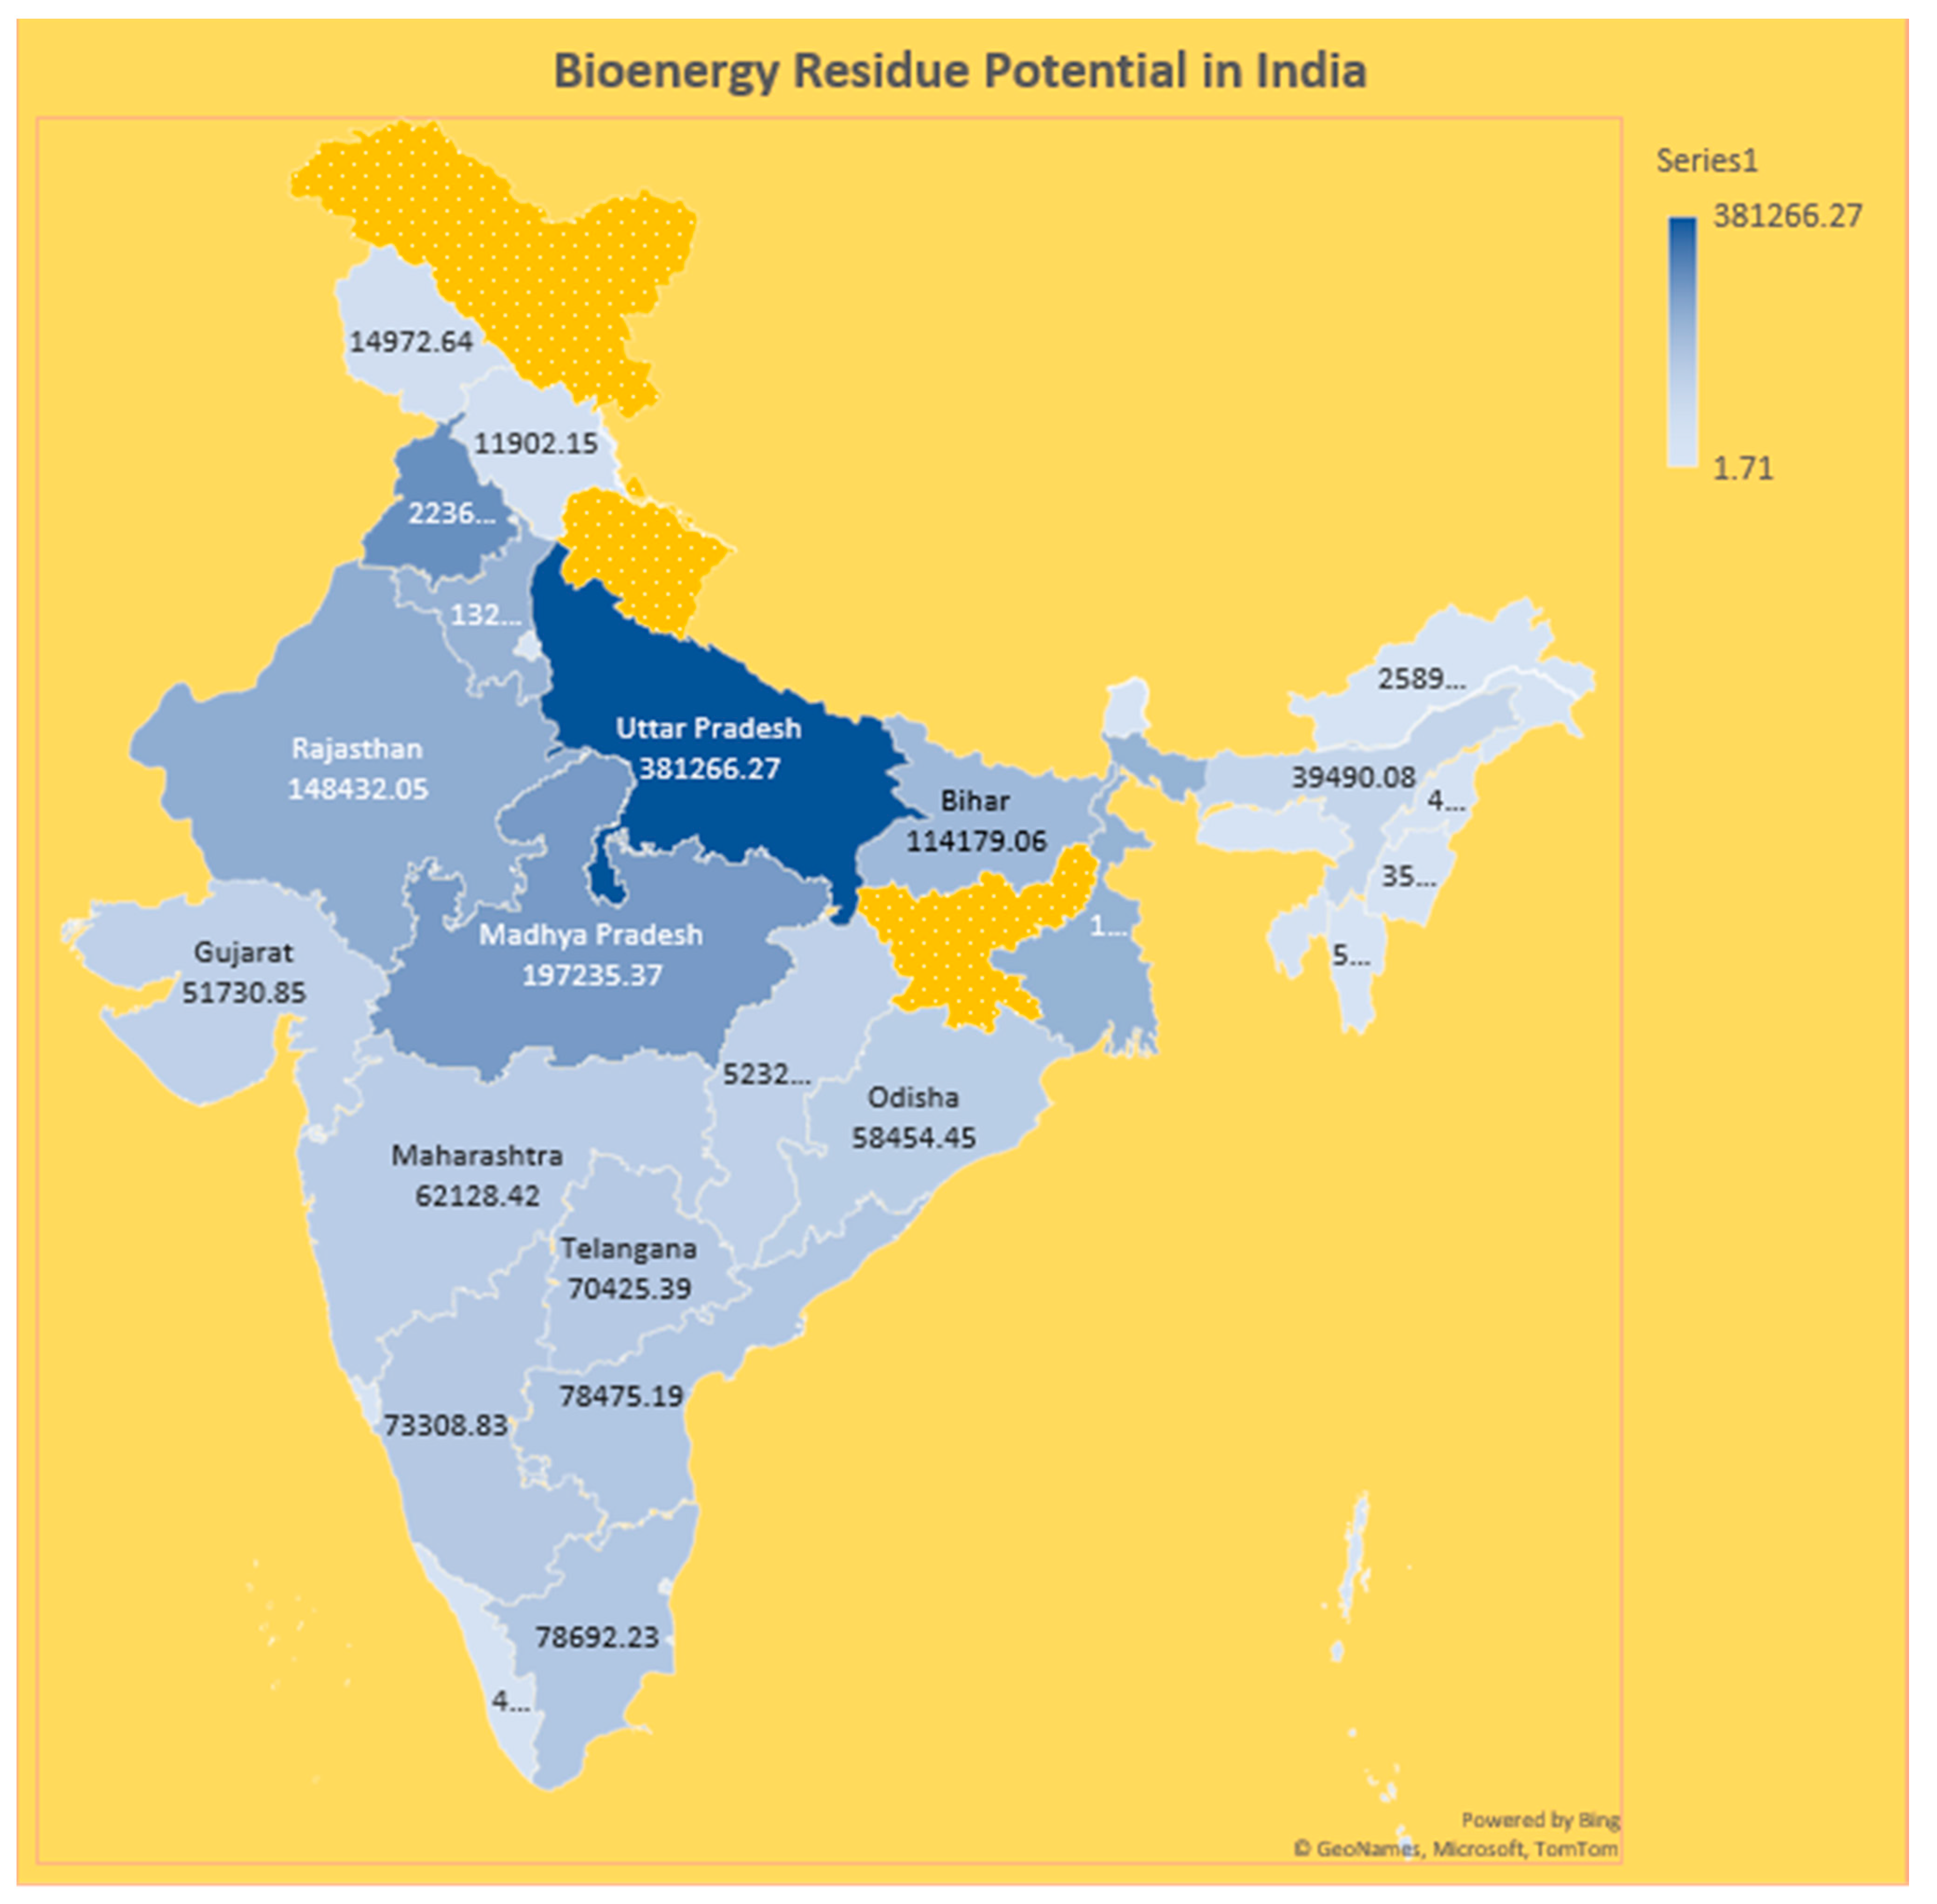
4.1. Gross and Surplus Residue Potential for Crop Based Bioenergy Potential

Table 1 presents for the three leading rice production provinces the values for gross residue potential (M-kg), surplus residue potential (M-kg) and bioenergy potential (TJ), respectively: West Bengal (27,420.77, 7677.82, 119,313.28), Uttar Pradesh (26,422.41, 7398.27, 114,969.17) and Punjab (21,796.71, 6103.08, 94,841.86). Table 2 presents for the three leading wheat producing provinces the values of gross residue potential (M-kg), surplus residue potential (M-kg) and bioenergy potential (TJ), respectively: Uttar Pradesh (58,934.30, 12,965.55, 223,914.99), Punjab (32,871.17, 7231.66, 124,890.71) and Madhya Pradesh (29,738.45, 6542.46, 112,988.26).
Table 3 presents for the three leading provinces for jowar production the values of gross residue potential (M-kg), surplus residue potential (M-kg) and bioenergy potential (TJ), respectively: Karnataka (2139.40, 427.88, 7560.66), Maharashtra (2094.97, 418.99, 7403.64) and Rajasthan (1126.97, 225.39, 3982.73). Table 4 presents for the three leading provinces for bajra production, the values of gross residue potential (M-kg), surplus residue potential (M-kg) and bioenergy potential (TJ), respectively: Rajasthan (10,015.47, 3004.64, 53,091.99), Uttar Pradesh (4679.91, 1403.97, 24,808.20) and Gujarat (2348.07, 704.42, 12,447.12).
Table 5 presents for the three leading provinces for maize production, the values of gross residue potential (M-kg), surplus residue potential (M-kg) and bioenergy potential (TJ), respectively: Madhya Pradesh (9502.88, 2375.72, 40,458.51), Karnataka (8641.78, 2160.45, 36,792.40) and Tamil Nadu (6518.77, 1629.69, 27,753.67).
Table 6 presents the three leading provinces for barley production, the values gross residue potential (M-kg), surplus residue potential (M-kg) and bioenergy potential (TJ), respectively: Rajasthan (1196.15, 119.61, 2172.20), Uttar Pradesh (592.04, 59.20, 1075.15) and Madhya Pradesh (213.75, 21.37, 388.17).

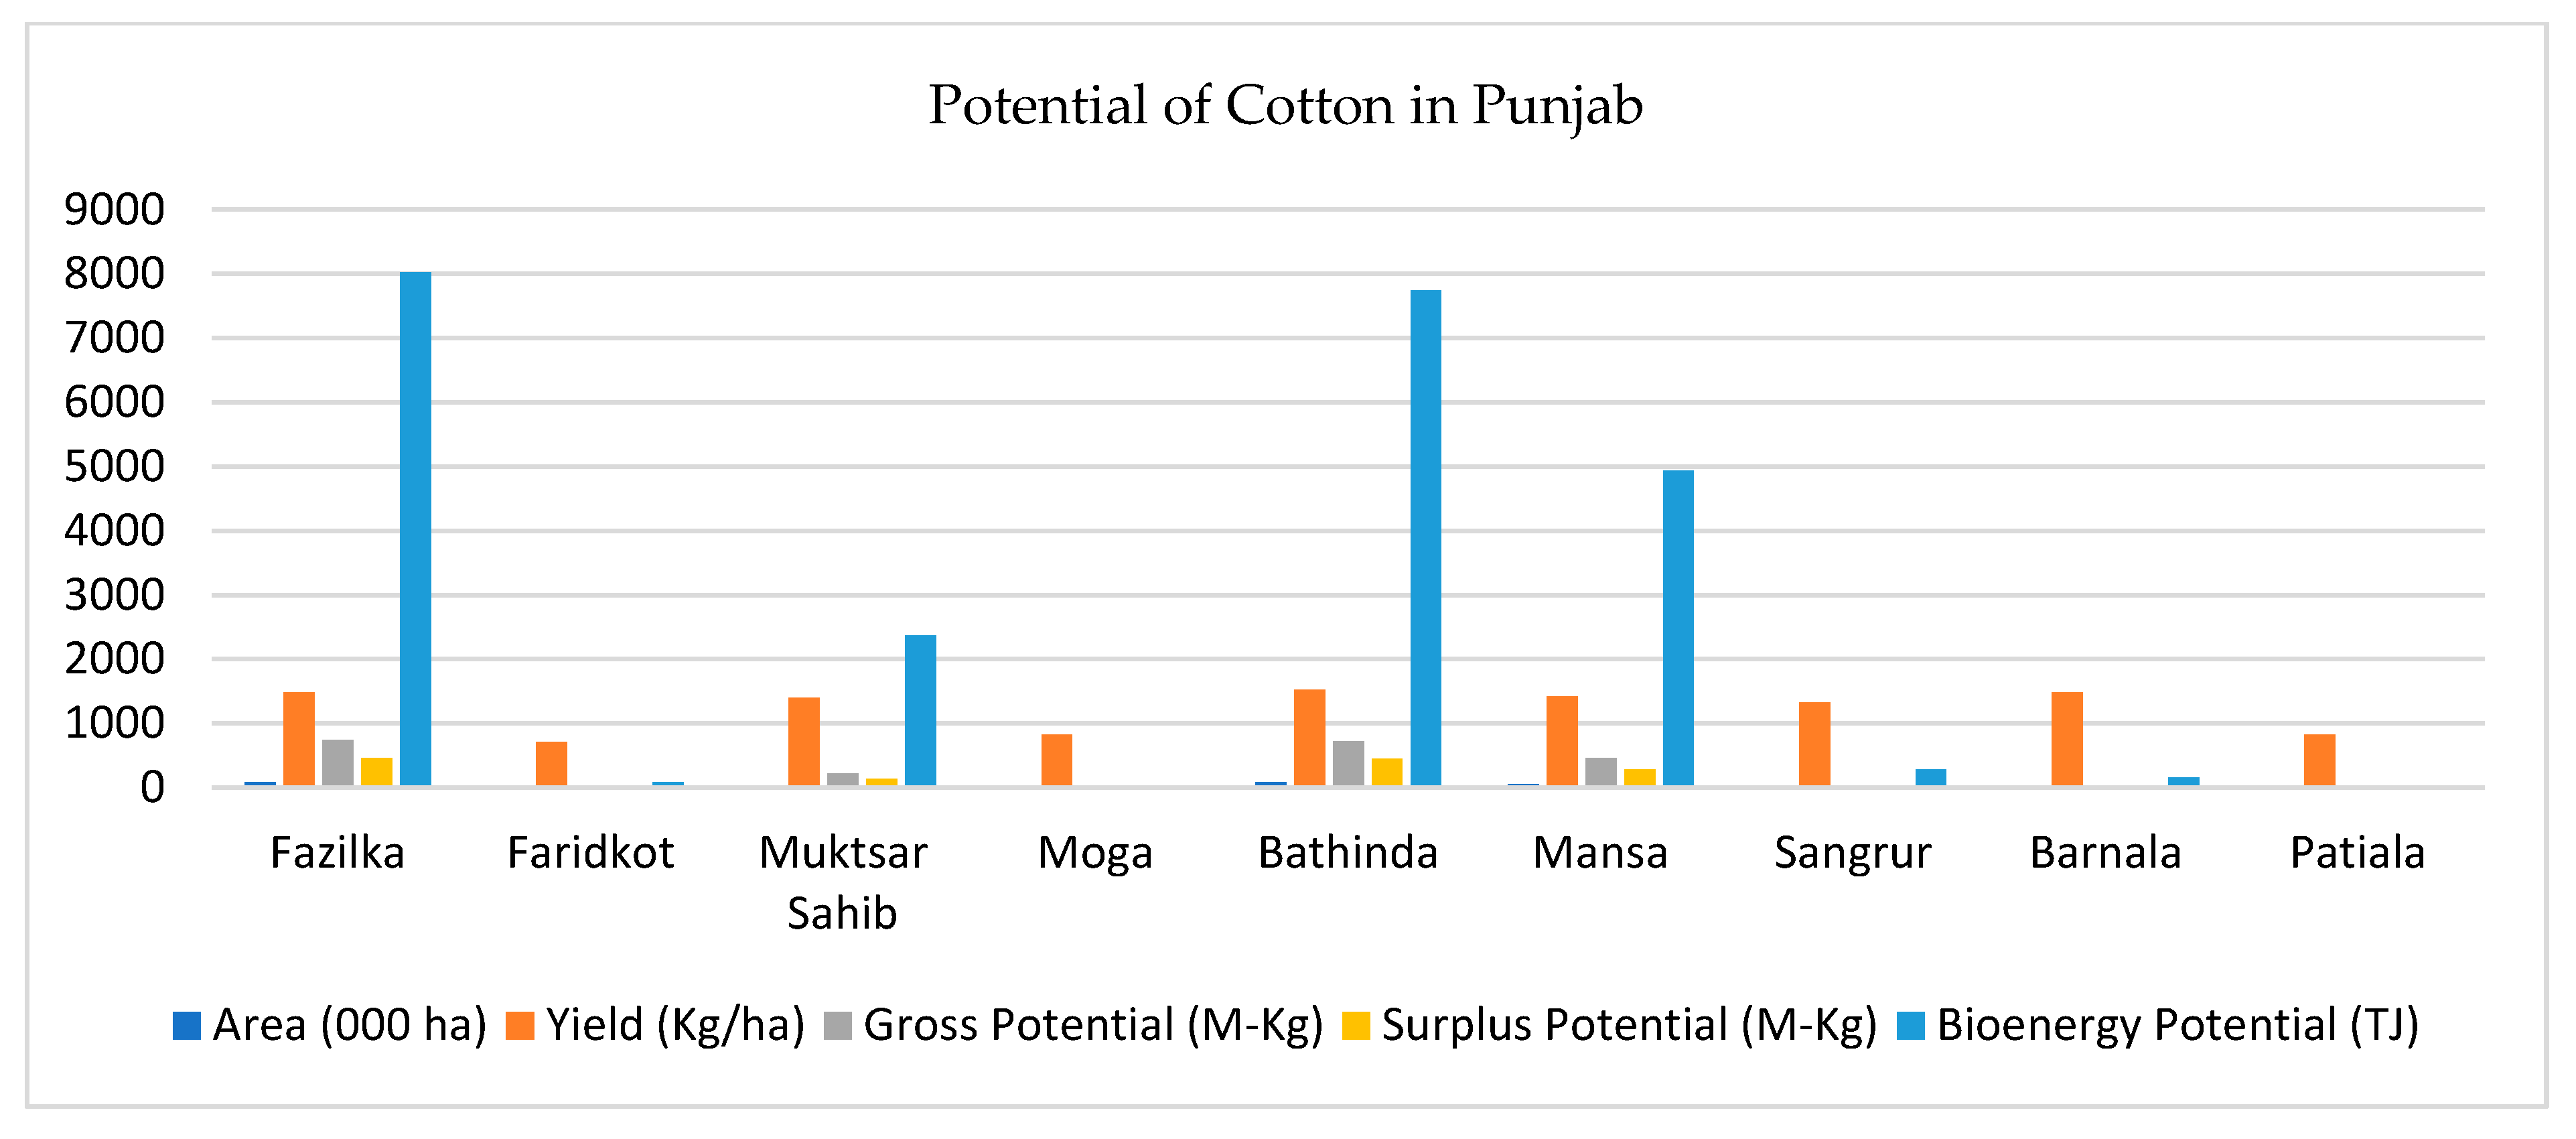
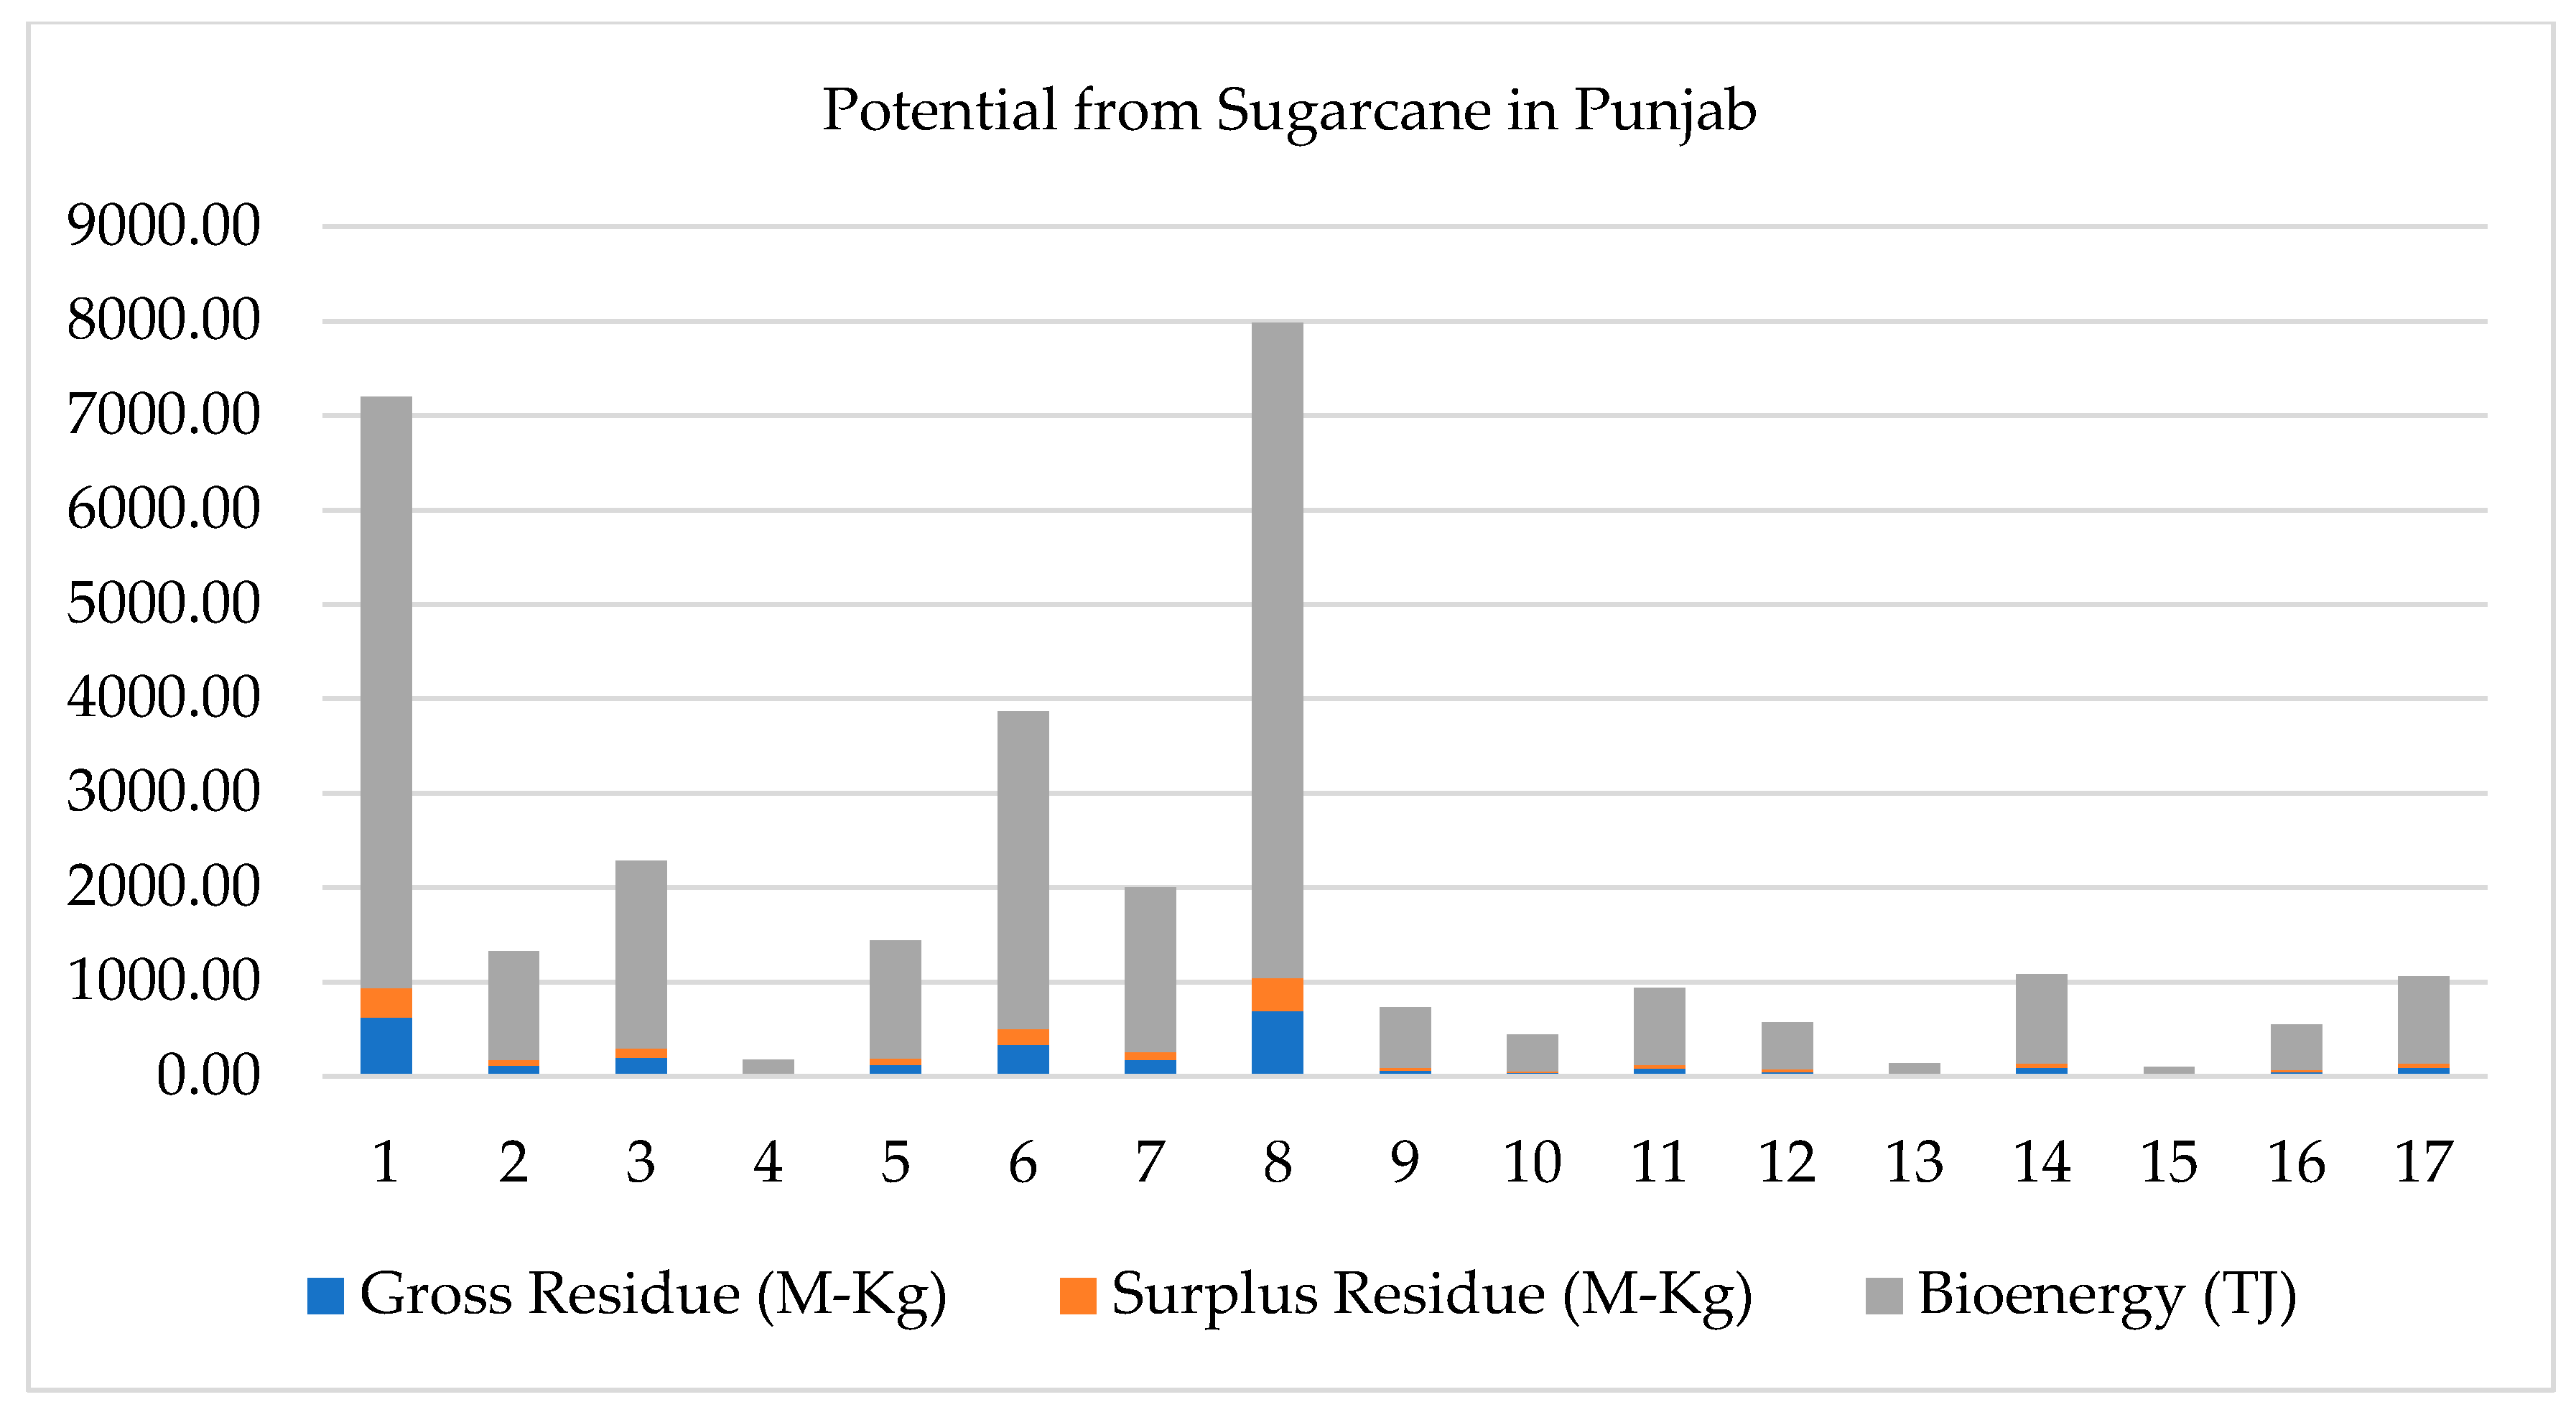
4.2. Indian Province Punjab-Estimation of Resources

The most significant crops in Punjab are rice and wheat, followed by maize, bajra, barley, sugarcane, cotton, and potato, and there is no jowar production. The less important crops are gram, mash, arhar, moong, massar, groundnut, rapeseed and mustard, sunflower and sesamum. The areas under the chief crops (in thousand hectares) are: rice 3143 and wheat 3521, correspondingly to a yield (Kg/hectare) of rice 86,487 and 107,618. Table 7 presents the potentials of the first leading crop, wheat, in Punjab and it is evident that the leading districts for crop residue (in M-Kg), surplus residue (in M-Kg) and estimated bioenergy potential (in TJ) are, respectively: Sangrur (3020.75, 664.57, 11,477.06), Bathinda (2496.61, 549.26, 9485.64), Ludhiana (2294.10, 504.70, 8716.20). Table 8 presents the potentials of the second leading crop, rice, in Punjab, and it is apparent that the leading districts for crop residue (in M-Kg), surplus residue (in M-Kg) and estimated bioenergy potential (in TJ) are, respectively: Sangrur (2314.51, 648.06, 10,070.91), Ludhiana (2058.84, 576.48, 8958.44), Patiala (1577.63, 441.74, 6864.56). Table 9 presents the potentials for crop barley, which is grown in only 12 districts, and the leading district for barley residue, surplus and bioenergy is Sangrur with 7.77 M-Kg, 0.93 M-Kg, and 16.94 TJ, respectively. Similarly, maize crop production is minimal in most of districts, but the leading district is S.B.S Nagar, with a gross crop residue of 773.40 M-Kg, surplus residue 193.35 M-Kg, and a bioenergy potential of 3292.73 TJ. Figure 10 shows that in Punjab, the total area cropped is 248,300 hectares, the yield is 10,981 kg/hectare, the gross residue is 2179.21 M-Kg, the surplus residue is 1351.11 M-Kg and the bioenergy is 23,603.9 TJ. The highest achievements for potential are in the district of Fazilka, with a gross residue of 740.98 M-Kg, a surplus residue of 459.41 M-Kg and bioenergy of 8025.84 TJ, and in Bathinda with 715.04 M-Kg, 443.32 M-Kg and 7744.84 TJ, respectively. Figure 11 shows that many districts crop sugarcane, which has a total area of 91,000 hectares, a yield of 1,386,884 kg/hectare, a gross residue of 2774.83 M-Kg, a surplus residue 1387.42 M-Kg and bioenergy of 27,748.32 TJ. The highest potential is from Hoshiarpur, with a gross residue of 694.27 M-Kg, a surplus residue 347.13 M-Kg, and bioenergy of 6942.68 TJ.
Figure 12, Figure 13 and Figure 14 presents the total gross crop residue, surplus residue, and bioenergy potential in all Indian provinces/UTS.

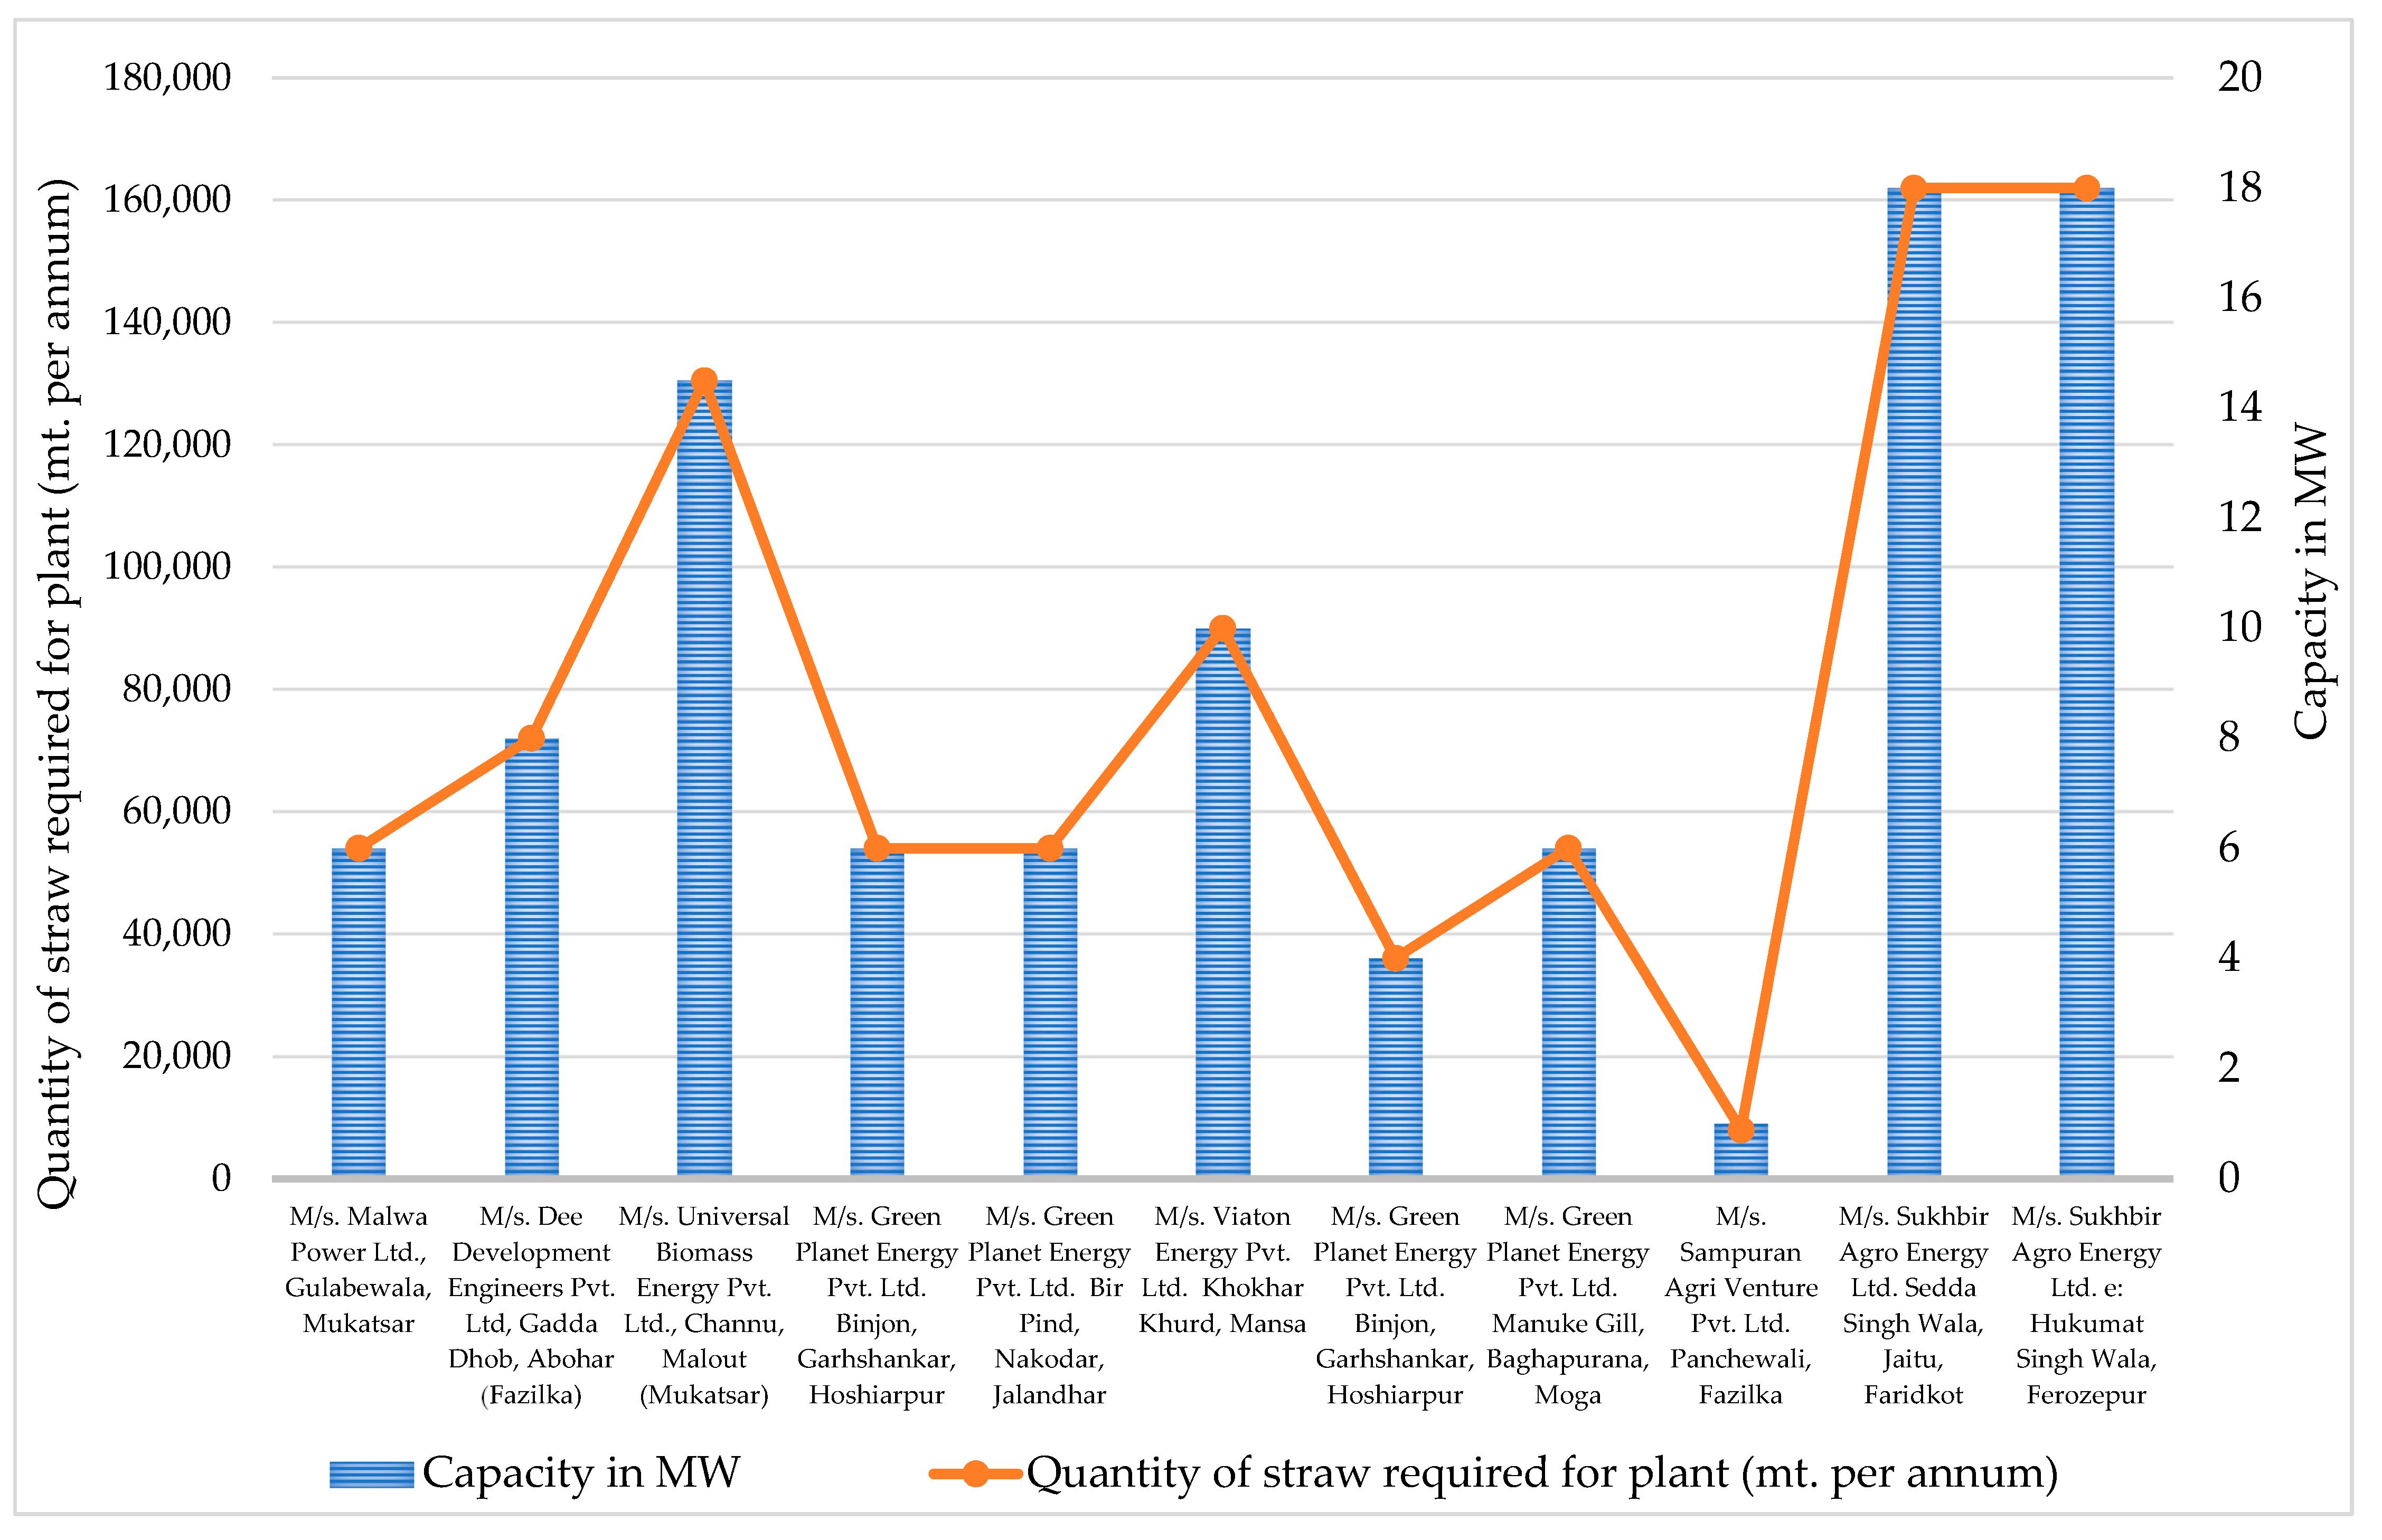
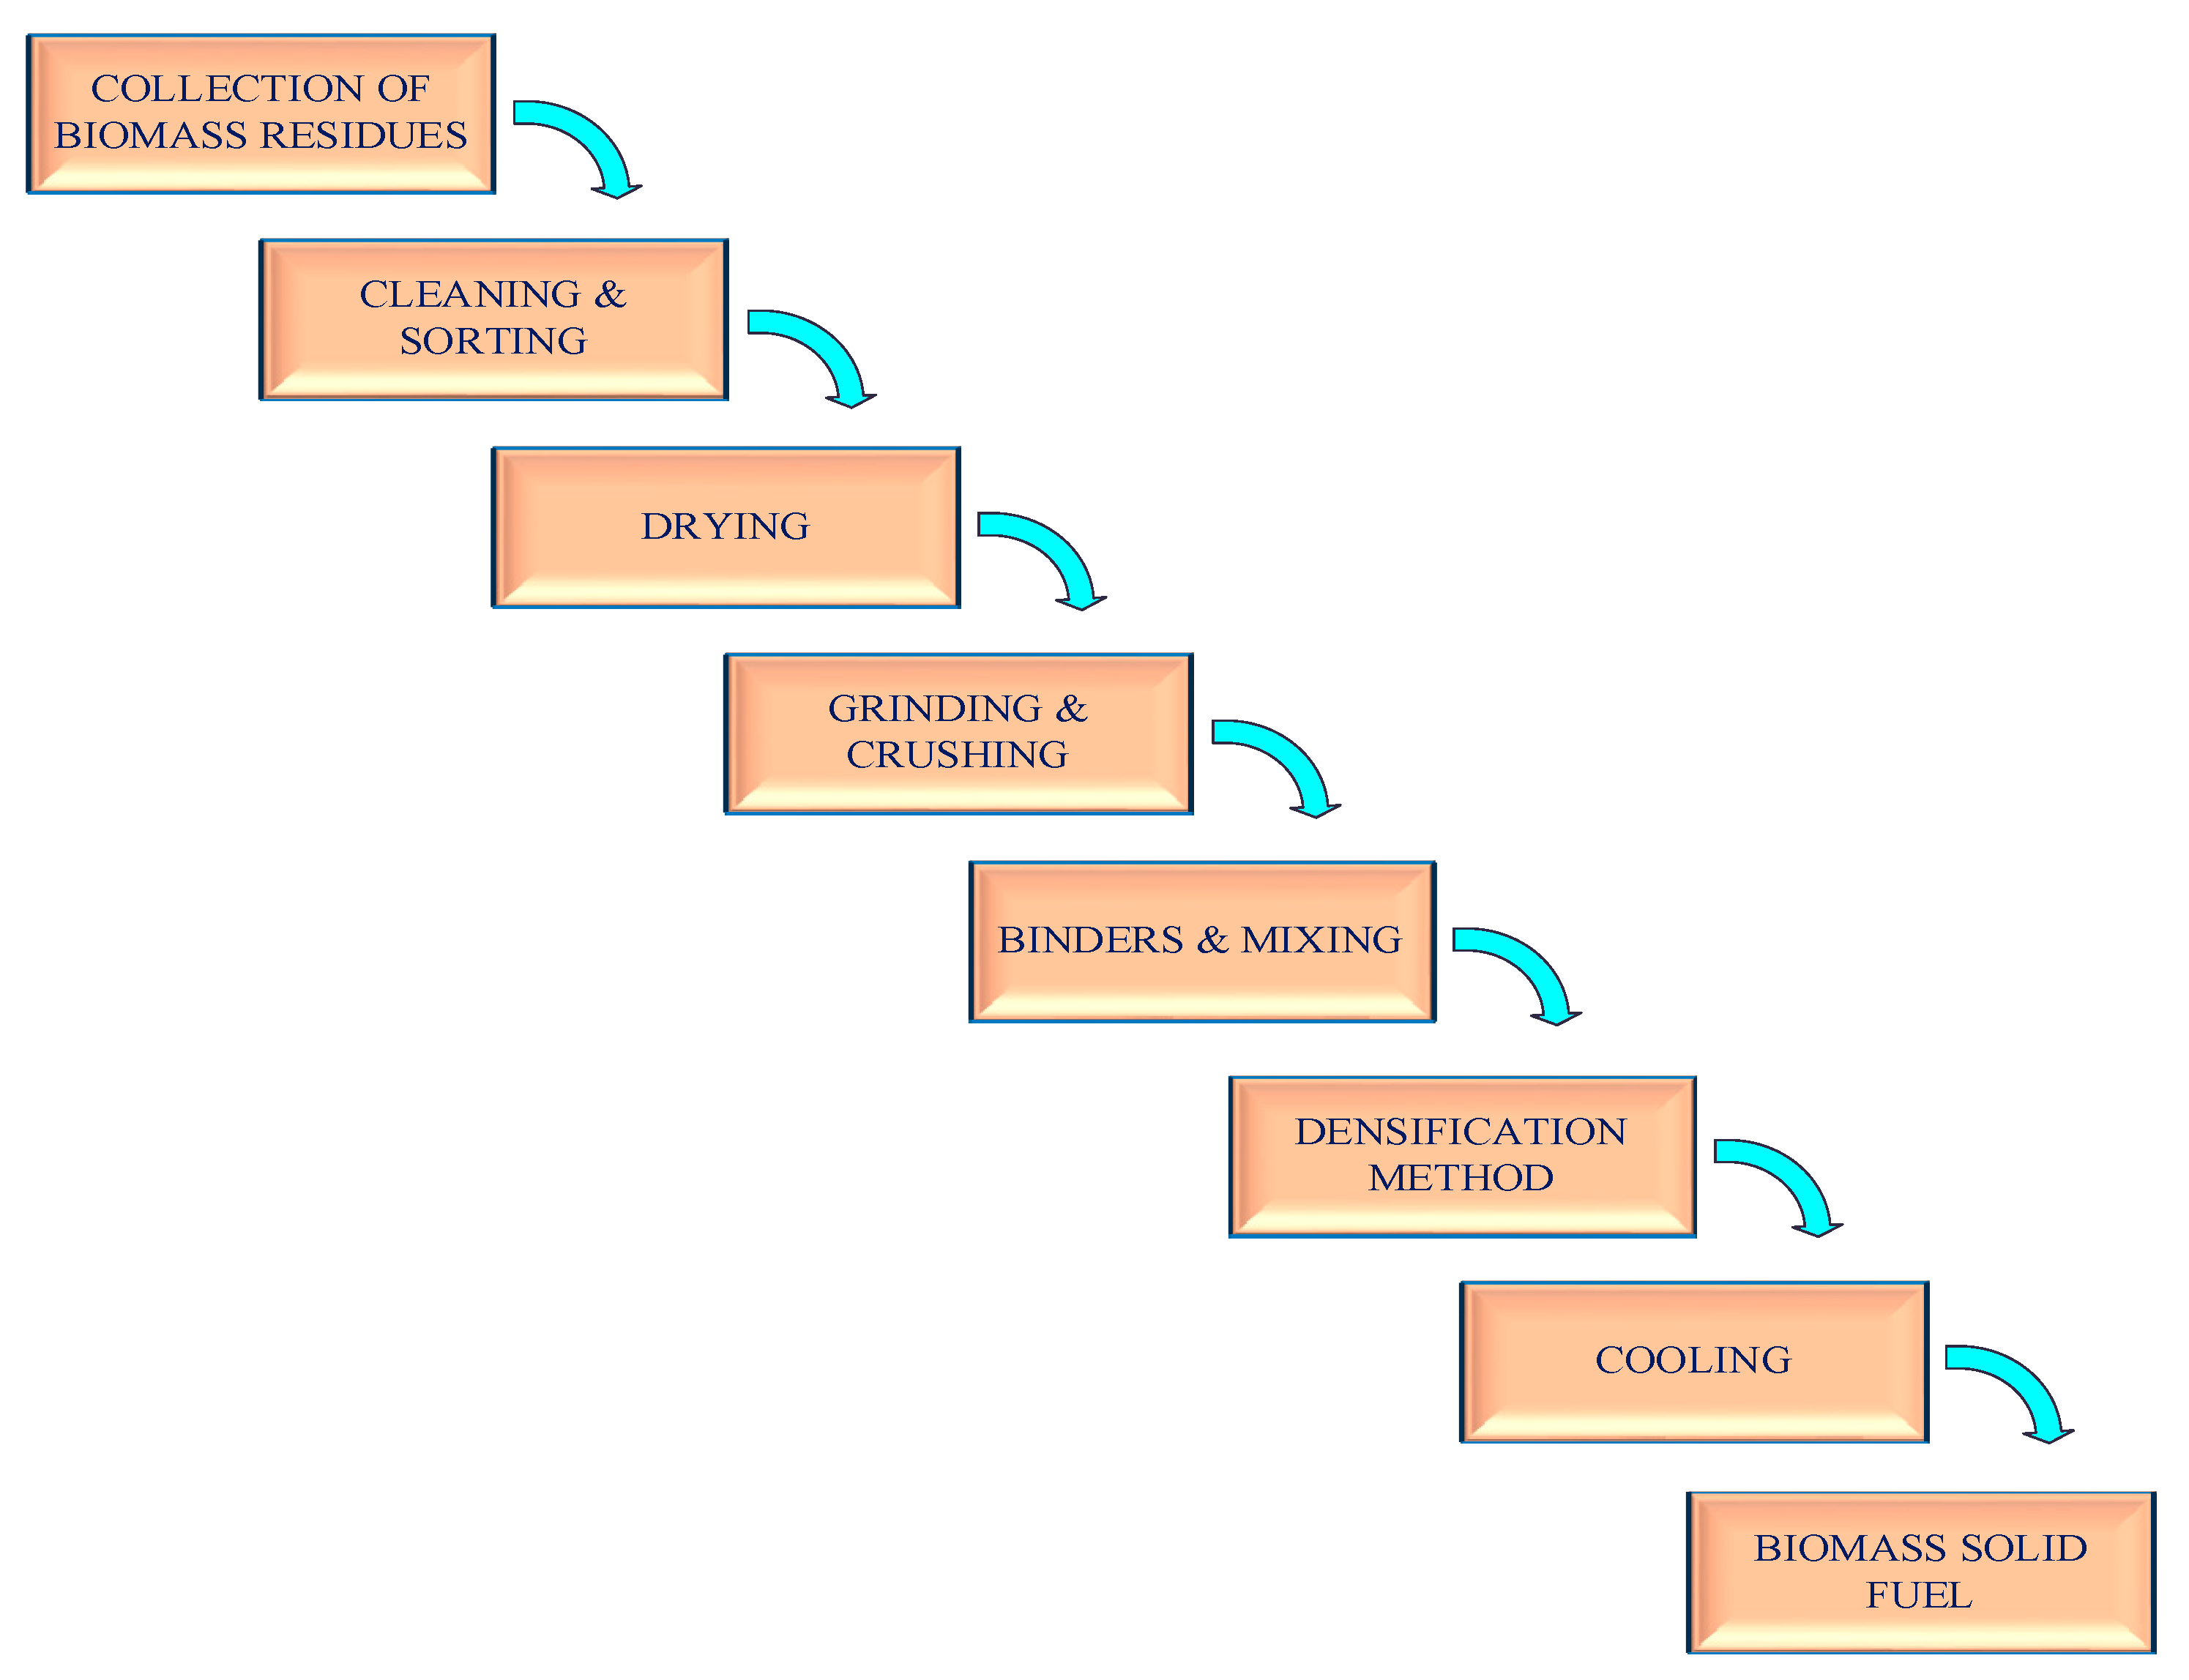
5. Prospects for Surplus Residue from Punjab as Briquettes

The abundance and large potential of agriculture residue has not been able to support the rise in current level of its usage as a biofuel due to multiple inevitable facts. Some facts are known, such as low fuel density, high transport cost, low local availability, limited know-how of fuel conversion technologies. To increase the usage of agriculture residue with improved fuel characteristics for energy generation, fuel management and transportation, it is essential to increase the density of biofuels through the process of densification known as briquetting [27]. It is process of compacting bio residues, turning them into a new higher density fuel, which reduces the volume by 8–10 times from the original, and increases density by about 1000–1200 kg/m3. Briquetting includes the densification of large quantities of biomass with the application of temperature and pressure to optimize moisture content, dryness and required density. Densification also improves the properties of briquettes such as combustion, calorific values, and pollutants [28,29]. The total surplus residues from wheat as straw is 6034.24 M-Kg, from rice, as straw and husks, total 6034.24 M-Kg, from barley residue straw are 3.66 M-Kg, and from maize stalk and cobs total 414.15 M-Kg. Other residues include cotton seeds and wastes with enough quantity for use. Similarly, the sugarcane residues, bagasse and leaves, are sufficient in quantity to use as an energy source. These residues are in huge quantity in Punjab and has projected the way for formation of bio briquettes, which are considered environmentally sustainable with the adoption of standard practices. Figure 15 depicts the manufacturing process of briquettes.

Comparison of Briquettes to Other Biomass Fuels

For small scale applications, the naturally available biomass is used as such. For medium and large-scale applications, the naturally available biomasses are treated as per the requirements of the energy conversion process. In the case of briquettes as biofuels, the briquettes are prepared with a densification technology to enhance the properties of the biomass fuels such as calorific value, density, mechanical strength, durability. Other biomasses are collected in scattered form and later stored and used for applications. For briquettes, the stored biomasses are directly collected and prepared as briquettes, as well as transported to the place of application. The management of biomass as a fuel is itself a complicated and challenging process and involves a high cost. On the other hand, briquettes are quite compact, easy to transport, and involve less cost in management compared to naturally available biomasses.

6. Policy for Management of Biomass Residue in Punjab

The policy by the Punjab Government of Punjab Province has great potential for the New Renewable Sources of Energy (NRSE) sector. The Punjab Government has introduced the “New Renewable Sources of Energy Policy—2012” to formulate and encourage the NRSE based technologies for better use of the NRSE sector, as well as providing financial and fiscal assistance. The objectives of policy are:
(a)
To exploit and renovate the share of NRSE up to 10% of the total installed capacity of power in the province by 2022.
(b)
To encourage renewable energy initiatives for attaining energy/lighting requirements in rural areas and accompanying energy requirements in urban, industrial, and commercial sectors.
The various polices enacted by Government to promote biomass waste/residue utilization for power generation are as follows:
  • Punjab is an agricultural state that is highly capable of generating power from agricultural waste (Residues) such as cotton stalks, paddy straw, paddy husk etc. Due to this, the target of approximately 600 MW power generation through agricultural wastes is planned to be achieved by 2022.
  • The installation of cogeneration-based (both bagasse and non-bagasse) power plants of capacity targets near about 500 MW is set for the year of 2022.
  • Biomass IPP Project—wheat and paddy are the dominant crops in the Punjab agricultural sector. It is estimated that approximately 10 million tonnes of paddy straws are generated during the season. The production of large quantity of surplus residue (agro wastes) and industrial processed waste can be used for generation of decentralized power. Due to this, a target of approximately 600 MW power generation through agricultural wastes is planned to be achieved by 2022.
  • Energy plantations based small capacity biomass plants—Punjab state has areas of wastelands and non-forest, which can be used for specific plantations of fast-growing, high yielding, plant species (e.g., Bambusa balcooa, Melia dubia etc.). Also, Lantana is available in forests and is encouraged for the biomass plants. These small capacity projects up to 2 MW can be set up in technology neutral mode.
  • Rice mills integrated small capacity biomass plants—rice mills, introduced as small capacity biomass plants in Independent Power Plan (IPP) mode that have about 5 MW capacity shall be permitted to be setup with due approval of the PEDA with the condition that at least 25% of the biomass used has to be rice straw. Rice mills that have 4 TPH capacity shall be permitted to set up an about 1 MW capacity biomass plant. Rice mills of about 20 TPH and more shall be permitted to set up a 5 MW capacity biomass plant. These small capacity projects can be set up in technology neutral mode and will not infringe upon the command area of the biomass IPP projects.
  • Co-generation—Punjab state has a recognized industrial base, which is growing, and cogeneration plants have evidenced to be greatly advantageous for the industries. The sugar, paper, fertilizer, chemical, textile and other industries are still having an estimated combined potential of 500 MW, which is still to be realized. It is planned to stimulate the industry to set up co-generation plants and accomplish capacity near about 500 MW by 2022. These projects shall meet the qualifying criteria under a topping cycle as per CERC regulations.
  • The project designers/developers are invited by Punjab Energy Development Agency (PEDA) to install biomass power plants fully dependent on use of 100% rice straw.
The various types of policy and encouragements are initiated by the central and state governments to manage the enormous amount of biomass residues in the country. The Central Authority of India passed a policy advisory for usage of biomass residues to produce power through a co-firing process in pulverized coal-fired boilers.
  • For the implementation of this policy, all power-generating companies (public as well as private power utility) that have pulverized coal plants or coal-based thermal power plants are suggested to use 5% to 10% amalgam of primarily agricultural residues and biomass residue pellets along with coal.
  • The requirement of biomass residue pellets is estimated at about 146,498 tonnes. This includes 53.5 million tonnes biomass crop residue annually.
  • The present scenario of available biomass residues is about 750 million metric tonnes per year. Whereas the availability of agricultural biomass residues is estimated at 230 million metric tonnes annually [32,33].
The use of biomass residues in the thermal power plant in Punjab is depicted in Table 10 [26]. There is still use of biomass residues in the thermal power plant in Punjab province. Even with such concrete initiatives, there is still a requirement for implementing the innovative policy and a programme for management of biomass residues. Additionally, there is a need to promote an awareness to stimulate the private investments for the trading of biomass residues and its collection process.

7. Discussion

Being an agricultural country, India has plenty of biomass resources and, subsequently, biomass residues, which can further act as biofuels. For the estimation of surplus crop residues, the significant crops rice, wheat, jowar, bajra, maize and barley were considered. Those states that have crops either in much less quantity or where data was unavailable, were not considered in this study. The leading crop residues are from rice and wheat, followed by bajra, maize, jowar and barley. The top ten leading provinces for cumulative surplus crop residues in India (in M-kg) were Uttar Pradesh (22,792.49), Punjab (13,565.82), Madhya Pradesh (11,653.63), Rajasthan (8549.18), West Bengal (8541.96), Haryana (7848.60) Bihar (6924.47), Andhra Pradesh (4952.85), Tamil Nadu (4864.26), and Karnataka (4425.35). The data show evidence of bulk surplus being available for multiple applications and also energy generation. The second leading province for surplus crop residue, Punjab, has a cumulative surplus residue from all significant crops of 13,428.91 M-kg, and the prominent top five contributor districts were Sangrur (1313.77), Ludhiana (1084.25), Bathinda (913.14), Patiala (885.29), and Moga (767.14). This immense potential for surplus crops in these districts is enabling the production of bio briquettes fuels, which have high heating values and high density. The data for surplus crops were collected by using standard research procedures like interviews of farmers, questionnaires, GIS, or government organizations. The use of these surplus crops are for small power generation applications, domestic applications nowadays with briquettes and pellets. Biomass power generations at the country level are already in operation but contributions are minimal. The valid reasons for the lesser contributions are non-availability of factual surplus biomass data to enable concrete policy planning and later implementation. In general, only 10–20% of surplus residue is used for applications. The limitations of these applications are a lack of policy, financial assistance, and skilled staff.

8. Conclusions

The study concluded that India has abundant crop residues that are used for several applications, and even after use, abundant residues are available and considered as waste. Estimation of gross crop residue and surplus crop residue in this study show that cumulative gross crop residue in India is 480 M-tonnes and the cumulative surplus crop residue is 121 M-tonnes, or remarkably 25.15% of the gross crop residue. The total geographical area of country is 328,726 thousand hectares and area under significant crops is 94,305 thousand hectares (29%). This abundant potential has immense capability to contribute to power generation applications and increase the total installed capacity of renewable sources in the country. The present study analyses and estimates the surplus potential sources of energy, which are otherwise considered waste, and shows data that should be a motivation to strengthen the installed power capacity of the country.

Author Contributions

Conceptualization and methodology of the study—S.V. and G.K. Scientific implementation—N.K.S. and G.K. Original draft preparation—S.V. and G.K. Review, editing and visualization—N.G. All authors have read and agreed to the published version of the manuscript.

Funding

This research and study was funded and supported by a fellowship to Sunny Vaish as a PhD research scholar of IKGPTU Jalandhar, India under All India Council of Technical Education AICTE Doctoral Fellowship.

Institutional Review Board Statement

Not applicable.

Informed Consent Statement

Not applicable.

Data Availability Statement

The data presented in this study are available from the corresponding author upon a reasonable request.

Acknowledgments

Author are highly thankful to I.K. Gujral Punjab Technical University, Jalandhar, India for all technical and academic support. Thanks are due to officials of Sardar Swaran Singh National Institute of Bioenergy, Kapurthala India for lab facilities. We thank the faculty of Department of Electrical Engineering, IKGPTU Jalandhar for the academic environment to successfully complete this study.

Conflicts of Interest

The authors declare no conflict of interest.

Abbreviation

MWMegawatt
BUBillion Units
RESRenewable Energy Sources
GWGiga Watt
UTsUnion Territories
MNREMinistry of New and Renewable Energy
MTMillion Tonnes
kgKilogram
kg/haKilogram per hectare
‘000’ haThousand hectare
MJ/kgMega Joule per Kilogram
TJTera Joule
M-kgMillion Kilogram
PEDAPunjab Energy Development Agency
CRg (j)Gross Crop Residue Potential at jth province in tonnes
nNumber of crops
CRs (j)Surplus Residue Potential at jth state in tonnes
SF (i, j)Surplus Residue Fraction of ith crop at jth province
A(i, j)Area under ith crop at jth province
Y(i, j)Yield of ith crop at jth province
RPR (i, j)Residue to Production Ratio within ith crop at jth province
E(j)Bioenergy Potential of n crops at jth province in Mega Joule
HVHeating Value of ith crop at jth province, Mega Joule per tonne
NRSENew Renewable Sources of Energy
IPPIndependent Power Plant
TPHTotal Petroleum Hydrocarbon
CERCCentral Electricity Regulatory Commission
CFAChartered Financial Analyst
IPPIndependent Power Plant

References

  1. Power Sector at a Glance All India, Ministry of Power, Government of India. Available online: https://powermin.gov.in/en/content/power-sector-glance-all-india (accessed on 11 February 2022).
  2. Central Electricity Authority of India. Available online: https://cea.nic.in/annual-generation-report/?lang=en (accessed on 23 February 2022).
  3. Central Electricity Authority of India. 2021. Available online: https://cea.nic.in/general (accessed on 23 February 2022).
  4. India Brand Equity Fund (IBEF) Power. Available online: https://www.ibef.org/download/Power-September-2017.pdf (accessed on 23 February 2022).
  5. India 2020 Energy Policy Review, International Energy Agency IEA, NITI Aayog India. Available online: https://niti.gov.in/sites/default/files/2020-01/IEA-India%202020-In-depth-EnergyPolicy_0.pdf (accessed on 11 February 2022).
  6. Singh, J.; Gu, S. Biomass conversion to energy in India—A critique. Renew. Sustain. Energy Rev. 2010, 14, 1367–1378. [Google Scholar] [CrossRef]
  7. Kumar, A.; Kumar, N.; Baredar, P.; Shukla, A. A review on biomass energy resources, potential, conversion and policy in India. Renew. Sustain. Energy Rev. 2015, 45, 530–539. [Google Scholar] [CrossRef]
  8. Kaur, G.; Brar, Y.S.; Kothari, D. Potential of Livestock Generated Biomass: Untapped Energy Source in India. Energies 2017, 10, 847. [Google Scholar] [CrossRef] [Green Version]
  9. Antwi-Boasiako, C.; Acheampong, B. Strength properties and calorific values of sawdust-briquettes as wood-residue energy generation source from tropical hardwoods of different densities. Biomass-Bioenergy 2016, 85, 144–152. [Google Scholar] [CrossRef]
  10. Saeed, A.; Harun, N.Y.; Bilad, M.; Afzal, M.; Parvez, A.; Roslan, F.; Rahim, S.A.; Vinayagam, V.; Afolabi, H. Moisture Content Impact on Properties of Briquette Produced from Rice Husk Waste. Sustainability 2021, 13, 3069. [Google Scholar] [CrossRef]
  11. India 2020, Energy Policy Review, International Energy Agency. Available online: https://www.iea.org/events/india-energy-policy-review-2020 (accessed on 11 February 2022).
  12. Hiloidhari, M.; Das, D.; Baruah, D.C. Bioenergy potential from crop residue biomass in India. Renew. Sustain. Energy Rev. 2014, 32, 504–512. [Google Scholar] [CrossRef]
  13. Venkatramanan, V.; Shah, S.; Prasad, S.; Singh, A.; Prasad, R. Assessment of Bioenergy Generation Potential of Agricultural Crop Residues in India. Circ. Econ. Sustain. 2021, 1, 1335–1348. [Google Scholar] [CrossRef]
  14. Purohit, P. Economic potential of biomass gasification projects under clean development mechanism in India. J. Clean. Prod. 2009, 17, 181–193. [Google Scholar] [CrossRef]
  15. Economic and Statistical Organization; Government of Punjab. Statistical Abstract of Punjab. 2020. Available online: https://esopb.gov.in/static/PDF/Abstract20201.pdf (accessed on 11 February 2022).
  16. Raj, A.; Jhariya, M.K.; Toppo, P. Cow dung for eco-friendly and Sustainable Productive Farming. Int. J. Sci. Res. 2014, 3, 201–212. [Google Scholar]
  17. Bhattacharyya, S.C. Energy access problem of the poor in India: Is rural electrification a remedy? Energy Policy 2006, 34, 3387–3397. [Google Scholar] [CrossRef]
  18. Rao, P.V.; Baral, S.S.; Dey, R.; Mutnuri, S. Biogas generation potential by anaerobic digestion for sustainable energy development in India. Renew. Sustain. Energy Rev. 2010, 14, 2086–2094. [Google Scholar] [CrossRef]
  19. Surendra, K.; Takara, D.; Hashimoto, A.G.; Khanal, S.K. Biogas as a sustainable energy source for developing countries: Opportunities and challenges. Renew. Sustain. Energy Rev. 2014, 31, 846–859. [Google Scholar] [CrossRef]
  20. Mittal, S.; Ahlgren, E.O.; Shukla, P. Barriers to biogas dissemination in India: A review. Energy Policy 2018, 112, 361–370. [Google Scholar] [CrossRef]
  21. Mittal, S.; Ahlgren, E.O.; Shukla, P. Future biogas resource potential in India: A bottom-up analysis. Renew. Energy 2019, 141, 379–389. [Google Scholar] [CrossRef]
  22. Dhaliwal, H.S.; Brar, Y.S.; Brar, G.S. Optimization for biomass based plant localization using NDVI super pixels for Punjab state, India. Int. J. Adv. Sci. Technol. 2020, 29, 2723–2733. [Google Scholar]
  23. Singh, M.; Brar, Y.S.; Singh, H. Critical assessment of biomass material for power generation in Punjab, India. Mater. Today: Proc. 2022, 48, 927–931. [Google Scholar] [CrossRef]
  24. Chauhan, S. District wise agriculture biomass resource assessment for power generation: A case study from an Indian state, Punjab. Biomass-Bioenergy 2012, 37, 205–212. [Google Scholar] [CrossRef]
  25. Singh, B.; Szamosi, Z.; Siménfalvi, Z.; Rosas-Casals, M. Decentralized biomass for biogas production. Evaluation and potential assessment in Punjab (India). Energy Rep. 2020, 6, 1702–1714. [Google Scholar] [CrossRef]
  26. Biomass Power Projects Completed/Commissioned Using Paddy Straw (97.50 MW). Punjab Energy Development Agency. Available online: https://www.peda.gov.in/biomass-power-projects (accessed on 11 February 2022).
  27. Obi, O.F. Evaluation of the effect of palm oil mill sludge on the properties of sawdust briquette. Renew. Sustain. Energy Rev. 2015, 52, 1749–1758. [Google Scholar] [CrossRef]
  28. Raju, C.A.; Prem, K.; Sunil, K.; Bhimareddy, K.S.; Ramya, C. Studies on densification and conversion of wastes as fuel briquettes for power generation. Mater. Today Proc. 2021, 44, 1090–1107. [Google Scholar] [CrossRef]
  29. Chen, L.; Xing, L.; Han, L. Renewable energy from agro-residues in China: Solid biofuels and biomass briquetting technology. Renew. Sustain. Energy Rev. 2009, 13, 2689–2695. [Google Scholar] [CrossRef]
  30. Aransiola, E.; Oyewusi, T.; Osunbitan, J.; Ogunjimi, L. Effect of binder type, binder concentration and compacting pressure on some physical properties of carbonized corncob briquette. Energy Rep. 2019, 5, 909–918. [Google Scholar] [CrossRef]
  31. Ngusale, G.; Luo, Y.; Kiplagat, J.K. Briquette making in Kenya: Nairobi and peri-urban areas. Renew. Sustain. Energy Rev. 2014, 40, 749–759. [Google Scholar] [CrossRef]
  32. New and Renewable Sources of Energy Policy in 2012 to Promote Renewable Energy. Government of Punjab, Department of Science, Technology, Environment and Non-conventional Energy. Available online: https://www.peda.gov.in/media/pdf/nrse%20pol%202012.pdf (accessed on 11 February 2022).
  33. Invited Interested Project Developers to Participate in the Selection Process for Setting up of 100 TPD Paddy Straw Pelletization Torrefied Plant on Build, Operate & Own (BOO) Basis. Punjab Energy Development Agency. Available online: https://www.peda.gov.in/assets/media/tender/1632288364_Setting_up_of_100_TPD_Paddy_Straw_Pelletization_Torrefied_Plant_on_Build,_Operate_Own_(BOO)_basis.pdf (accessed on 11 February 2022).
Figure 1. Renewable generation growth in India.
Sustainability 14 05077 g001
Figure 2. Renewable energy installed capacity in potential Indian provinces.
Sustainability 14 05077 g002
Figure 3. Cumulative biomass installed power generation capacity in the topmost Indian provinces.
Sustainability 14 05077 g003
Figure 4. Rice production by Indian provinces/UTS.
Sustainability 14 05077 g004
Figure 5. Jowar production by Indian provinces/UTS.
Sustainability 14 05077 g005
Figure 6. Bajra production by Indian provinces/UTS.
Sustainability 14 05077 g006
Figure 7. Wheat production by Indian provinces/UTS.
Sustainability 14 05077 g007
Figure 8. Maize production by Indian provinces/UTS.
Sustainability 14 05077 g008
Figure 9. Power generation projects commissioned and usage of crop residue.
Sustainability 14 05077 g009
Figure 10. Potential of cotton in Punjab Districts.
Sustainability 14 05077 g010
Figure 11. Potentials of sugarcane in Punjab Districts.
Sustainability 14 05077 g011
Figure 12. Gross residue potential (M-kg) in Indian provinces/UTS.
Sustainability 14 05077 g012
Figure 13. Surplus residue potential (M-kg) in Indian provinces/UTS.
Sustainability 14 05077 g013
Figure 14. Bioenergy potential (TJ) in Indian provinces/UTS.
Sustainability 14 05077 g014
Figure 15. Manufacturing process of biomass briquettes [30,31].
Sustainability 14 05077 g015
Table 1. Potentials of Rice.
Indian Province/UTSArea A
(000 ha)
Yield Y (kg/ha)Gross Residue Potential (M-kg)Surplus Residue Potential (M-kg)Bioenergy Potential (TJ)
Andhra Pradesh2208372913,997.173919.2160,904.51
Arunachal Pradesh1331802407.43114.081772.82
Assam2425.1821358802.192464.6138,300.09
Bihar3159.72194810,463.732929.8445,529.78
Jhar Khand1527.118954919.551377.4721,405.96
Goa36.382717168.0447.05731.16
Gujrat838.9522793250.34910.1014,142.90
Haryana144731217677.352149.6633,405.68
Himachal Pradesh71.811600195.3254.69849.89
Jammu & Kashmir262.0123501046.73293.084554.53
Karnataka1139.0530125832.391633.0725,377.90
Kerala198.032920983.02275.254277.32
Madhya Pradesh239118807641.642139.6633,250.29
Chhattisgarh3606181011,095.663106.7948,279.44
Maharastra1464.9422365568.531559.1924,229.79
Manipur233.51720682.75191.172970.80
Meghalaya110.931821343.4196.151494.23
Mizoram35.551688102.0128.56443.88
Nagaland214.451663606.27169.762638.01
Orissa3859.4200413,148.203681.5057,210.46
Punjab3103413221,796.716103.0894,841.86
Rajasthan197.82291770.37215.703352.04
Sikkim9.3185629.348.22127.68
Tamil Nadu1721.3356210,423.162918.4845,353.25
Telangana1932345211,337.753174.5749,332.81
Tripura269.429441348.29377.525866.69
Uttar Pradesh5748270426,422.417398.27114,969.17
Uttrankhand25624121049.70293.924567.47
West Bengal5512.6292627,420.777677.82119,313.28
Andaman & Nicobar5.4212219.485.4584.76
Dadra & Nagar Haveli14.4220153.8815.09234.44
Delhi5.8287728.377.94123.43
Daman and Diu1.412733.030.8513.18
Puducherry17.9255377.6921.75338.04
India (Total)44,156.381,635197,712.71553,59.56860,287.54
The total of the column represented by Bold digits in the table.
Table 2. Potentials for Wheat.
Indian Province/UTSArea A (000 ha)Yield Y (kg/ha)Gross Residue Potential (M-kg)Surplus Residue Potential (M-kg)Bioenergy Potential (TJ)
Arunachal Pradesh3.93197013.943.0752.95
Assam16.95139842.659.38162.06
Bihar2156.65299811,638.152560.3944,217.97
JharKhand163.851847544.74119.842069.67
Gujrat797.1630204333.36953.3416,464.17
Haryana2553.1492522,633.234979.3185,992.70
Himachal Pradesh31917701016.33223.593861.46
Jammu & Kashmir288.323301209.13266.014593.97
Karnataka150.11090294.5064.791118.91
Madhya Pradesh5520299329,738.456542.46112,988.26
Chhattisgarh105.121548292.9164.441112.87
Maharastra834.414972248.37494.648542.47
Manipur2.29250210.312.2739.18
Meghalaya0.4619311.600.356.07
Nagaland3.4183011.202.4642.55
Orissa0.1518150.490.111.86
Punjab3520518832,871.177231.66124,890.72
Rajasthan2880350118,149.183992.8268,956.01
Sikkim0.1610790.310.071.18
Telangana5187716.893.7264.18
Tripura0.1621150.610.132.31
Uttar Pradesh9540343258,934.3012,965.55223,914.99
Uttrankhand32729101712.83376.826507.71
West Bengal112.153012608.03133.772310.16
Chandigarh0.0550000.450.101.71
Delhi19.224312149.1832.82566.79
India (Total)29,318.667,890186,472.3141,023.91708,482.89
The total of the column represented by Bold digits in the table.
Table 3. Potentials from Jowar.
Indian Province/UTSArea A
(000 ha)
Yield Y (kg/ha)Gross Residue
Potential (M-kg)
Surplus Residue Potential (M-kg)Bioenergy Potential (TJ)
Andhra Pradesh1561475552.24110.451951.62
Bihar0.7210661.840.376.51
JharKhand2.056853.370.6711.91
Gujrat75.51278231.5746.31818.38
Haryana40.352851.0710.21180.47
Karnataka943.39452139.40427.887560.66
Kerala0.28170.390.081.39
Madhya Pradesh752189394.0278.801392.47
Chhattisgarh3.479868.211.6429.02
Maharastra1631.65352094.97418.997403.64
Nagaland0.289640.650.132.29
Orissa7.1963410.942.1938.66
Rajasthan564.398321126.97225.393982.73
Tamil Nadu385.8512041114.95222.993940.24
Telangana561202161.5532.31570.91
Tripura0.968001.840.376.51
Uttar Pradesh1471247439.9487.991554.75
West Bengal0.064690.070.010.24
Dadra & Nagar Haveli0.018090.020.000.07
Delhi3.169617.291.4625.76
India (Total)4093.0419,6268341.321668.2629,478.22
The total of the column represented by Bold digits in the table.
Table 4. Potentials from Bajra.
Indian Province/UTSArea A
(000 ha)
Yield Y (kg/ha)Gross Residue Potential (M-kg)Surplus Residue Potential (M-kg)Bioenergy Potential (TJ)
Andhra Pradesh22103159.6517.90316.22
Bihar3.1111349.282.7849.17
JharKhand0.135780.200.061.05
Gujrat391.5822802348.07704.4212,447.12
Haryana424.720682309.88692.9612,244.65
Himachal Pradesh0.097300.170.050.92
Jammu & Kashmir24.455835.8110.74189.82
Karnataka184.3957463.87139.162458.96
Madhya Pradesh32719211652.08495.628757.67
Chhattisgarh0.064490.070.020.38
Maharastra609.6545873.77262.134631.86
Nagaland0.7110141.890.5710.04
Orissa2.166223.531.0618.73
Punjab1.16511.880.579.98
Rajasthan4180.291110,015.473004.6453,091.99
Tamil Nadu46.882517310.3393.101645.07
Telangana849710.463.1455.43
Uttar Pradesh87720294679.911403.9724,808.20
West Bengal0.014020.010.000.06
Delhi1.4821988.562.5745.35
Daman and Diu0.513061.720.529.10
Puducherry0.0125450.070.020.35
India (Total)7105.0226,94322,786.666836120,792.11
The total of the column represented by Bold digits in the table.
Table 5. Potentials from Maize.
Indian Province/UTSArea A
(000 ha)
Yield Y (kg/ha)Gross Residue Potential (M-kg)Surplus Residue Potential (M-kg)Bioenergy Potential (TJ)
Andhra Pradesh26658753594.33898.5815,302.84
Arunachal Pradesh511530179.4744.87764.09
Assam32.263254241.4460.361027.93
Bihar669.4837085709.591427.4024,308.59
Jhar Khand261.0917441047.28261.824458.81
Gujrat409.2319611845.75461.447858.28
Haryana5.9264435.888.97152.76
Himachal Pradesh286.7825301668.77417.197104.80
Jammu & Kashmir262.3521891320.85330.215623.53
Karnataka1339.528058641.782160.4536,792.40
Kerala0.113850.320.081.36
Madhya Pradesh126732619502.882375.7240,458.51
Chhattisgarh118.392503681.56170.392901.74
Maharastra926.5319064061.721015.4317,292.78
Manipur26.382205133.7933.45569.59
Meghalaya18.16229495.8223.95407.94
Mizoram6.16178025.226.30107.37
Nagaland69.071982314.8678.721340.53
Orissa52.062324278.2769.571184.74
Punjab1093625908.79227.203869.16
Rajasthan844.8620403964.08991.0216,877.08
Sikkim37.781768153.6338.41654.07
Tamil Nadu390.572586518.771629.6927,753.67
Telangana54338374792.031198.0120,402.06
Tripura15.9142051.9312.98221.09
Uttar Pradesh73320823510.04877.5114,944.01
Uttrankhand21186690.1322.53383.72
West Bengal264.348052920.91730.2312,435.78
Andaman & Nicobar0.0315100.100.030.44
Delhi0.0251100.240.061.00
Total (India)9026.8383,20162,290.2415,572.56265,200.69
The total of the column represented by Bold digits in the table.
Table 6. Potentials from Barley.
Indian Province/UTSArea A (000 ha)Yield Y (kg/ha)Gross Residue Potential (M-kg)Surplus Residue Potential (M-kg)Bioenergy Potential (TJ)
Bihar14.27199036.923.6967.04
Haryana14.9386674.887.49135.99
Himachal Pradesh20.36177046.854.6885.08
Jammu & Kashmir7.046495.940.5910.79
Madhya Pradesh831981213.7521.37388.17
Chhattisgarh1.887921.940.193.52
Maharastra25.446515.351.5427.88
Nagaland0.5610360.750.081.37
Punjab6.8374733.123.3160.15
Rajasthan255.835971196.15119.612172.20
Sikkim0.7910731.100.112.00
Uttar Pradesh1513016592.0459.201075.15
Uttrakhand23142442.584.2677.32
West Bengal0.6715171.320.132.40
Delhi0.0629150.230.020.41
Total (India)605.5329,8382262.92226.294109.47
The total of the column represented by Bold digits in the table.
Table 7. Potential of crop residue, surplus residue and bioenergy from wheat.
Punjab DistrictsArea A
(000 ha)
Yield Y (kg/ha)Gross Residue
Potential (M-kg)
Surplus Residue Potential (M-kg)Bioenergy
Potential (TJ)
Gurdaspur18541751390.28305.865282.21
Pathankot403944283.9762.471078.91
Amritsar18845331533.97337.475828.15
Tarn Taran18845461538.37338.445844.87
Kapurthala1094655913.31200.933470.03
Jalandhar17350261565.10344.325946.43
S.B.S. Nagar775078703.81154.842674.06
Hoshiarpur14242871095.76241.074163.22
Rupnagar694326537.29118.202041.38
S.A.S. Nagar504521406.8989.521545.94
Ludhiana25050982294.10504.708716.20
Firozpur18751181722.72379.006545.30
Fazilka20649341829.53402.506951.11
Faridkot11655701163.02255.864418.76
Muktsar Sahib21454582102.42462.537987.94
Moga17653511695.20372.946440.73
Bathinda25654182496.61549.269485.64
Mansa17153911659.35365.066304.53
Sangrur29157673020.75664.5711,477.06
Barnala11452571078.74237.324098.55
Patiala23447712009.55442.107635.07
Fatehgarh Sahib854394672.28147.902554.27
Total (Punjab)3521107,61831,712.996976.86120,490.35
The total of the column represented by Bold digits in the table.
Table 8. Potential of crop residue, surplus residue, and bioenergy from rice.
Punjab DistrictsArea A
(000 ha)
Yield Y (kg/ha)Gross Residue
Potential (M-kg)
Surplus Residue Potential (M-kg)Bioenergy
Potential (TJ)
Gurdaspur17436611082.92303.224712.02
Pathankot283076146.4241.00637.09
Amritsar18133051016.95284.754424.95
Tarn Taran18438421201.78336.505229.17
Kapurthala1204132842.93236.023667.75
Jalandhar17540711211.12339.115269.84
S.B.S. Nagar604182426.56119.441856.07
Hoshiarpur784005531.06148.702310.76
Rupnagar413603251.1370.321092.71
S.A.S. Nagar293621178.5249.98776.76
Ludhiana25946762058.84576.488958.44
Firozpur19140581317.63368.945733.28
Fazilka1142692521.71146.082270.06
Faridkot1163756740.68207.393222.86
Muktsar Sahib19033521082.70303.154711.03
Moga18145631404.04393.136109.24
Bathinda17942671298.45363.575649.81
Mansa1194112831.86232.923619.58
Sangrur28947112314.51648.0610,070.91
Barnala1144603892.06249.783881.54
Patiala23539491577.63441.746864.56
Fatehgarh Sahib864250621.35173.982703.62
Total (Punjab)314386,48721,550.856034.2493,772.04
The total of the column represented by Bold digits in the table.
Table 9. Potential of crop residue, surplus residue, and bioenergy from barley and maize.
Punjab DistrictsArea A
(000 ha)
Yield Y (kg/ha)Gross Residue Potential (M-kg)Surplus Residue Potential (M-kg)Bioenergy
Potential (TJ)
For Barley
Rupnagar0.139820.520.061.13
S.A.S. Nagar0.137810.490.061.07
Ludhiana1.138225.470.6611.91
Fazilka1.136185.170.6211.27
Muktsar Sahib0.238130.990.122.16
Moga0.440022.080.254.54
Bathinda0.633522.610.315.70
Mansa0.336441.420.173.10
Sangrur1.442707.770.9316.94
Barnala0.336751.430.173.12
Patiala0.337181.450.173.16
Fatehgarh Sahib0.327261.060.132.32
Total (Punjab)6.244,40330.473.6666.41
For Maize
Gurdaspur126526.101.5225.97
Pathankot8.6299759.2814.82252.39
Amritsar2.2319116.154.0468.74
Tarn Taran2358116.474.1270.13
Kapurthala0.256622.600.6511.09
Jalandhar6424458.5714.64249.35
S.B.S. Nagar774367773.40193.353292.73
Hoshiarpur553599455.27113.821938.33
Rupnagar223575180.9045.22770.16
S.A.S. Nagar7.8288551.7612.94220.36
Ludhiana141989.662.4141.11
Fazilka2284513.093.2755.72
Moga0.435813.290.8214.03
Mansa0.135810.820.213.51
Sangrur0.135810.820.213.51
Barnala0.135810.820.213.51
Patiala0.827815.121.2821.79
Fatehgarh Sahib0.335812.470.6210.52
Total (Punjab)186.664,4821656.59414.157052.92
The total of the column represented by Bold digits in the table.
Table 10. Utilization of biomass residues in the thermal power plants.
Thermal Power PlantsInstalled Capacity (MW)Utilization of Crop Residues (Tonnes)
Guru Gobind Singh Super Thermal Plant, Ropar1260.00346,500.00
Guru Hargobind Thermal Power Plant, Lehra Mohabbat, Bathinda920.00253,000.00
Guru Nanak Dev Thermal Power Plant, Bathinda460.00126,500.00
Publisher’s Note: MDPI stays neutral with regard to jurisdictional claims in published maps and institutional affiliations.

