Article

Benefit Analysis of Economic and Social Water Supply in Xi’an Based on the Emergy Method

1
State Key Laboratory of Eco-Hydraulics in Northwest Arid Region, Xi’an University of Technology, Xi’an 710048, China
2
Hanjiang-to-Weihe River Valley Water Diversion Project Construction Co., Ltd., Xi’an 710048, China
*
Author to whom correspondence should be addressed.
Sustainability 2022, 14(9), 5001; https://doi.org/10.3390/su14095001
Submission received: 24 March 2022 / Revised: 20 April 2022 / Accepted: 20 April 2022 / Published: 21 April 2022
(This article belongs to the Topic Water Management in the Era of Climatic Change)

Abstract

:
In order to manage regional water resources efficiently and sustainably and promote the rational utilization of water resources, it is necessary to evaluate the water-supply benefit reasonably. On the basis of emergy theory, this paper constructs the water-supply-benefit model of economic (industry, agriculture, and the tertiary industry) and social (domestic, employment security, entertainment, scientific research) systems. Taking Xi’an from 2014 to 2020 as an example, by analyzing the energy flow of each system and the multisource water transformities, the water contribution rate, the water-supply benefit, and the unit-water-resource value in each system are calculated. For the water-supply benefits: Industry > Agriculture > Domestic > Tertiary industry > Employment Security > Entertainment > Scientific research. For the unit-water-resource values: Industry > Tertiary industry > Agriculture > Domestic > Entertainment > Employment security > Scientific research. In the economic system, the water-supply benefit and the unit-water value of industry were always the largest, followed by agriculture and the tertiary industry. However, the Pearson correlation coefficient between the water contribution rate and the output of the industrial system was only 0.52, which was less than that of other production industries, which indicates that there might be a waste of water and that industrial water conservation needs to be further strengthened. In the social system, the domestic-water-supply benefits and the water-resource value were the largest. This is because water resources, as a basic resource, always affect people’s health and quality of life.

1. Introduction

Nowadays, because of the continuous growth of the population and the economy and the uneven spatial distribution of water resources, the problems of water shortages, uneven supply and demand, and the waste of water resources are becoming increasingly prominent. This not only greatly limits social and economic development, but also stimulates contradictions among different regions and industries [1,2,3]. In such a severe situation, a reasonable assessment of the water-resource value in different industries is of great significance in order to protect people’s livelihoods, promote economic development, and allocate water resources rationally [4,5].
In their study of the quantification of the water-resource value and the water-supply benefits, Qin et al., Tang et al., Bierkens et al., Liu et al., and Shen et al. established a planning, or optimization, model to find the dual solution of the linear programming problem, obtained the shadow price of water, and quantified the value of the water resources [6,7,8,9,10]. Alcon et al., Arena et al., and Arborea et al. measured the economic benefits of reclaimed water for irrigation (including the market and nonmarket benefits) through the CBA model, so as to evaluate the economic sustainability of an irrigation scheme [11,12,13]. Ward applied the CBA model to water-resource decision making and evaluated the monetary value of the impact of the decision-making scheme on the overall social environment and economy [14]. Dallman et al. and Zuo et al. evaluated the benefits of rainwater collection from many aspects, established a cost–benefit model, quantified the economic benefits and costs of rainwater collection, and thereby quantified the value of rainwater [15,16,17]. Sun et al., Downing et al., and Ma et al. analyzed the costs and benefits of soil and water conservation, the benefits brought about by water-quality protection, and the economic value of water in arid and water-shortage areas by using the cost–benefit model [18,19,20]. Lee et al., Genius et al., Loomis et al., and Mumbi et al. used the dichotomy conditional valuation method (CVM) to measure the economic benefits of tap-water-supply services, the residents’ willingness to pay for potable water treatment, the economic value of water treatment, and the residents’ willingness to pay for environmental restoration [21,22,23,24]. Xu et al. took the Xin’an River Basin as an example, and estimated the water-use benefits of different beneficiaries by analyzing the transformation of the protection costs and benefits in different regions [25]. Van dijk et al. applied linear and spatial hedonic price models to the real estate market in Switzerland, assessed the impact of the water-related environmental factors on the housing sales prices, and analyzed the differences in the contributions of different water-related resources to the housing prices [26]. Chi et al. proposed the comprehensive evaluation index of the social, economic, and environmental benefits of water resources, and analyzed the comprehensive benefits of the water resources in an area by using the multiobjective evaluation model [27]. Wang et al. quantified the ecological and economic benefits brought about by the middle route of the South-to-North Water Transfer Project to the water-receiving area by using the cost–benefit method and an alternative cost method, thereby reflecting the water value [28]. Cheng et al. and Yue et al. analyzed the river ecological service function and quantified the value of the regional ecological base flow through the equivalent factor method [29,30].
The above research has used different analysis methods to fully discuss the water-resource value of different objects, which has provided references for the adaptability of the research methods and the accuracy of the calculation results in this paper. However, because of the complexity of the eco-economic system and the abstractness of the socioeconomic value of water resources [31], the commonly used methods, such as the models of shadow price, marginal benefit, multiobjective evaluation, and cost–benefit, fail to combine the ecological and socioeconomic attributes of water and to quantify the input and output of materials, money, and energy in the eco-economic system uniformly, which may lead to the inaccurate evaluation of the water-resource value [32]. Therefore, in order to break down the original barriers between the different substances in the ecosystem and in the socioeconomic system, to ensure that substances with different attributes have unified measurement standards, and to facilitate unified analysis, statistics, and comparison, emergy theory came into being. Emergy theory is a new scientific system that was first proposed by Odum, a famous American ecologist, in his speech when accepting the Crafoord Prize of the Royal Swedish Academy of Sciences, and in his paper that was published in Science in 1987, after his in-depth research on energetics [33]. After further research and demonstration, Odum completed the world’s first emergy monograph: “Environmental accounting: Emergy and Environmental Decision Making”, in 1996 [34]. The theoretical framework contains a series of new concepts and pioneering viewpoints, including energy systems, energy quality, emergy, and emergy transformity. For the first time, different substances in different systems were connected together, so that they had a unified measurement standard—Emergy—which was a major leap in theory and method. Emergy theory, as a bridge between the natural system and the socioeconomic system, has attracted a lot of attention in academic circles in recent years, and it is widely used in the quantitative research on the value of natural resources and in the sustainability analyses of different systems, such as in the work of Liu et al., who constructed an urban domestic water supplying process metabolism model and accounting framework that is based on emergy theory, and who analyzed the cost and value of the urban domestic water supply [35]. Di et al. constructed the eco-economic value index system, which is based on emergy, and they analyzed the water-resource values of eight cities in the Yellow River Basin [31]. Wu et al. analyzed the social value of water resources on the basis of the emergy method, which enriched the accounting method of the social value of water resources [32]. Paoli et al. conducted emergy analysis on tourism and cruise tourism in three cities of the Liguria coastal region from the perspective of the environmental costs and economic benefits, and they evaluated the development of tourism in these cities [36]. Kocjancic et al. incorporated the biophysical indicators on the basis of emergy into the socioeconomic optimization model and, through the study of the Slovenian dairy sector, it was confirmed that the inclusion of emergy indicators in the optimization model was conducive to the growth of industrial economic and biophysical benefits [37]. Zhang et al., Zhang et al., and Zhong et al. adopted a series of comprehensive emergy indicators to evaluate the sustainability of China’s newly built sewage treatment plant, China’s cement industry environment, and the Erhai Lake Basin, respectively [38,39,40]. Winfrey et al. created the treatment sustainability index on the basis of emergy theory to quantify the sustainability of a waste-treatment system [41]. Shah et al. assessed the sustainability of a regional agricultural production system through the emergy input–output analysis of agricultural production in Pakistan [42]. Peng et al. and Pan et al. quantified the emergy-carrying capacity and emergy ecological footprint of a city on the basis of the emergy ecological footprint framework, and they evaluated the sustainability of the ecological and economic systems of the city [43,44]. Jaklic et al. evaluated the emergy of nine farm types, and they discuss the potential of a multiperspective collaborative evaluation of agricultural activities [45]. Ali et al. evaluated and compared the environmental pressure that is caused by agricultural production on Pakistan and India from the perspective of the emergy index [46]. Viglia et al. used the emergy accounting method to quantify the environmental support that is required by the metabolism of five urban systems with different sizes in Italy in terms of the resource generation and the ecosystem service supply [47].
To sum up, in order to accurately measure the real value of water resources, in view of the existing research results, this paper introduces the concepts of the water-resource eco-economic system and emergy, and it constructs the emergy network of the water-resource ecological and socioeconomic composite system. Taking the economic and social system in Xi’an from 2014 to 2020 as an example, we analyze the emergy flow in each system, and we make a specific analysis of the emergy in the Xi’an economic and social system from three parts, including the original data-processing model, the multisource water-body-transformity model, and the water-supply-benefit model. Thus, the water-resource value and the water-supply benefit of each system are obtained. The purpose is to provide new ideas for improving and perfecting the accounting method of the socioeconomic value of water resources, and to provide a reference for water-resource pricing and water-resource allocation in different industries.

2. Materials and Methods

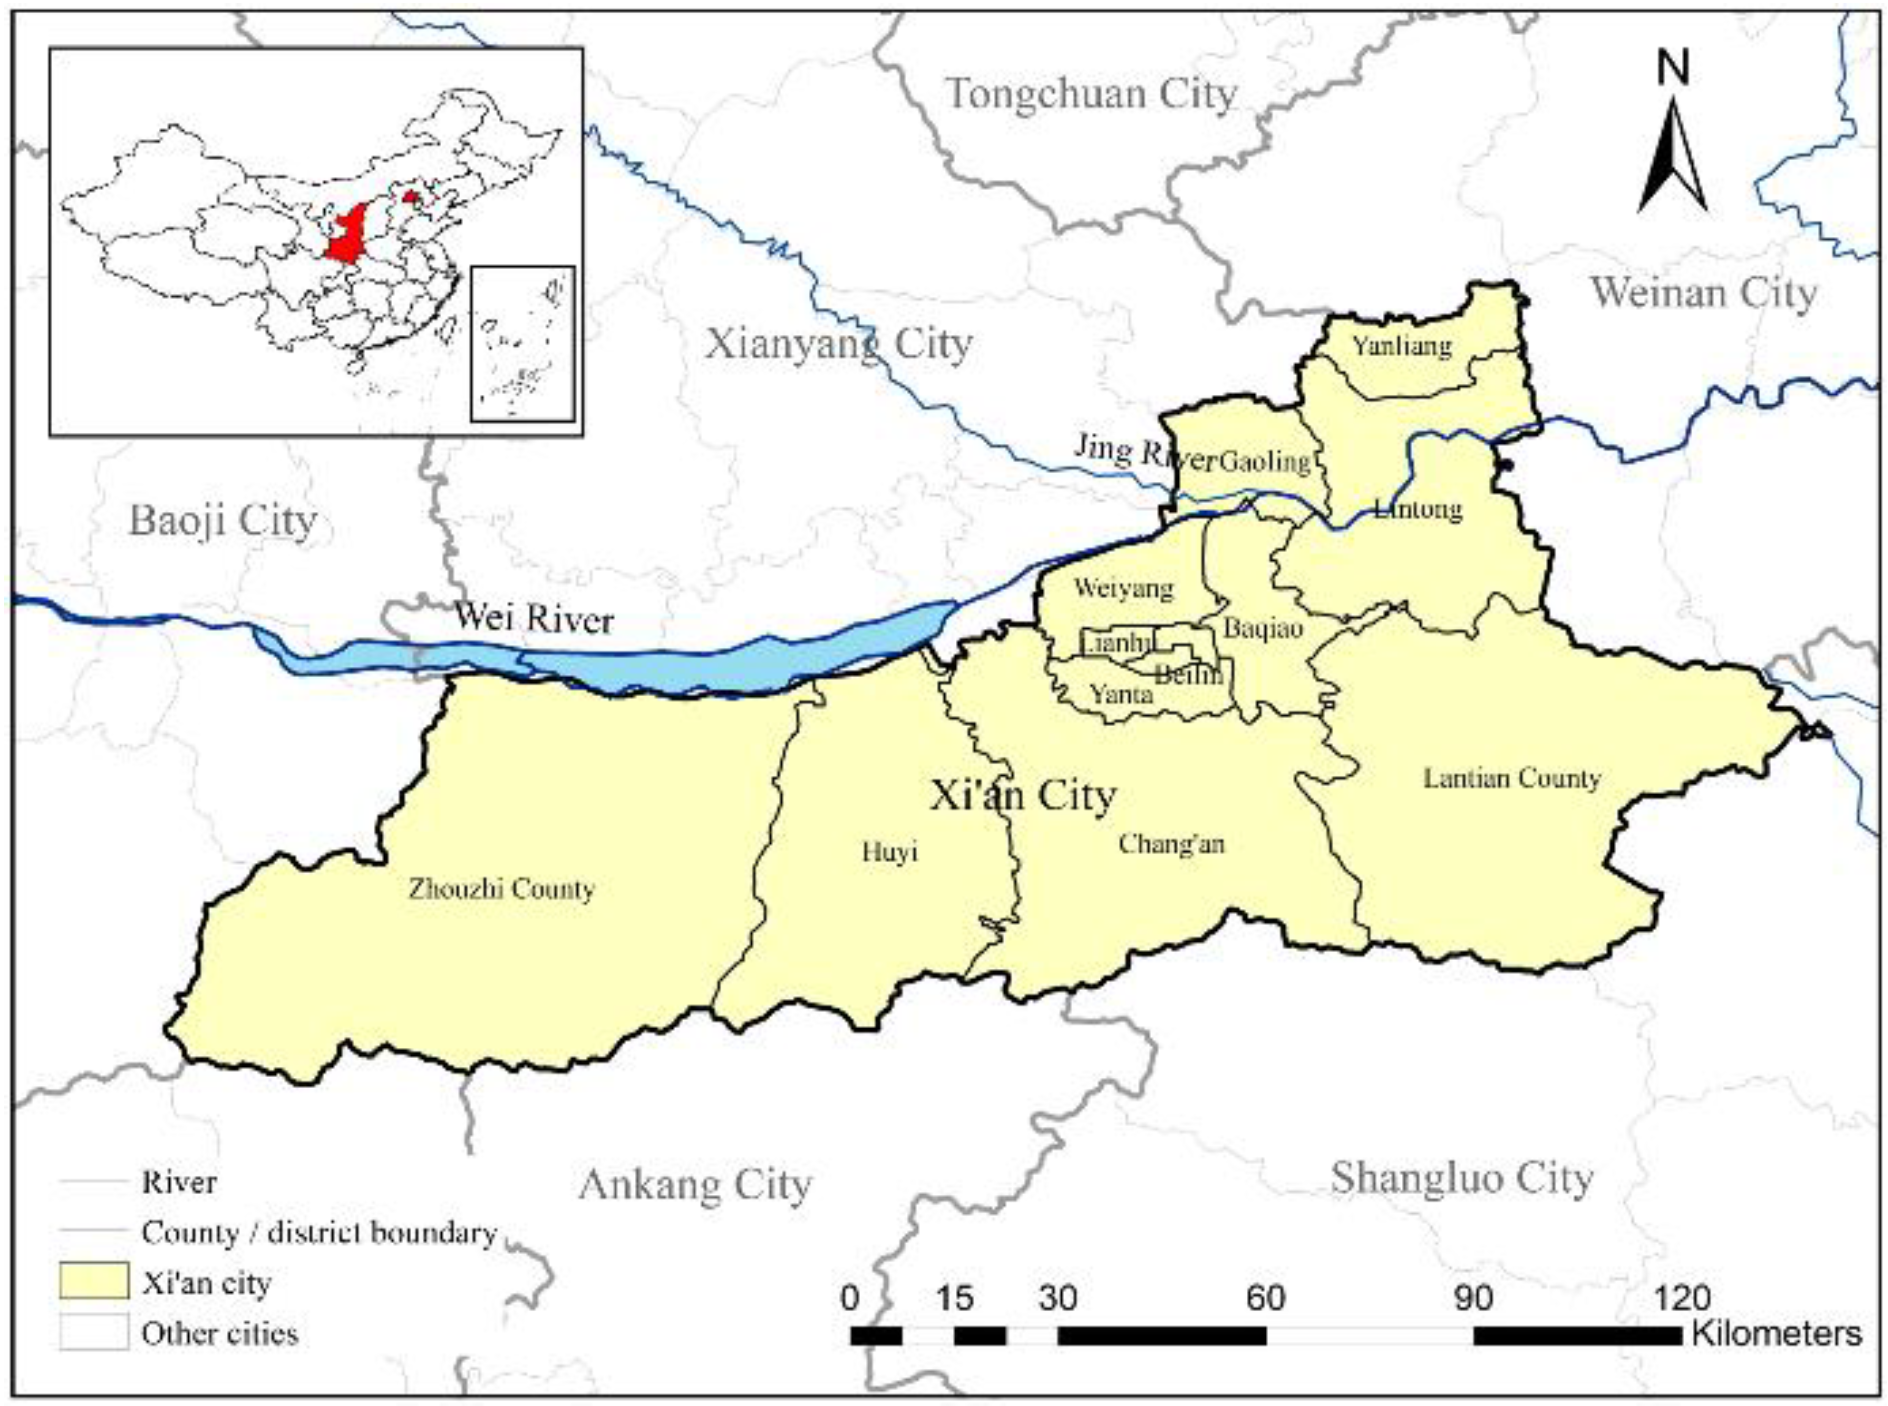
2.1. Description of the Study Area

Xi’an is located in the middle of the Yellow River Basin in Shaanxi Province, with an area of 9983 km2; the regional general situation is shown in Figure 1. Xi’an is a major industrial city in Shaanxi Province, as well as a major trade center and manufacturing base in China, with a rich output of industrial products [48]. At the same time, it is also a famous historical and cultural city, and the service industry is developing rapidly. According to the “Xi’an Statistical Yearbook (2014–2020)”, Xi’an’s resident population and the GDPs of three industries have increased year by year. By the end of 2020, the city’s resident population was 12.96 million, and the regional GDP was USD 156.57 billion. According to the “Xi’an Water Resources Bulletin (2014–2020)”, from 2014 to 2020, the average annual precipitation of the city was 678.43 mm, the average surface-water resources were 1.904 billion m3, the average groundwater resources were 1.289 billion m3, and the average total water consumption was 1813.27 million m3. The temporal and spatial distribution of the runoffs of the major rivers (Wei River, Jing River, etc.) in Xi’an is uneven [49], and usually only 2% of the annual runoff occurs in February of the dry season, while 45–56% of the annual runoff occurs in the flood season [50]. The natural conditions and the rapid development of the social economy in Xi’an are bound to have a great impact on the development and utilization of the water resources. According to the calculation, in 2020, the per capita water resources of Xi’an were only 213 m3, which were far lower than the per capita water resources of the whole country and of Shaanxi Province, and much lower than the critical value of 1000 m3, which is internationally recognized as the standard that must be met for a region to maintain economic and social development. Xi’an is a city with extreme water shortages [48]. In this case, a quantitative analysis of the economic and social value of the water resources and the water-supply benefits in Xi’an will help to comprehensively understand the role of water resources in economic and social development, and to realize the sustainable management of water resources. The research on the economic and social value of water resources and water-supply benefits is not only one of the important means to realize the sustainable utilization of regional water resources, but it is also an important part of the sustainable development strategy.
The original data of the natural conditions and the water supply in Xi’an from 2014 to 2020, according to the “Xi’an Water Resources Bulletin (2014–2020)”, are shown in Table 1.

2.2. Emergy Theory

Water resources have two attributes, which are, namely, the ecological attribute and the socioeconomic attribute. The water-resource ecosystem and the water-resource socioeconomic system are interrelated and blend with each other. They constitute a complex giant system, which is, namely, the water-resource eco-economic system. Therefore, in order to study the social and economic value of water resources, it is necessary to link the ecosystem with the socioeconomic system where the water resources exist, and to make a comprehensive analysis. The water-resource eco-economic system is shown in Figure 2, which describes, in detail, the flow of the different energies in the water-resource eco-economic system: the natural water body in the ecosystem contains the energy of renewable resources, such as solar energy, wind energy, earth-rotation energy, and rainwater energy. In order to make the natural water body flow into the socioeconomic system for use, it must be developed. The energy to be invested into the process of development includes human, material, and financial resources. The energy acts on the natural water and converts it into engineering water, which is then put into the socioeconomic system for production and social life.
However, because of the different properties of the different substances in nature and in human society, it is hard to create statistics and to make a comparison between them, which makes it more difficult to accurately measure the contribution value of the water resources to the social economy. Therefore, in order to solve this problem, this paper introduces emergy theory.
Emergy is defined as the amount of another kind of energy that is contained in a flowing or stored energy, which is the emergy of the energy [34]. It is generally believed that all energy comes from solar energy. Therefore, when calculating the emergy of each material, solar energy is often used as the benchmark to convert and measure the energy of other substances. The solar energy that is directly or indirectly needed to form a substance is the solar emergy of the substance, and the unit is solar emjoules (sej).
The calculation of the emergy of substances is shown in Equation (1) [34]:
E M = τ s × Q ,
In the equation, E M is the emergy of the substances, with the unit of sej; τ s is the solar emergy transformity of the substances, with the unit of sej/j or sej/g; and Q is the energy or quality of the substances, with the unit of J or g.
The core of the conversion from material energy to material solar emergy is to choose the appropriate transformities and convert the raw data into the amount that is based on the solar emergy. Odum, Lan, and other scholars have obtained the solar emergy transformities of the main substances in the eco-economic system through a lot of research [33,34], which provides a solid foundation for the ecological and economic value accounting of water resources and the sustainability analysis of the ecological and economic system.
On the basis of emergy theory, this paper analyzes the emergy of the economic and social system in Xi’an from three parts. The first part is the raw-data-processing model. Through the model, the input and output materials in the economic and social system are transformed into energy for the subsequent calculation of the substances’ emergies. The second part is the multisource water-body-transformity model. For urban water supplies, the emergy transformity of natural water is not enough, and the emergy input in water conservancy projects should also be considered. Therefore, a water body should be divided into a natural water body (including rainfall) and an engineering water body. On this basis, the emergy transformities of the surface, or the underground natural water bodies, and the engineering water bodies are calculated, respectively, which provide a basis for analyzing the emergy input of the water resources in different systems. The third part is the benefit model of the economic and social water supply. The economic benefits of water resources include the water-supply benefits in industry, agriculture, and the tertiary industry, and the social benefits of water resources include social security benefits (domestic and employment security), entertainment benefits, and scientific research benefits. Therefore, by analyzing the input and output of the material emergy in economic and social systems, we can obtain the contribution rate of water resources, and we can further obtain the value of the water resources in each system, as well as the benefits of the urban economic and social water supply.

2.2.1. Raw-Data-Processing Model

The emergy analysis of the economic and social system is the quantitative analysis of the input and output of various material emergies into the economic and social system. The resources that are invested in the economic and social system include renewable resources and nonrenewable resources, and the outputs are mainly industrial products, agricultural products, social-labor-force recovery, scientific research papers, tourism income, etc. The quantity or energy of the inputs and outputs of these resources is the raw data that are needed for the emergy analysis. Then, according to Equation (1), the energy or quantity of the raw data is multiplied by the corresponding emergy transformity to obtain the emergy of the inputs and outputs. In the raw data, the calculations of the amounts of the main substances are shown in Equations (2)–(4):
E s = A × R s ,
In the equation, E s is the solar energy, in the unit of J; A is the area of the study region, in the unit of m2; and R s is the annual average solar radiation, in the unit of J/(m2·a).
The calculation of wind energy is shown in Equation (3):
E w = H × ρ w × α × S G × A ,
In the equation, E w is the wind energy, in the unit of J; H is the height, using 1000 m; ρ w is the wind density, using 1.23 kg/m3; α is the eddy diffusion coefficient, in the unit of m2/s; and S G is the wind-speed gradient, using 3.154 × 10⁷ s/a.
The energy calculation of raw materials, fuels, and products is shown in Equation (4):
E = C × ε ,
In the equation, E is the energy of the substances, in the unit of J; C is the annual consumption or output of the substances, in the unit of g or t, respectively; and ε is the corresponding energy conversion coefficient [34], in the unit of J/g or J/t, respectively.

2.2.2. Multisource Water-Body-Transformity Model

According to the characteristics of the natural–artificial composite water cycle, the water body is divided into natural water (including rainfall) and engineering water. Natural water is surface water and groundwater that is formed through the precipitation hydrological process. Engineering water is the natural water after considering the investment of water conservancy projects. The specific calculations are as follows:
  • The natural-water-body-transformity model
The main source of natural water is natural rainfall, and its emergy transformity is calculated as shown in Equations (5)–(8):
τ k N = E M p / A W k ,
E M p = C E p × τ p ,
A W k = W k / U k ,
C E p = P × G × A × ρ ,
In the equations, τ k N is the transformity of the natural water body, in the unit of sej/m3; k = 1, 2, represent the surface and underground, respectively; E M p is the annual total emergy of the precipitation in the catchment area, in the unit of sej; A W k is the annual catchments of the natural water body, in the unit of m3; C E p is the chemical energy of the precipitation, in the unit of J; τ p is the transformity of the chemical energy of the precipitation, using 18,200 sej/J [34]; W k is the total amount of water, in the unit of m3; U k is the renewal period of the water body, using 0.03 a of surface water, and 100 a of groundwater; P is the average annual rainfall, in the unit of m; G is the Gibbs free energy of the rain, using 4.94 J/g [34]; and ρ is the density of the rainfall, using 1 × 10⁶ g/m3.
2.
Engineering-water-body-transformity model
Engineering water is the natural water after considering the investment of water conservancy projects (including capital, labor, operation, and management costs, etc.), and the water body at this time contains the added value of the project investment. The calculation of the emergy transformity of an engineering water body is shown in Equation (9):
τ k E = E M I k / E W k ,
In the equation, τ k E is the transformity of the engineering water, with the unit of sej/m3; E M I k is the total emergy input of the water conservancy project, with the unit of sej; and E W k is the amount of water that is affected by the project, with the unit of m3.

2.2.3. Benefit Model of Economic and Social Water Supply

By analyzing the emergy of the input and output in the economic and social system, the contribution rate of water resources can be calculated, and then multiplied by the system output to obtain the water-supply benefit.
In the economic system, the related industries include agriculture, industry, and the tertiary industry. The input of each production system includes all kinds of renewable resources and nonrenewable resources, and the output is mainly the emergy of the products. Among them, according to the “Industry classification of national economy” (GB/T 4754-2011), the tertiary industry includes all kinds of service industries, including tourism, finance, catering, etc. Since the output of the tertiary industry is nonphysical output and cannot be measured by specific products, this paper uses the GDP of the tertiary industry instead for its approximate output.
Talcott Parsons, in his book The Social System, defined the social system as the composition of individual or group-interaction behaviors [51], which shows that human beings are the subject in the social system. From the perspective of the Marxist labor value theory, we should understand value in the practical relationship between the subject and the object, and we should regard value as the relationship between the attribute of the object and the needs of the subject, and as a certain meaning of object to subject. Therefore, value can be defined as the meaning of the existence, attribute, and development of the object to the subject’s material and spiritual life in social practice [52]. It can be seen that the social value of water resources should be reflected in the satisfaction and benefits of maintaining people’s quality of life and their social spiritual needs. This paper abstractly summarizes it as: social security benefits (maintaining people’s quality of life), entertainment benefits, and scientific research benefits (meeting social spiritual needs). Among them, the social security benefits of water resources can be abstracted into the benefits of domestic water supplies and employment security. By analyzing the input and output emergy in the domestic system, the benefits of the domestic water supply can be obtained. Since the inputs of food and nonfood in the domestic system maintain human life and health, the output of the domestic system can be abstracted as the value of the labor-force restoration, which can be calculated by the product of per capita disposable income and the Engel coefficient that can best reflect the people’s quality of life [32]. Because the input and output of employment security, entertainment, and scientific research cannot be measured by material objects, the employment security benefits of water resources can be directly calculated by the number of water-related employees and the corresponding transformity. The benefits of entertainment and scientific research can be measured by the annual tourism income that is related to water and the number of relevant papers.
  • Water contribution rate (WCRi)
The WCRi is a relative index to measure the contribution of water resources to the total output of the system (i). It is the ratio of the water emergy input to the total emergy input in the system (i). (i = 1, 2, 3, and 4, respectively, represent industry, agriculture, the tertiary industry, and the domestic system. WCR1, WCR2, WCR3, and WCR4, respectively, represent the water contribution rates of industry, agriculture, the tertiary industry, and the domestic system). The calculations are shown in Equations (10) and (11):
W C R i = W U E i / E I i ,
E I i = E M i r + E M i n ,
In the equations, i = 1, 2, 3, and 4, respectively, for industry, agriculture, the tertiary industry, and the domestic system; W C R i is the water contribution rate in the system (i), with the unit of %; W U E i is the water emergy input into the system (i), with the unit of sej; E I i is the total emergy input into the system (i), with the unit of sej; E M i r is the emergy input of the renewable resources into the system (i), including solar energy, wind energy, water resources, etc., with the unit of sej; E M i n is the emergy input of the nonrenewable resources in the system (i), including fuel, raw materials, fertilizer, labor, investment, food, nonfood household consumption, etc., with the unit of sej.
2.
Water-supply-benefit model
The WCRi is multiplied by the emergy output (EOi) of the system (i), and it is then combined with the ratio of the emergy to the currency, and the water consumption of the system (i), the water-supply benefit (Bi), and unit-water-resource value (WRVi) of the system (i) can be obtained, respectively. The calculations are shown in Equations (12)–(14):
M i = W C R i × E O i ,
B i = M i / E D R ,
W R V i = B i / W U i ,
In the equations, i = 1, 2, 3, and 4, respectively, for industry, agriculture, the tertiary industry, and the domestic system; M i is the emergy value of the water resources in the system (i), with the unit of sej; B i is the water-supply benefit in the system (i), with the unit of $; W R V i is the unit-water-resource value in the system (i), with the unit of $/m3; E O i is the emergy output in the system (i), with the unit of sej; E D R is the ratio of the emergy to the currency, using 3.02 × 10¹² sej/$ [53]; and W U i is the water consumption in the i system, with the unit of m3.
As mentioned in Section 2.2.3, because the input and output of the employment security, entertainment, and scientific research cannot be measured by material objects, the employment security benefits of water resources can be directly calculated by the number of water-related employees and the corresponding transformity. The benefits of entertainment and scientific research can be measured by the annual tourism income that is related to water and the number of relevant papers. The employment security benefits (B5), entertainment benefits (B6), and scientific research benefits (B7) of water resources are shown in Equations (15)–(23):
M 5 = ( N 1 + N 2 ) × τ 5 ,
B 5 = M 5 / E D R ,
W R V 5 = B 5 / W U ,
M 6 = B 6 × E D R ,
B 6 = I × μ ,
W R V 6 = B 6 / W U 5 ,
M 7 = T × P × τ 7 ,
B 7 = M 7 / E D R ,
W R V 7 = B 7 / W U ,
In the equations, M 5 is the employment security value of the water resources, with the unit of sej. B 5 is the employment security benefit of the water resources, with the unit of $. W R V 5 is the employment security value of the unit water, with the unit of $/m3. M6 is the entertainment value of the water resources, with the unit of sej. B6 is the entertainment benefit of the water resources, with the unit of $. WRV6 is the entertainment value of the unit water, with the unit of $/m3. M7 is the scientific research value of the water resources, with the unit of sej. B7 is the scientific research benefit of the water resources, with the unit of $. WRV7 is the scientific research value of the unit water, with the unit of $/m3. N1 is the number of employees in the agriculture, forestry, animal husbandry, and fishery industries. N2 is the number of employees in the water conservancy industry. τ 5 is the transformity of the human labor force, using 1.74 × 10¹⁵ sej/person/year [33]. WU is the total water consumption of the society’s economy and ecology, with the unit of m3. I is the annual tourism income, with the unit of $. μ is the proportion of water-related tourism resources in all of the tourism resources in Xi’an, using 1.3%. WU5 is the ecological water consumption, with the unit of m3. T is the number of academic papers that are related to water that have been published. P is the average number of pages per paper, using 6 pages. τ 7 is the transformity of the academic papers, using 3.39 × 10¹⁵ sej/p [54].

3. Results

3.1. Raw Data Processing

The raw data of the inputs and outputs in the economic and social system in Xi’an from 2014 to 2020 were collected. Most of these data are in tons, but the corresponding transformity unit is usually sej/j. Therefore, it is necessary to convert the units of these data into joules for the subsequent emergy calculation. (The emergy transformity units of some substances are given in sej/t, so the raw data of these substances do not need to be processed.)
Taking the industrial system in 2019 as an example, the energy of the substances in the system can be calculated according to Equations (2)–(4), as is shown in Table 2.

3.2. Natural- and Engineering-Water-Body Transformities

To facilitate the calculation, the natural water is summarized as the surface water and the groundwater, and the transformity of the natural water and the engineering water from 2014 to 2020 are calculated, respectively.
Taking 2019 as an example, according to Table 1 and Equations (5)–(8), the chemical energy of the rainwater ( C E p ), the precipitation emergy ( E M P ), the annual catchments of natural water ( A W k ), and the transformity of natural water ( τ k N ) can be calculated in turn. (k = 1, 2, represent the surface and underground, respectively).
However, in order to study the engineering-water-body transformity, it is necessary to clarify the emergy input of the water conservancy project. By the end of 2019, 92 reservoirs, 49 hydropower stations, 101 pumping stations, 27 sluice projects, and 133,957 electro-mechanical wells had been built in Xi’an city. Because it is not realistic to calculate the emergy transformity of the engineering water body of each water conservancy project one by one, the surface water and groundwater projects are simplified into reservoirs, pumping stations, and water-diversion works. Because of the lack of information about the construction, operation, and management costs of each project, this paper refers to the analysis in [54] (i.e., the cost of the reservoirs, pumping stations, and water-diversion works are 0.178 $/m3, 0.038 $/m3, and 0.045 $/m3, respectively). The emergy of the cost with the unit of sej/m3 can be obtained by multiplying the cost by the emergy currency ratio (EDR). Since the engineering water is the natural water after considering the investment of the water conservancy projects, the cost emergy plus the natural water transformity can obtain the engineering water transformity ( τ k E ).
The calculation results of the natural and engineering water transformities in Xi’an from 2014 to 2020 are shown in Table 3.

3.3. Benefits of Economic and Social Water Supply in Xi’an

3.3.1. Benefits of Economic Water Supply in Xi’an

The industrial, agricultural, and tertiary industries are mainly considered for the economic water supply in Xi’an. Taking the industrial system of Xi’an in 2019 as an example, according to Equation (1), the emergy of the substances in the system can be obtained by multiplying the raw data of the substances by the corresponding emergy transformity. The calculation is shown in Table 4.
Similarly, the emergy input and output of the industrial system from 2014 to 2020 can be obtained, as shown in Figure 3 and Figure 4.
According to Table 1 and Table 4, Figure 3 and Figure 4, and Equations (10)–(13), the E I 1 , E O 1 , W C R 1 , B 1 , and WRV1 in the industrial system from 2014 to 2020 can be calculated, as shown in Table 5.
From 2014 to 2020, in the Xi’an agricultural and tertiary industry systems, the emergy input (EI2, EI3), the emergy output (EO2, EO3), the water contribution rate (WCR2, WCR3), the water-supply benefit (B2, B3), and the unit-water-resource value (WRV2, WRV3) are calculated, in turn, with reference to the industrial system. The results are shown in Table 6 and Table 7.

3.3.2. Benefits of Social Water Supply in Xi’an

In the social system, the WCR4, B4, WRV4, B5, WRV5, B6, WRV6, B7, and WRV7 from 2014 to 2020 in Xi’an are calculated according to Equations (10)–(23). The results are shown in Table 8 and Table 9. The raw data required for the calculation are from the Xi’an Statistical Yearbook (2014–2020) and the Water Resources Bulletin (2014–2020).

4. Discussion

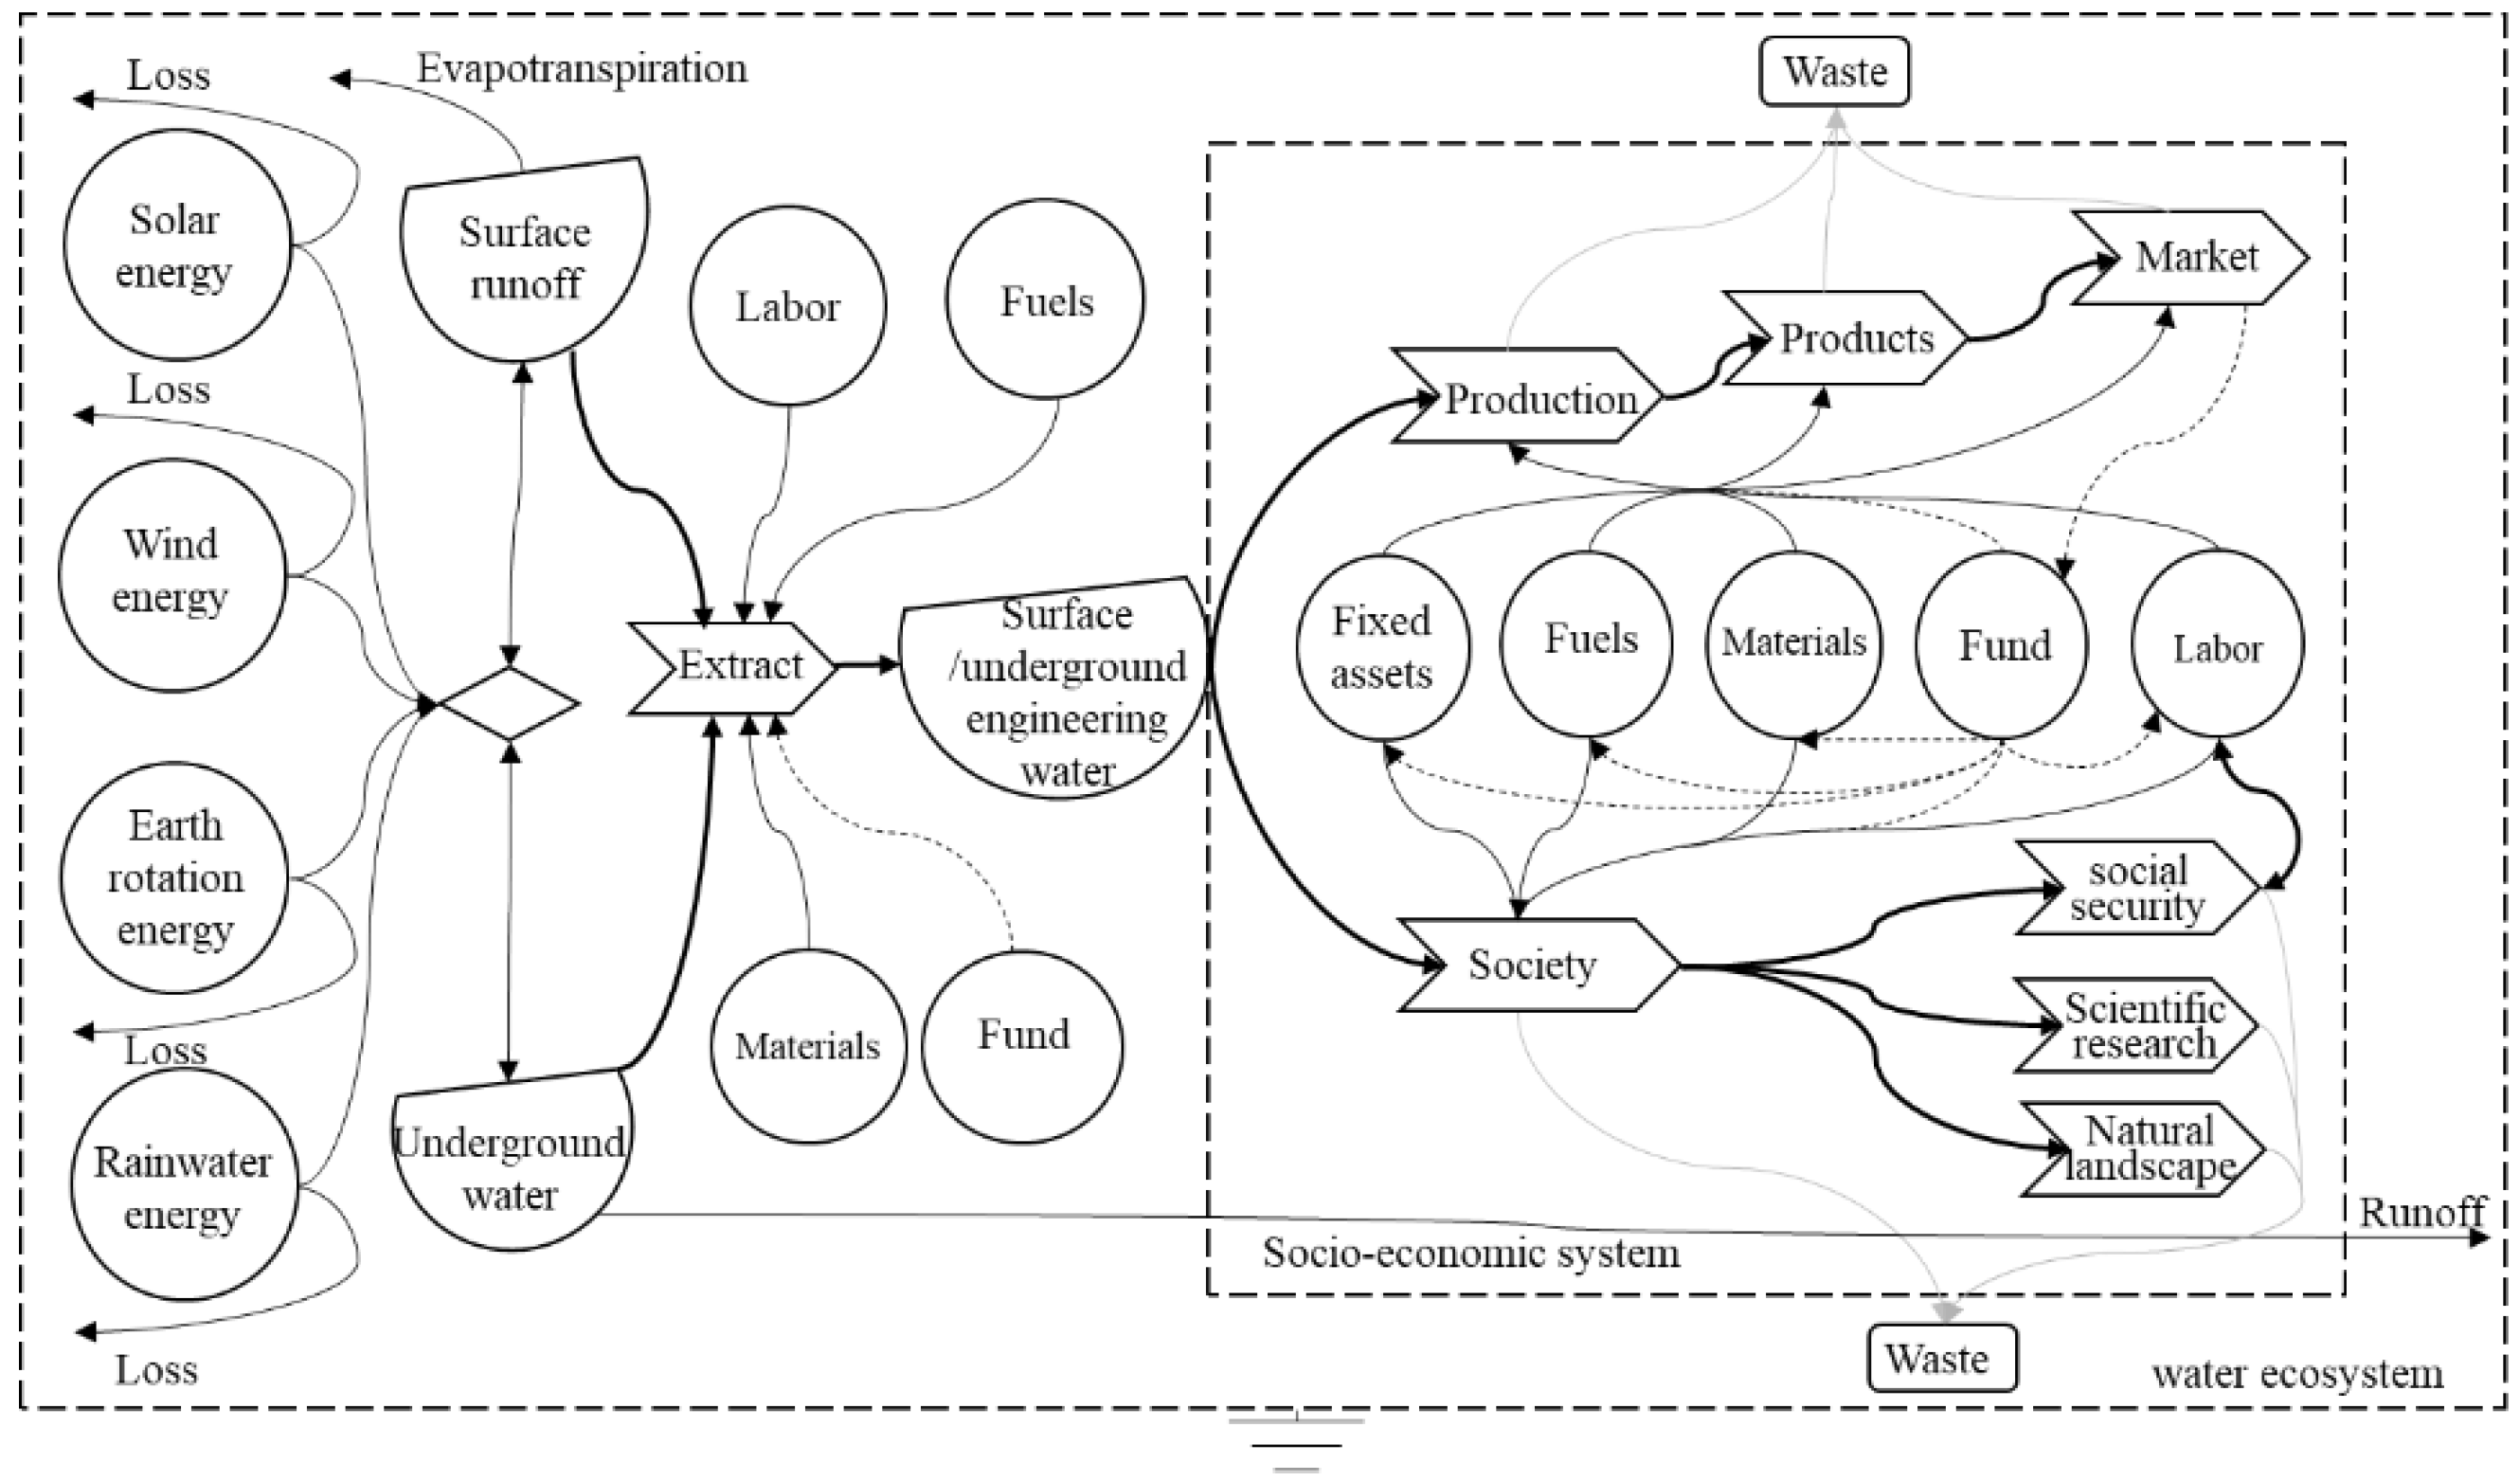
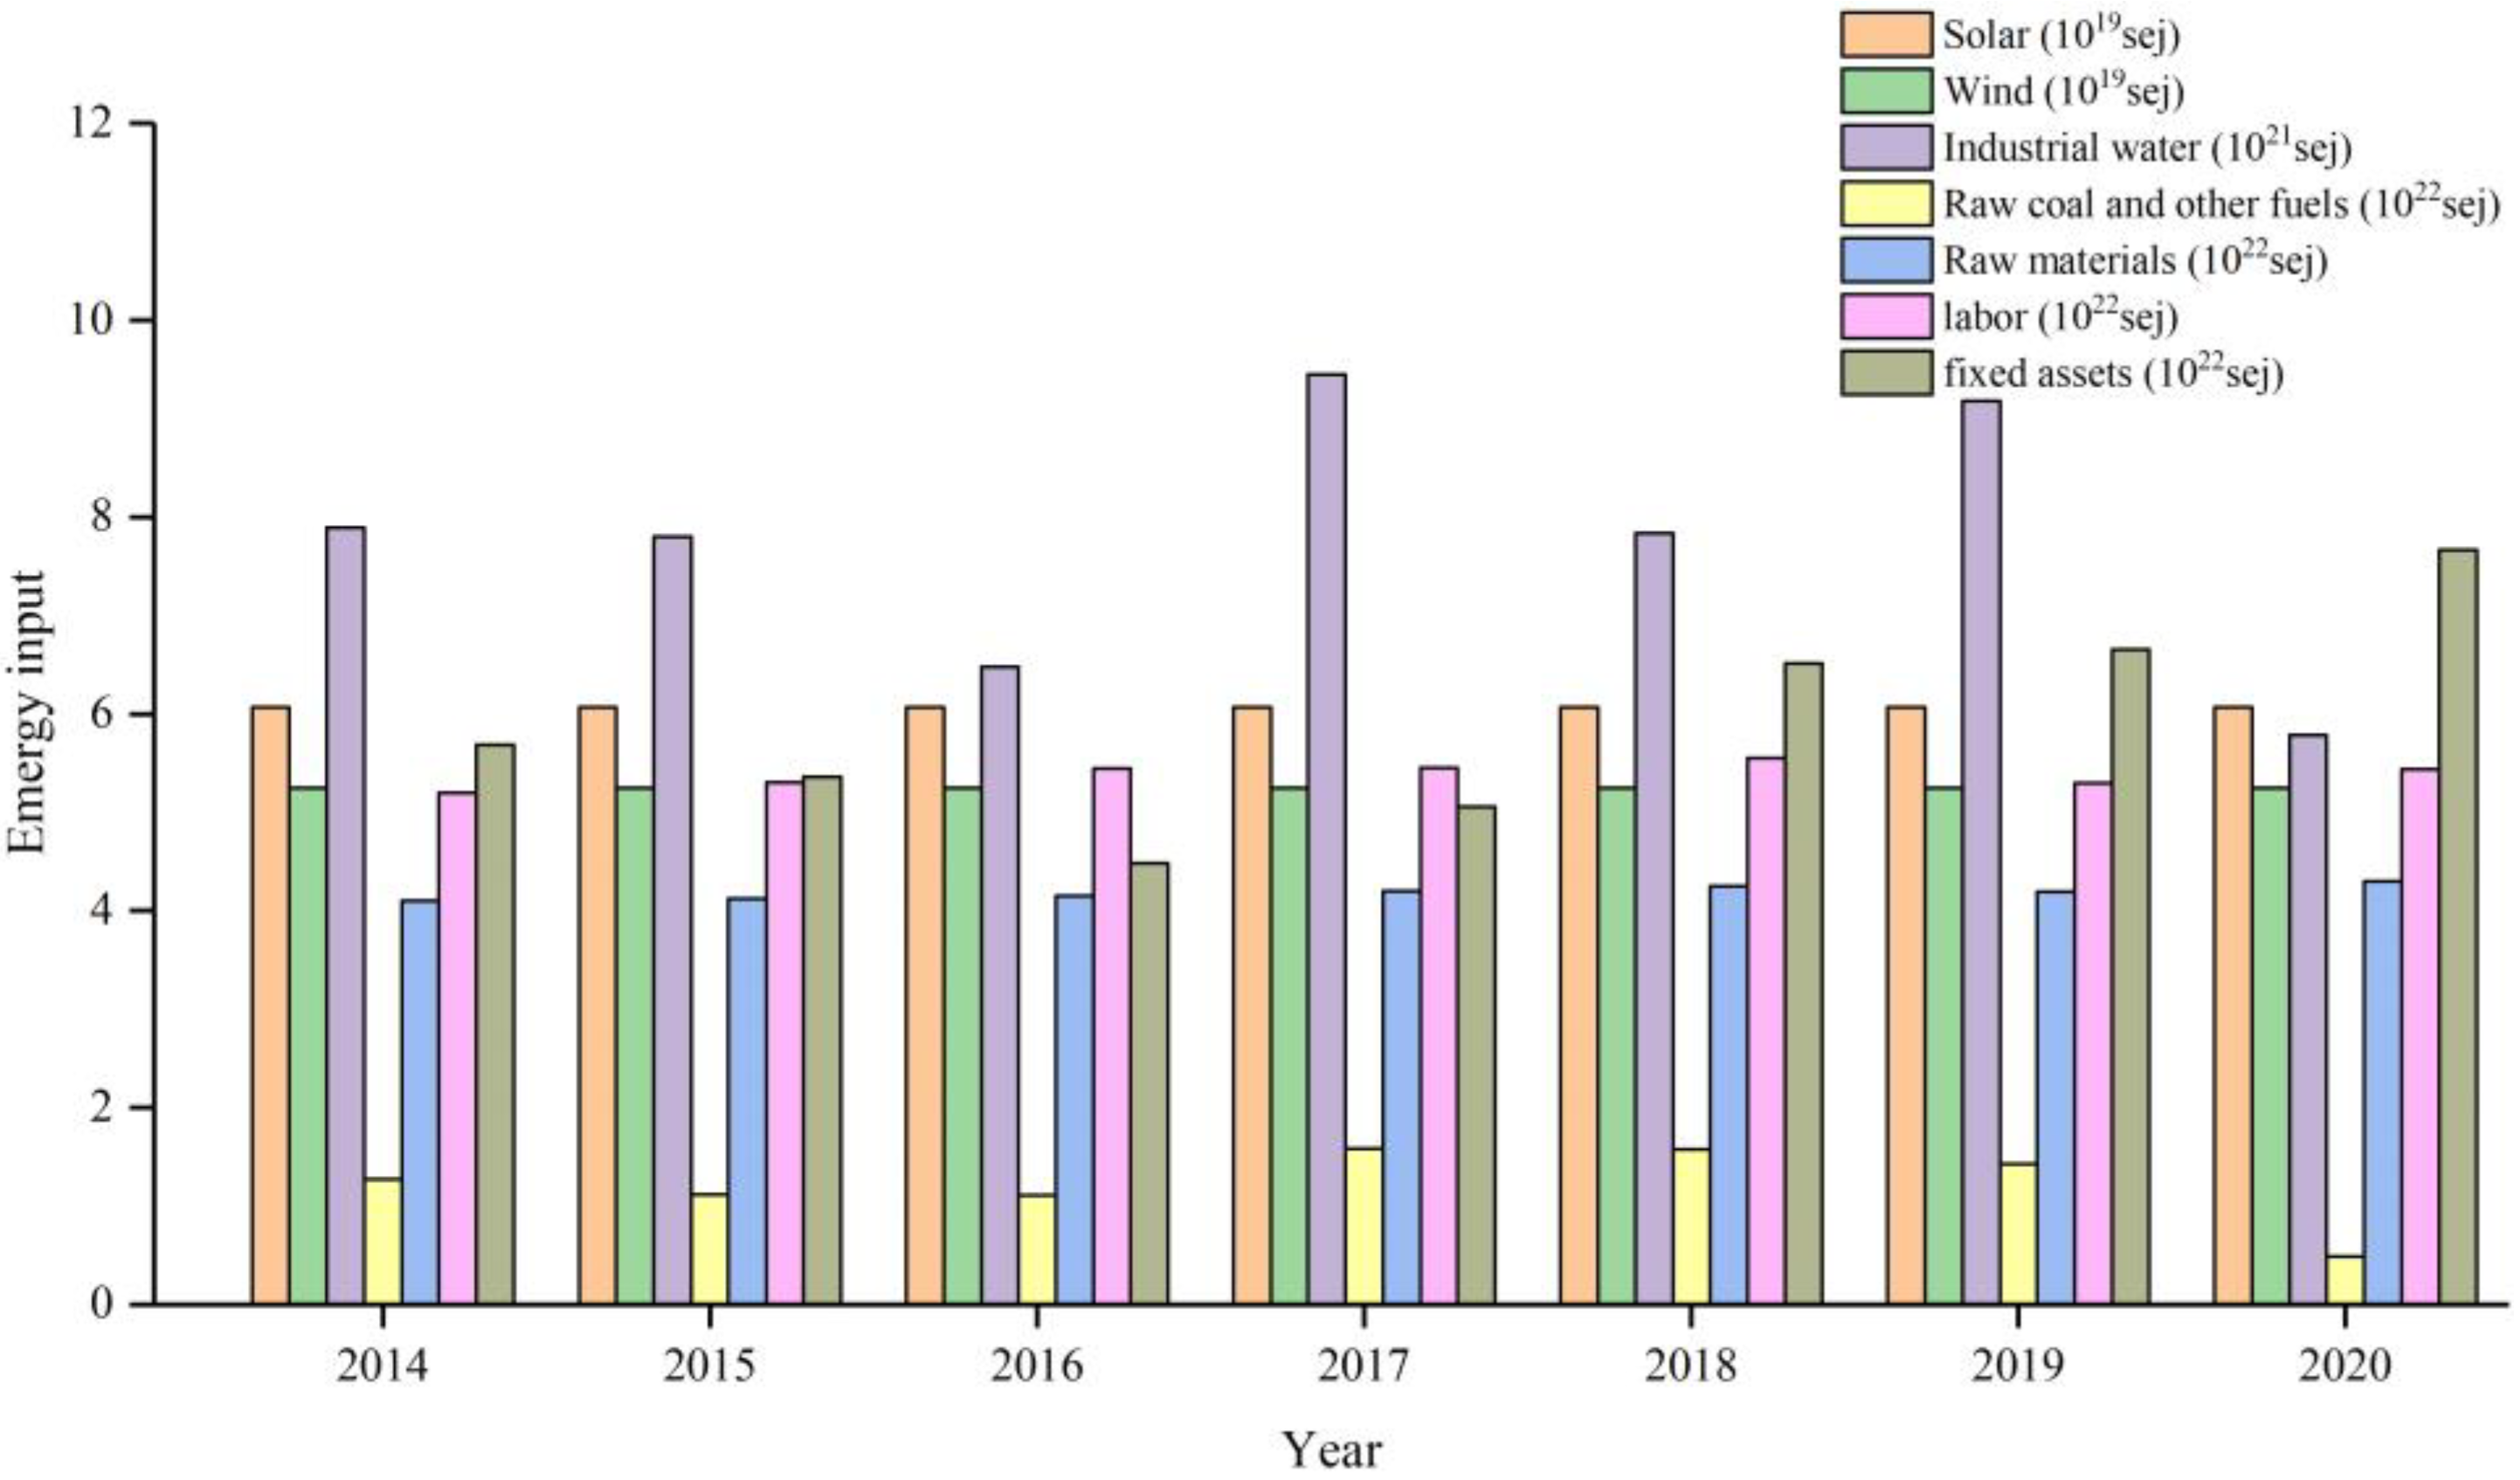
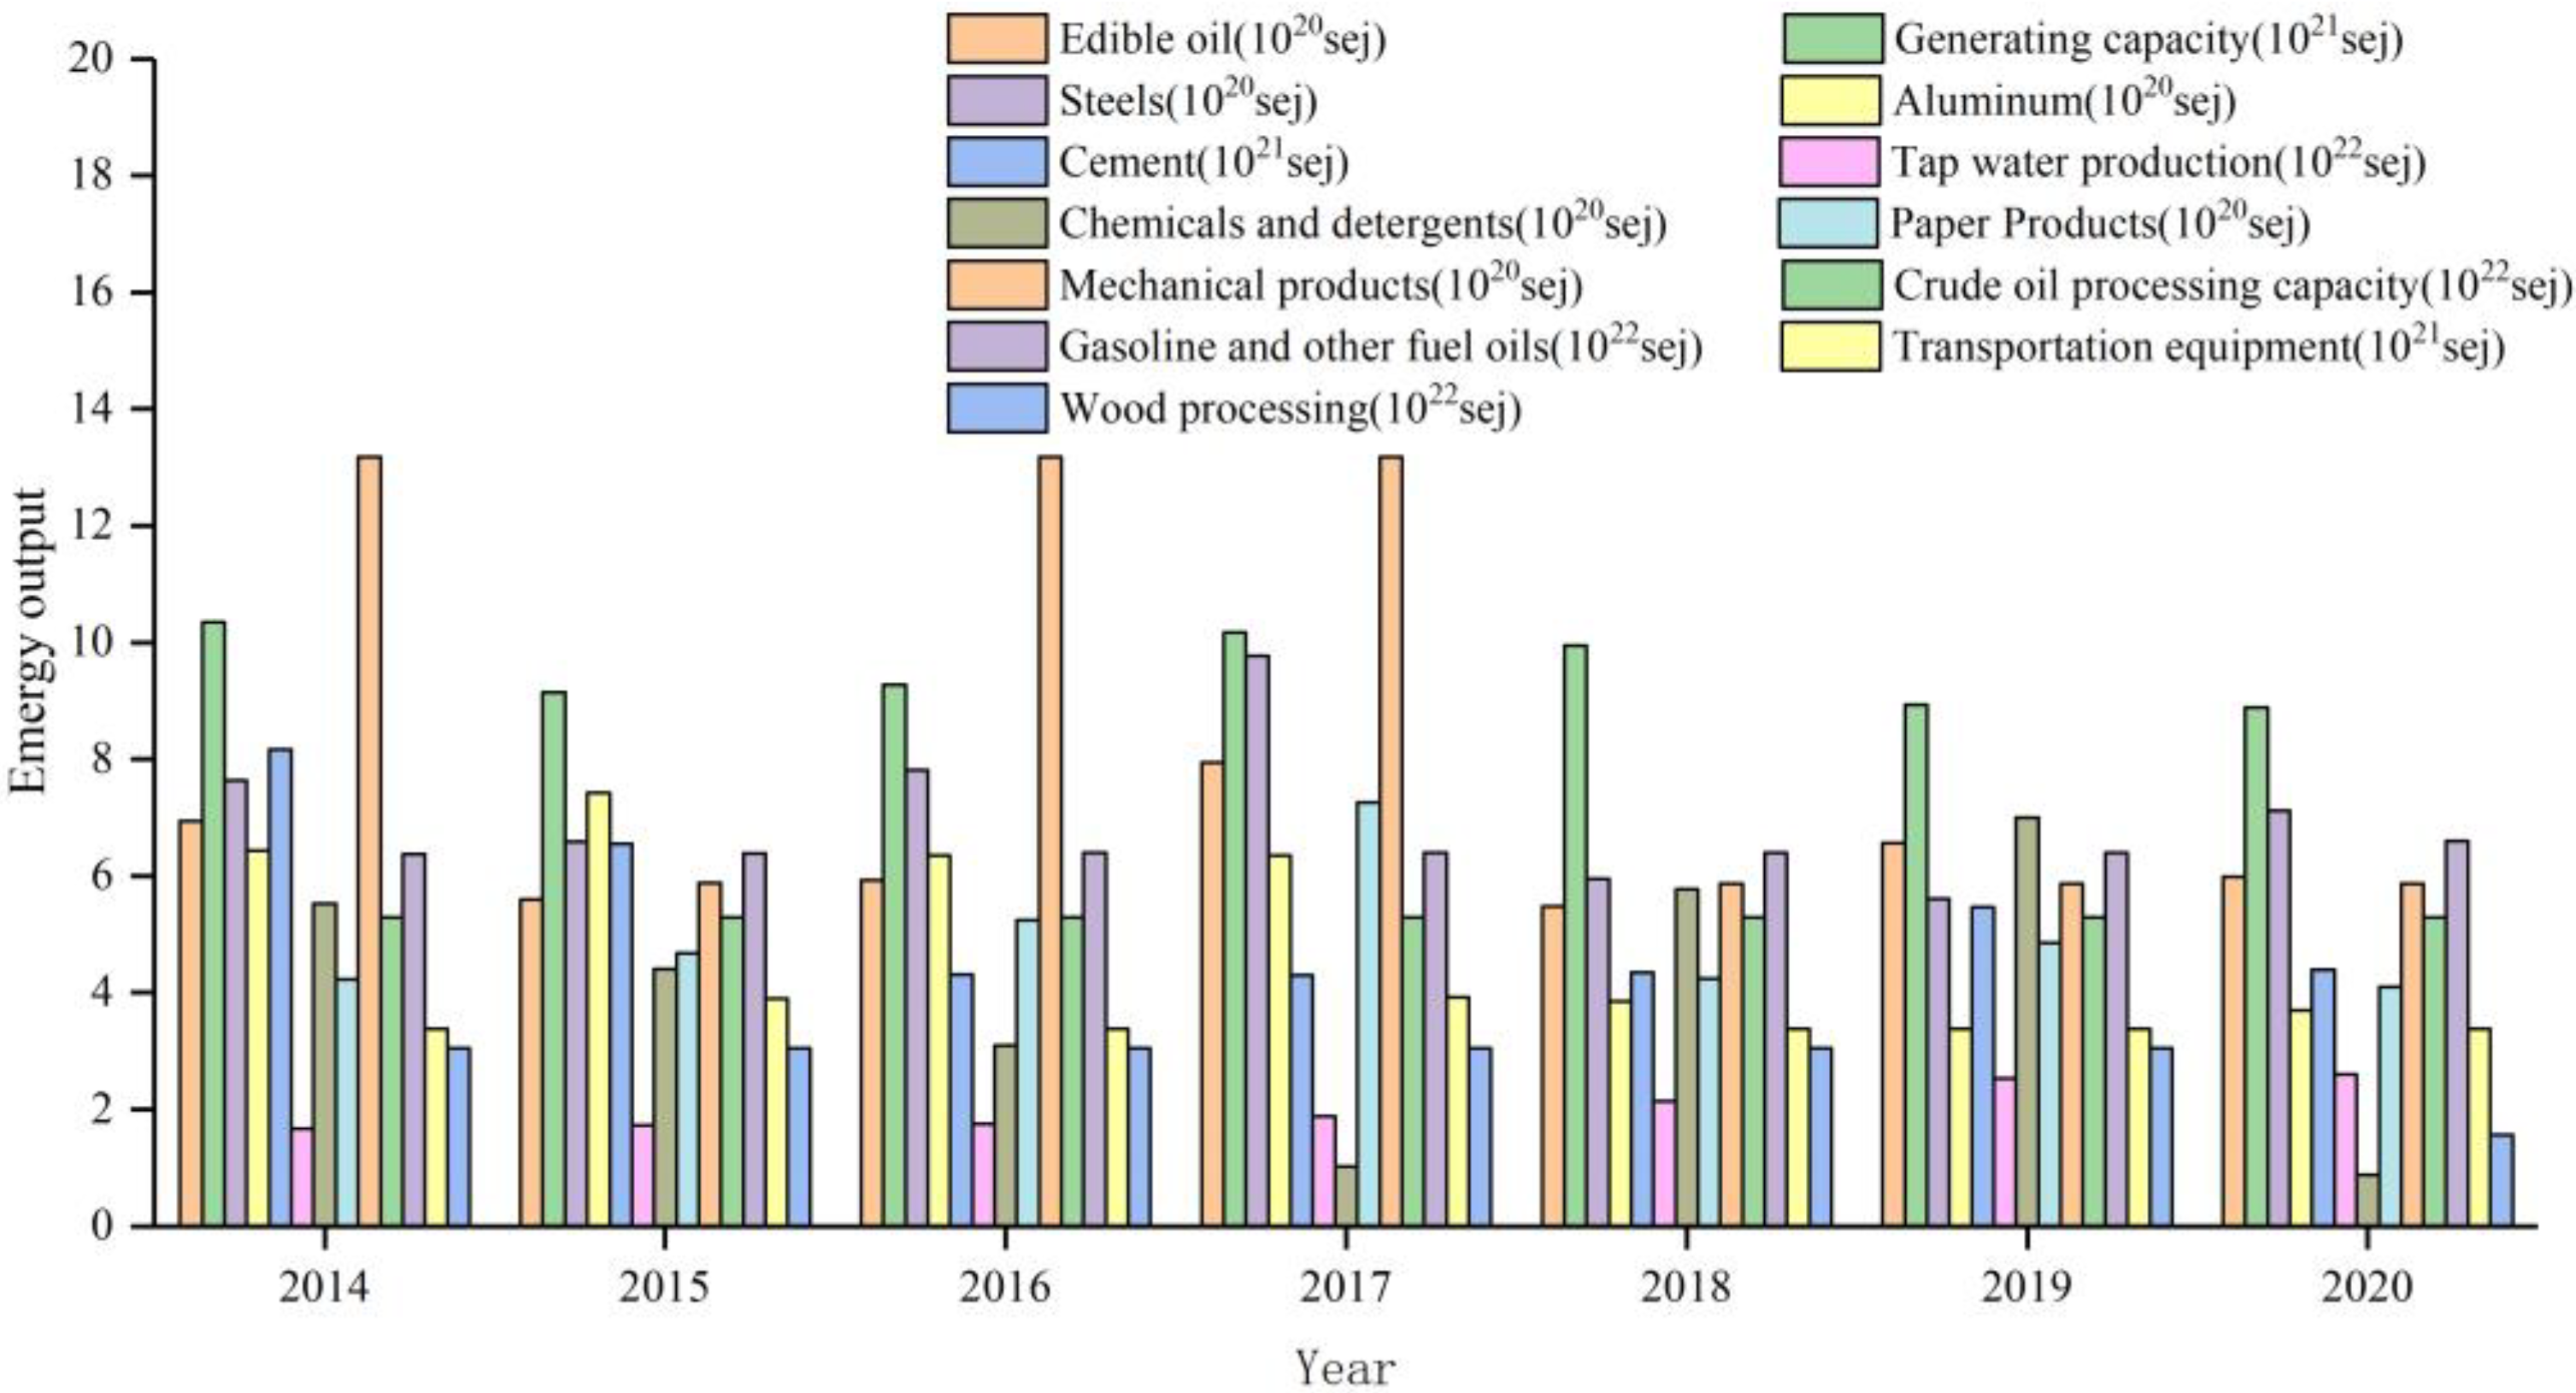
4.1. Inputs and Outputs in Economic System

  • Input and output in industrial system
It can be seen from Table 5 that, in the industrial system of Xi’an, from 2014 to 2020, the WCR1 was the largest in 2017, accounting for 5.53%, and the corresponding EO1 and B1 were also the largest, accounting for 1974.19 × 1020 sej and 3.61 × 10⁹$, respectively. The trend comparison between the WCR1 and the EO1 is shown in Figure 5a. The average WCR1 and the average contribution rates of the other main inputs of the industrial system are shown in Figure 5b.
It can be seen from Figure 5a,b that, in the industrial system, compared to the other inputs, although the WCR1 was small, the EO1 was still affected by it, and the two are positively correlated with each other. The Pearson correlation coefficient ( ρ ) is the most commonly used linear correlation coefficient: ρ [ 0.4 , 0.6 ] is a medium positive correlation, ρ [ 0.6 , 0.8 ] is a strong positive correlation, and ρ [ 0.8 , 1.0 ] is a very strong positive correlation. After calculation, the Pearson correlation coefficient ( ρ 1 ) between the WCR1 and the EO1 in the industrial system from 2014 to 2020 is 0.52, which is a medium positive correlation, which indicates that there is a certain degree of waste of water resources in industrial production, and that there is still room for improvement in the water-use efficiency. In order to further improve the utilization efficiency of industrial water resources, we should continue to strengthen the management of industrial water, vigorously develop water-saving technology, and actively streamline the production process.
2.
Input and output in agricultural system
It can be seen from Table 6 that, in the agricultural system, from 2014 to 2020, the input of the water resources accounted for a large proportion. Moreover, the WCR2 reached more than 50% in most years, which is mainly because the growth of the crops largely depended on the water supply. The trend comparison between the WCR2 and the EO2 is shown in Figure 6a. The average WCR2 and the average contribution rates of the other main inputs of the agricultural system are shown in Figure 6b.
It can be seen from Figure 6a,b that, in the agricultural system, compared to the other inputs, the input of the water resources accounted for the largest proportion, and the changing trends of the WCR2 and the EO2 were basically the same. After calculation, the Pearson correlation coefficient ( ρ 2 ) between the WCR2 and the EO2 is 0.72, which is a strong positive correlation. This shows that the output of agriculture, as the largest water user, is greatly affected by water resources.
3.
Input and output in tertiary-industry system
It can be seen from Table 7 that, in the tertiary-industry system, from 2014 to 2020, the input of the water resources was very small, and the WCR3 in each year was only about 1.0%. The trend comparison of the WCR3 and the EO3 is shown in Figure 7a, and the average WCR3 and the average contribution rates of the other main inputs of the tertiary-industry system are shown in Figure 7b.
It can be seen from Figure 7a,b that, in the tertiary industry, compared to the other inputs, although the WCR3 was very small, the changes between the WCR3 and the EO3 tended to be consistent, and the latter was obviously affected by the former. After calculation, the Pearson correlation coefficient ( ρ 3 ) between the WCR3 and the EO3 is 0.85, which is a very strong positive correlation.

4.2. Inputs and Outputs in Social System

In the social system, the social value generated by water resources is mainly reflected in the satisfaction and benefits in people’s lives, health, and spiritual pursuits. The output of the water-resource social system includes the labor-force restoration of the residents, the water-related employees, the water-related tourism income, and scientific research papers. The input of the system mainly includes water resources, food, food services, nonfood consumption, etc. It can be seen from Table 8 and Table 9 that, in the social system, the B4 was greater than the B5, and far greater than the B6 and the B7. This also shows that water resources, as the basic resources for human survival, played a significant role in social security and affected people’s life quality, to a large extent. Among the many tourism resources, the investment in water-related tourism resources in Xi’an was very small from 2014 to 2020, accounting for only 1.3% of all the tourism resources, which led to low entertainment benefits from the water resources.

4.3. Differences in Water-Supply Benefits among Industries

The water-supply benefits and the unit-water value in the economic and social system are shown in Figure 8a,b. It can be seen from Figure 8 that there were obvious differences in the water-supply benefits and the unit-water-resource values in different industries in Xi’an from 2014 to 2020. In terms of the water-supply benefits: B1 > B2 > B4 > B3 > B5 > B6 > B7. In terms of the unit-water-resource values: WRV1 > WRV3 > WRV2 > WRV4 > WRV6 > WRV5 > WRV7. This was mainly because the output of the industrial system was much greater than that of other systems, and the socioeconomic value of the water resources mainly came from industrial production. This trend was also in line with the law of the market economy in most cities. It can be seen that the socioeconomic benefits of the water resources mainly came from industrial production. In the economic system and the social system, although the water-supply benefits fluctuated slightly in the study period, they showed an upward trend as a whole. Because of the vigorous development of the tertiary industry in recent years, its market share has become larger and larger, which has far exceeded that of industry and agriculture. Therefore, even if the B3 was small because of the small WCR3, the WRV3 was second only to the WRV1, and it had an increasing trend year by year.
The American scholars D’Odorico and Paolo et al. [56] define the value of irrigation water resources as the added value of the crop yield that is affected by irrigation ($/m3), and they measured the value of the irrigation water of different crops in the world (0.1 $/m3–1.2 $/m3). The Chinese scholars Wei Wang et al. [57] calculated the shadow price of the industrial water resources in China’s provinces by using the dual model of the nonradial distance function, and the average price in Shaanxi Province was 3.31 $/m3. When measuring the value of irrigation water and industrial water, they did not comprehensively consider the value of the natural water and engineering water, and so the result was too small. By using emergy theory, this paper considers both the natural-water value and the engineering-water value, and it considers the sources of the water resources (surface and underground) separately, which are obviously more accurate. In addition, when analyzing the output of the industrial system, Wei Wang et al. only considered the industrial GDP and did not consider the industrial products themselves, which may also lead to the undervaluation of the industrial products. The Korean scholars Won-Seok Lee et al. [22] measured the economic benefits of water for social life through the conditional valuation method (CVM). This method focuses on evaluating the nonmarket value of resources, and it has strong subjectivity, which can easily affect the reliability of the results because of internal deviation. By contrast, the emergy method that is used in this paper takes into account the market value (domestic-water-supply value) and nonmarket value (employment security, entertainment, and scientific research value) of the social water use, and the evaluation process is more comprehensive and objective.

5. Conclusions

This paper makes up for the defects of the current commonly used water-resource-value evaluation methods, such as the models of shadow price, marginal benefit, and cost–benefit, which fail to combine the ecological and socioeconomic attributes of water resources, and to quantify the input and output of the energy, material, and money in the eco-economic system uniformly. On the basis of emergy theory, this paper analyzes the emergy flow of the economic and social systems in Xi’an from 2014 to 2020, constructs an urban water-supply-benefit model, systematically evaluates the unit-water-resource value and water-supply benefits in various industries, and discusses the results. The conclusions are as follows:
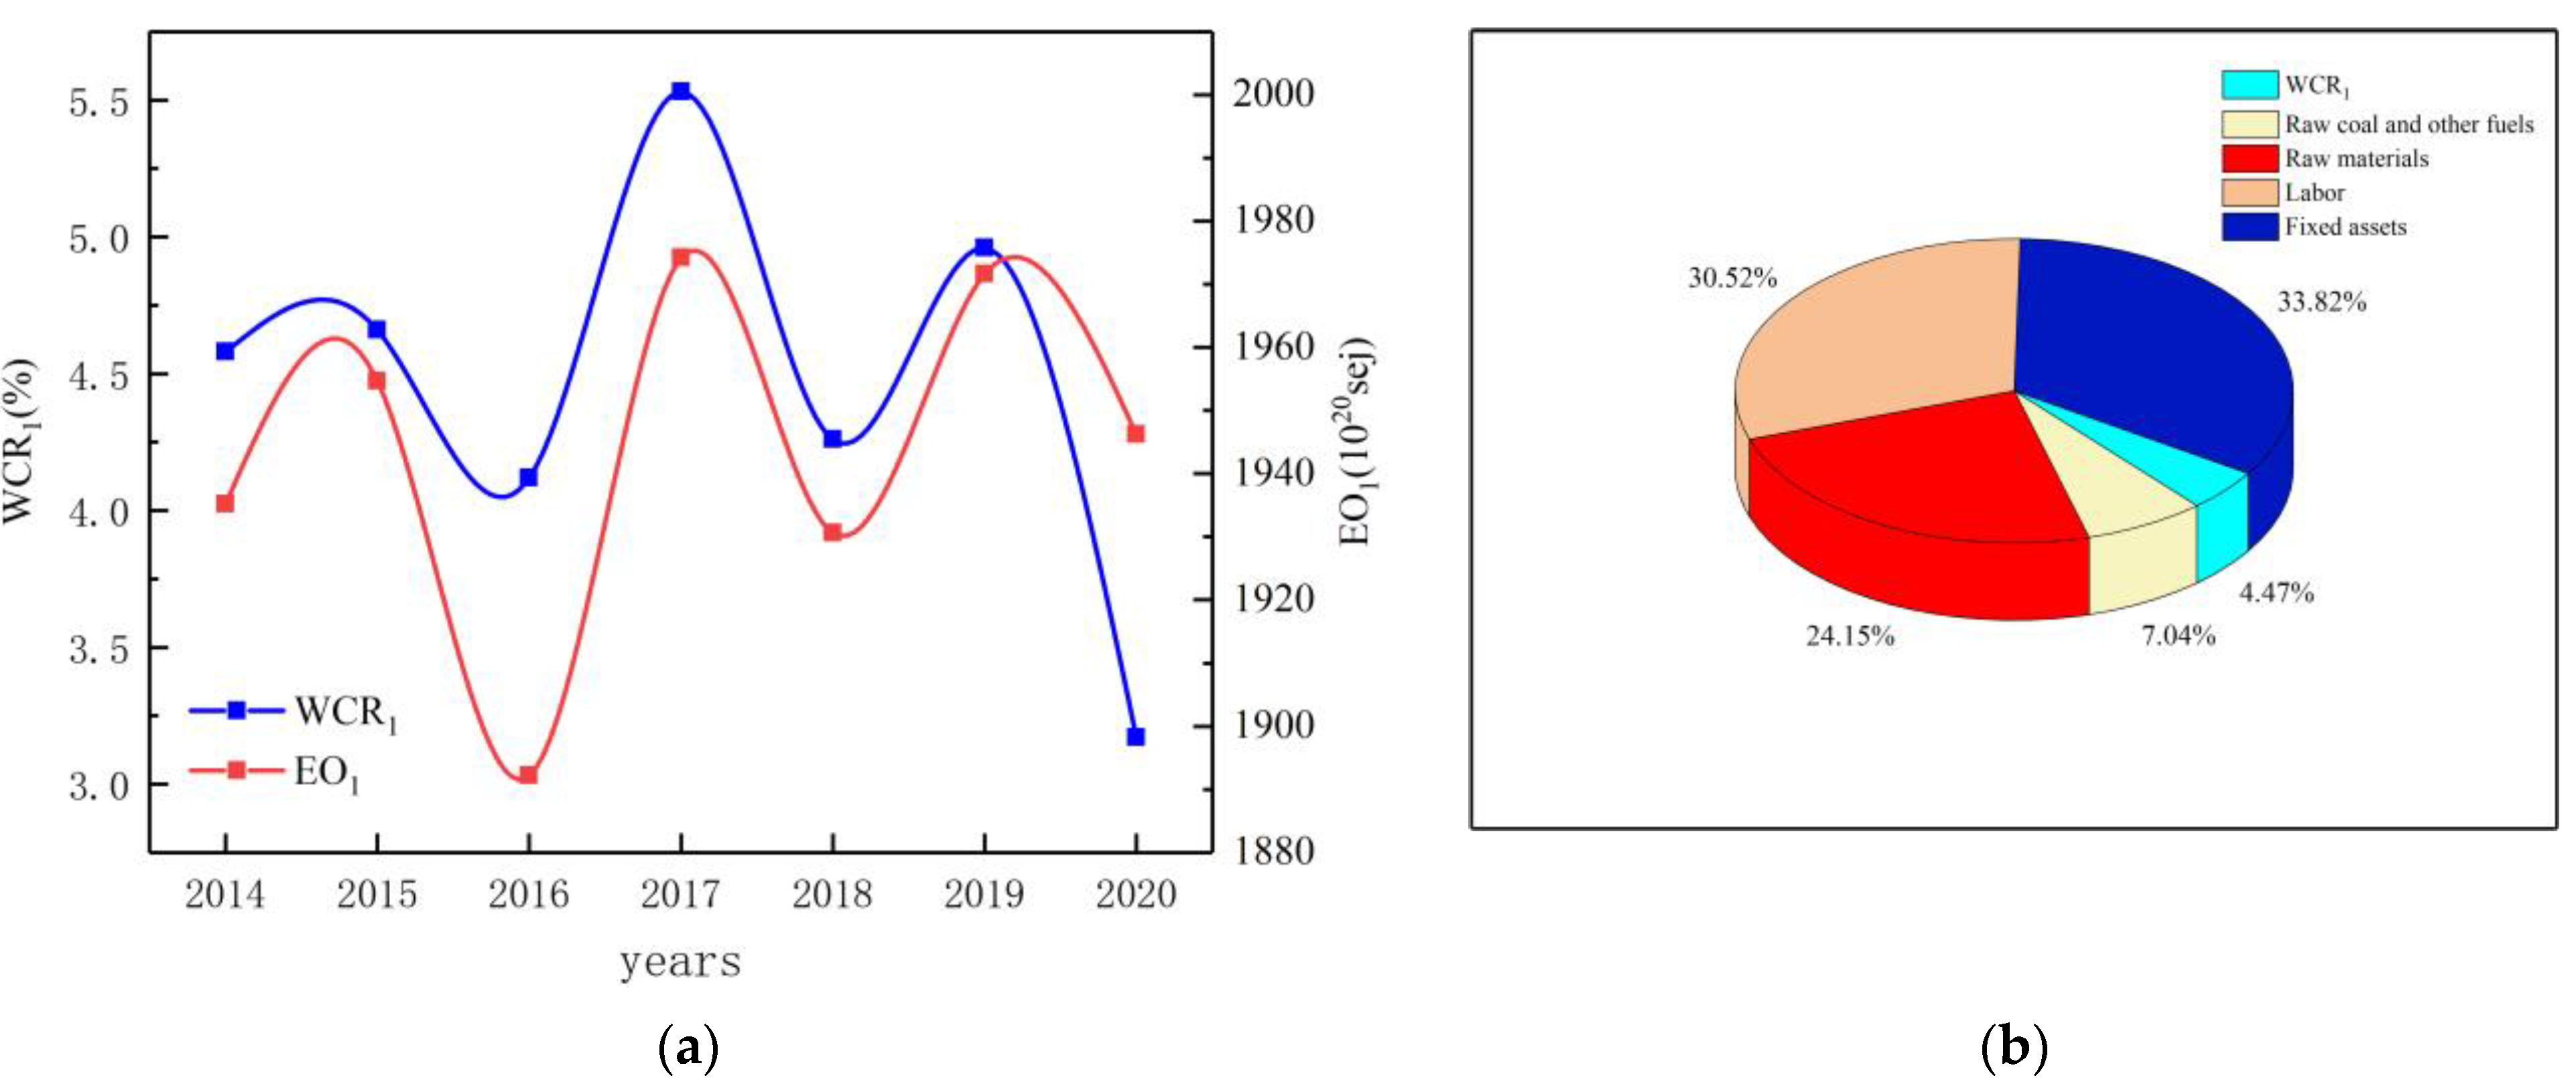
  • The dependence of industrial production on the water resources in Xi’an from 2014 to 2020 was relatively stable. Compared to other industries, the B1 and the WRV1 were the largest, and the socioeconomic value of the water resources mainly came from industrial production. In the industrial system, the WCR1 and the EO1 have a medium positive correlation with each other, and ρ1 was 0.52, which still has room for improvement, compared to ρ2 and ρ3. It can be seen that there might be a certain degree of waste of industrial water. The government should further strengthen the specification of the industrial water, vigorously develop water-saving technology, and actively streamline the production process, so as to improve the water-use efficiency and obtain greater B1 and total benefits;
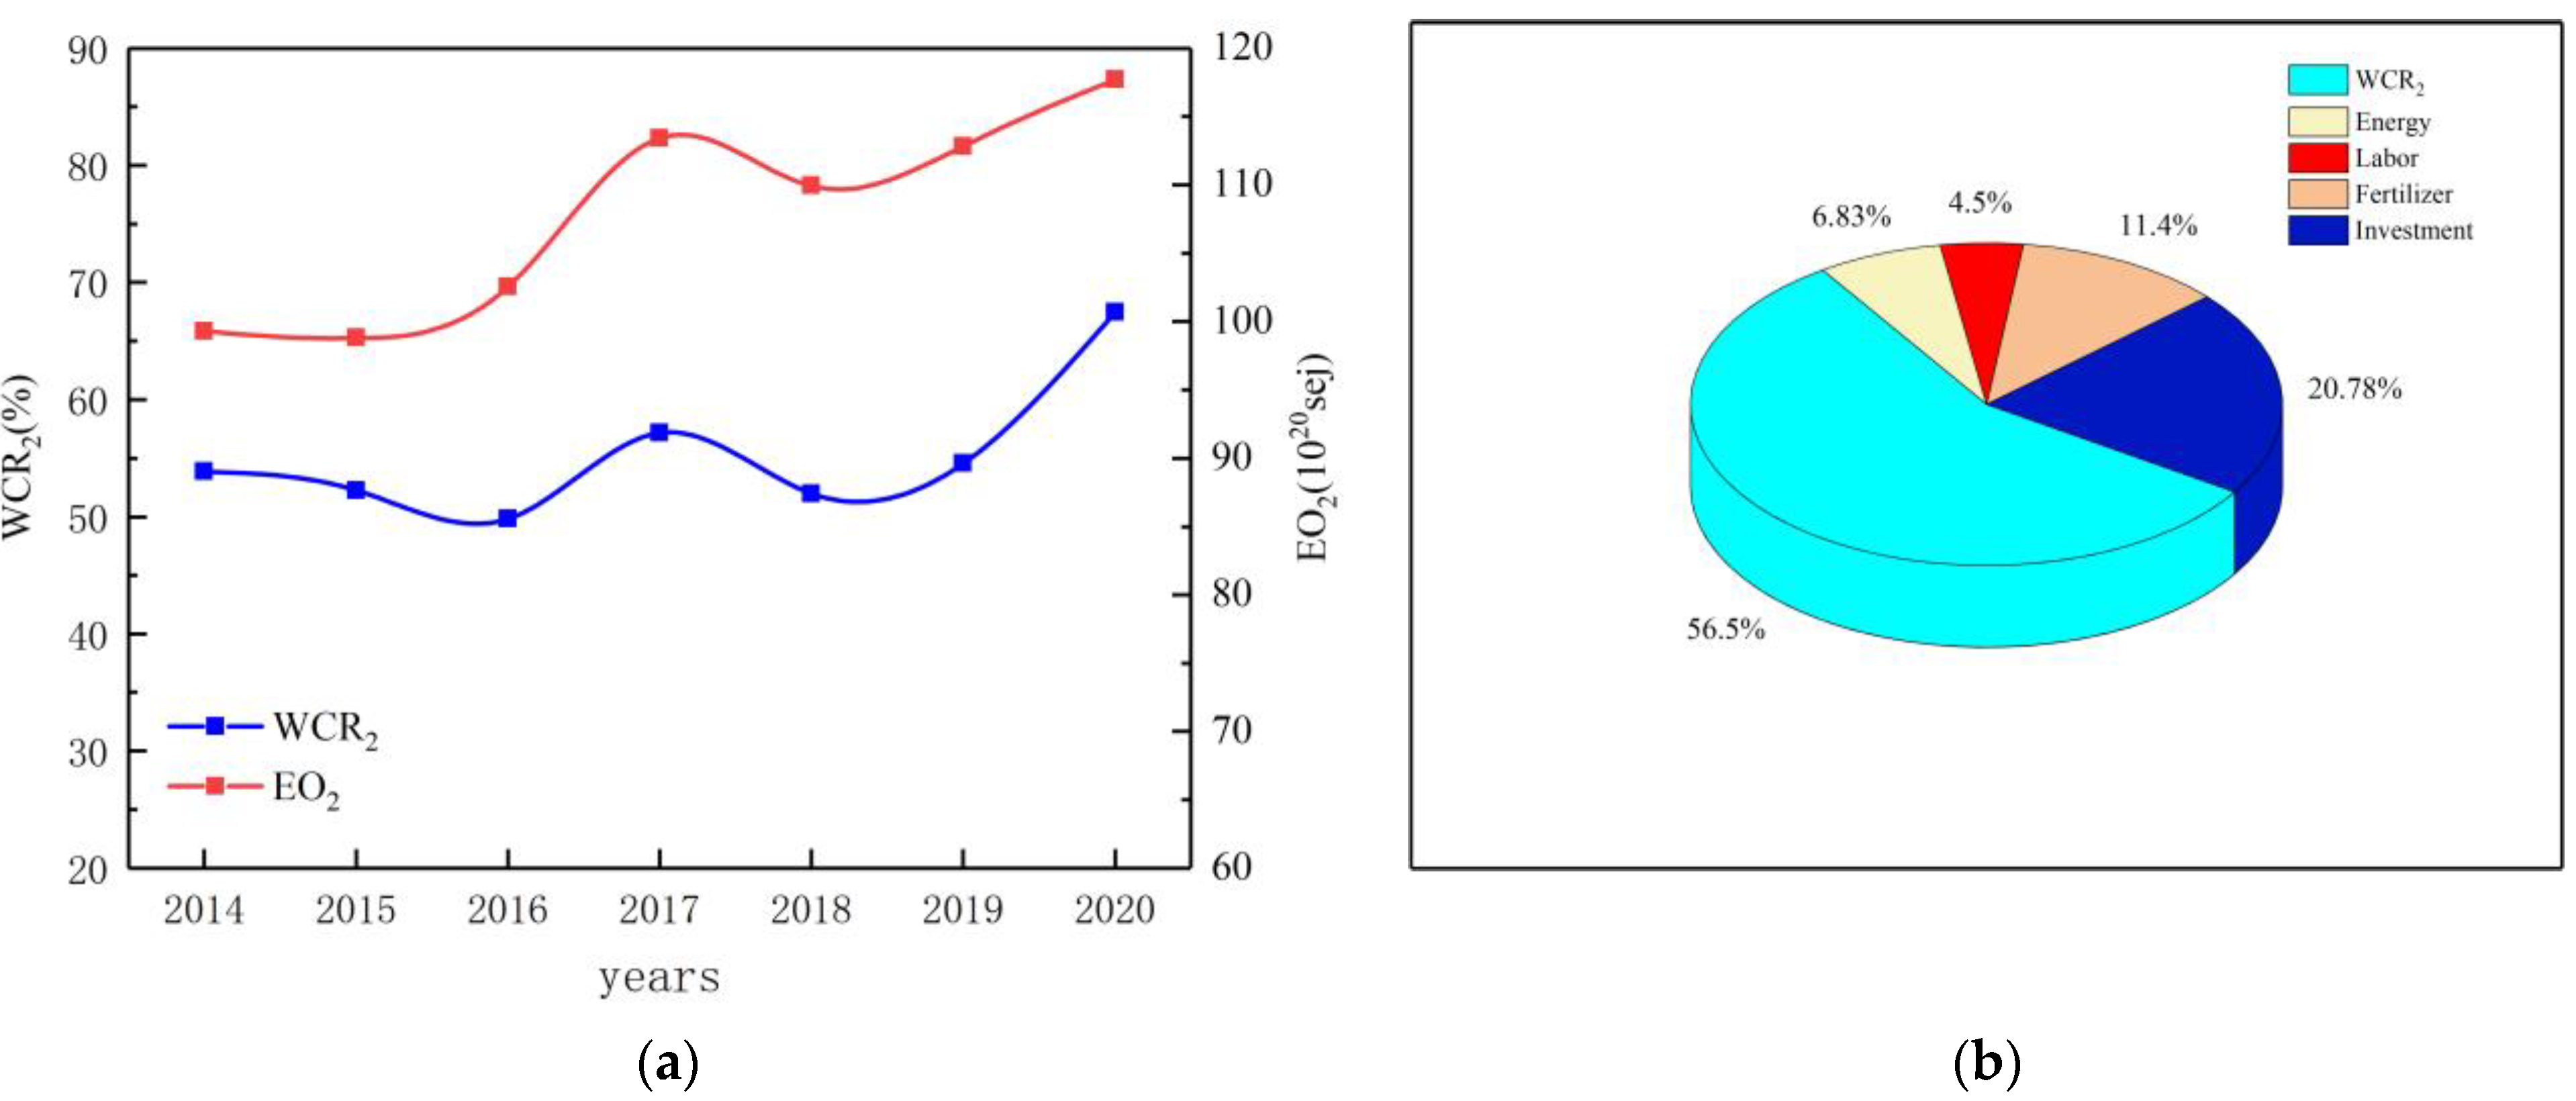
  • Compared to other industries, the input of the water resources into the agricultural system in Xi’an from 2014 to 2020 was the largest, and the agricultural production was extremely dependent on the water supply. However, the B2 and the WRV2 were lower than the B1 and the WRV1, which were related to the different character of the water-use sector, and this phenomenon was in line with the law of the market economy. There was a strong positive correlation between the WCR2 and the EO2 (ρ2 = 0.72), which indicates that, in the agricultural system, the WCR2 closely affects the EO2. The more water resources that are input into a certain range, the greater the B2 and total benefits will be;
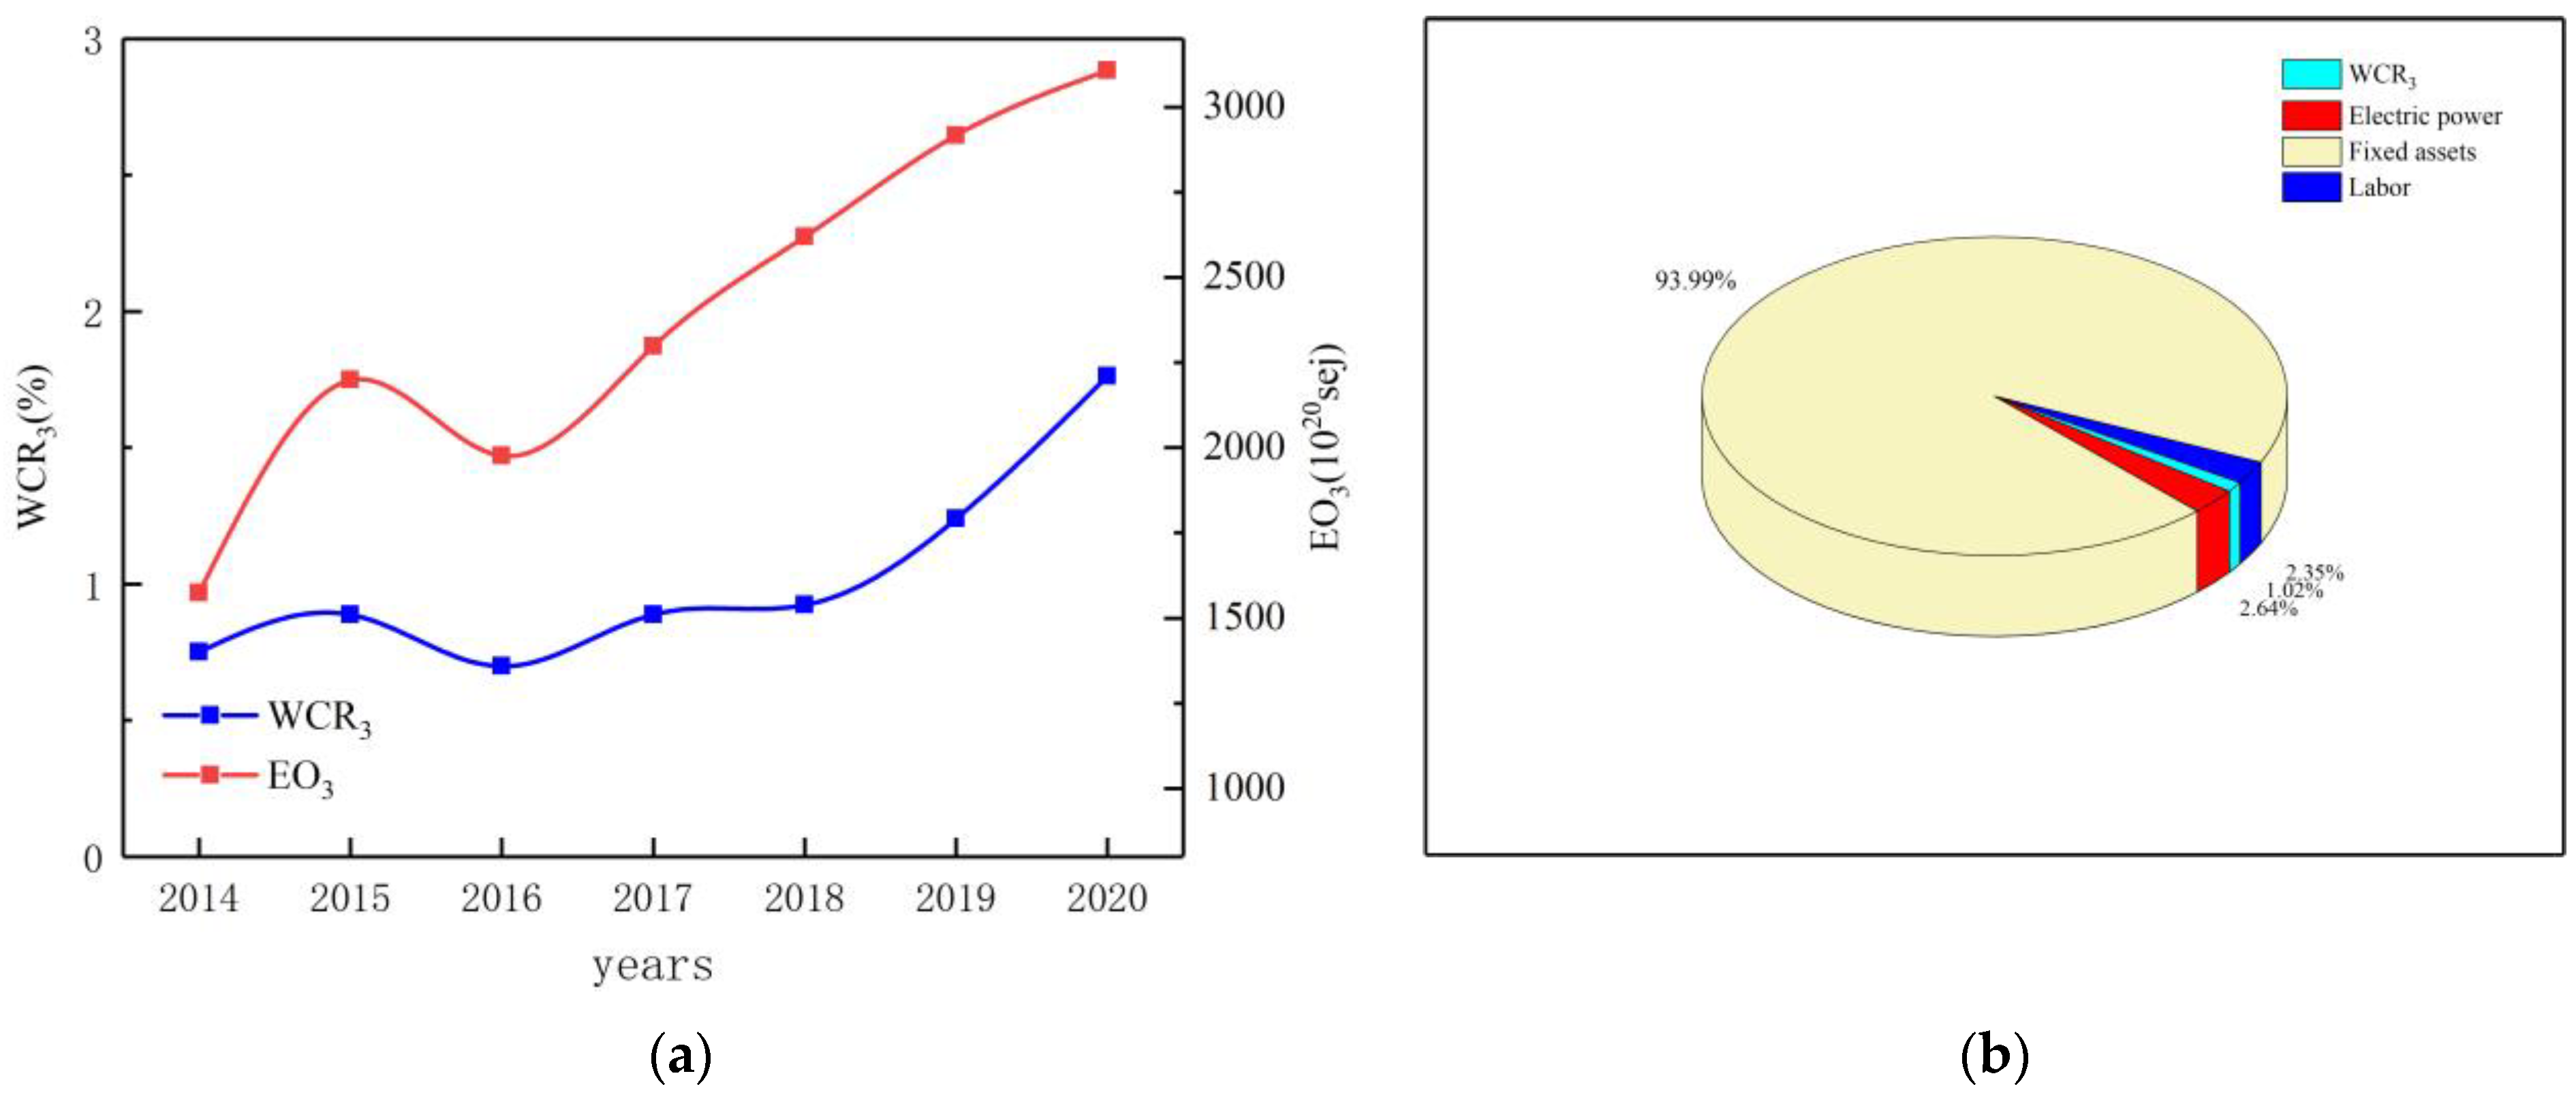
  • In the tertiary industry, although the B3 was small because of the small WCR3, the WRV3 was second only to industry and it had an increasing trend year by year, and there was a very strong positive correlation between the WCR3 and the EO3 (ρ3 = 0.85); all showed high levels of water-use efficiency;
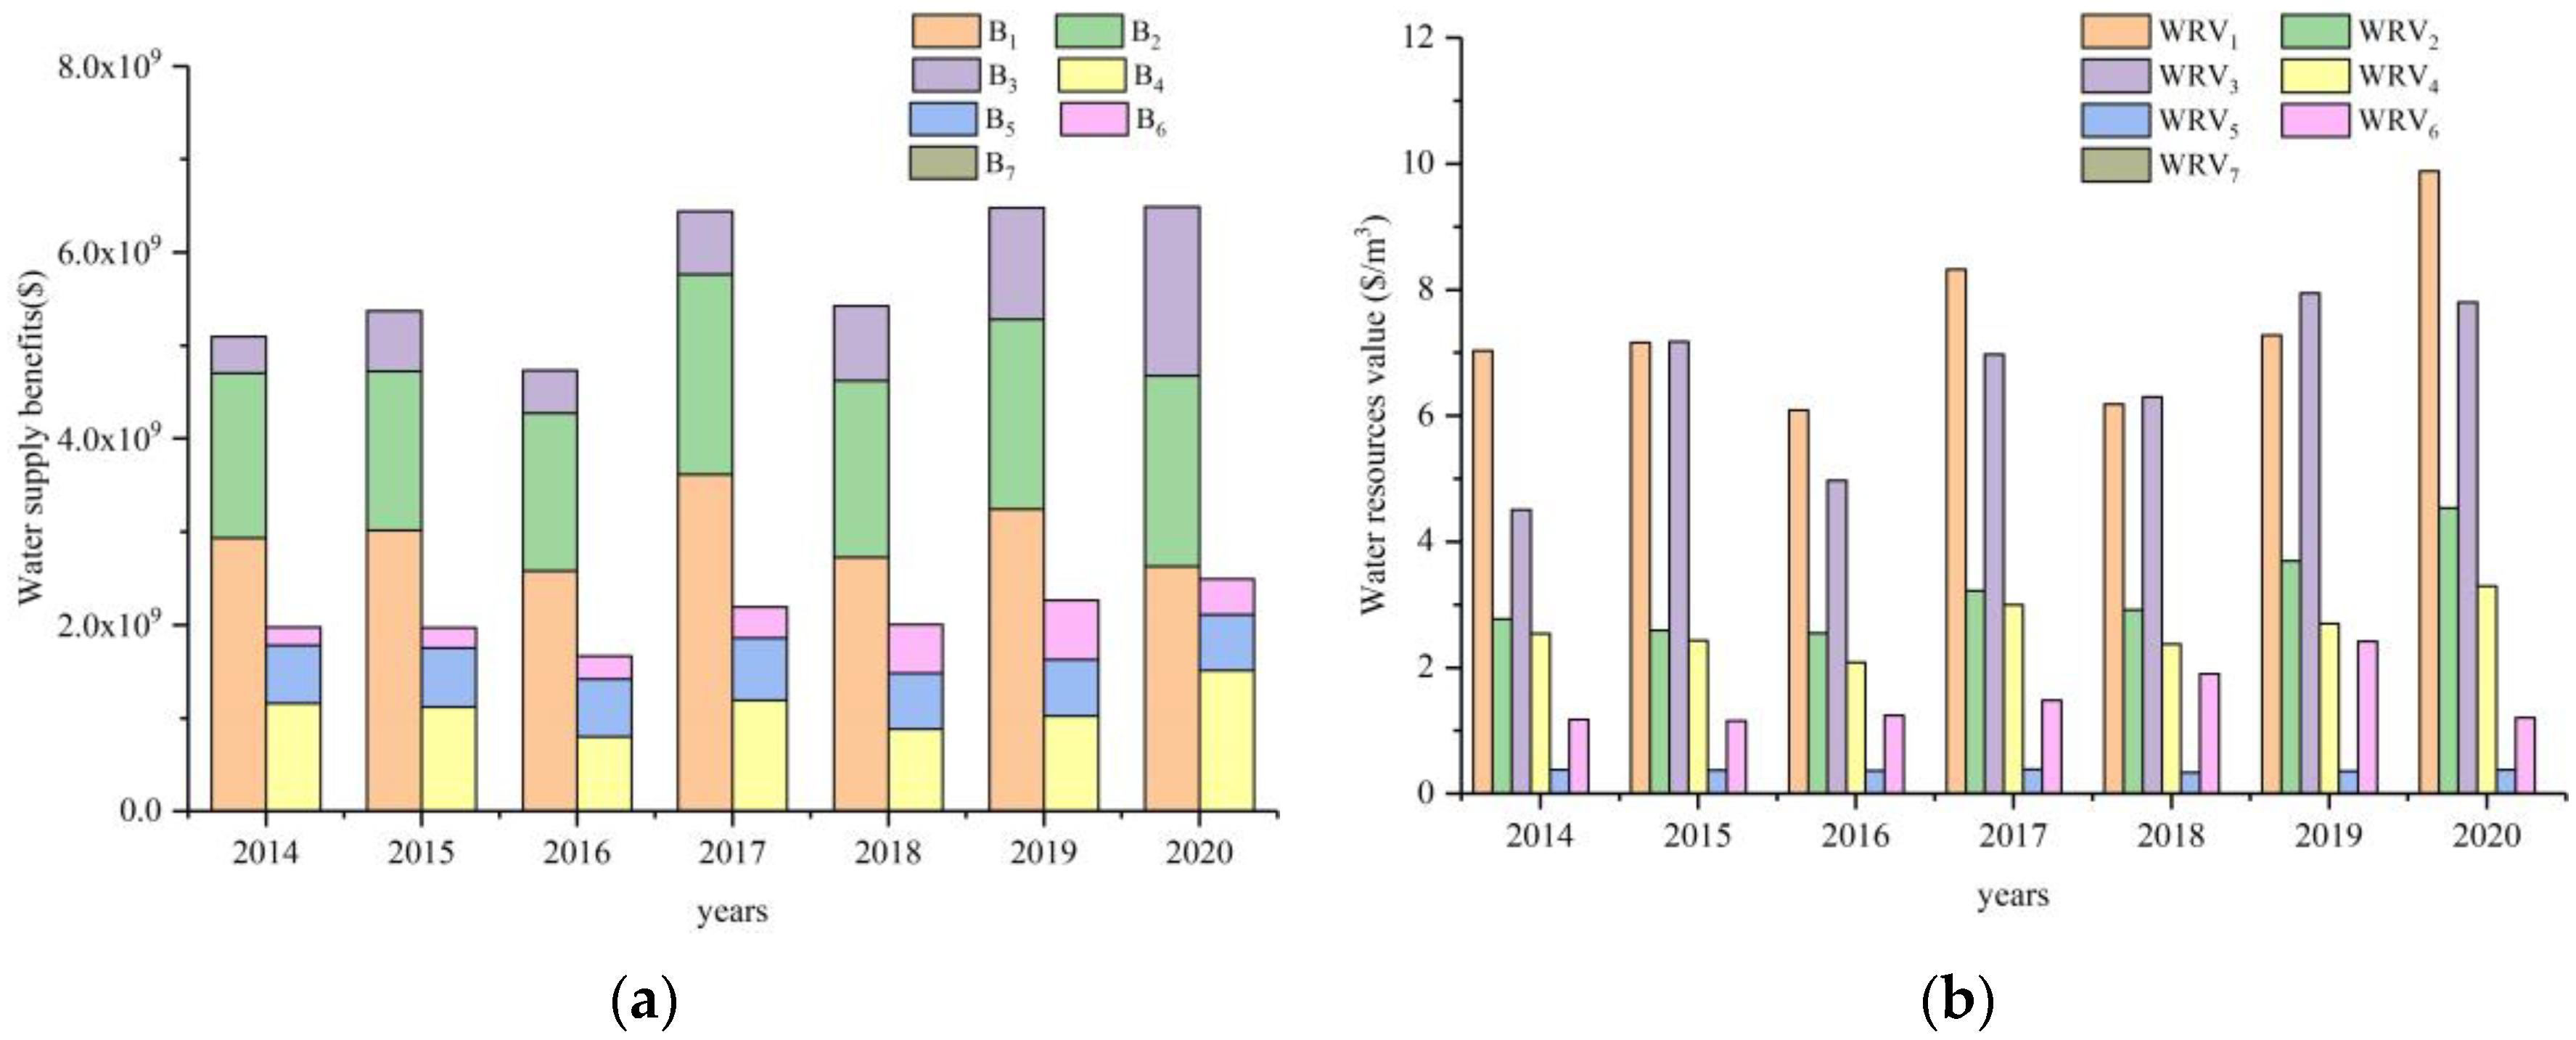
  • In the social system, the B4 and the WRV4 were the largest, mainly because water resources, as an indispensable basic resource for human life, not only affect people’s quality of life, to a great extent, but are also the decisive factor for the development of people’s lives, and they play a significant role in social security;
  • There were obvious differences in the benefits and the value of the water resources among various industries. The industrial water supply had the greatest benefits and unit-water value, followed by agriculture, the domestic system, the tertiary industry, and others. Therefore, it is very important to accurately evaluate the value and benefits of water resources in industries, which can be used not only as a reference for the government to formulate water prices, but also to help the relevant departments coordinate and alleviate the water contradiction between various industries and allocate water resources reasonably.
The innovation of this paper lies in the following:
  • With regard to the water-resource ecosystem and the socioeconomic system as a whole: building an ecological and socioeconomic composite network of water resources, showing the process of energy circulation and flow, and providing a research basis for the value accounting of water resources;
  • On the basis of emergy theory, the basic framework and model of the urban socioeconomic water-supply-benefit and water-resource-value research are put forward. This enriches the research methods for the water-resource value;
  • On the basis of the basic principle of the emergy transformity calculation, by analyzing the energy change in the process of the water-resource circulation, the water body is divided into the natural water body and the engineering water body, which further refines the emergy calculation process and solves the problem of how to measure the emergy transformity of multisource water bodies in the emergy calculation.
To sum up, at present, the value accounting of the water resources in China is mainly from the perspective of economics, and it uses currency to measure its value. Currency is the product of the social economy. It does not circulate through nature and it cannot reflect the essence and laws of nature. Therefore, the real value of water resources cannot be directly measured by currency. The accounting system of the economic and social water-supply benefits that is based on the emergy theory that is proposed in this paper unifies the dimensions of the different substances in the natural system and in the socioeconomic system, explores the real value of water resources with both socioeconomic and natural attributes, makes up for the defect that the current economic accounting system does not include natural factors, and is of scientific significance to improving the value theory of water resources. It also provides new ideas for the unification of the economic value and the social value of water resources, the rational allocation and pricing of water resources, and the sustainable utilization of regional water resources.
However, because of the interdependence and overlapping between social systems and economic systems, the problem of double calculation may inevitably occur when using emergy theory to analyze the energy flow of each system. How to overcome this problem needs further research.

Author Contributions

Conceptualization, Z.G. and N.W.; methodology, Z.G. and N.W.; software, Z.G. and X.M.; validation, Z.G., S.L. and L.Y.; formal analysis, Z.G.; investigation, Z.G. and X.M.; resources, Z.G.; data curation, X.K.; writing—original draft preparation, Z.G.; writing—review and editing, Z.G.; visualization, Z.G.; supervision, N.W.; project administration, N.W. All authors have read and agreed to the published version of the manuscript.

Funding

This research was funded by the National Natural Science Foundation of China (Grant No. 51979221), by the Natural Science Basic Research Program of Shaanxi (Program No. 2021JLM-45), and by the Natural Science Basic Research Program of Shaanxi Province (Grant No. 2019JLZ-15).

Institutional Review Board Statement

Not applicable.

Informed Consent Statement

Not applicable.

Data Availability Statement

Not applicable.

Conflicts of Interest

The authors declare no conflict of interest.

References

  1. Guan, X.; Jiang, P.; Meng, Y.; Qin, H.; Lv, H. Study on Production, Domestic and Ecological Benefits of Reservoir Water Supply Based on Emergy Analysis. Processes 2020, 8, 1435. [Google Scholar] [CrossRef]
  2. Meng, B.; Liu, J.L.; Bao, K.; Sun, B. Water fluxes of Nenjiang River Basin with ecological network analysis: Conflict and coordination between agricultural development and wetland restoration. J. Clean. Prod. 2019, 213, 933–943. [Google Scholar] [CrossRef]
  3. Yao, L.M.; Zhao, L.; Pan, L.; Chen, X.D. Optimal water resource allocation based on stability—Considering the correlation between water consumption and output value in different industries. Water Supply 2020, 20, 2499–2513. [Google Scholar] [CrossRef]
  4. Li, J.Y.; Cui, L.B.; Dou, M.; Ali, A. Water resources allocation model based on ecological priority in the arid region. Environ. Res. 2021, 199, 111201. [Google Scholar] [CrossRef]
  5. Shen, X.J.; Wu, X.; Xie, X.M.; Wei, C.J.; Li, L.Q.; Zhang, J.J. Synergetic Theory-Based Water Resource Allocation Model. Water Resour. Manag. 2021, 35, 2053–2078. [Google Scholar] [CrossRef]
  6. Bierkens, M.F.P.; Reinhard, S.; de Bruijn, J.A.; Veninga, W.; Wada, Y. The Shadow Price of Irrigation Water in Major Groundwater-Depleting Countries. Water Resour. Res. 2019, 55, 4266–4287. [Google Scholar] [CrossRef] [Green Version]
  7. Liu, X.L.; Chen, X.K.; Wang, S.Y. Evaluating and Predicting Shadow Prices of Water Resources in China and Its Nine Major River Basins. Water Resour. Manag. 2009, 23, 1467–1478. [Google Scholar] [CrossRef]
  8. Qin, C.H.; Gan, H.; Zhang, X.J.; Jia, L. Research on water resources pricing method and practiceⅡ: Analysis of water price in Haihe River Basin. J. Hydraul. Eng. 2012, 43, 429–436. [Google Scholar] [CrossRef]
  9. Shen, X.B.; Lin, B.Q. The shadow prices and demand elasticities of agricultural water in China: A StoNED-based analysis. Resour. Conserv. Recycl. 2017, 127, 21–28. [Google Scholar] [CrossRef]
  10. Tang, Y.; Song, X.F.; Ma, Y.; Zhang, Y.H.; Yang, L.H.; Han, D.M.; Pu, H.M. Study on water resources value in the intake area of the South-to-North water diversion project based on water resources optimization. South North Water Transf. Water Sci. Technol. 2018, 16, 6. [Google Scholar] [CrossRef]
  11. Alcon, F.; Martin-Ortega, J.; Pedrero, F.; Alarcon, J.J.; de Miguel, M.D. Incorporating Non-market Benefits of Reclaimed Water into Cost-Benefit Analysis: A Case Study of Irrigated Mandarin Crops in southern Spain. Water Resour. Manag. 2013, 27, 1809–1820. [Google Scholar] [CrossRef]
  12. Arborea, S.; Giannoccaro, G.; de Gennaro, B.C.; Iacobellis, V.; Piccinni, A.F. Cost-Benefit Analysis of Wastewater Reuse in Puglia, Southern Italy. Water 2017, 9, 175. [Google Scholar] [CrossRef] [Green Version]
  13. Arena, C.; Genco, M.; Mazzola, M.R. Environmental Benefits and Economical Sustainability of Urban Wastewater Reuse for Irrigation-A Cost-Benefit Analysis of an Existing Reuse Project in Puglia, Italy. Water 2020, 12, 2926. [Google Scholar] [CrossRef]
  14. Ward, F.A. Economics in integrated water management. Environ. Model. Softw. 2009, 24, 948–958. [Google Scholar] [CrossRef]
  15. Dallman, S.; Chaudhry, A.M.; Muleta, M.K.; Lee, J. The Value of Rain: Benefit-Cost Analysis of Rainwater Harvesting Systems. Water Resour. Manag. 2016, 30, 4415–4428. [Google Scholar] [CrossRef]
  16. Dallman, S.; Chaudhry, A.M.; Muleta, M.K.; Lee, J. Is Rainwater Harvesting Worthwhile? A Benefit-Cost Analysis. J. Water Resour. Plan. Manag. 2021, 147, 04021011. [Google Scholar] [CrossRef]
  17. Zuo, J.B.; Liu, C.M.; Zheng, H.X. Cost-benefit analysis for urban rainwater harvesting in Beijing. Water Int. 2010, 35, 195–209. [Google Scholar] [CrossRef]
  18. Downing, J.A.; Polasky, S.; Olmstead, S.M.; Newbold, S.C. Protecting local water quality has global benefits. Nat. Commun. 2021, 12, 2709. [Google Scholar] [CrossRef]
  19. Ma, M.S.; Zhao, M. Research on an Improved Economic Value Estimation Model for Crop Irrigation Water in Arid Areas: From the Perspective of Water-Crop Sustainable Development. Sustainability 2019, 11, 1207. [Google Scholar] [CrossRef] [Green Version]
  20. Sun, L.N.; Lu, W.X.; Yang, Q.C.; Martin, J.D.; Li, D. Ecological Compensation Estimation of Soil and Water Conservation Based on Cost-Benefit Analysis. Water Resour. Manag. 2013, 27, 2709–2727. [Google Scholar] [CrossRef]
  21. Genius, M.; Hatzaki, E.; Kouromichelaki, E.M.; Kouvakis, G.; Nikiforaki, S.; Tsagarakis, K.P. Evaluating Consumers’ Willingness to Pay for Improved Potable Water Quality and Quantity. Water Resour. Manag. 2008, 22, 1825–1834. [Google Scholar] [CrossRef]
  22. Lee, W.S.; Yoo, S.H.; Kim, J. Measuring the Economic Benefits of the Tap Water Supply Service in Urban Areas: The Case of Korea. Water Resour. Manag. 2013, 27, 619–627. [Google Scholar] [CrossRef]
  23. Loomis, J.; Santiago, L. Economic Valuation of Beach Quality Improvements: Comparing Incremental Attribute Values Estimated from Two Stated Preference Valuation Methods. Coast. Manag. 2013, 41, 75–86. [Google Scholar] [CrossRef]
  24. Mumbi, A.W.; Watanabe, T. Cost Estimations of Water Pollution for the Adoption of Suitable Water Treatment Technology. Sustainability 2022, 14, 649. [Google Scholar] [CrossRef]
  25. Xu, F.; Baoligao, B.; Jia, J. Benefits of Xin’an River Water Resources and Ecological Compensation. Adv. Mater. Res. 2015, 1073, 1660–1663. [Google Scholar] [CrossRef]
  26. Dijk, D.V.; Siber, R.; Brouwer, R.; Logar, I.; Sanadgol, D. Valuing water resources in Switzerland using a hedonic price model. Water Resour. Res. 2016, 52, 3510–3526. [Google Scholar] [CrossRef] [Green Version]
  27. Chi, Y.; Xue, L.; Zhang, H. Comprehensive benefit analysis of regional water resources based on multi-objective evaluation. IOP Conf. Ser. Earth Environ. Sci. 2018, 108, 032040. [Google Scholar] [CrossRef]
  28. Wang, Y.X.; Cheng, L.; Tian, H.L.; Liu, X.H. Water supply eco-economic benefit evaluation of middle route of south-to-north water diversion project in Hebei Water-recipient Area. IOP Conf. Ser. Earth Environ. Sci. 2018, 191, 012064. [Google Scholar] [CrossRef]
  29. Cheng, B.; Li, H.E.; Yue, S.Y.; Huang, K. A conceptual decision-making for the ecological base flow of rivers considering the economic value of ecosystem services of rivers in water shortage area of Northwest China. J. Hydrol. 2019, 578, 124126. [Google Scholar] [CrossRef]
  30. Yue, S.Y.; Li, H.E.; Cheng, B.; Gao, Z.Y. The Value of Environmental Base Flow in Water-Scarce Basins: A Case Study of Wei River Basin, Northwest China. Water 2018, 10, 848. [Google Scholar] [CrossRef] [Green Version]
  31. Di, D.; Wu, Z.; Guo, X.; Lv, C.; Wang, H. Value Stream Analysis and Emergy Evaluation of the Water Resource Eco-Economic System in the Yellow River Basin. Water 2019, 11, 710. [Google Scholar] [CrossRef] [Green Version]
  32. Wu, Z.; Di, D.; Lv, C.; Guo, X.; Wang, H. Defining and evaluating the social value of regional water resources in terms of emergy. Water Policy 2018, 21, 7390. [Google Scholar] [CrossRef]
  33. Lan, S.F.; Qin, P.; Lu, H.F. Emergy Analysis of Ecological-Economic System; Chemical Industry Press: Beijing, China, 2002. [Google Scholar]
  34. Odum, H.T. Environmental Accounting: Emergy and Environmental Decision Making; John Wiley & Sons: New York, NY, USA, 1996. [Google Scholar]
  35. Liu, G.Y.; Casazza, M.; Hao, Y.; Zhang, Y.; Ulgiati, S. Emergy analysis of urban domestic water metabolism: A case study in Beijing (China). J. Clean. Prod. 2019, 234, 714–724. [Google Scholar] [CrossRef]
  36. Paoli, C.; Vassallo, P.; Dapueto, G.; Fanciulli, G.; Massa, F.; Venturini, S.; Povero, P. The economic revenues and the emergy costs of cruise tourism. J. Clean. Prod. 2017, 166, 1462–1478. [Google Scholar] [CrossRef]
  37. Kocjancic, T.; Debeljak, M.; Zgajnar, J.; Juvancic, L. Incorporation of emergy into multiple-criteria decision analysis for sustainable and resilient structure of dairy farms in Slovenia. Agric. Syst. 2018, 164, 71–83. [Google Scholar] [CrossRef]
  38. Zhang, J.X.; Ma, L. Environmental Sustainability Assessment of a New Sewage Treatment Plant in China Based on Infrastructure Construction and Operation Phases Emergy Analysis. Water 2020, 12, 484. [Google Scholar] [CrossRef] [Green Version]
  39. Zhang, X.H.; Shen, J.M.; Wang, Y.Q.; Qi, Y.; Liao, W.J.; Shui, W.; Li, L.; Qi, H.; Yu, X.Y. An environmental sustainability assessment of China’s cement industry based on emergy. Ecol. Indic. 2017, 72, 452–458. [Google Scholar] [CrossRef]
  40. Zhong, S.Z.; Geng, Y.; Kong, H.N.; Liu, B.; Tian, X.; Chen, W.; Qian, Y.Y.; Ulgiati, S. Emergy-based sustainability evaluation of Erhai Lake Basin in China. J. Clean. Prod. 2018, 178, 142–153. [Google Scholar] [CrossRef]
  41. Winfrey, B.K.; Tilley, D.R. An emergy-based treatment sustainability index for evaluating waste treatment systems. J. Clean. Prod. 2016, 112, 4485–4496. [Google Scholar] [CrossRef]
  42. Shah, S.M.; Liu, G.Y.; Yang, Q.; Casazza, M.; Agostinho, F.; Giannetti, B.F. Sustainability assessment of agriculture production systems in Pakistan: A provincial-scale energy-based evaluation. Ecol. Model. 2021, 455, 109654. [Google Scholar] [CrossRef]
  43. Pan, H.Y.; Zhuang, M.F.; Geng, Y.; Wu, F.; Dong, H.J. Emergy-based ecological footprint analysis for a mega-city: The dynamic changes of Shanghai. J. Clean. Prod. 2019, 210, 552–562. [Google Scholar] [CrossRef]
  44. Peng, W.J.; Wang, X.M.; Li, X.K.; He, C.C. Sustainability evaluation based on the emergy ecological footprint method: A case study of Qingdao, China, from 2004 to 2014. Ecol. Indic. 2018, 85, 1249–1261. [Google Scholar] [CrossRef]
  45. Jaklic, T.; Juvancic, L.; Kavcic, S.; Debeljak, M. Complementarity of socio-economic and emergy evaluation of agricultural production systems: The case of Slovenian dairy sector. Ecol. Econ. 2014, 107, 469–481. [Google Scholar] [CrossRef]
  46. Ali, M.; Marvuglia, A.; Geng, Y.; Robins, D.; Pan, H.Y.; Song, X.Q.; Yu, Z.J.; Sun, H.P. Accounting emergy-based sustainability of crops production in India and Pakistan over first decade of the 21st century. J. Clean. Prod. 2019, 207, 111–122. [Google Scholar] [CrossRef]
  47. Viglia, S.; Civitillo, D.F.; Cacciapuoti, G.; Ulgiati, S. Indicators of environmental loading and sustainability of urban systems. An emergy-based environmental footprint. Ecol. Indic. 2018, 94, 82–99. [Google Scholar] [CrossRef]
  48. Yang, Z.Y.; Song, J.X.; Cheng, D.D.; Xia, J.; Li, Q.; Ahamad, M.I. Comprehensive evaluation and scenario simulation for the water resources carrying capacity in Xi’an city, China. J. Environ. Manag. 2019, 230, 221–233. [Google Scholar] [CrossRef] [PubMed]
  49. Wang, B. Study on the Effective Usage of Urban Water Resources of Xi’an City; Chang’an University: Xi’an, China, 2015. [Google Scholar]
  50. Liu, J.Y.; Li, J.; Gao, Z.Y.; Yang, M.; Qin, K.Y.; Yang, X.A. Ecosystem Services Insights into Water Resources Management in China: A Case of Xi’an City. Int. J. Environ. Res. Public Health 2016, 13, 1169. [Google Scholar] [CrossRef] [Green Version]
  51. Parsons, T. The Social System; Pyschology Press: New York, NY, USA, 1991. [Google Scholar]
  52. Tang, J.R. Ecological Economics; Chemical Industry Press: Beijing, China, 2005. [Google Scholar]
  53. Li, H.E.; Xu, M.M.; Zhao, Y. Study on river ecological base flow value and its changes during the year based on emergy method. Ecol. Econ. 2017, 33, 160–164. [Google Scholar]
  54. Lv, C.; Wu, Z. Emergy analysis of regional water ecological–economic system. Ecol. Eng. 2009, 35, 703–710. [Google Scholar] [CrossRef]
  55. Wang, L.F.; Zhou, Y.; Xie, W.T.; Dong, W.G. Emergy Analysis on Contribution of Water Resources to Eco-economic System: A Case Study of Xi’an. Value Eng. 2017, 36, 10–14. [Google Scholar] [CrossRef]
  56. D’Odorico, P.; Chiarelli, D.D.; Rosa, L.; Bini, A.; Zilberman, D.; Rulli, M.C. The global value of water in agriculture. Dep. Agric. Resour. Econ. UC Berkeley Work. Pap. Ser. 2020, 117, 21985–21993. [Google Scholar] [CrossRef] [PubMed]
  57. Wang, W.; Xie, H.; Zhang, N.; Xiang, D. Sustainable water use and water shadow price in China’s urban industry. Resour. Conserv. Recycl. 2016, 128, 489–498. [Google Scholar] [CrossRef]
Figure 1. General situation of the study area.
Sustainability 14 05001 g001
Figure 2. Water-resource eco-economic system.
Sustainability 14 05001 g002
Figure 3. Emergy input of industrial system from 2014 to 2020.
Sustainability 14 05001 g003
Figure 4. Main emergy output of industrial system from 2014 to 2020.
Sustainability 14 05001 g004
Figure 5. (a) Trends of WCR1 and EO1; (b) average contribution rates of main inputs in industrial system.
Sustainability 14 05001 g005
Figure 6. (a) Trends of WCR2 and EO2; (b) average contribution rates of main inputs in agricultural system.
Sustainability 14 05001 g006
Figure 7. (a) Trends of WCR3 and EO3; (b) average contribution rates of main inputs in tertiary industry.
Sustainability 14 05001 g007
Figure 8. The benefits and values of water resources in economic and social system: (a) water-supply benefits among industries; (b) unit-water-resource values among industries.
Sustainability 14 05001 g008
Table 1. Raw data of Xi’an city from 2014 to 2020.
Items2014201520162017201820192020
Area (109 m2)9.98 19.98 19.98 19.98 19.98 19.98 19.98 1
Rainfall (m)0.701 10.691 10.572 10.764 10.583 10.705 10.733 1
Surface water (109 m3)1.73 11.71 11.42 12.03 11.80 12.36 12.276 1
Groundwater (109 m3)1.44 11.43 11.43 11.27 11.12 11.17 11.16 1
Industrial water supply (108 m3)4.17 14.21 14.24 14.35 14.41 14.45 12.07 1
Agricultural water supply (108 m3)6.39 16.59 16.64 16.66 16.49 15.52 15.80 1
Tertiary-industry water supply (108 m3)0.87 10.90 10.92 10.97 11.27 11.51 12.33 1
Domestic water supply (108 m3)4.12 14.25 14.09 14.19 14.32 14.35 14.59 1
Ecological water supply (108 m3)1.64 11.88 11.98 12.23 12.72 12.64 13.17 1
1 The data come from the Xi’an Water Resources Bulletin (2014–2020).
Table 2. Data-processing results.
Items C 1Unit ε   ( unit / J )   2 E   ( J )
Raw coal and other fuels1.70 × 107t2.09 × 10103.56 × 1017
Edible oil3.70 × 1010t2.03 × 1057.63 × 1015
Generating capacity1.55 × 1010kw·h3.60 × 1065.58 × 1016
Crude-oil-processing capacity2.34 × 107t4.18 × 10109.79 × 1017
Gasoline and other fuel oils2.32 × 107t4.18 × 10109.70 × 1017
1 The data come from the Xi’an Statistical Yearbook. 2 Adapted with permission from Ref. [34]. 1995, John Wiley and Sons
Table 3. Transformities of natural water and engineering water in Xi’an.
Years C E p
(1016 J)
E M P
(1020 sej)
A W 1  
(1010 m3)
A W 2
(107 m3)
τ 1 N
(109 sej/m3)
τ 2 N
(1013 sej/m3)
τ 1 E
(1011 sej/m3)
τ 2 E
(1013 sej/m3)
20143.465.345.751.449.293.707.063.72
20153.415.275.681.439.273.697.063.72
20162.824.354.701.439.283.057.063.08
20173.775.826.741.278.644.587.054.60
20182.884.445.971.127.443.977.043.99
20193.485.377.821.176.874.587.034.61
20203.615.585.181.0810.785.196.865.21
Table 4. Emergy input and output of Xi’an industrial system in 2019.
ItemsSubstancesRaw DataUnitTransformity
(sej/Unit)
Emergy (sej)Transformity
References
InputRenewable
resources
Solar6.07 × 1019 1 J16.07 × 1019Odum [34]
Wind8.43 × 1016 1J6235.25 × 1019Odum [34]
Industrial water (Surface)2.50 × 10⁸ 2m36.82 × 10111.70 × 1020This study
Industrial water (Underground)1.95 × 10⁸ 2m34.61 × 10139.01 × 1021This study
Nonrenewable
resources 3
Raw coal and other fuels3.56 × 1017 3J4.00 × 1041.42 × 1022Odum [34]
Raw materials1.39 × 1010 3$3.02 × 10124.19 × 1022Li [53]
Labor1.75 × 1010 3$3.02 × 10125.29 × 1022Li [53]
Fixed assets2.20 × 1010 3$3.02 × 10126.65 × 1022Li [53]
Total input 1.849 × 10²³
OutputIndustrial
products 3
Edible oil7.63 × 1015 3J8.60 × 1046.56 × 1020Lan [33]
Generating capacity5.58 × 1016 3J1.60 × 1058.93 × 1021Odum [34]
Chemical pesticide1.30 × 103 3t1.62 × 10152.11 × 1018Odum [34]
Plastic2.76 × 105 3t3.80 × 10141.05 × 1020Odum [34]
Steels3.15 × 105 3t1.78 × 10155.61 × 1020Lv [54]
Glass2.15 × 104 3t8.40 × 10141.81 × 1019Lv [54]
Aluminum2.11 × 104 3t1.60 × 10163.38 × 1020Lv [54]
Cement2.76 × 106 3t1.98 × 10155.46 × 1021Lv [54]
Wheatmeal4.40 × 105 3t8.30 × 1043.65 × 1010Odum [34]
Dairy products7.26 × 105 3t1.71 × 1061.24 × 1012Lan [33]
Tap-water production6.52 × 108 3m33.89 × 10132.54 × 1022Lv [54]
Meat7.83 × 104 3t1.70 × 1061.33 × 1011Lan [33]
Chemicals and detergents7.00 × 105 3t1.00 × 10157.00 × 1020Lv [54]
Silicon1.21 × 104 3t1.60 × 10161.93 × 1020Lv [54]
Paper Products1.25 × 105 3t3.90 × 10154.86 × 1020Wang [55]
Mechanical products8.75 × 104 3t6.70 × 10155.86 × 1020Lv [54]
Crude-oil-processing capacity9.79 × 1017 3J5.40 × 1045.29 × 1022Odum [34]
Gasoline and other fuel oils9.70 × 1017 3J6.60 × 1046.40 × 1022Odum [34]
Wood processing and furniture manufacturing1.01 × 109 3$3.02 × 10123.05 × 1021Li [55]
Transportation equipment1.12 × 1010 3$3.02 × 10123.38 × 1022Li [55]
Total output 1.972 × 10²³
1 The data are calculated according to Equations (2) and (3). 2 The data come from the Xi’an Water Resources Bulletin (2019). 3 The raw data come from the Xi’an Statistical Yearbook (2019).
Table 5. Benefits of industrial water supply in Xi’an from 2014 to 2020.
Item2014201520162017201820192020
E I 1 (1020 sej)1724.451675.041572.91708.321836.841849.151822.61
E O 1 (1020 sej)1935.211954.671892.21974.191930.671971.61946.20
W U E 1   (1020 sej)78.9678.0464.8494.5278.491.8457.85
WCR1 (%)4.584.664.125.534.264.963.17
EDR (1012 sej/$)3.023.023.023.023.023.023.02
W U 1   (108 m3) 4.174.214.244.354.414.452.07
B1 (109$)2.933.012.583.612.733.242.05
W R V 1   ($/m3)7.037.166.098.326.187.289.88
Table 6. Benefits of agricultural water supply in Xi’an from 2014 to 2020.
Item2014201520162017201820192020
EI2 (1020 sej)387.34410.78359.98470.27437.36408.45392.81
EO2 (1020 sej)99.3198.80102.57113.43109.96112.82117.72
W U E 2   (1020 sej)208.64214.65179.40268.94227.38222.86265.02
WCR2 (%)53.8752.2649.8457.1951.9954.5667.47
EDR (1012 sej/$)3.023.023.023.023.023.023.02
W U 2   (108 m3) 6.396.596.646.666.495.525.80
B2 (109$)1.771.711.692.151.892.042.63
W R V 2 ($/m3)2.772.602.553.222.923.704.53
Table 7. Water-supply benefits of the tertiary industry in Xi’an from 2014 to 2020.
Item2014201520162017201820192020
EI3 (1020 sej)2298.811995.002157.092556.252707.132761.683116.04
EO3 (1020 sej)1574.462198.641977.322298.572619.362917.163106.75
W U E 3   (1020 sej)17.2817.7015.0822.6925.0234.2254.96
WCR3 (%)0.750.890.700.890.921.241.76
EDR (1012 sej/$)3.023.023.023.023.023.023.02
W U 3   (108 m3) 0.870.900.920.971.271.512.33
B3 (109$)0.390.650.460.680.801.201.81
W R V 3 ($/m3)4.50 7.18 4.97 6.98 6.30 7.95 7.80
Table 8. Benefits of domestic water supply in Xi’an from 2014 to 2020.
Item2014201520162017201820192020
EI4 (1015 sej per person)9.2310.2710.6511.4211.6012.5611.72
Disposable income of residents (1016 sej per person)1.251.361.461.591.531.661.74
Engel coefficient (%)33.2532.4528.1028.3525.7526.1028.05
W U E 4 (1014 sej per person)9.039.057.089.477.828.788.45
WCR4 (%)9.788.816.658.306.746.997.21
EDR (1012 sej/$)3.023.023.023.023.023.023.02
W U 4 (108 m3)4.124.254.094.194.324.354.59
B4 (109$)1.161.120.801.190.881.021.51
W R V 4   ($/m3)2.81 2.63 1.95 2.84 2.04 2.35 3.29
Table 9. Employment security, entertainment, scientific research value of water resources in Xi’an from 2014 to 2020.
Item2014201520162017201820192020
N1 (104 person)105.02107.68105.13113.17101.25101.3799.97
N2 (104 person)3.112.612.93.293.643.833.58
Tourism income (1010$)1.481.681.902.553.994.922.94
μ (%)1.301.301.301.301.301.301.30
W U 5   (108 m3)1.641.881.982.232.722.643.17
W U   (109 m3)1.631.691.701.741.801.701.56
EDR (1012 sej/$)3.023.023.023.023.023.023.02
B5 (108$)6.226.346.216.706.036.055.95
B6 (108$)1.932.182.473.325.196.393.82
B7 (104$)12.129.439.4314.1410.7816.8433.00
W R V 5   ($/m3)0.38 0.38 0.370.38 0.34 0.36 0.38
W R V 6   ($/m3)1.18 1.16 1.24 1.49 1.90 2.42 1.21
W R V 7   ($/m3)0.0000740.0000560.0000560.0000810.0000600.0000990.00021
Publisher’s Note: MDPI stays neutral with regard to jurisdictional claims in published maps and institutional affiliations.

