Article

Occupants’ Satisfaction of Indoor Environment Quality in Non-Linear Minimum Buildings in Winter Based on the Role of Different Kinds of Perceptions

1
College of Electrical, Energy and Power Engineering, Yangzhou University, Yangzhou 225127, China
2
College of Architectural Science and Engineering, Yangzhou University, Yangzhou 225127, China
*
Author to whom correspondence should be addressed.
Sustainability 2022, 14(9), 4983; https://doi.org/10.3390/su14094983
Submission received: 7 March 2022 / Revised: 5 April 2022 / Accepted: 14 April 2022 / Published: 21 April 2022
(This article belongs to the Special Issue Sustainable Development of Construction Engineering)

Abstract

:
Non-Linear Minimum Building (NLMB) is a sort of low-carbon building designed to meet the needs of the growing urban population around the world. This study investigates the perceptions of indoor environments among students whilst staying in NLMBs. The students were asked to participate in the subjective survey in order to gather their indoor environmental satisfaction votes. The objectives of this study are to know the importance of six human sensations inside NLMBs relative to indoor environmental satisfaction. The main findings indicated the great function of the humidity sensation in NLMBs, followed by the thermal sensation, the noise sensation, the visual sensation, the air freshness sensation and the draft sensation. Although the subjects were not very satisfied with the humidity sensation, the overall indoor environmental satisfaction was quite high under the relatively cold conditions in winter. Moreover, the studies, through in-depth interviews, showed that the majority of people felt comfortable, and some of them experienced good feelings or experiences when they stayed in NLMBs.

1. Introduction

With the continued growth of the urban population and low-carbon demand around the world, building miniaturization has become a growing trend. “Minimum architecture” originated from the SAR (Stiching Architecten Research) theory proposed by The Dutch Architecture Research Foundation, which used the Japanese SI building structure system and divided a building into two parts, called Skeleton and Infill, respectively [1,2]. The minimum unit size for this architecture is less than 10 m2; one or two persons can live and work in it.
Significant studies on such building types have been summarized by Ruth Slavid, who considered that complex functions should be implemented in extremely narrow spaces [3]. A variety of very small mobile buildings have been designed and built, such as Alexey Goryainov’s Sleepbox, Diogo Aguiar’s Temporary Bar and Facundo Arana’s Chori [4]. However, as the human body is closed to the inner surface of this kind of small buildings, some special elements should be taken into account, such as human behavior, barrier-free design, etc., which is almost not reported in the literature. Moreover, the research efforts into small buildings mainly focus on the architectonics aspect, while the efforts concerning the built environment, human physiology and human psychology aspects have only a few literature reports as of yet. Some studies show that occupants of these very small residential units are more sensitive to warmth and operative temperature change as compared to occupants of general residential buildings. A small variation of thermal acceptance suggests that the small unit occupants have already developed a certain degree of tolerance to hot conditions [5]. Other studies show how color, acoustics and lighting have effects on people’ s perceived sociability, emotion, thermal comfort and behavioral intention [6,7,8]. With the help of computer-aided design tools, the nonlinear building and non-linear design method emerged based on nonlinear theory under the influence of complexity science. The characteristics of this kind of building show a degree of continuous flow and irregular, free and soft spatial form. Nonlinear building has the ability to simulate and restore the complexity of the real world through showing its complexity, diversity and rich spatial experience to some extent [9]. For such a very small space, it is a great challenge to satisfy the comfort of the occupants and to make the space humanistic. In this study, ergonomic theory was applied to the interior design, and a non-linear design method was used. Many curves and pieces of furniture with curved surfaces were designed to adapt to the human body’s movements. Different from common minimum building, Non-Linear Minimum Building (NLMB), as a type of very small nonlinear building, has personalized interior space and is beneficial to save energy, land and raw materials [10]. In some ways, NLMB provides a kind of new living pattern for people in crowned cities, especially for young people and immigrant people [11,12].
This paper deals with analyzing the comfort characteristics and environmental satisfaction inside NLMBs. For this purpose, a perceptive-cognitive aspects investigation was conducted. An analysis was made to understand the physiological and psychological comfort characteristics of NLMBs and maximize the validity and reliability of the results.

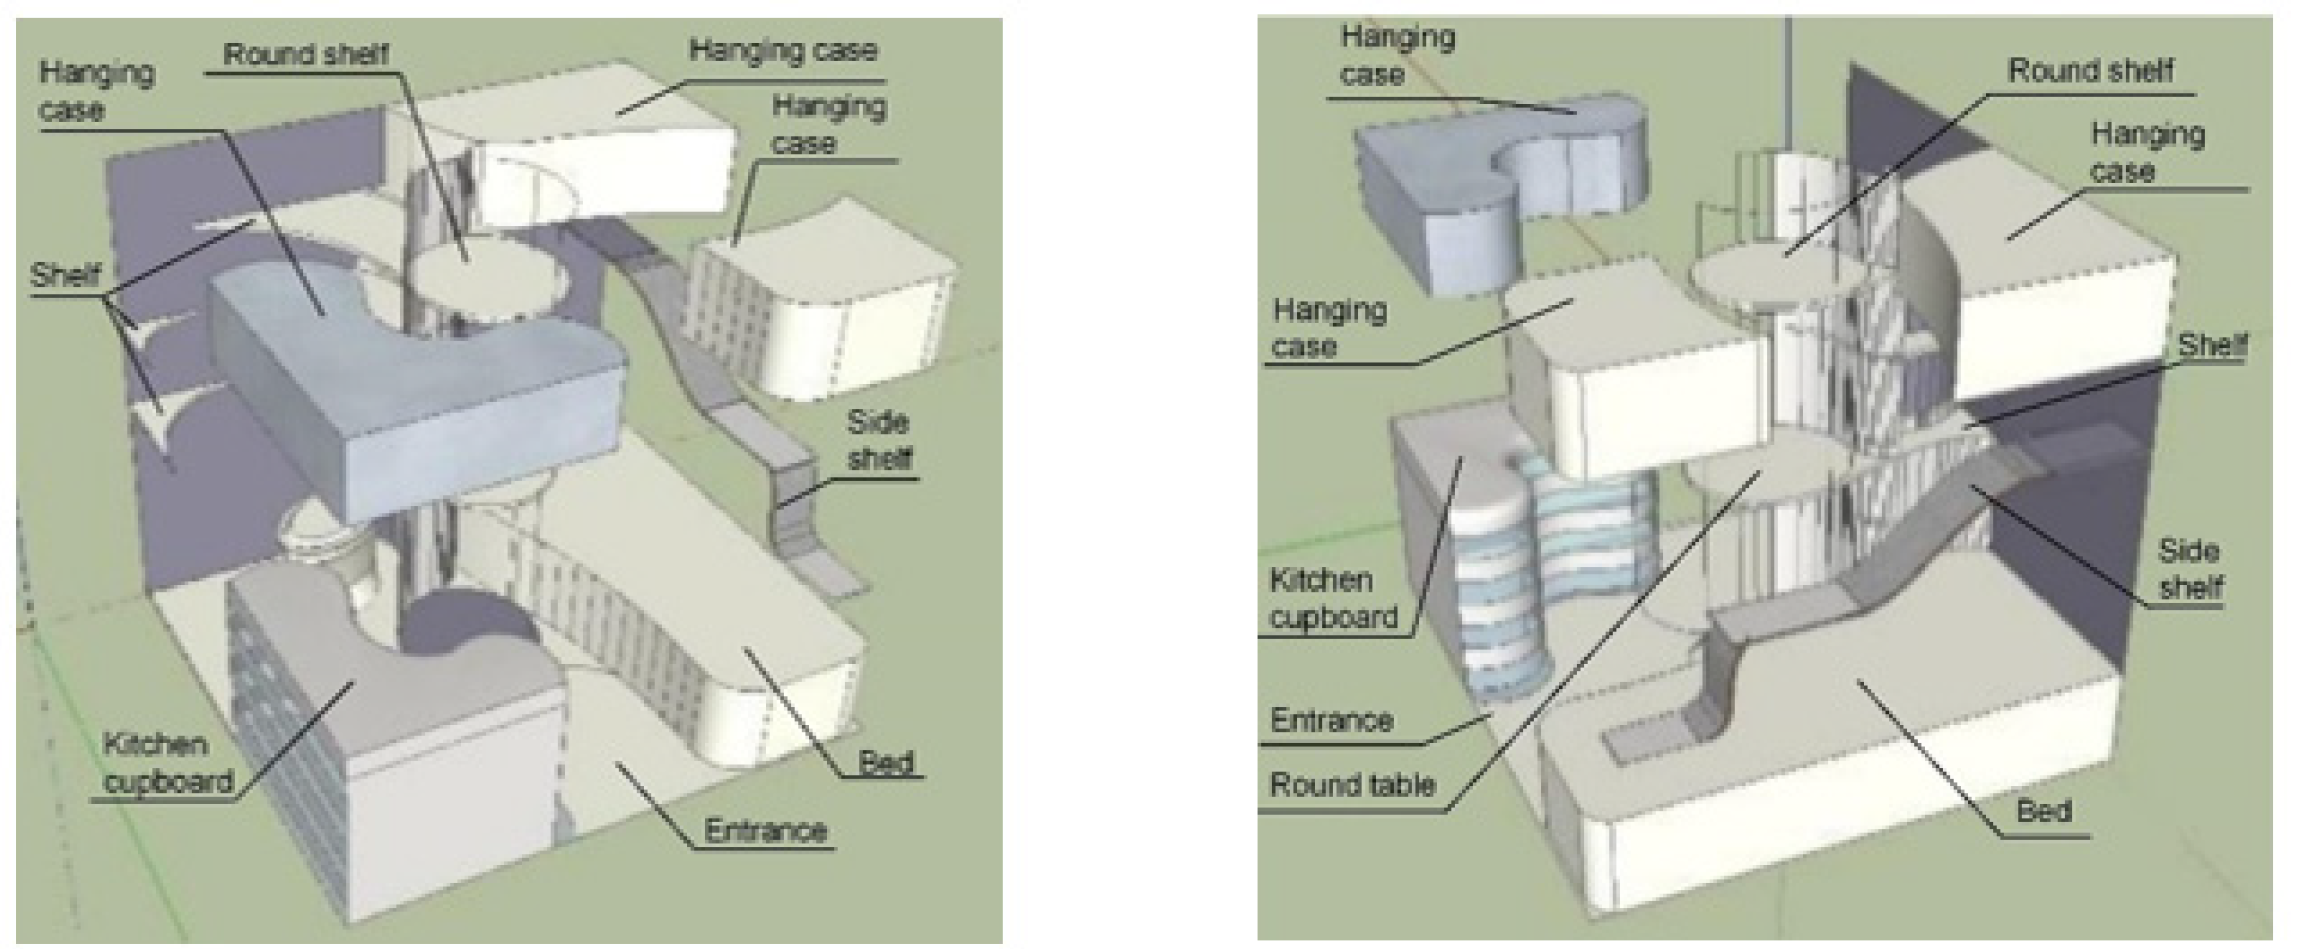
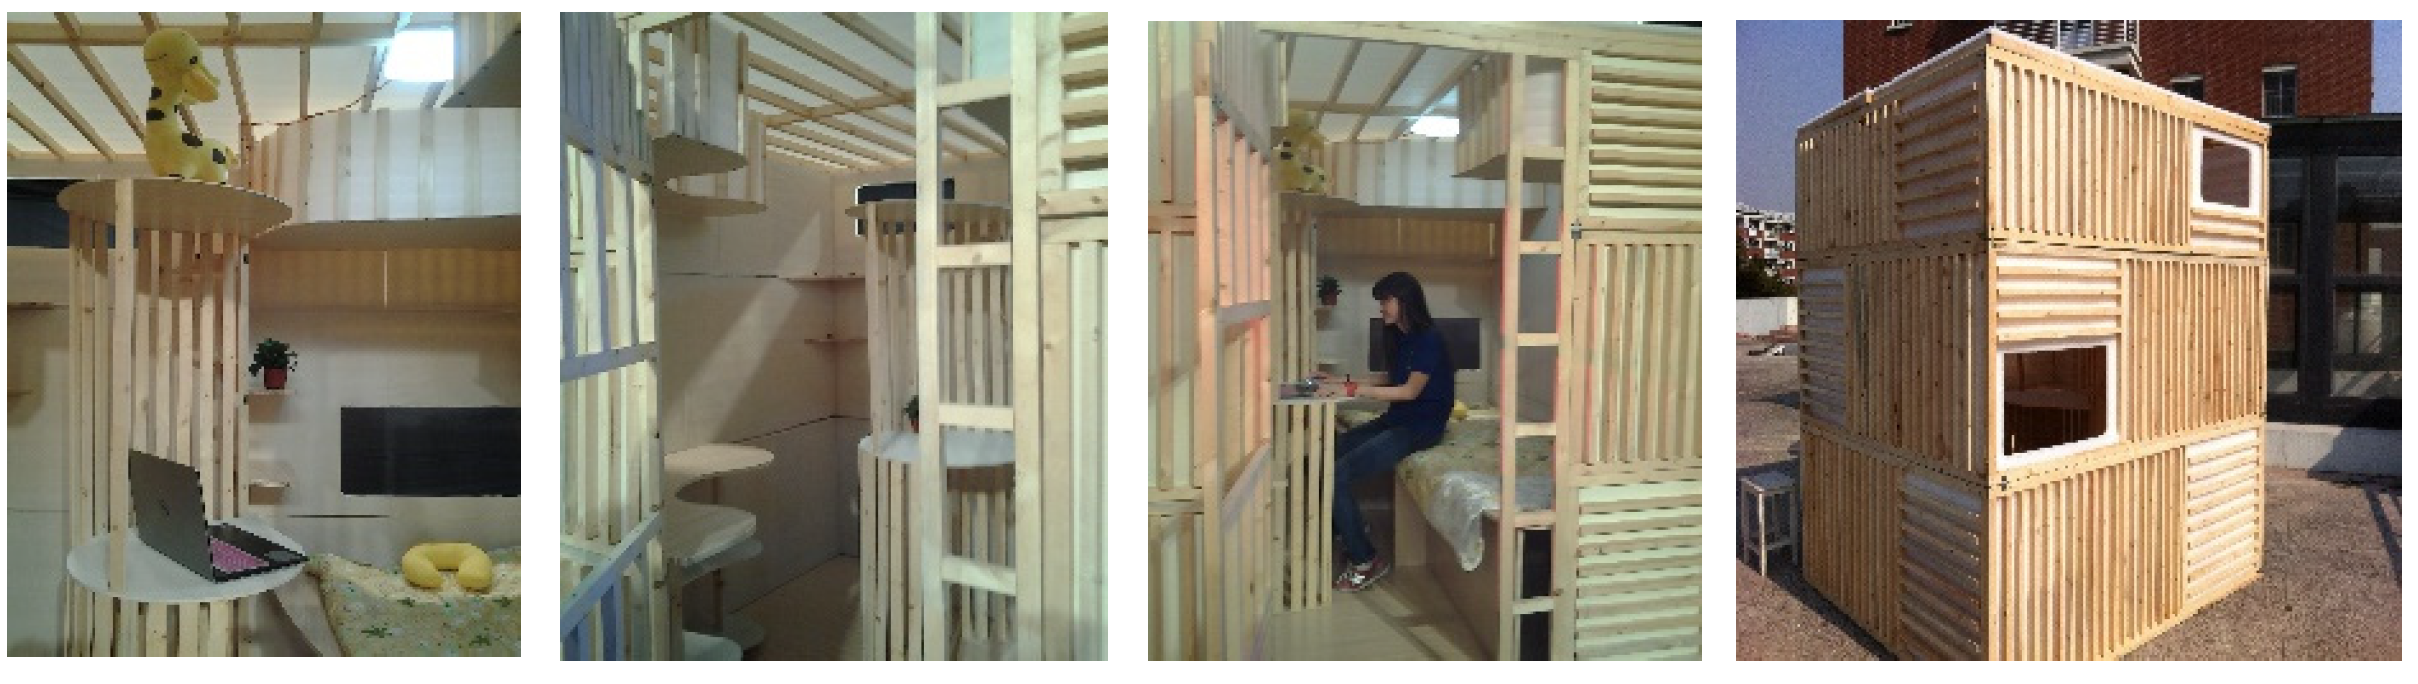
2. The Design and Construction of NLMB

For the purpose of studying human indoor environmental satisfaction inside NLMBs, a real-size (1:1) building was built. The building was designed using ergonomics theory and the non-linear method. A digital model was built by Rhinoceros version 6.0 and images were generated by Sketchup version 13.0, as shown in Figure 1 [13,14]. Afterwards, the real-size building was built. The completed building, as shown in Figure 2, is located on the roof of an academic building in Yangzhou city with a latitude of 31°56′–33°25′ N, a longitude of 119°01′–119°54′ E and 4~8 m of average sea level elevation. Yangzhou is located in the south central Jiangsu Province of China, which is in the middle and lower reaches of the Yangtze River, and has a temperate, humid monsoon climate, with a recorded annual average temperature of 14.8–15.3 °C, annual precipitation of 961–1048 mm, annual sunshine of 1896–2182 h and a solar radiation value of 4200~5000 MJ/(m2·a) [15]. Because the building is in an open area, the test process is affected by solar radiation and outdoor air parameters, which will bring fluctuations to the indoor thermal environment parameters. To some degree, these fluctuations make the subjective test more authentic, because NLMBs are usually greatly influenced by the external environment, and this is a main feature of NLMBs themselves. Therefore, this study selects the weather with similar meteorological parameters and relatively more subjects to achieve a comparatively preferable accuracy.
As a typical type of NLMB, this building makes use of mortise and tenon joint structures. Although the floor area is only 4.4 m2, the building is well furnished with a bed, desk, shower, stool, cupboard, cooking bench, storage rack and hanging cabinet, which can provide for various daily life functions and be suitable for one or two people to live in. The internal dimensions of the building are 2.1 m (length) × 1.9 m (width) × 2.25 m (height). Polyurethane foam plastic, as a usual material, is used for the building envelope as its thermal insulation material, with a thickness of 0.05 m; its thermo-physical properties are listed in Table 1. There are two windows on the south wall and one on the north wall, which generate relatively favorable natural ventilations. An LED light (8.0 W) is set in the ceiling.

3. People’s Indoor Environmental Satisfaction Survey for NLMB

People’s indoor environment influences can be identified through the perceptive-cognitive aspects of a building that subsequently lead to affective responses such as satisfaction or dissatisfaction, annoyance or lack of annoyance and heat or cold. Semantic differential tests are generally used for assessing people’s feedback [15]. In this study, the descriptions for the semantic differential test were selected from words that people use to describe or comment on buildings, including seven assessments relating to the thermal sensation, the humidity sensation, the draft sensation, the air freshness sensation, the visual sensation, the noise sensation and the overall indoor environmental satisfaction.
The surveys were conducted from 2:00 p.m. to 6:00 p.m. on 3–8 February 2020. Table 2 shows the recorded meteorological data of these days, including daily average temperature, daily average relative humidity, weather condition, wind direction and wind scale. These meteorological data were collected from Yangzhou Meteorological Station.
Questionnaire survey forms were administered personally to selected subjects, who stayed in the building for ten minutes [16]. The experimental conditions were not mentioned to the participants to avoid potential experimental bias [7]. Since most of the users of NLMBs are young people, college-aged students at Yangzhou University were selected as these subjects. Each subject had to be healthy and energetic during the survey. One hundred and forty-three subjects that consisted of college-aged male and female students were asked to fill out the questionnaire. They evaluated the seven sensations by using a seven-point numeric scale in a random order to avoid the influence of the order on the test [15]. Of these, one hundred and twenty acceptable responses were analyzed. Participating subjects were rewarded with a notebook each. Sex, body length and body weight were noted on each subject’s questionnaire form, which were later used as filters to analyze the data gathered, as shown in Table 3. In Table 3, 1.70 m and 1.59 m is the average height of Chinese adult males and females, respectively, and 67.7 kg and 59.6 kg is the average weight of Chinese adult males and females, respectively.
Table 4 shows the set of questions about human sensations that were asked to the subjects. Votes for the sensation and comfort dimensions were analyzed against seven semantic differential scales, starting from (−3) until (3). For example, the thermal sensation includes 7 semantic scales such as hot (3), warm (2), slightly warm (1), neutral (0), slightly cool (−1), cool (−2) and cold (−3) [15]. The Statistical Package for Social Sciences (SPSS) version 19.0 was used to analyze the data using analysis of variance with multiple linear regression models. A KMO (Kaiser-Meyer-Olkin) test and a Bartlett’s Test of Sphericity were applied before calculation. Afterwards, votes for indoor environmental satisfaction were counted against the percentage scale, starting from (0) until (1), in order to study the total comfort effects of NLMBs. Furthermore, an additional series of questions were designed to measure the strength of the perceptions and attitudes of these subjects. In the meantime, in-depth interviews were also conducted by investigating the detailed perceptions and attitudes of these subjects.

4. Results

4.1. Weight Factors of Sensation and Comfort Dimensions

By the calculation of the SPSS, the KMO (Kaiser-Meyer-Olkin) is 0.722 (>0.7). The significant probability of the Bartlett’s Test of Sphericity is 0.003 (<0.05), which proves that the method of principle component analysis is basically suitable. Because the Eigen values of components 1 and 2 are above 1.000, components 1 and 2 are chosen as principal components, as shown in Table 5.
In Table 5 and Table 6, the charge numbers, Eigen values and variance contribution rates of components 1 and 2 are obtained from the SPSS. The coefficients of linear combination are calculated according to the Eigen values and charge numbers. Using variance contribution rates as weights, comprehensive factor scores are obtained by a weighted average of the coefficient of linear combination. Weight factors are normalized by comprehensive factor scores.

4.2. The Importance of the Thermal, Humidity, Draft, Air Freshness, Visual and Noise Sensations on People’s Indoor Environmental Satisfaction

From the weight factors listed in Table 6, it can be observed that the importance of all the six sensations cannot be ignored, although they are somewhat different. Among these, the humidity sensation (weight factor is 0.21) is the most important element in terms of evaluating people’s indoor environmental satisfaction, followed by the thermal sensation, and then the noise sensation, the visual sensation, the air freshness sensation and the draft sensation.

4.3. People’s Indoor Environmental Satisfaction Survey

According to 120 effective reports, statistical data concerning satisfaction levels for six different dimensions were gained. After that, an overall indoor environmental satisfaction level was obtained by taking a weighted average of above six dimensions, as shown in Table 7. From Table 7, it can be seen that the draft sensation is the most satisfactory, followed by the visual sensation, and then the noise sensation, the air freshness sensation, the thermal sensation and the humidity sensation. The satisfaction levels of these sensations are all on a satisfactory scale except the humidity sensation, which is on a relatively satisfactory scale.

4.4. The Strength of the Perception and Attitude of People

Ten questions were prepared for the subjects after they had finished their indoor sensations votes. All of the conversations were recorded by cell phone and then were conducted to obtain a comprehensive and valuable conclusion. The questions and measures are shown in Table 8. It should be emphasized that the aim of the work is not only to gather extensive data on people’s perceptions and attitudes but also to carry out comparative and qualitative research using a robust sample of 143 interviews about NLMBs [17,18].

5. Discussion

Before the discussion, it must be noted that the recorded meteorological data of six test days are different. Because the test time of each person was 10 min, and 143 subjects were prepared, it was impossible to finish the investigation in one afternoon. Accordingly, the meteorological conditions of each test were different from each other. However, even so, it can be found in Table 2 that there was no significant difference in temperature, humidity, wind and solar radiation conditions; that there was no rain in all of these six days and that the test time was selected as 2:00–6:00 p.m. In this way, the influences resulting from the meteorological data are relatively stable, and the statistical average results can basically represent human satisfaction in NLMBs under typical meteorological conditions in winter in the middle and lower reaches of the Yangtze River, which has a temperate, humid monsoon climate.
Through the overall indoor environment votes, it is showed that the humidity sensation of people in NLMBs plays a most important role among the other comfort sensations, compared with the crucial importance of the thermal sensation in indoor environments shown in many other studies for common buildings [19,20,21,22,23]. Because the space of the NLMB is quite narrow, the moisture gain released from people accounts for a considerable proportion that contributes to the total moisture gains. As a consequence, the humidity sensation has a great influence on the overall human sensation. Especially in winter, the moist feeling is enhanced by the cold feeling even though the relative humidity does not change. Under good natural ventilation, water vapor will quickly spread to the outside, and thus it is expected that the significance of the humidity sensation will drop along with the increase of the draft sensation [24,25,26,27].
The statistical results also showed that the thermal sensation is the second important factor in evaluating comfort effects in NLMBs. Furthermore, the noise sensation and the visual sensation are next, and the draft sensation is the least important. This is probably because the subjects of investigation are all young people, and thus the draft sensation is a subject of slight concern. When the average ages of the voters are older, it can be predicted that the importance of the draft sensation will be greater.
Moreover, among other relative weights of thermal sensation, humidity sensation, air freshness sensation, visual sensation and noise sensation for the overall indoor environmental rating obtained in previous field studies, thermal sensation and humidity sensation have a greater impact on occupants, followed by noise sensation and visual sensation [28,29,30,31,32,33]. For example, in a test, the weight of thermal sensation is 0.173 (winter), while the weight of noise sensation is 0.160 and that of visual sensation is 0.146. The trend of the data is similar to the data in this paper [33]. However, there are also a few differences compared with other literature. For example, in one study, the weight of thermal sensation is 0.41, while that of noise sensation is 0.22, that of freshness sensation is 0.21, and that of visual sensation is 0.16. The weight of freshness sensation is greater than that of visual sensation [34]. From the results of the indoor environmental satisfaction, it can be found that all of the human sensations were satisfactory except the humidity sensation, which was relatively satisfactory. This showed that the weight factor and the satisfaction value have some correlation. Because the subjects are not very satisfied with the humidity sensation, the negative effect of the humidity sensation has been enlarged so that a larger weight factor is obtained. The feeling of subjects is undoubtedly an important factor in evaluating indoor environments; however, the perceptual understanding will surely be affected by the human mind. It can be expected that if most of the subjects are satisfied with the humidity sensation, the weight factor of the humidity sensation will probably have a slight decline.
Based on the results, it can be found that the overall indoor environmental satisfaction is quite high (0.81). As a part of the overall human sensations, the thermal sensation is satisfactory, although it is relatively cold in the winter of Yangzhou. In Table 2, it can be observed that outdoor temperatures in Yangzhou from February 3 to February 8 are all lower than 8 °C. Under such outdoor conditions, it is well-known that most people will feel cold and dissatisfied in common non-air-conditioned rooms, even if they are in winter clothes. For the purpose of discussing this problem, the significance of body heat dissipation must be considered. In common non-air-conditioned rooms, body heat dissipation is not a crucial factor in the consideration of the total heat gain; thus it cannot have a comparatively great influence on indoor thermal comfort. Nevertheless, studies have shown that the significance of body heat dissipation can be associated with the floor area and the volume of the room, and, in a general sense, the smaller the room is, the more important the body heat dissipation is [35,36,37,38]. Accordingly, in such a narrow building, in which the floor area is only 4.4 m2, the effect of body heat dissipation will surely be enhanced. When the heat is released from human body, the air around the body will be warmed and will flow to the rest of the room. Meanwhile, the air and the solid surfaces in the room will be heated by the warm air around the body by the method of heat convection. In common rooms, the heat released by an occupant can hardly flow back to this occupant and thus affect its thermal sensation. However, in such a narrow space, an occupant will probably receive the heat by means of air circulation and then be warmed. In a word, this is a dynamic feedback process in which the heat released from the human body will partly turn back to the body itself, thus bringing a warmer and more comfortable feeling to the body. It can also be expected that if the ventilation is strengthened, the feedback process will be weakened on account of the heat loss to the outdoors. However, on the other hand, what should be known is that the feedback process in summer will also increase the heat of the human body, making it yet more uncomfortable. Because of this, surveys and analysis on summer conditions should be conducted in follow-up studies to obtain clarity about the details of the feedback process in summer.
Further studies were conducted by the method of in-depth interviews. Results showed that negative factors such as fatigue, dizziness and headache did not appear for most of the people. This is probably due to the inadaptability in such a narrow space; there were very few people who felt slightly annoyed. When the filters from Table 3 were used, it was observed that the feelings of annoyance of the tall and fat persons were in some ways stronger than those of the short and thin persons. This is probably because taller and fatter persons will occupy larger action space, and thus there are more possibilities for collision in NLMBs. It may be thought that the concern about collision strengthens the feeling of annoyance. Fortunately, a benefit of the reasonable design of the furniture using ergonomic methods was that the annoyed people were very few.
Findings from the interviews also showed that most of the people considered their body agility and mental agility to not be affected by such a narrow space. For the minority who considered themselves to be affected, the bodily agility decreased but the mental agility increased. For the former, it is probably because the relative narrow space had limited their action in some ways, just as they said. For the latter, one of the reasons may be that the slightly cold feeling can make one’s mind clearer. In spite of this, another reason for the increase of mental agility was found by traversing the conversations of a few interviewees; as a female student said: “Inspiration comes from space.” Studies have shown that there are some correlations between architectonics and psychology, and architectural space can affect a person’s thinking [39,40,41]. Among these interviewees who considered themselves to be affected, almost all of them agreed that the fancy and aesthetic style of this kind of architectural space can give them pleasure, and thus a positive attitude can be obtained. “When a person is in NLMB, just like a scientist in his laboratory, or a writer in his writing room, its distracting thoughts may be dismissed and its attention may be focused, which will lead to a high efficiency,” a male student said.
The studies regarding people’s moods showed that an NLMB can provide some good feelings to interviewees, such as the sense of security and relaxation for the majority, and happiness and excitement for a part. By the above analysis, it can be shown that the positive moods may also be derived from the distinctive architectural spatial form. To some extent, the security and relaxation comes from the sense of belonging, just like they are in their own house. For some sensitive people, even more positive senses can be acquired, such as happiness and excitement.
The results regarding humans’ physiological and psychological reactions showed that the majority of these interviewees had no obvious negative or unhealthy reaction. Although it was relatively cold in winter, nobody felt shivery, painful or experienced their heart beating faster in physiological terms, and nobody felt nervous, depressed or pessimistic in psychological terms. Consequently, it can be suggested that the NLMB can provide enough comfort environment for its occupants even when it is winter. However, it is still to be noticed that the sense of slight numbness appeared on the fingertips or faces of some of the interviewees. Obviously, the numbness is caused by the cold weather, and, generally, the fingertips and the face are the parts which have lowest surface temperatures in one’s body. When the filters from Table 3 were used in further investigation, it was found that the interviewees who felt slightly numb were mainly female students. The difference may surely involve different physiological parameters between males and females, such as the levels of muscle, fat, thyroxin, sex hormone, etc. [42].
The final question of these in-depth interviews showed that many people have a willingness to purchase NLMBs and would be pleased to live in one. Based on the above investigations, there is no doubt that NLMBs have many advantages in comparison with other architectural spatial forms. When the filters from Table 3 were used, it was found that female students are more numerous than male students among these potential purchasers. The reason for this may be that, compared with men, women usually have a stronger tendency towards owning delicate and fantastic things. In the words of a female student, “Every woman desires to have a feeling of home, and NLMB gives her this feeling”.

6. Conclusions

The present study was conducted to examine the response of people staying in NLMBs towards their indoor sensation and comfort votes under the typical climatic conditions in winter in the middle and lower reaches of the Yangtze River, which has a temperate, humid monsoon climate. Through the calculation of weight factors, it is suggested that the humidity sensation (0.21) of people in NLMBs is the most important element when evaluating people’s indoor environmental satisfaction, followed by the thermal sensation (0.20), the noise sensation (0.18), the visual sensation (0.16), the air freshness sensation (0.13) and the draft sensation (0.12). Through the investigation of indoor environmental satisfaction, it is shown that the humidity sensation (0.71) of people is relatively satisfactory, while the thermal sensation (0.81), the air freshness sensation (0.82), the noise sensation (0.83), the visual sensation (0.85) and the draft sensation (0.87) are all satisfactory. Although it is relatively cold outside, the overall indoor environmental satisfaction (0.81) is quite high. As a result, a dynamic feedback process is proposed for NLMBs. It is expected that the heat released by the human body will partly turn back to the body itself, thus bringing a warmer and more comfortable feeling to the body. Based on this finding, the heat released by the human body can play a relatively important role in improving the thermal environment of minimum buildings and make NLMBs become a kind of low carbon building in this respect. In regard to the results of the in-depth interviews, many people experienced good feelings or experiences when they stayed in NLMBs, but there are still very few people who experienced relative undesirable feelings or experiences. Most of the people considered their body agility and mental agility to not be affected by such a narrow space. The senses of security, relaxation, happiness and excitement were provided to some people in NLMBs. The majority of these people had no obvious negative or unhealthy influence on their physiological and psychological conditions. In general, most people showed a significant preference for NLMBs, and some of them have a willingness to own one.
In the study, individual differences regarding sex, body length and body weight are taken into consideration to satisfy the needs of different people. The results provide useful insights into different people’s perceptions and attitudes to the built environment in NLMBs, including their general levels of awareness and their reactions. The present study has some limitations, as it is focused on only six sensations and six comfort dimension attributes within indoor environmental satisfaction. The assessment of occupants’ preferences and other behavioral measurements in order to study occupants’ cognitive-perceptive perspective of the indoor environment in NLMBs is needed.

Author Contributions

Conceptualization, Y.L. and X.C.; methodology, Y.L.; software, W.L.; validation, Y.L.; formal analysis, Y.L.; investigation, Y.L. and W.L.; resources, Y.L.; data curation, Y.L.; writing—original draft preparation, Y.L.; writing—review and editing, X.C.; funding acquisition, X.C. All authors have read and agreed to the published version of the manuscript.

Funding

This research was funded by the National Natural Science Foundation of China, grant number 51978598; National Natural Science Foundation of China, grant number 51508494; Science and Technology Project of Ministry of Housing and Urban-Rural Development of China, grant number 2014-K2-022.

Institutional Review Board Statement

Not applicable.

Informed Consent Statement

Informed consent was obtained from all subjects involved in the study.

Data Availability Statement

Not applicable.

Conflicts of Interest

The authors declare no conflict of interest.

References

  1. Warouw, F.; Kobayashi, H.; Jung, J. A Study on the Open Building System for Multi-Storey Housing in Indonesia. J. Asian Arch. Build. Eng. 2010, 9, 339–346. [Google Scholar] [CrossRef]
  2. Lehmann, S. Developing A Prefabricated Low-Carbon Construction System Using Cross-Laminated Timber (Clt) Panels for Multistorey Inner-City Infill Housing in Australia. J. Green Build. 2012, 7, 131–150. [Google Scholar] [CrossRef]
  3. Slavid, R. Micro: Very Small Buildings; Laurence King Publishing Ltd.: London, UK, 2007. [Google Scholar]
  4. Seonwook, K.; Miyoung, P. Mobile Architecture. DAMDI Publishing Co.: Seoul, Korea, 2011; pp. 140–149, 348–353. [Google Scholar]
  5. Mui, K.W.; Tsang, T.W.; Wong, L.T.; Yu, Y.P.W. Evaluation of an indoor environmental quality model for very small residential units. Indoor Built Environ. 2018, 28, 470–478. [Google Scholar] [CrossRef]
  6. Wardono, P.; Hibino, H.; Koyama, S. Effects of Interior Colors, Lighting and Decors on Perceived Sociability, Emotion and Behavior Related to Social Dining. Procedia Soc. Behav. Sci. 2012, 38, 362–372. [Google Scholar] [CrossRef] [Green Version]
  7. Yang, W.; Moon, H.J. Combined effects of acoustic, thermal, and illumination conditions on the comfort of discrete senses and overall indoor environment. Build. Environ. 2018, 148, 623–633. [Google Scholar] [CrossRef]
  8. Spence, C. Temperature-Based Crossmodal Correspondences: Causes and Consequences. Multisens. Res. 2020, 33, 645–682. [Google Scholar] [CrossRef]
  9. Eisenman, P.; Dobn, S. Eisenman Architects: Selected and Current Works; The Images Publishing Group: Melbourne, Australia, 1996. [Google Scholar]
  10. Oosterhuis, K. Simply complex, toward a new kind of building. Front. Archit. Res. 2012, 1, 411–420. [Google Scholar] [CrossRef] [Green Version]
  11. Meng-Ying, S.; Chao-Ching, F.; Chun-His, W. Minimum habitable dwelling and the transformation of public housing design in Taiwan from 1920 to the 1960s. J. Asian Archit. Build. Eng. 2015, 14, 247–253. [Google Scholar]
  12. David, R.; Quang, T.D. Urban immigrant worker housing research and design for Da Nang, Viet Nam. Sustain. Cities Soc. 2016, 26, 108–118. [Google Scholar]
  13. Wu, M.; Ma, Z. The Realization of Nonlinear Architectural on the Parametric Model. Phys. Procedia 2012, 25, 1470–1475. [Google Scholar] [CrossRef] [Green Version]
  14. Başak, U.Ç.A.R. Redefinition of architectural representation in the computational design environment: Numeric representation. METU JFA 2011, 29, 99–107. [Google Scholar]
  15. Dahlan, N.D. Perceptive-cognitive aspects investigation in relation to indoor environmental satisfaction collected from naturally ventilated multi-storey student accommodations in Malaysia. J. Indoor Built Environ. 2015, 24, 116–127. [Google Scholar] [CrossRef]
  16. Ji, W.; de Dear, R.; Kim, J.; Zhu, Y.; Cao, B.; Liu, S. Study on the influence of climatic thermal exposure environment changed from cold to hot on human thermal preference. Build. Environ. 2021, 207, 1–10. [Google Scholar] [CrossRef]
  17. Tan, Z.; Roberts, A.C.; Christopoulos, G.I.; Kwok, K.-W.; Car, J.; Li, X.; Soh, C.-K. Working in underground spaces: Architectural parameters, perceptions and thermal comfort measurements. Tunn. Undergr. Space Technol. 2018, 71, 428–439. [Google Scholar] [CrossRef]
  18. Tweed, C.; Sutherland, M. Built cultural heritage and sustainable urban development. Landsc. Urban Plan. 2007, 83, 62–69. [Google Scholar] [CrossRef]
  19. Areti, T.; Tsiros Ioannis, X.; Marialena, N. Seasonal differences in thermal sensation in the outdoor urban environment of Mediterranean climates- the example of Athens, Greece. Int. J. Biometeorol. 2017, 10, 1–18. [Google Scholar]
  20. Pantavou, K.; Theoharatos, G.; Santamouris, M.; Asimakopoulos, D. Outdoor thermal sensation of pedestrians in a Mediterranean climate and a comparison with UTCI. Build. Environ. 2013, 66, 82–95. [Google Scholar] [CrossRef]
  21. Pearlmutter, D.; Jiao, D.; Garb, Y. The relationship between bioclimatic thermal stress and subjective thermal sensation in pedestrian spaces. Int. J. Biometeorol. 2014, 58, 2111–2127. [Google Scholar] [CrossRef]
  22. Rupp, R.F.; Vasquez, N.G.; Lamberts, R. A review of human thermal comfort in the built environment. Energy Build. 2015, 105, 178–205. [Google Scholar] [CrossRef]
  23. Ndetto Emmanuel, L. Matzarakis Andreas. Assessment of human thermal perception in the hot-humid climate of Dar es Salaam, Tanzania. Int. J. Biometeorol. 2017, 61, 69–85. [Google Scholar] [CrossRef] [PubMed]
  24. Yong, C.; Zhang, L.; Fong Alan, M.L. Effects of temperature and supply airflow rate on thermal comfort in a stratum-ventilated room. Build. Environ. 2015, 92, 269–277. [Google Scholar]
  25. Ki-Nam, K.; Doosam, S.; Stefano, S. Correlations in thermal comfort and natural wind. J. Therm. Biol. 2013, 38, 419–426. [Google Scholar]
  26. Li, H.; Qin, O.; Yingxin, Z. Perceptible airflow fluctuation frequency and human thermal response. Build. Environ. 2012, 54, 14–19. [Google Scholar]
  27. Candido, C.; de Dear, R.J.; Lamberts, R. Air movement acceptability limits and thermal comfort in Brazil’s hot humid climate zone. Build. Environ. 2010, 45, 222–229. [Google Scholar] [CrossRef]
  28. Che-Ming, C.; Chi-Ming, L. A study on the comprehensive indicator of indoor environment assessment for occupants’ health in Taiwan. Build. Environ. 2002, 37, 387–392. [Google Scholar]
  29. Astolfi, A.; Pellerey, F. Subjective and objective assessment of acoustical and overall environmental quality in secondary school classrooms. J. Acoust. Soc. Am. 2008, 123, 163–173. [Google Scholar] [CrossRef] [Green Version]
  30. Wong, L.T.; Mui, K.; Hui, P. A multivariate-logistic model for acceptance of indoor environmental quality (IEQ) in offices. Build. Environ. 2008, 43, 1–6. [Google Scholar] [CrossRef]
  31. Bin, C.; Qin, O.; Yingxin, Z.; Li, H.; Hongbo, H.; Gaofeng, D. Development of a multivariate regression model for overall satisfaction in public buildings based on field studies in Beijing and Shanghai. Build. Environ. 2012, 47, 394–399. [Google Scholar]
  32. Ncube, M.; Riffat, S. Developing an indoor environment quality tool for assessment of mechanically ventilated office buildings in the UK–A preliminary study. Build. Environ. 2012, 53, 26–33. [Google Scholar] [CrossRef] [Green Version]
  33. Concettina, M.; Antonino, N.; Matilde, P. Proposal of comfort classification indexes suitable for both single environments and whole buildings. Build. Environ. 2012, 57, 58–67. [Google Scholar]
  34. Leccese, F.; Rocca, M.; Salvadori, G.; Belloni, E.; Buratti, C. Towards a holistic approach to indoor environmental quality assessment: Weighting schemes to combine effects of multiple environmental factors. Energy Build. 2021, 245, 1–15. [Google Scholar] [CrossRef]
  35. Yu-Tuan, C.; Shao-Yi, H.; Bi-Wen, L. Efficiency enhancement on thermal comfort assessment of indoor space with air-conditioner using computational analysis. Math. Probl. Eng. 2014, 2014, 10. [Google Scholar]
  36. Yu-Tuan, C.; Shao-Yi, H. Thermal comfort estimation on indoor space using computational fluid dynamics—A case study of small office room. Adv. Civ. Ind. Eng. 2013, 353, 3015–3019. [Google Scholar]
  37. Wei-Hwa, C.; Chia-Ying, W.; Jian-Sheng, H. Evaluation of cooling ceiling and mechanical ventilation systems on thermal comfort using CFD study in an office for subtropical region. Build. Environ. 2012, 48, 113–127. [Google Scholar]
  38. International Standards Organization. Moderate Thermal Environment Determinations of PMV and PPD Indices and Specifications for the Conditions of Thermal Comfort; ISO: Geneva, Switzerland, 1995. [Google Scholar]
  39. Kathleen, C.; Mads, G.; Damien, R.; Clemence, D.; Amanda, R.; Lauren, M. Stressed spaces: Mental health and architecture. Herd-Health Environ. Res. Des. J. 2013, 6, 127–168. [Google Scholar]
  40. Enser, J.; MacInnes, D. The relationship between building design and escapes from secure units. J. R. Soc. Promot. Health 1999, 119, 170–174. [Google Scholar] [CrossRef]
  41. Koseoglu, E.; Onder, D.E. Subjective and objective dimensions of spatial legibility. Procedia Soc. Behav. Sci. 2011, 30, 1191–1195. [Google Scholar] [CrossRef] [Green Version]
  42. Alicja, B.; Elzbieta, G.; Wieslaw, S.; Szyjkowska, A.; Wieslawa, K.W.; Teresa, M.D. Physiological reaction to work in cold microclimate. Int. J. Occup. Med. Environ. Health 2006, 19, 123–131. [Google Scholar]
Figure 1. Digital model of NLMB.
Sustainability 14 04983 g001
Figure 2. View of 4.4 m2 building.
Sustainability 14 04983 g002
Table 1. Thermo-physical properties of exterior envelopes.
Thermal Conductivity
[W/(m·K)]
Specific Heat Capacity
[kJ/(kg·K)]
Thermal Diffusivity
[10−7 m/s]
Heat Storage Coefficient
[W/(m2·K)]
0.0241.722.960.36
Table 2. Recorded meteorological data of 3–8 February 2020.
Feb. 3Feb. 4Feb. 5Feb. 6Feb. 7Feb. 8
Daily average dry bulb temperature (°C)3.52.12.61.74.27.7
Daily average relative humidity (%)54.355.750.253.252.648.9
Weather conditionSunny/
cloudy
CloudyCloudyCloudy/
sunny
Cloudy/
sunny
Sunny
Wind directionEastNorthwestNorthwestWestSouthwestSouthwest
Wind scale2–32–33–43–42–33–4
Table 3. Sex, body length and body weight distribution of subjects.
SexMaleFemale
Body length (m)<1.70<1.70>1.70>1.70<1.59<1.59>1.59>1.59
Body weight (kg)<67.7>67.7<67.7>67.7<59.6>59.6<59.6>59.6
Number1418161319161014
Table 4. Questions to assess people’s indoor sensations votes.
Question:
How Do You Find the Following Indoor Conditions
When You Are Occupying the Building?
Semantic Differentials (Value)
(−3)-----------------------(0)-----------------------(3)
1. Thermal sensationHot--------------------------------------------------Cold
2. Humidity sensationWet--------------------------------------------------Dry
3. Draft sensation Not noticeable------------------------------------Strong
4. Air freshness sensationStale-------------------------------------------------Fresh
5. Visual sensationDark-------------------------------------------------Bright
6. Noise sensationAnnoyed-------------------------------------------Not annoyed
7. Overall indoor environmental satisfaction
(after considering the above 6 conditions)
Dissatisfied----------------------------------------Satisfied
Table 5. Eigen value and variance contribution rate.
Component 1234567
Eigen value1.901.010.920.890.830.770.69
Variance contribution rate27.1214.3913.0912.7311.8111.019.85
Cumulative variance contribution rate27.1241.5154.6067.3379.1490.15100.00
Table 6. Weight factors calculation.
Principal Component12Principal Component12
Charge numberThermal sensation0.470.25Coefficient of linear combinationThermal sensation0.340.25
Humidity sensation0.620.12Humidity sensation0.450.12
Draft sensation0.56−0.22Draft sensation0.41−0.22
Air freshness sensation0.66−0.30Air freshness sensation0.48−0.30
Visual sensation−0.140.92Visual sensation−0.100.92
Noise sensation0.580.01Noise sensation0.420.01
Comprehensive factor scoreThermal sensation0.31Weight factorThermal sensation0.20
Humidity sensation0.33Humidity sensation0.21
Draft sensation0.19Draft sensation0.12
Air freshness sensation0.21Air freshness sensation0.13
Visual sensation0.25Visual sensation0.16
Noise sensation0.28Noise sensation0.18
Table 7. People’s indoor environmental satisfaction.
SensationSemantic Differentials (Value)
(0)----------------(0.2)-------------------------(0.4)----------------(0.6)---------------------(0.8)----------------(1)
UnsatisfactoryRelatively UnsatisfactoryModerateRelatively UnsatisfactorySatisfactory
Thermal 0.81
Humidity 0.71
Draft 0.87
Air freshness 0.82
Visual 0.85
Noise 0.83
Overall indoor environmental satisfaction0.81
Table 8. Questions to investigate the strength of the perception and attitude of people.
QuestionMeasure
1. Do you feel tired?Majority did not feel tired
2. Do you feel dizzy?Majority did not feel dizzy
3. Do you feel headachy?Majority did not feel headachy
4. Do you feel annoyed?Majority did not feel annoyed; tiny minority felt slightly annoyed
5. How about your body agility?No impact for majority; minority affirmed that their behavior was obstructed
6. How about your mental agility?No impact for majority; some affirmed a more active mind achieved
7. How about your moods?Majority felt safe and relaxed; some felt happy and excited
8. Do you have some physiological reaction caused by the cold?Minority felt slightly numb in fingertips or face; nobody felt shivery, painful or their heart beating faster
9. Do you have some psychological reaction caused by the cold?Nobody felt nervous, depressed or pessimistic
10. Would you like to purchase and live in such a building as your living room?More than half considered it potentially; a few said they would purchase it when they needed to
Publisher’s Note: MDPI stays neutral with regard to jurisdictional claims in published maps and institutional affiliations.

