Article

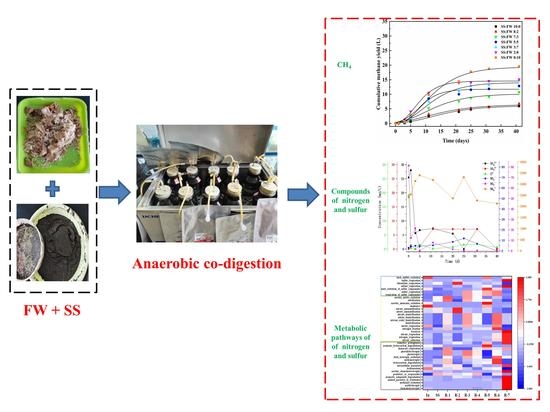
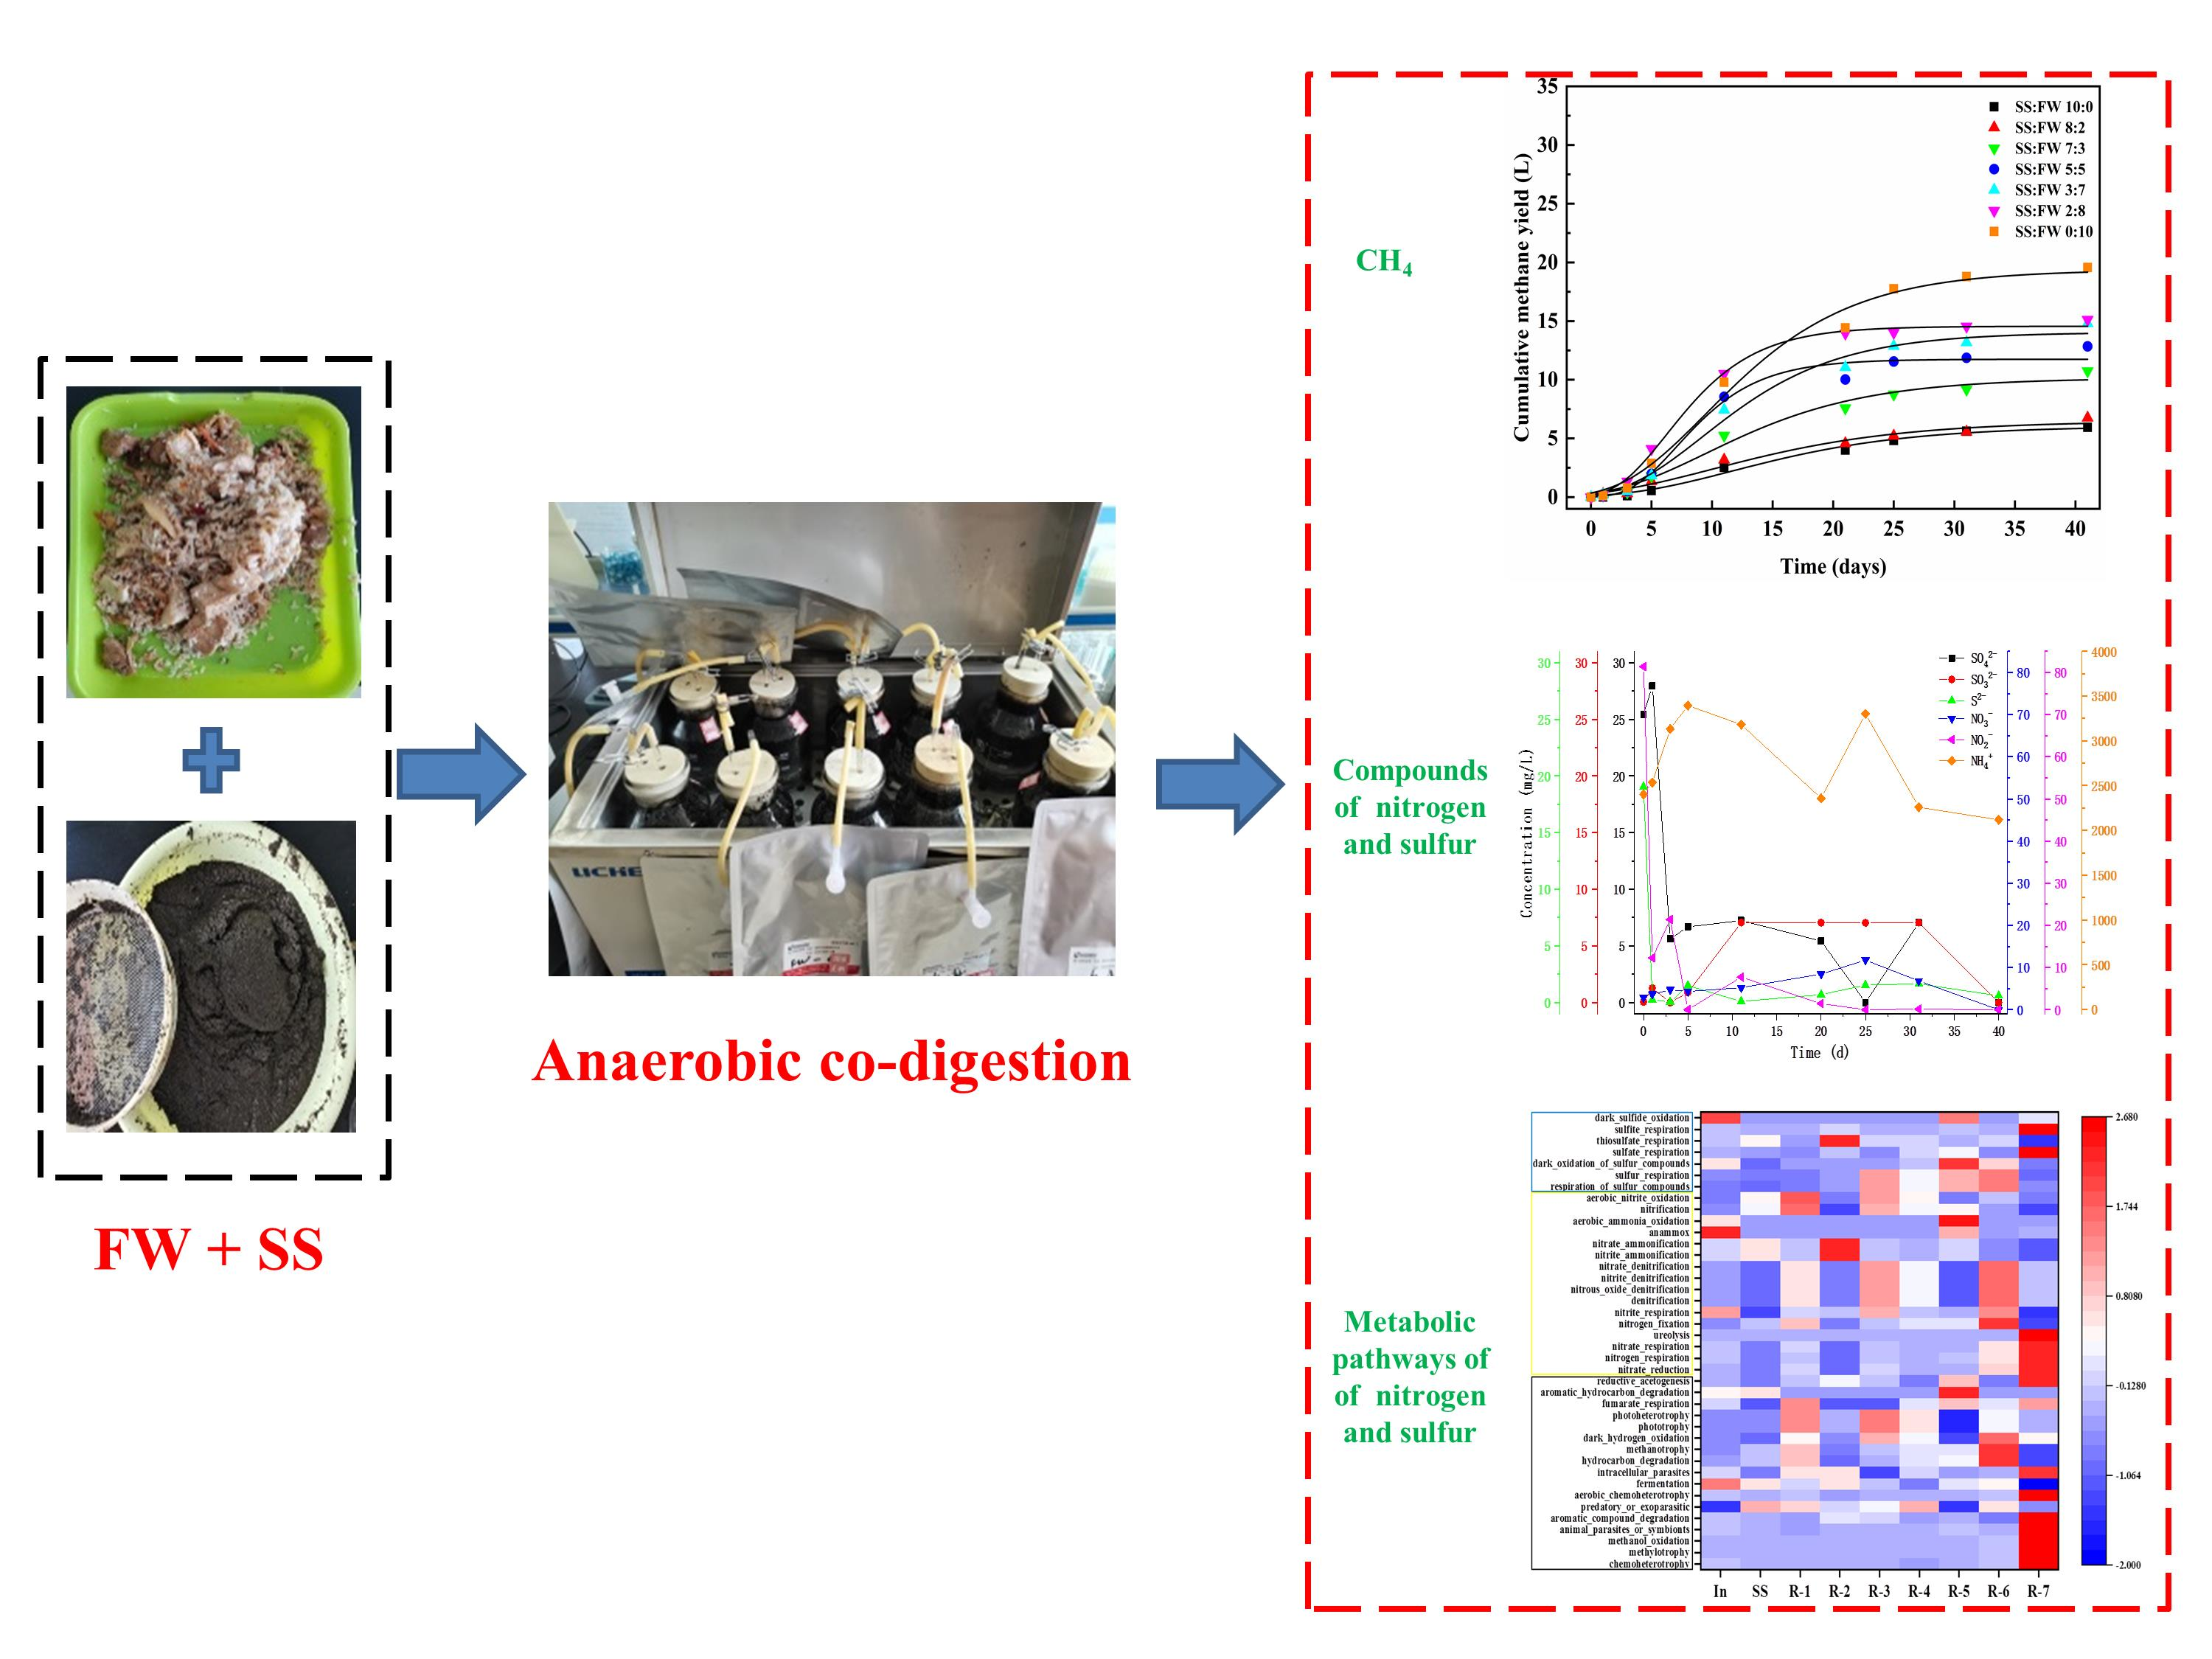
Temporal Variation of Nitrogen and Sulfur Species of Food Waste and Sludge during Anaerobic Co-Digestion

1
School of Chemical and Environmental Engineering, China University of Mining & Technology (Beijing), Beijing 100083, China
2
Research Center for Eco-Environmental Sciences, Chinese Academy of Sciences, Beijing 100085, China
3
College of Resources and Environment, University of Chinese Academy of Sciences, Beijing 100049, China
*
Authors to whom correspondence should be addressed.
Sustainability 2022, 14(9), 4982; https://doi.org/10.3390/su14094982
Submission received: 20 March 2022 / Revised: 16 April 2022 / Accepted: 16 April 2022 / Published: 21 April 2022
(This article belongs to the Special Issue Conversion and Utilization of Biomass Waste)

Abstract

:
Anaerobic co-digestion (AcoD) has been a widely accepted method to treat food waste (FW) and sewage sludge (SS). However, there is a knowledge gap regarding the key speciation transformation of nitrogen and sulfur in AcoD. Here, we explored the changes of nitrogen (N) and sulfur (S) compounds in liquid digestion and biogas, as well as the composition of microbial community structure and related metabolic functions. The results showed that H2S in the biogas was the main form of S in the early stage, and then, it was converted into SO42 and SO32−, while NH3 and NH4+ were the main forms of N during the AcoD. In addition, bacterial diversity was associated with N and S compounds; Syntrophomonas and Aminobacterium were positively correlated to H2S, NH3, NH4+ and SO32, and Saccharibacteria_genera_incertae_sedis, Candidatus_Cloacamonas and Thermomonas were positively correlated to SO42 and NO2. Additionally, the FAPROTAX prediction showed that the functional composition related to N and S metabolism was different from SS and inoculum after the AcoD. This study provides detailed information of conversion of N and S of the AcoD, which could lay a foundation for the subsequent regulation of the mechanism of nitrogen and sulfur compounds in the methanogenic process.

Graphical Abstract

1. Introduction

Food waste (FW) has become a major source of pollution and is ever-increasing in the world. Due to the rapid growth of population and urbanization, more than 100 million tons of food waste will be processed annually in China [1]. If not being properly disposed of, it will cause a detrimental impact on the environment. Additionally, rapid industrialization and urbanization has led to an increase in municipal wastewater treatment plants, and sewage sludge (SS) production has also increased sharply [2]. Researchers have conducted many studies into the effective treatment of sludge. Pyrolysis is one of the solutions for volume reduction of SS, which generates by-products that could promote soil fertility. In particular, char from SS pyrolysis treated with alkaline hydroxide has a good ability to adsorb CO2 [3,4]. Therefore, it is worth studying the combined treatment technology of FW and SS, because large quantities of these wastes are generated at the same locations [5]. Among the existing recycling methods, anaerobic co-digestion (AcoD) has been increasingly used, which can generate biogas and achieve reduction principles for solid waste treatment. Furthermore, compared with mono-digestion of FW or SS, co-digestion could significantly improve the efficiency of methane production. However, a series of inhibitory intermediates are produced in the process of AcoD, which greatly reduces the efficiency of anaerobic digestion. The most significant inhibitors are volatile fatty acids (VFAs), ammonia, sulfate, heavy metals, etc. Therefore, understanding the source, change and toxicity of these inhibitors is very important for the success of anaerobic treatment.
Microorganisms participating in nitrogen (N) transformation produced a series of intermediate products, such as nitrate (NO3), nitrite (NO2), ammonium (NH4+) and ammonia (NH3). NH4+ and NH3 were the main metabolic products inhibiting anaerobic digestion in the process of degradation of FW. At a certain concentration, NH4+ and NH3 can penetrate through the bacterial cell membrane and interfere with methanogenic bacteria, resulting in ions imbalance in microbial cells. When the concentration of NO3 was lower than 750 mg/L, NH3 could be transformed into NO3 by nitrification. Therefore, the inhibitory of NH3 could be effectively reduced [6]. However, the impact of sulfur (S) compounds in FW and SS is usually overlooked in the AcoD. As we all know, H2S is a corrosive, odorous and toxic substance in the biogas [7]. H2S is mainly produced by the hydrolysis of organic sulfur of bacteria, the reduction reaction of sulfate (SO42) and the direct conversion of sulfide (S2) during anaerobic digestion [8]. The production of H2S prolonged the start-up phase of anaerobic digestion and eventually caused a decrease of methanogenesis. Rusín et al. reported that the concentration of H2S produced by anaerobic digestion of FW was around 800 ppm, which is much higher than the limit of 500 ppm [9]. Zan et al. discovered that the presence of SO42 could accelerate the methane production by improving the hydrolysis rate at the concentrations of 50–400 mg/L [10]. However, when the concentration of SO42 is higher than 500 mg/L, the microorganism participated in the AcoD would be inhibited [11]. Interestingly, when occurring simultaneously with other inhibitory conditions or components such as NH3, high H2S concentration hinders the formation of methane generation [12]. In addition, the coupling reactions between N and S compounds could happen with the actions of microorganisms. It has been reported that SO42 and NH3 can be used as an electron donor and acceptor to remove N and S simultaneously under anaerobic conditions, to which nitrate-reducing and sulfide-oxidizing bacteria contribute greatly. Wu found that 0.1 mM NO2 and 0.4 mM NO3 could promote generation of H2S by Shewanella oneidensis in the presence of 0.8 mM SO32. In addition to promoting biomass, NO2 and NO3 were the two preferred electron acceptors in sulfite respiration [13].
Nevertheless, the conversion of N and S compounds in the AcoD of FW and SS is not clear. Understanding the regulation of N and S compounds in the anaerobic digester can be a potential strategy to optimize methane production. In this study, different ratios of SS and FW were mixed as variations to investigate the characteristics and mechanism of the temporal variability of the inorganic N-forms (NO3, NO2, NH4+ and NH3) and inorganic S-forms (SO42, SO32, S2 and H2S) in an AcoD batch process, and the compositions of microorganisms were investigated. The results will help improve the efficiency of methane production and provide opinions for an in situ strategy to regulate nitrogen and sulfur compounds suppression in AcoD of FW with SS in the future.

2. Materials and Methods

2.1. Substrates and Inoculum

The FW was collected in seven consecutive days (a week) from the same restaurant in Erdos City. After classification and weighing, FW were mixed using a grinder to ensure the homogeneity and then stored at 4 °C before use. The FW contained rice, noodles, vegetables and meat with the following composition (terms of wet weight): noodles 10.22%, rice 22.27%, vegetables 44.59%, meat 20% and tofu 2.4%. Sewage sludge used for AcoD was collected from the Beijiao sewage treatment plant of Erdos City and then filtered through a 2 mm sieve. The inoculum was obtained from a reactor running for half a year at 37 °C.

2.2. AcoD Experiments

The batch methane tests were carried out in 1000 mL glass serum bottles with a working volume of 800 mL and at 37 ± 0.2 °C. Different ratios of SS:FW were carried out (based on volatile solids) as follows:10.0:0.0 (R-1), 8.0:2.0 (R-2), 7.0:3.0 (R-3), 5.0:5.0 (R-4), 3.0:7.0 (R-5), 2.0:8.0 (R-6) and 0.0:10.0 (R-7). R-1 and R-7 were used as the control groups for mono-digestion of SS and FW, respectively. The ratio of inoculum to substrates (SS + FW) was 1.0:1.0. The pH value was adjusted by addition of aqueous solutions of 3 M HCl and NaOH to 7.2. Finally, N2 was bubbled into the mixture for 5 min and immediately sealed to create the anaerobic environment.

2.3. Analytical Methods

During the AcoD process on days 0, 1, 3, 5, 11, 21, 31 and 41, 2 mL of digestate were taken for inorganic ions analysis. The pH was analyzed with the pH meter (PHS-3C, INESA, Shanghai, China). SCOD, and S2 were measured according to standard methods [14]. Methylene blue method descripted in the Standard Methods according to the manufacturer’s instructions. Briefly, 0.5 mL of Methylene Blue Kit 1 and 2 were added to the 10 mL samples in turn and shaken. After 5 min, samples were quantified by using a portable spectrophotometer (DR1900, HACH, Loveland, CO, USA) at a wavelength of 665 nm. SO42, SO32, NH4+, NO3 and NO2 were measured by using ion chromatography (ICS-600, Thermo Scientific, Waltham, MA, USA). Anion analysis was equipped with the SH-AC-18 (250 × 4.6 mm, SHINE, Shanghai, China) analytical column. The eluent of ionic consisted of 2.0 mM Na2CO3 and 10.0 mM NaHCO3. Cation Dionex IonPacTM CS 12A RFICTM (250 × 4 mm, Thermo Fisher, Waltham, MA, USA) was used to analyze the NH4+, and the corresponding eluent of ionic consisted of 20 mM CH4O3S. The flow rate was set at 1.0 mL/min. The concentration of methane was analyzed by Gas chromatography (FuLi, GC9790II Taizhou, China) equipped with thermal conductivity (TCD) and flame ionization detector (FID). The column of Gas chromatography was KB-Wax (30 m × 0.32 mm × 0.50 μm, Kromat Corporation, Bordentown, NJ, USA). The temperatures of the TCD, column and the inject port were 100, 80 and 200 °C, respectively. N2 was used as the carrier gas. H2S and NH3 were measured by a Portable gas meter (Dräger X-am, 5600, Dräger, Lübeck, Germany).

2.4. Reagent

Standard materials used for the analysis of inorganic nitrogen and sulfur including an anion mix standard solution of SO42−, SO32−, NO3 and NO2 (1000 mg/L) and a standard solution of NH4+ (1000 mg/L) were obtained from Beijing North Weiye Institute of Measuring and Testing Technology, China. Methylene Blue Kit 1 and 2 used for analysis of S2− were purchased from HACH, China. NaOH, K2CrO7, (NH4)2Fe(SO4)2•6H2O, AgSO4 and HgSO4 were obtained from MACKLIN (AR), China. HCl and H2SO4 were obtained from DM (aq, AR), China. N2 (99.999%) for gas chromatography and for the generation of anaerobic conditions was provided by Kylingas, China.

2.5. Statistical and Kinetic Analysis of Biogas Generation

When using complex solid organic materials as the matrix, the cumulative gas production curve could form a smooth curve. Therefore, the cumulative methane production, the methane productivity constants and the lag phase (λ) are important factors reflecting the efficiency of anaerobic digestion. The modified Gompertz method could be used to estimate the above parameters in the experiment as follows:
CMY(t) = P × exp {−exp[Rm × e × (λ − t)/P + 1]}
where CMY(t) is the actual cumulative methane generation obtained for duration of t; P is the predicted cumulative methane generation of the time t; Rm is the maximum biogas generation; λ is the lag phase period; t indicates the days of experiments, and e is Euler’s number (≈2.71828).

2.6. Microbial Community Analysis

When the production of methane stopped, the samples were collected for the analysis of bacterial and archaeal community composition. DNA for microbial analysis was extracted from suspending mixtures using the E.Z.N.A™ Mag-Bind Soil DNA Kit (OMEGA, USA). Communities of bacteria and archaea were evaluated by PCR amplification of V3-V4 region of 16S rRNA genes. The primers of bacteria were 341F (CCTACGGGNGGCWGCAG) and 805R (GACTACHVGGGTATCTAATCC). The primers of archaea were Arch 340F (CCCTAYGGGGYGCASCAG) and 1000R (GGCCATGCACYWCYTCTC), and Arch 349F (GYGCASCAGKCGMGAAW) and 806R (GGACTACVSGGGTATCTAAT). The main PCR amplification of bacteria and archaea were set up as follows: 2 μL of microbial DNA, 1 μL of forward primer, 1 μL of reverse primer, and 2 × Hieff@ Robust PCR Master Mix. The thermal cycles protocol was performed as follows: 1 cycle of denaturing at 94 °C for 3 min followed by 5 cycles at 94 °C for 30 s, annealing at 45 °C for 20 s, and elongating at 65 °C for 30 s, then 20 cycles of denaturing at 94 °C for 20 s, annealing at 55 °C for 20 s, and elongating at 72 °C for 30 s. Finally, the extension occurred at 72 °C for 5 min. AMPure XP beads were used to purify the free primers and primer dimer species in the application products. The DNA concentrations of PCR products were determined by using Qubit@ 4.0 Green double-stranded DNA assay, and they were quality controlled by using a bioanalyzer (Agilent 2100, Santa Clara, CA, USA). The details of the richness and diversity indices can be found in the Supplementary Materials. Redundancy analysis (RDA) was used to discuss the relationships among bacterial community, inorganic nitrogen and sulfur compounds by running the CANOCO 5.0 Program.

3. Results

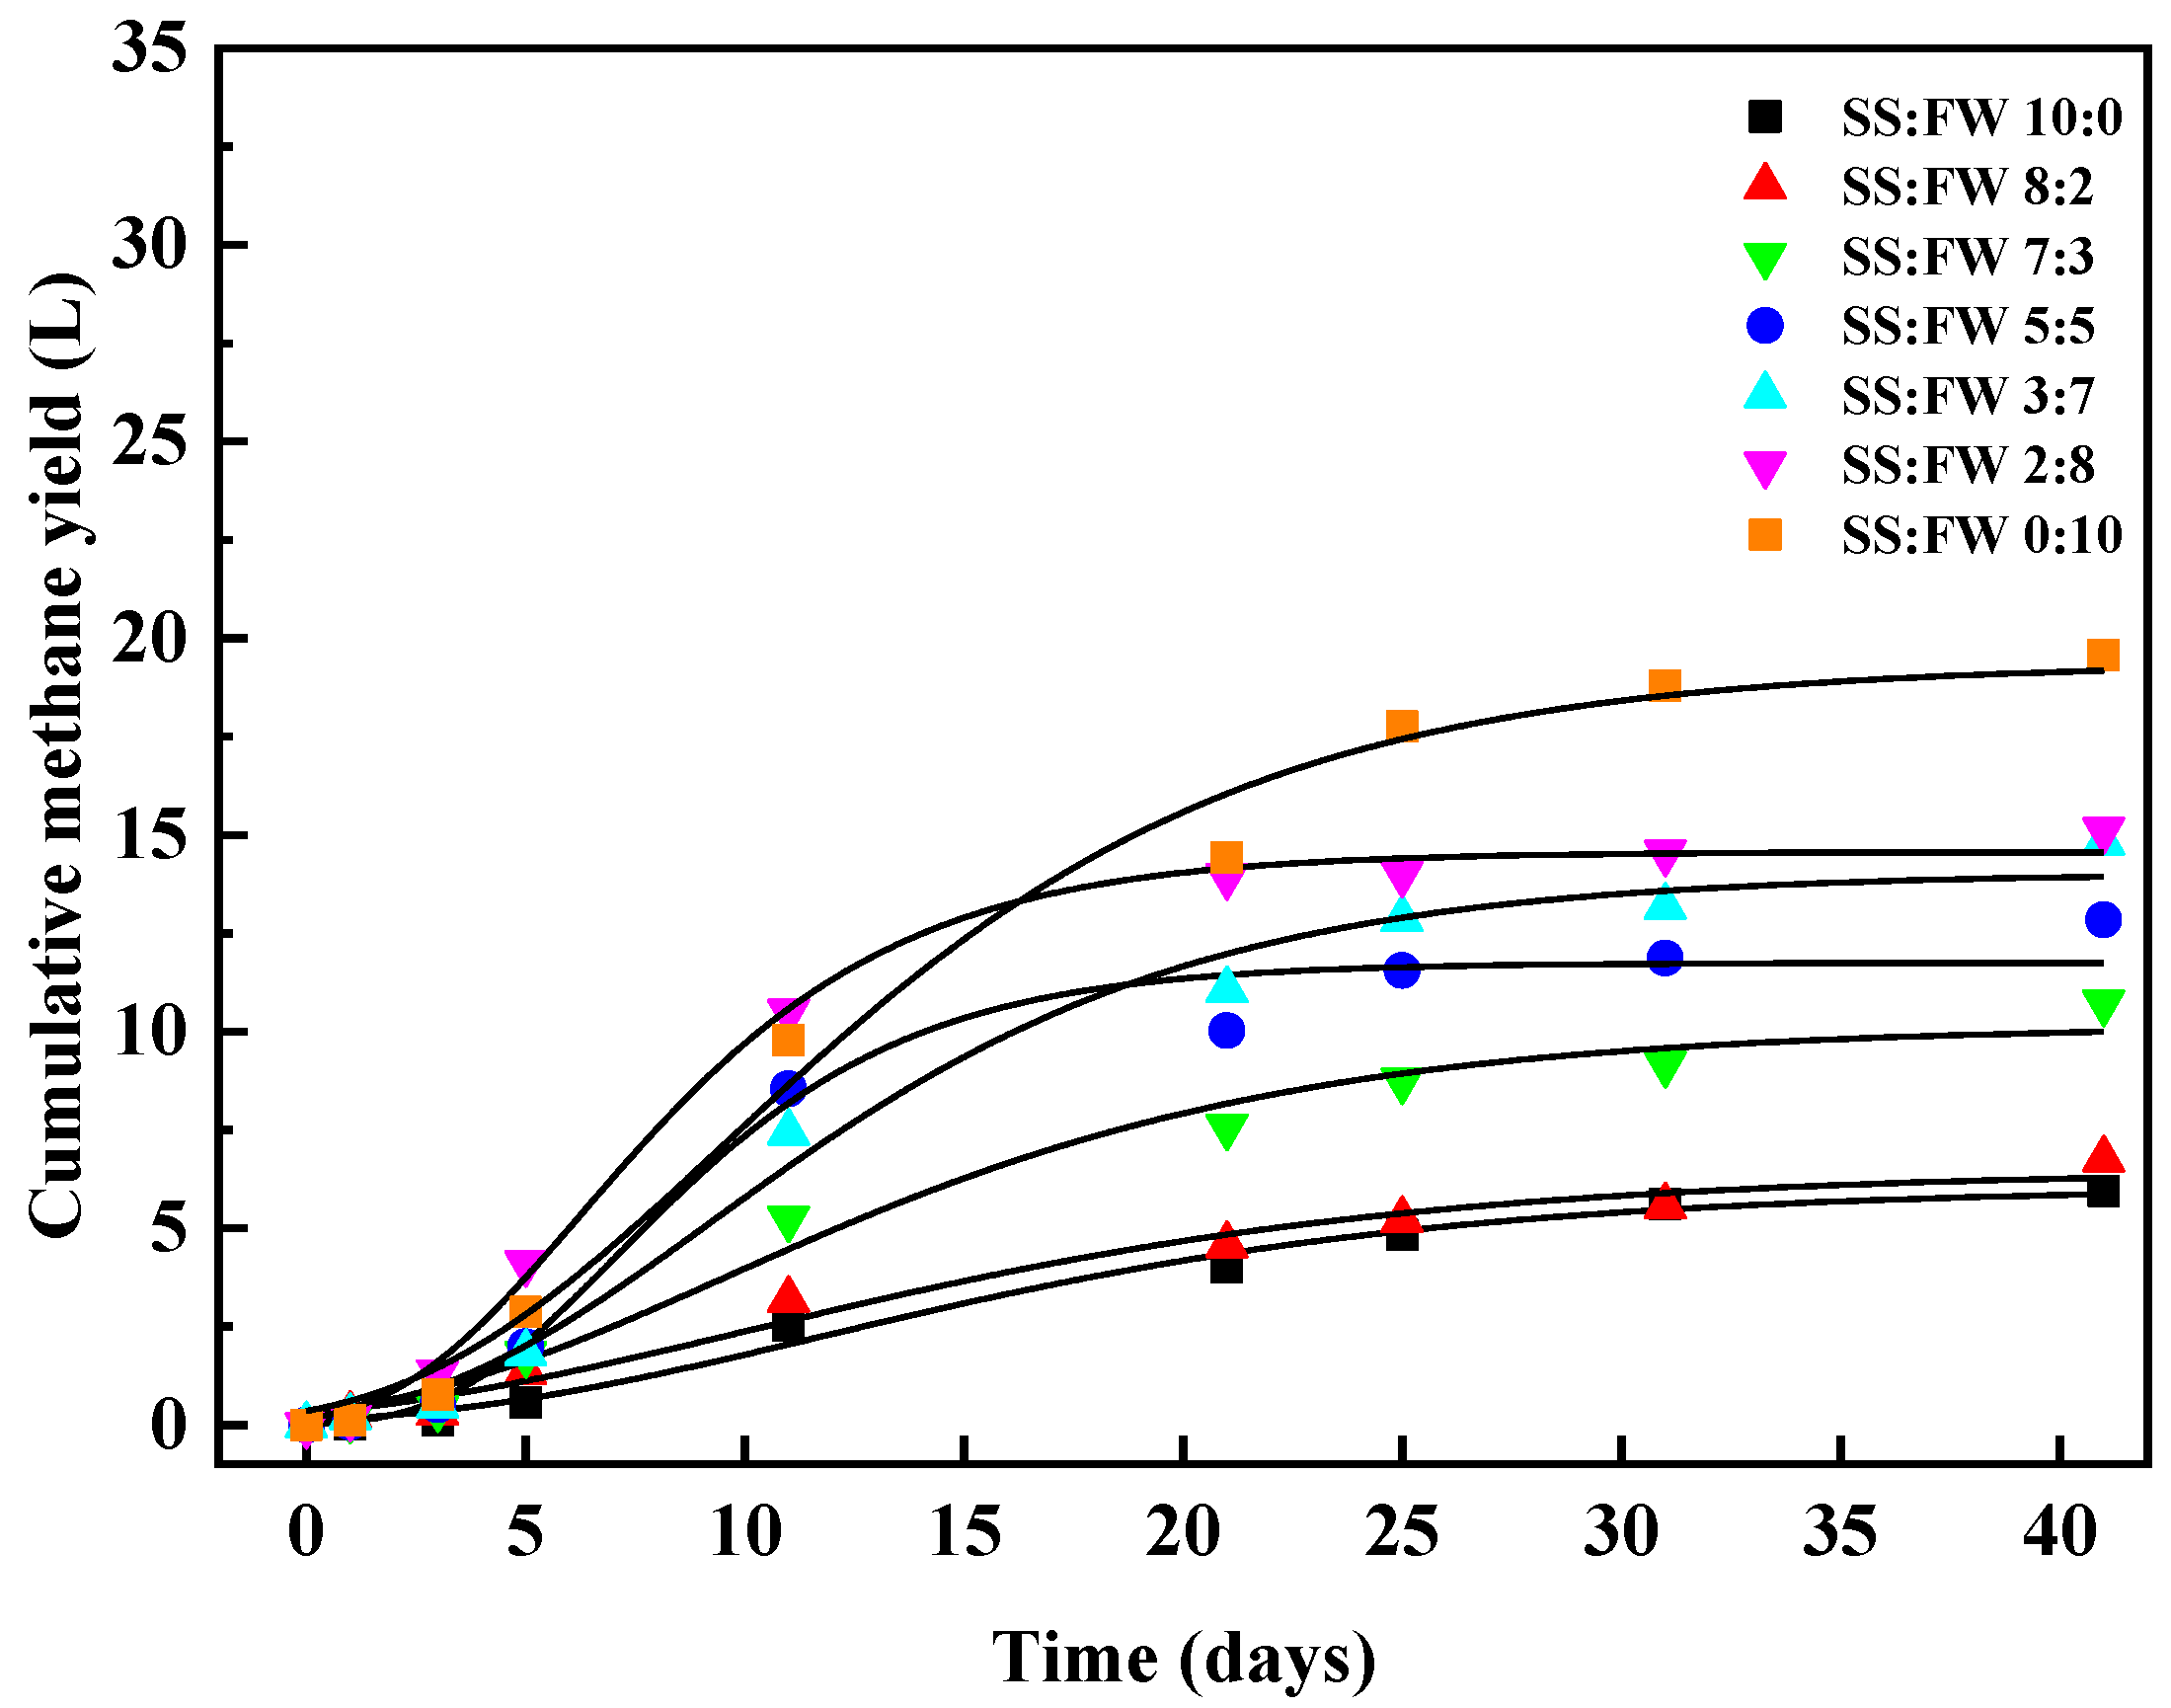
3.1. Cumulative Methane Production

Different nutritional compositions of substrates could lead to different methane production trends. Cumulative methane yield (CMY) for AcoD of SS with FW at different ratios are displayed in Figure 1. With the increase of FW ratio, the cumulative yield of methane also gradually increased, and there was almost no obvious lag phase. These results demonstrated that the activity of the inoculum would not cause severe acidification inhibition during the AcoD. Gu et al. found that sufficient microbial biomass could reduce acid inhibition in the early stage of AcoD, while the inoculum to substrate was 1:1 (based on VS) [15]. The order of CMY showed at the end of the AcoD as follows: 5.95 L(R-1) < 6.75 L(R-2) < 10.73 L(R-3) < 12.84 L(R-4) < 14.81 L(R-5) < 15.12 L(R-6) < 19.57 L(R-7). The order indicated that the mono-degradation of FW generated more methane than the mono-degradation of SS. Therefore, the organic matter of AcoD to produce methane was mainly coming from FW. Additionally, SS could be better utilized together with FW in the increasing ratio of FW. It was worth noting that at the ratio of 2:8, the maximum methane production is achieved faster than 0:10, indicating that a slightly synergistic effect might occur. Liu et al. and Heo et al. also reported that the CMY increased with increasing proportion of FW on anaerobic co-digestion of FW and SS [16,17].

3.2. Kinetic Features

The kinetic parameters could be assessments and predictions of functions of anaerobic digestion properties of FW and SS [15]. However, it is still necessary to select the optimum conditions among different substrate ratios, representing the best performing co-digestion system. In this study, the methane production results were fitted by using a modified Gompertz model in order to obtain these kinetic parameters at different ratios of substrate. From Table 1, the modified Gompertz model provides a high accuracy on fitting data from anaerobic mono- or co-digestion processes (R2 ≥ 0.96). The predicted maximum methane potential increases with the rise of FW proportion in raw materials. Rm and λ are important parameters indicating methane productivity. Higher Rm and lower λ values are more favorable for methane production efficiency. The Rm of 2:8 ratio was 1.30 ± 0.11, which increased by 4.82 and 1.25 folds compared with the SS and FW mono-digestion, respectively. Although the λ of 8:2 ratio was the lowest, which was shortened 1.91 times more than that of 2:8 ratio, its CMY was less than half that of 2:8 ratio. The result is in line with the actual methane yield before (Section 3.1).

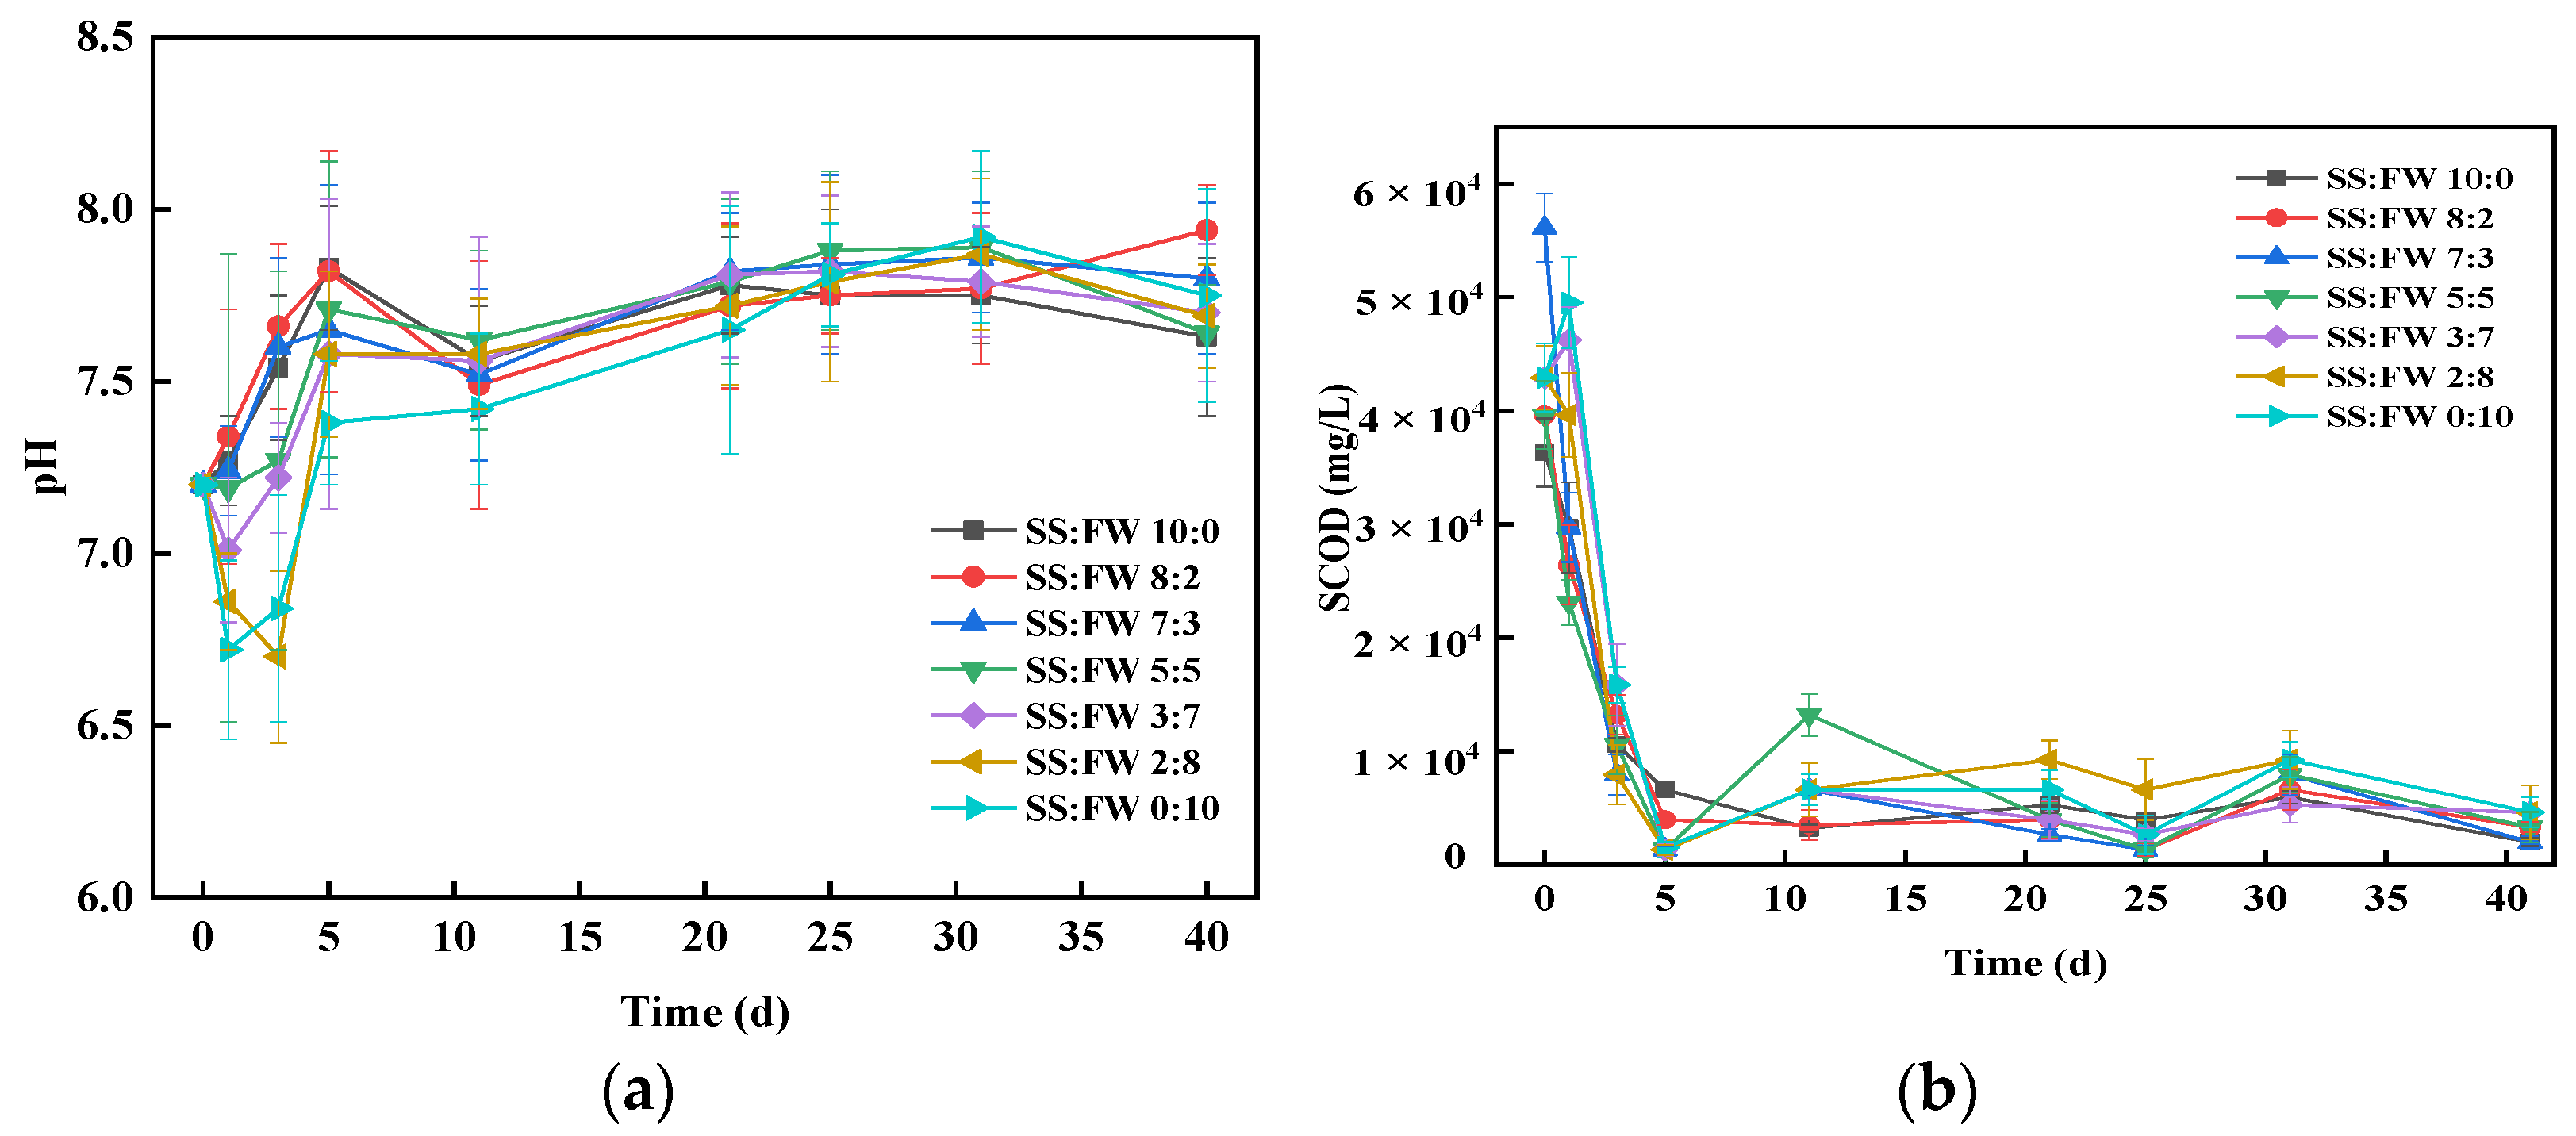
3.3. Stability of AcoD

The pH is a key parameter that reflects the stability of AcoD. Figure 2a showed the variation of pH under different AcoD ratios. The pH value of each group dropped rapidly to around 6.4 in the early stage (0–3 day), then increased and stabilized between 7.2 and 8.0. The highest pH was 7.9 at the ratio of 2:8, while the lowest pH was 7.6 at the ratio of 3:7. Noticeably, the pH changed more significantly with high FW ratios (0:10 and 2:8). This observation could be attributed to the organic matter in FW that produces a large quantity of VFAs in the early stage of the process. Consequently, the VFAs made the rapid drop of pH. Then, afterwards, the continuous release of ammonia made the anaerobic environment alkaline. This could facilitate the growth of methanogens. It was reported that the optimal pH range of methanogenic activity varies between 6.5 and 7.5.
Degradation of soluble organic matter in substrates is an important process affecting anaerobic digestion. In this study, concentrations of SCOD were analyzed throughout the experiment, and the results were shown in Figure 2b. In the early stage of AcoD (0–5 day), corresponding to different ratios, the SCOD decreased to 6600, 3960, 1320, 1320, 1320, 1320 and 1500 mg/L. Some non-degradable macromolecular organic compounds were gradually decomposed by the extracellular enzymes, which resulted in a short increase in SCOD.

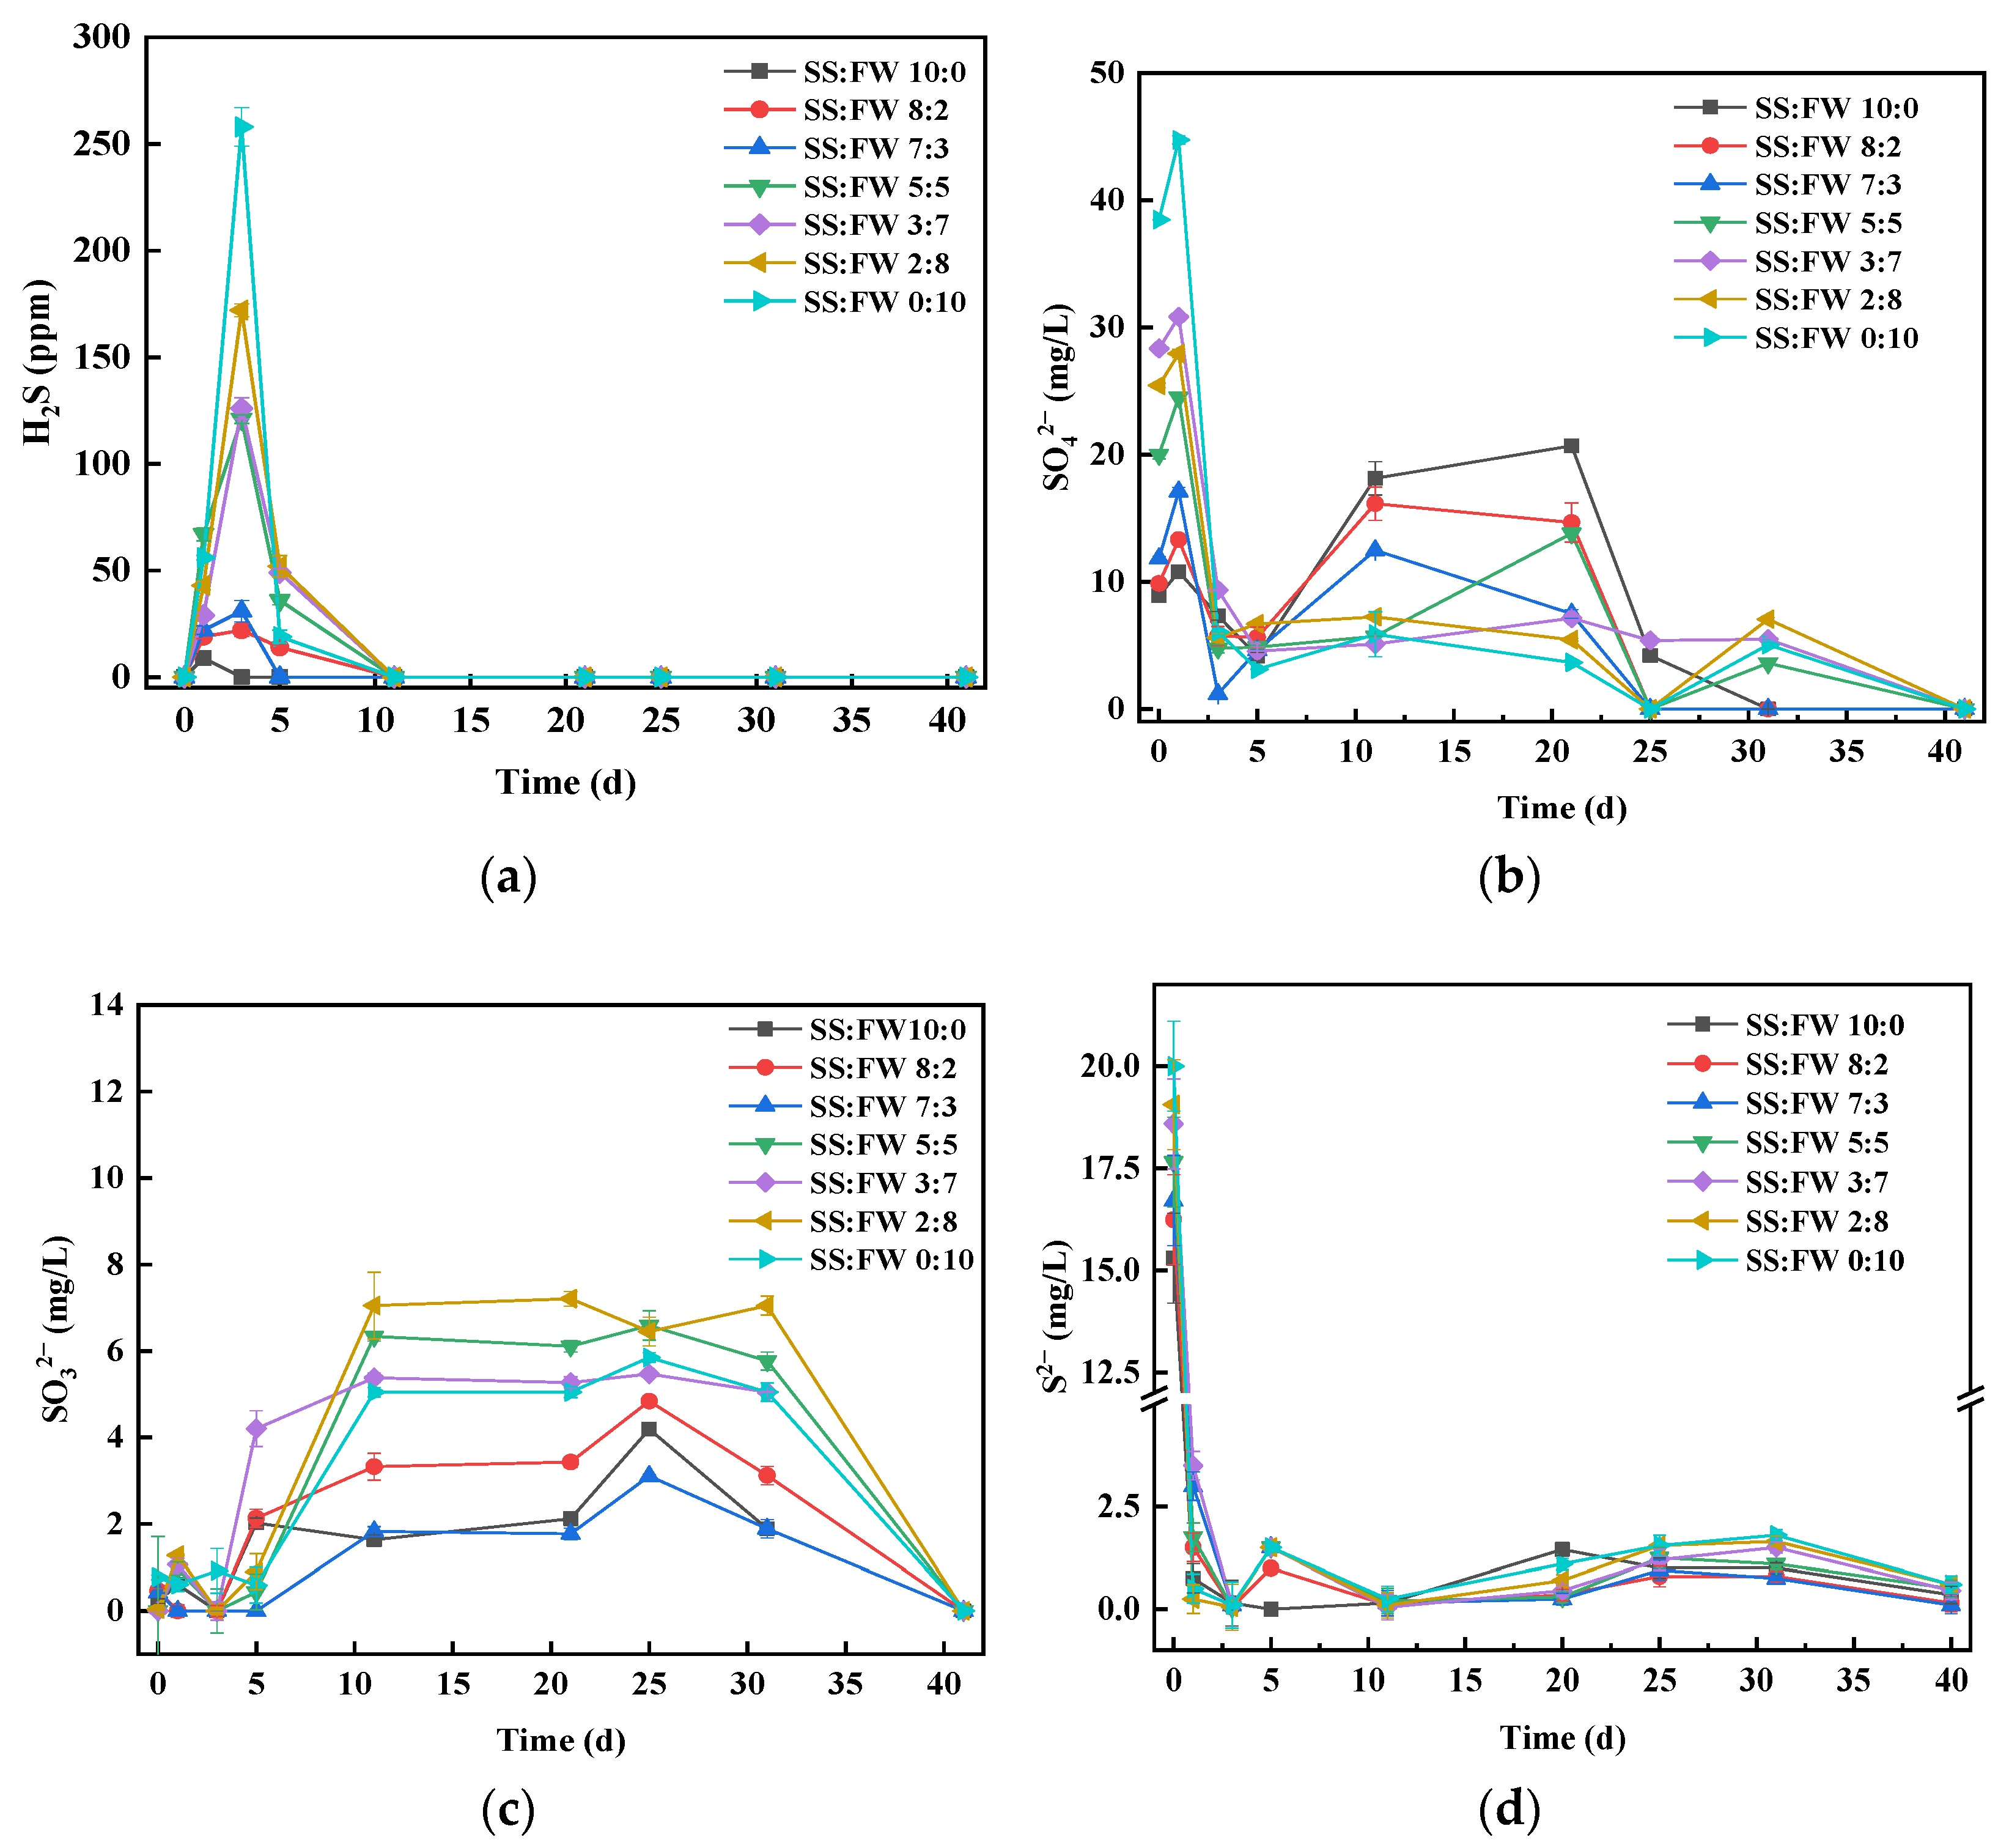
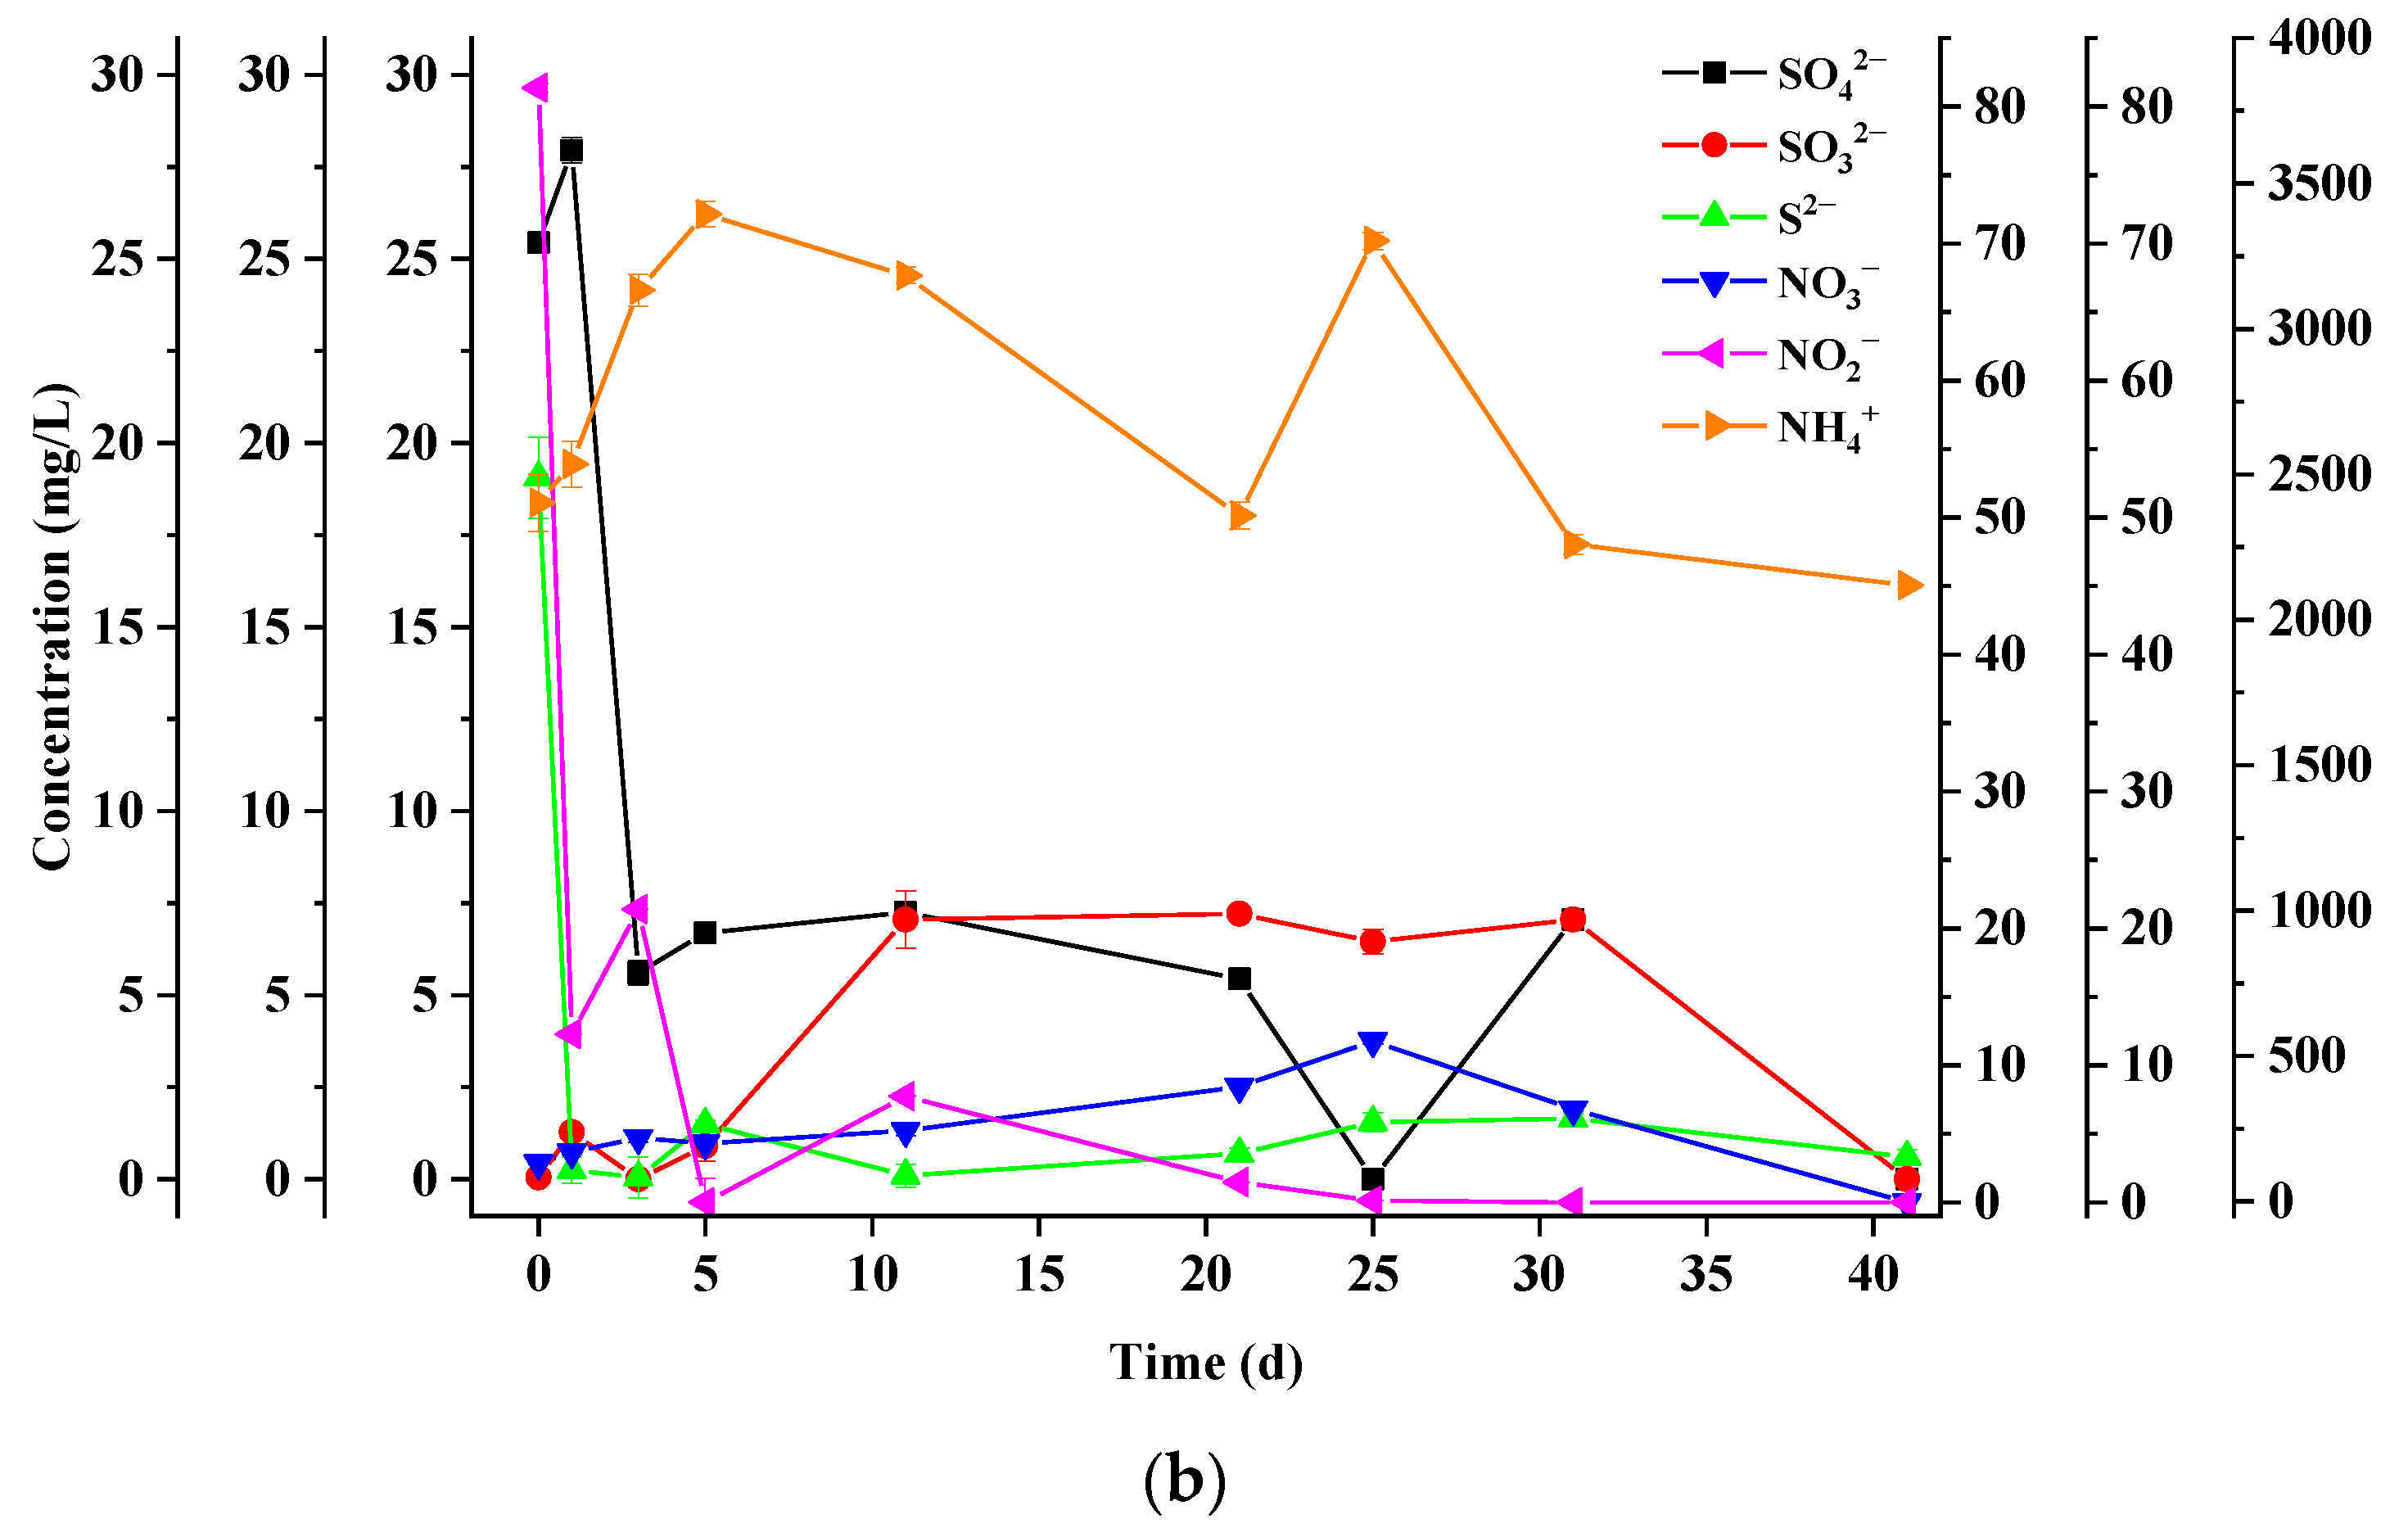
3.4. Dynamics of Sulfur Chemical Forms

Sulfur-containing amino acids in SS and FW could be degraded by hydrolysis microorganisms. When the organic sulfur was formed, it transformed into dissolved sulfide, which would form H2S with H+ later. As soon as H2S was formed, it hindered the activity and growth of methanogenic archaea and ultimately brought about system instability. As shown in Figure 3a, the H2S concentrations for AcoD exhibited a short increasing trend in the initial stage. On Days 1 to 3, the peak values of 258, 172, 126, 121, 22, 19 and 9 ppm corresponded to an SS:FW ratio of 0:10, 2:8, 3:7, 5:5, 7:3, 8:2 and 10:0, respectively. The results indicated that the main source of H2S was from FW. After the short peaks, H2S concentrations declined sharply and remained at a low level from day 5. Previous studies had reported H2S concentrations within full-scale AD at 600–1500 ppm [18], while other researchers observed the corresponding H2S emission in the range of 200–270 ppm during the methane production stage in a two-phase AD experiment [19]. Furthermore, the generating conditions of H2S are closely related to the acidification stage of anaerobic digestion. Tian et al. found that most of the H2S initially produced could be attributed to the high concentration of supernatant sulfide, which was produced by systematic acidification and rapid biogas production [20].
The change of SO42 concentrations over time could be generally divided into three phases shown in Figure 3b. During the first phase (Days 1–2), the SO42 concentrations in all reactors increased rapidly; the maximum reached 45 mg/L at a ratio of 0:10. However, in the second stage (Days 3–20), the peak of sulfate concentrations reached at 20 mg/L in the substrate with the highest proportion of sludge. It might be that FW was more prone to hydrolysis and the organic matter in the sludge was gradually released, as the AcoD process continued. Meanwhile, in the third stage, the SO42 concentrations gradually decreased. It has been demonstrated that the presence of SO42 could accelerate the methane production by improving the hydrolysis rate, at concentrations from 50 to 400 mg/L [10].
When sulfate-reducing bacteria exist in the anaerobic environment, SO42 could be easily reduced to SO32. As shown in Figure 3c, the SO32 concentrations got 7.0, 6.2, 5.5, 4.8, 3.2, 2.1 and 2.0 mg/L at ratios of 2:8, 5:5, 3:7, 0:10, 8:2, 7:3 and 10:0, respectively, on day 11. After that, there were no significant fluctuations until day 31. The results showed that FW is the main source of sulfite SO32. A previous study proved that SO32 concentration over 400 mg/L could depress the acetate oxidation to inorganic carbon, which inhibited the organic removal rate [21]. The SO32 concentration in this study was much lower than 400 mg/L, so there was no inhibitory effect on the methanogenesis process.
After H2S was produced in aqueous solution, it could dissociate into hydrosulfide ions (HS) and then sulfide ion (S2). It was clearly found in Figure 3d that S2 concentrations decreased rapidly at the beginning of AcoD; then, all reactors fluctuated below 7 mg/L. It indicated that S2− was readily converted to other sulfur compounds under anaerobic conditions and mainly in gaseous H2S accumulation, not in the aqueous solution.

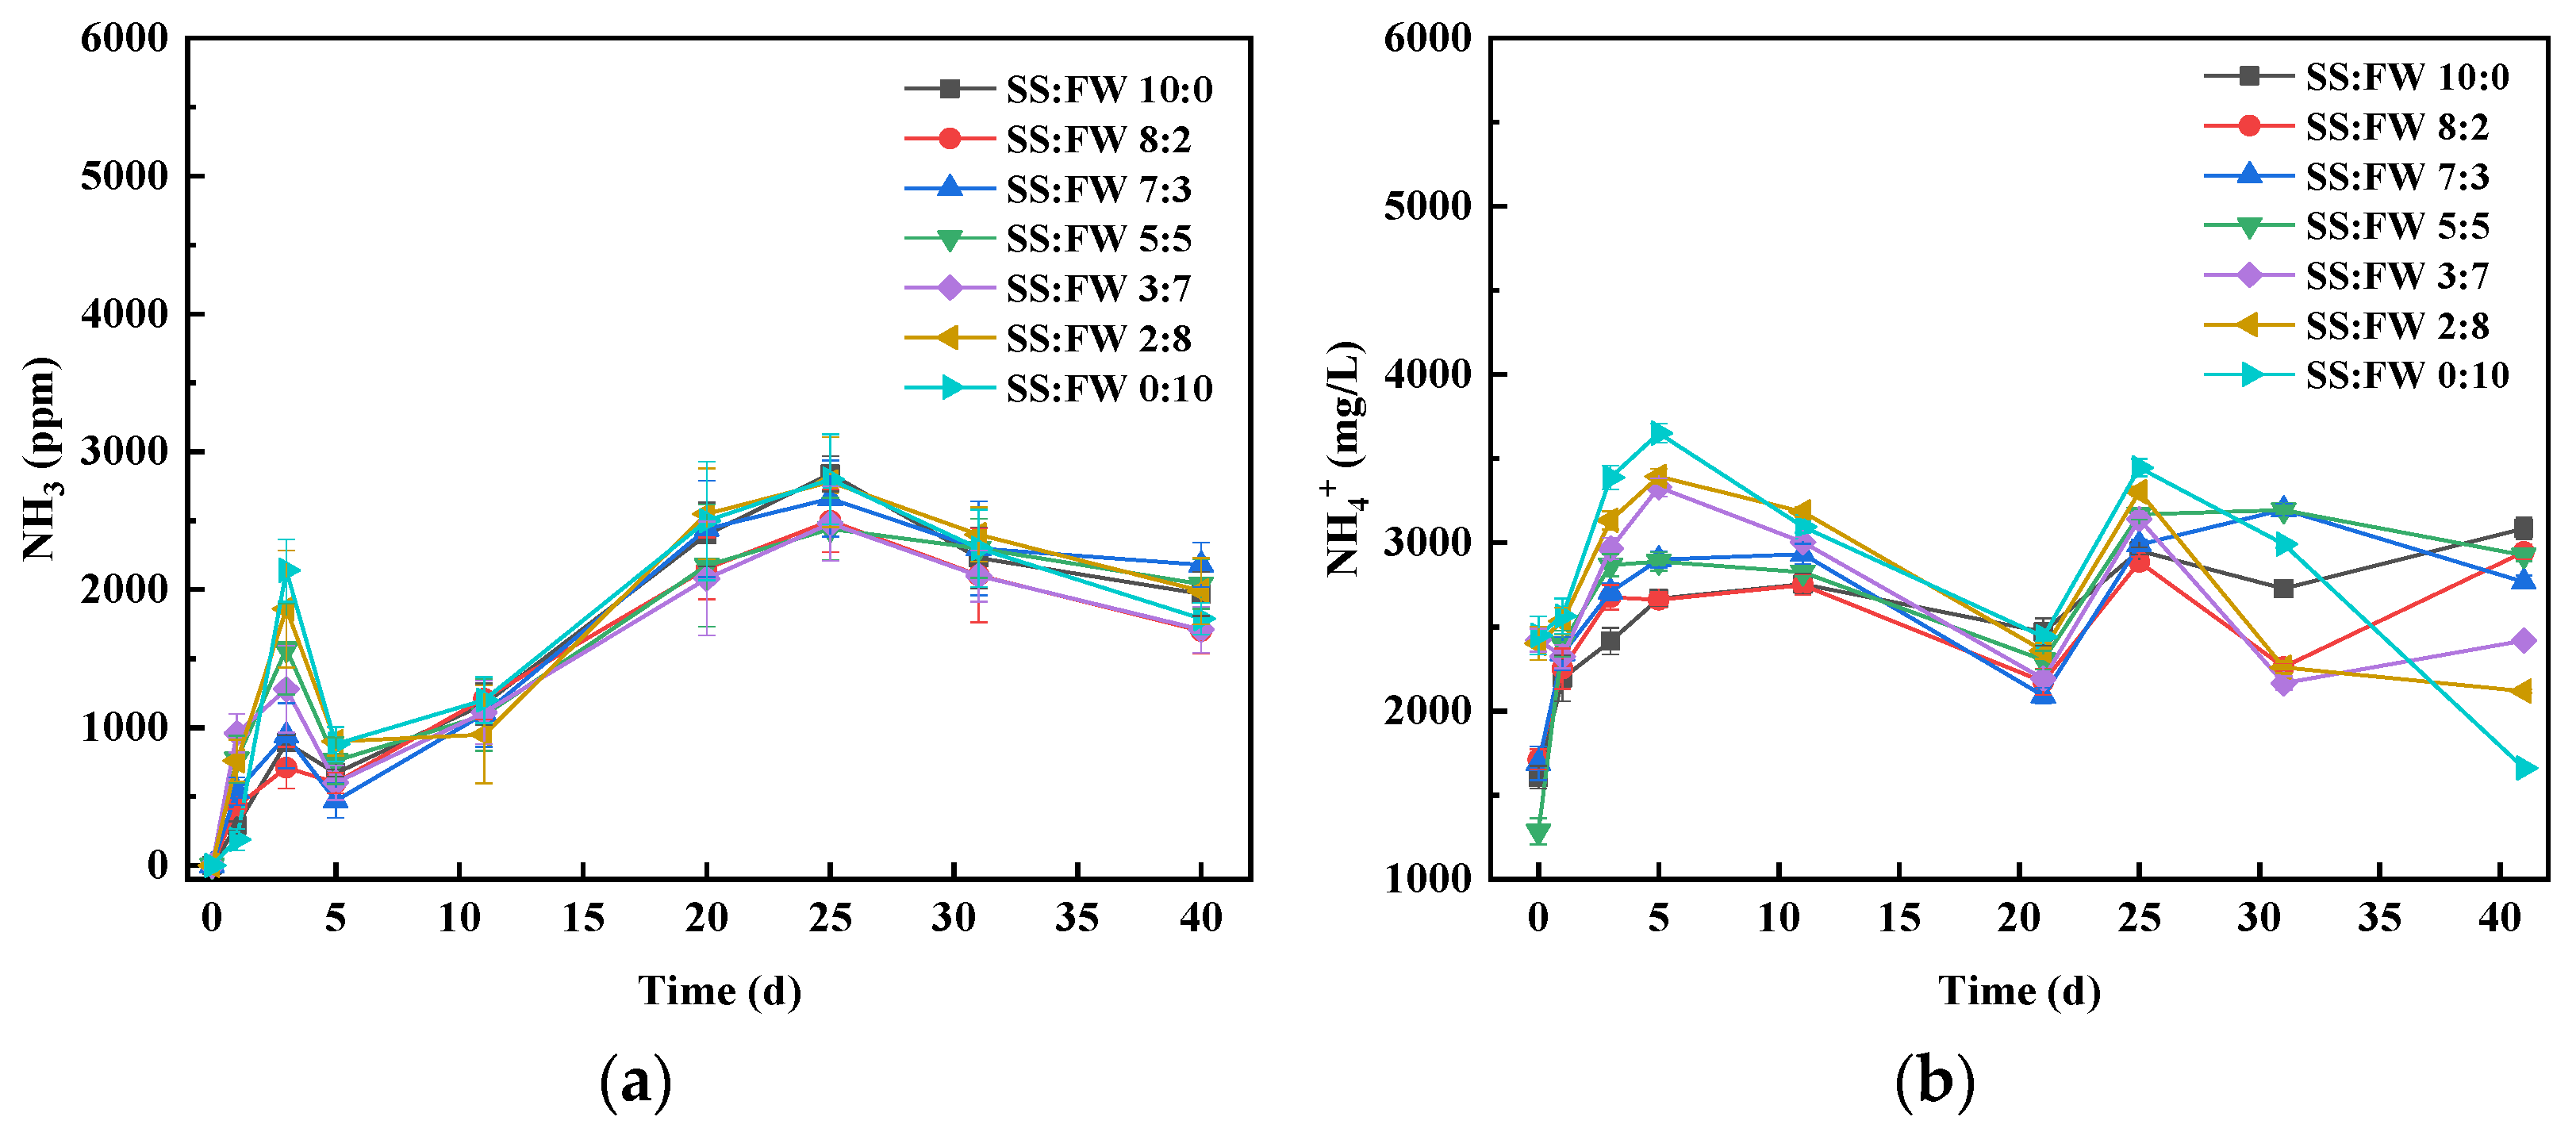
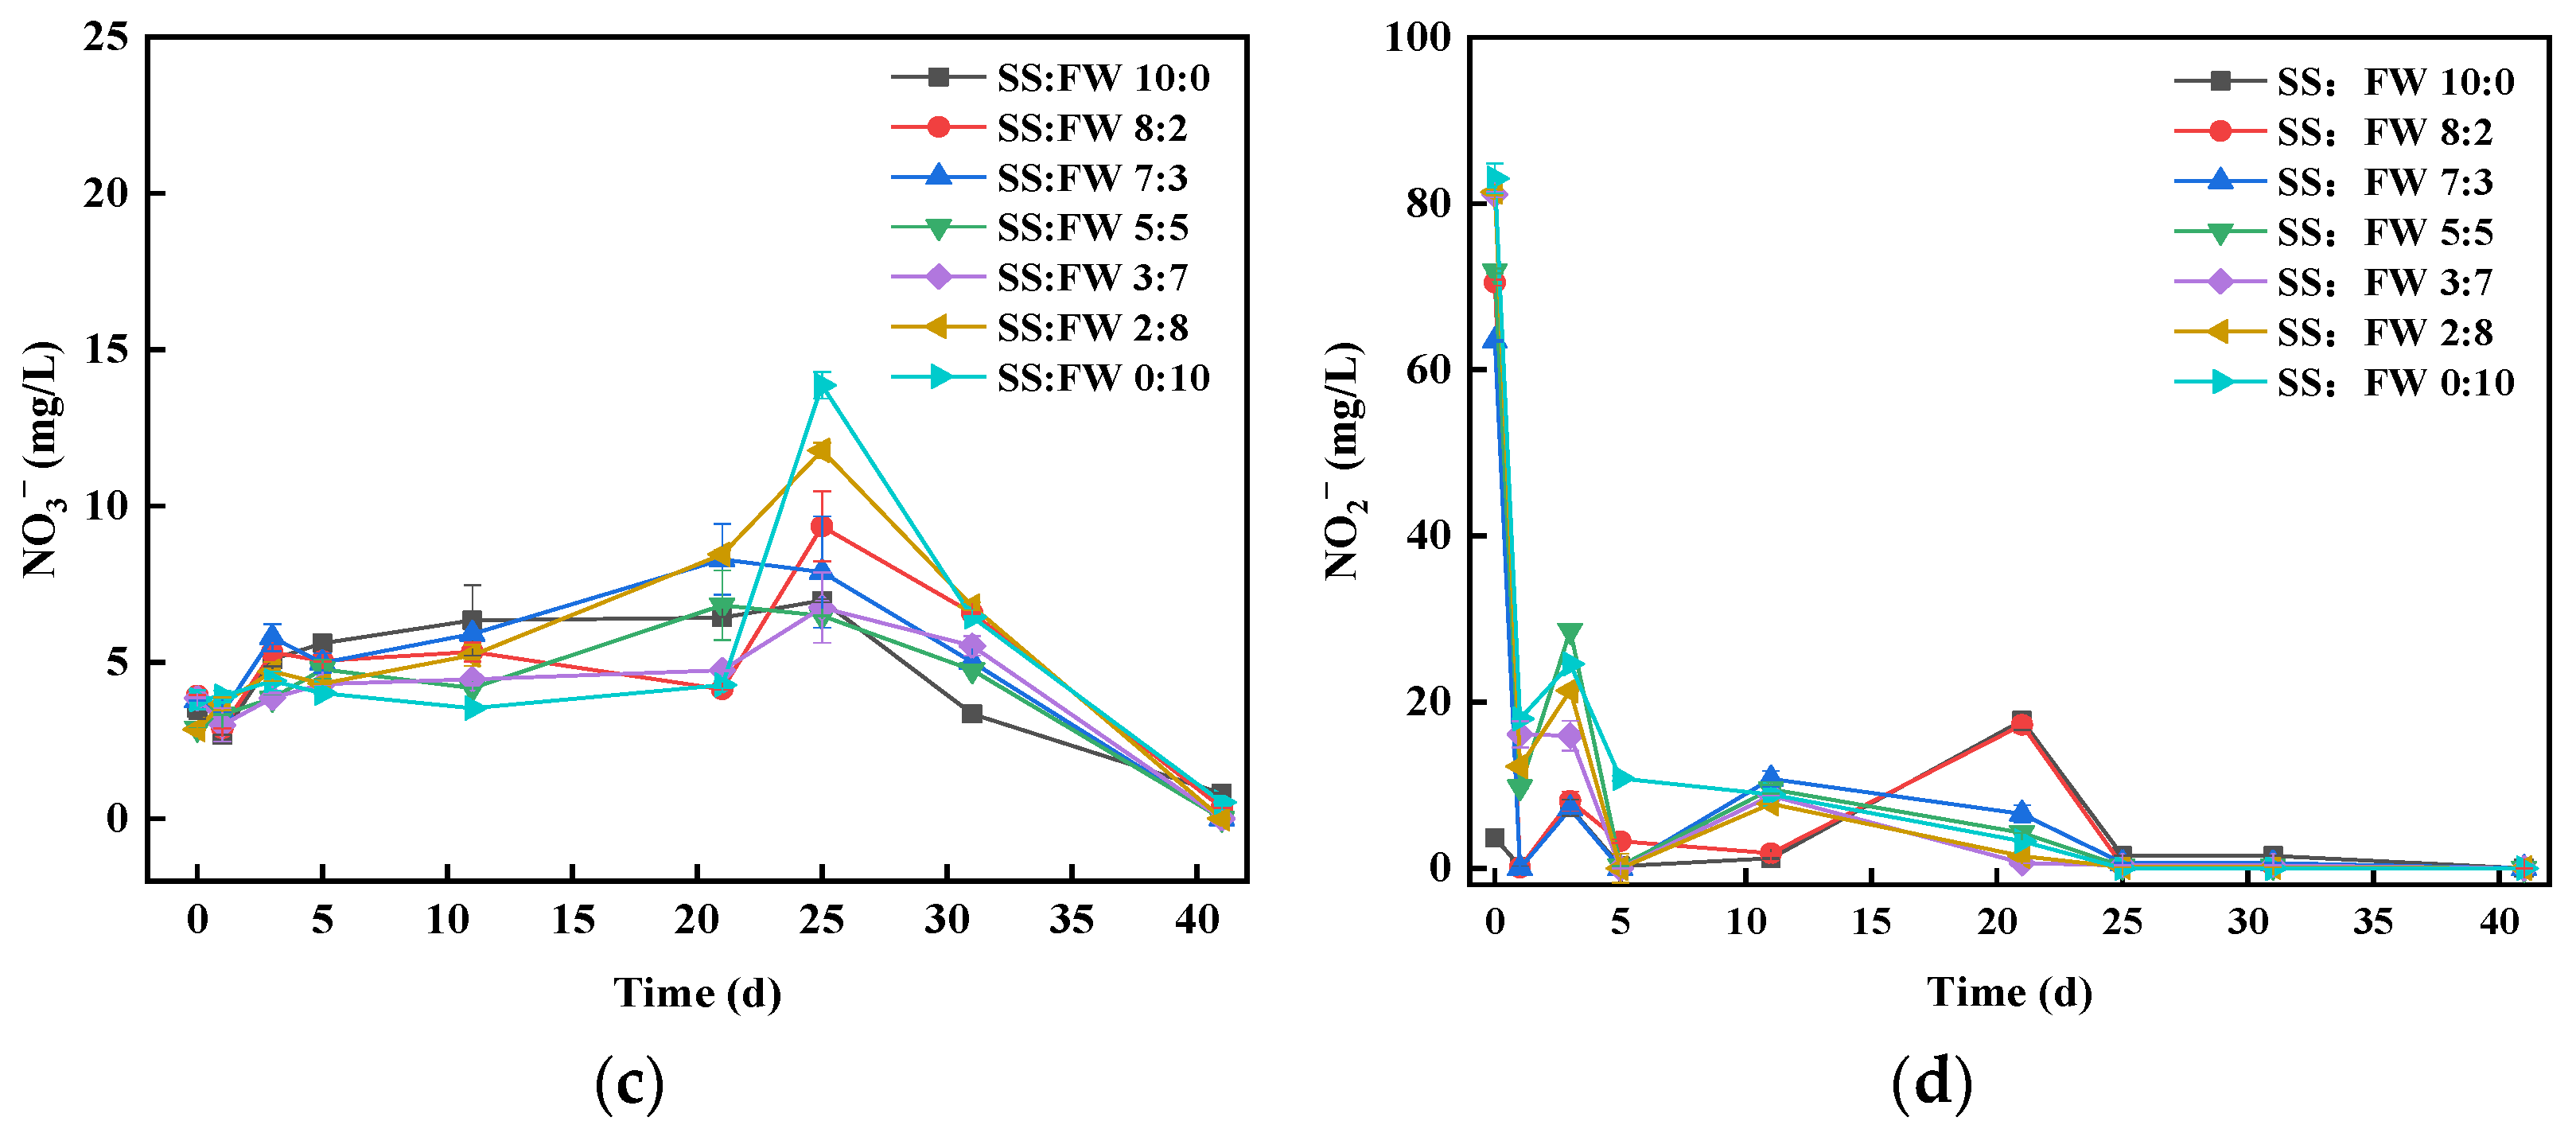
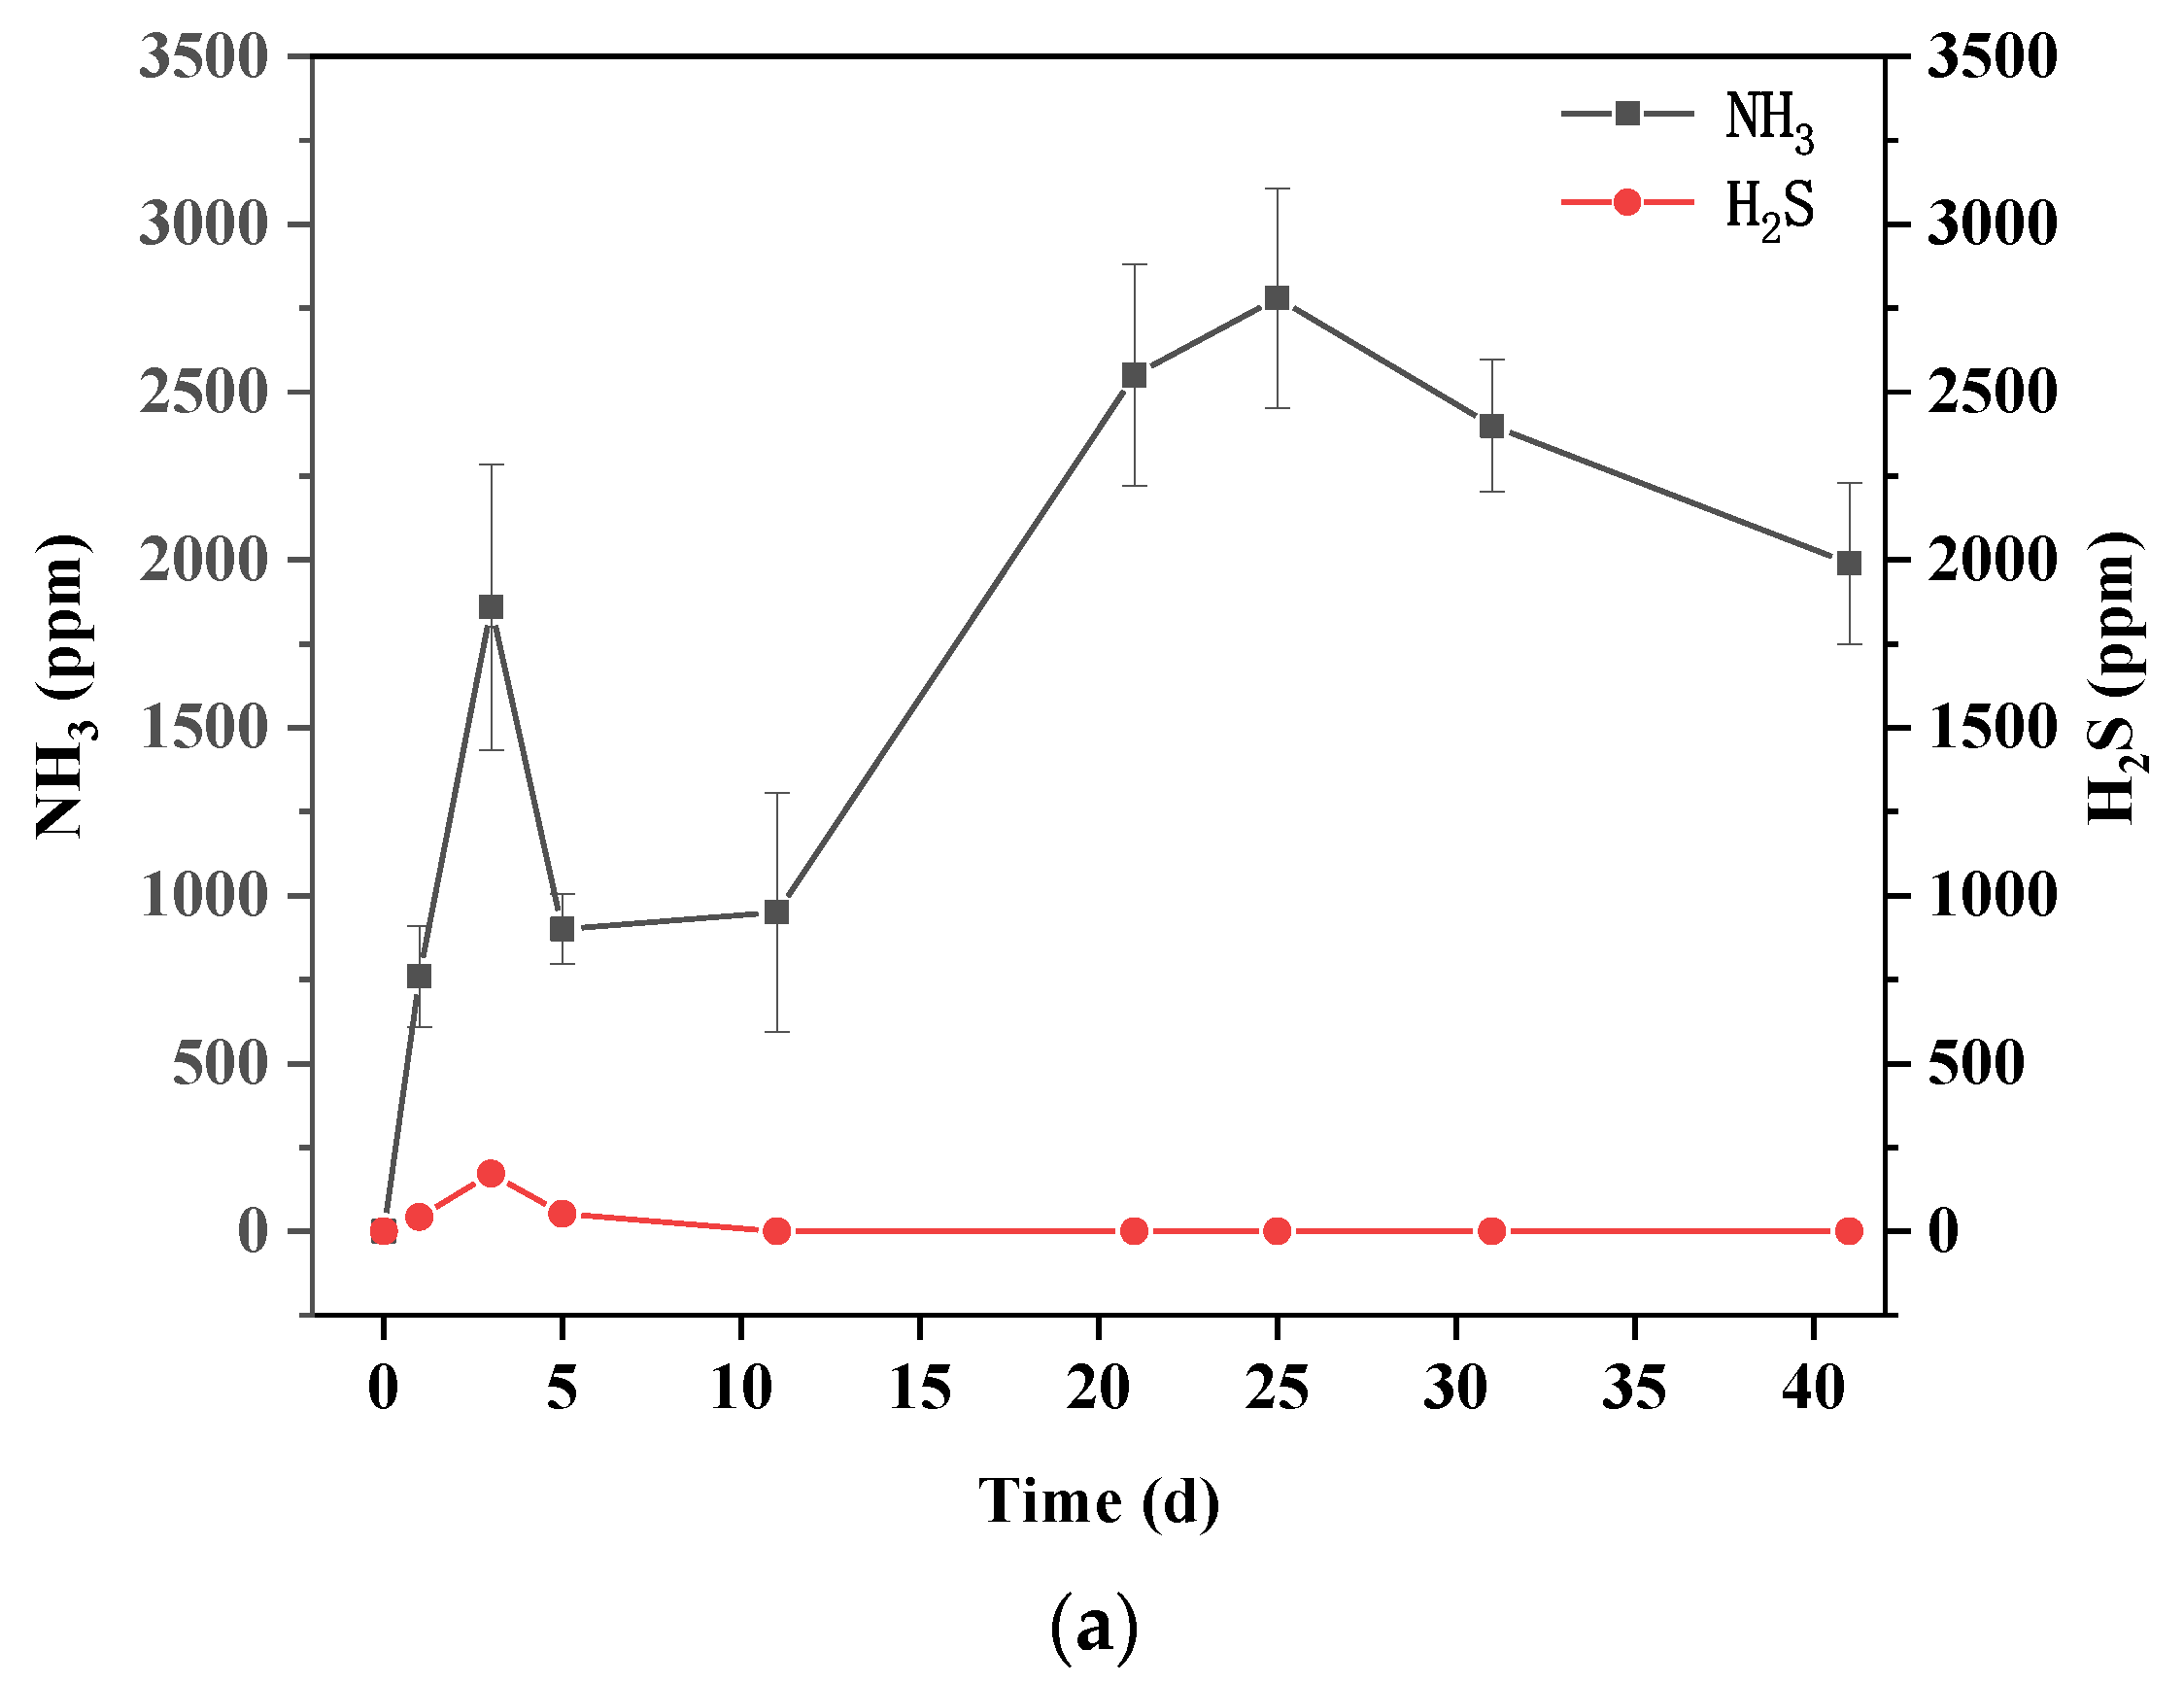
3.5. Dynamics of Nitrogen Chemical Forms

The concentration of ammonia is considered to be an important indicator affecting the performance of anaerobic digestion. High ammonia inhibits the process of methanogenesis, while an appropriate concentration of ammonia could neutralize the low pH to promote the growth of methanogens [22]. Figure 4a showed a general increasing trend of the NH3 concentrations for AcoD. The peaks of NH3 were observed around day 3 at the first stage; then, they declined rapidly in the next two days. From day 5 to day 25, the maximum of NH3 for the second stage was observed. In general, anaerobic digestion processes are enhanced when ammonia concentrations are below 200 mg/L because low ammonia concentration expressed nitrogen as an essential nutrient for methanogenic microorganisms [23]. These results are consistent with inhibition of methanogenesis by promoting the reaction between hydrochloric acid and amino acids as well as possibly increasing ammonium release.
A certain concentration of NH4+ could be conducive to inhibiting the reduction of pH caused by acidification, while excessive concentration of NH3 would have a toxic effect on the activity of methane enzyme [24]. The NH4+ changing over time could be divided into two phases (Figure 4b). Protein or other organic matter was decomposed in the hydrolysis process in the early stage of anaerobic digestion, resulting in the concentration of NH4+ raised rapidly, while the second increase was due to the dissolution of gaseous NH3. The ratio of FW:SS = 0:10 got the highest NH4+ at each stage, 3651.16 and 3446.26 ppm on days 5 and 25, respectively. Due to differences in substrate composition and experimental conditions, various ammonia inhibitory concentrations were obtained. For example, Benabdallah et al. reported that 215 mg/L of NH4+ could reduce methane production, whereas the threshold for inhibition of methane reported by Angelidaki et al. was 700 mg/L [25,26].
As shown in Figure 4c, the NO3 increased from the beginning and reached a peak on Day 25, while the ratio of SS:FW = 0:10 reached 13.86 mg/L. The result was consistent with that group of I/S ratio = 1:0 by Zhang et al. [27]. From Day 20, the NO3 increased for all ratios given the recovery of nitrification as evidenced by the declined of NH4+. The low molecular organics in the FW could be easily utilized by microorganisms, resulting in a faster denitrification rate. However, solid and macromolecular organics were firstly hydrolyzed into soluble organic matter before being utilized by denitrifying bacteria, so as to cause a lower denitrification rate [28,29]. Additionally, at the end of the AcoD, the NO3 was not removed completely, and its content was slightly higher than the initial stage of the reaction, indicating the incomplete denitrification. The reason for the low denitrification rate is that the solid organic matters in FW were converted by hydrolase before being utilized by denitrifying bacteria [29].
As displayed in Figure 4d, the concentration of NO2 dropped rapidly from the beginning of AcoD and then increased slightly and gradually decreased to almost 0 mg/L. The differences between reactors of NO2 might be attributed to the unbalanced electron allocations between nitrate reductase (NaR) and nitrite reductase (NiR) during denitrification. As the ratios of FW in the substrate increased, the activity of NaR was enhanced, leading to the accumulation of NO2 in the reaction system [30,31]. Combined with the changes of NO3, it showed that nitrification and denitrification were not synchronized in the process of AcoD. In the first step of anaerobic ammonium oxidation (anammox) process, low concentration of oxygen (O2) by FW provided the conditions for partial nitritation. NH4+ was partially oxidized to NO2 by aerobic ammonia-oxidizing bacteria (AOB), which was further oxidized to N2 later [32].

3.6. Microbial Community Analysis

3.6.1. Microbial Community Diversity and Richness

The richness and diversity of the microbial communities in substrates from each reactor were analyzed on the basis of Miseq sequencing platforms. The Shannon’s, Chao1 and ACE diversity indices and Good’s coverage of the α diversity indices of bacteria and archaea were shown in Table 2 and Table 3. All the Good’s coverage in this study were higher than 0.99, indicating that the OTU readings were representative. In R-1 and R-7, the Shannon and Ace indices were higher than others. This suggested that the AcoD played an important role in the selection and enrichment of some specific bacterial. The OTUs, Chao and Ace of archaea community of R-6 were the highest, which was consistent with the CMY conclusion (Section 3.1). Additionally, the α diversity of bacteria was higher than that of archaea, which indicated that the diversity and richness of bacterial community was greater than that of archaea. Therefore, bacterial communities played an important role in the transformation of N and S compounds.

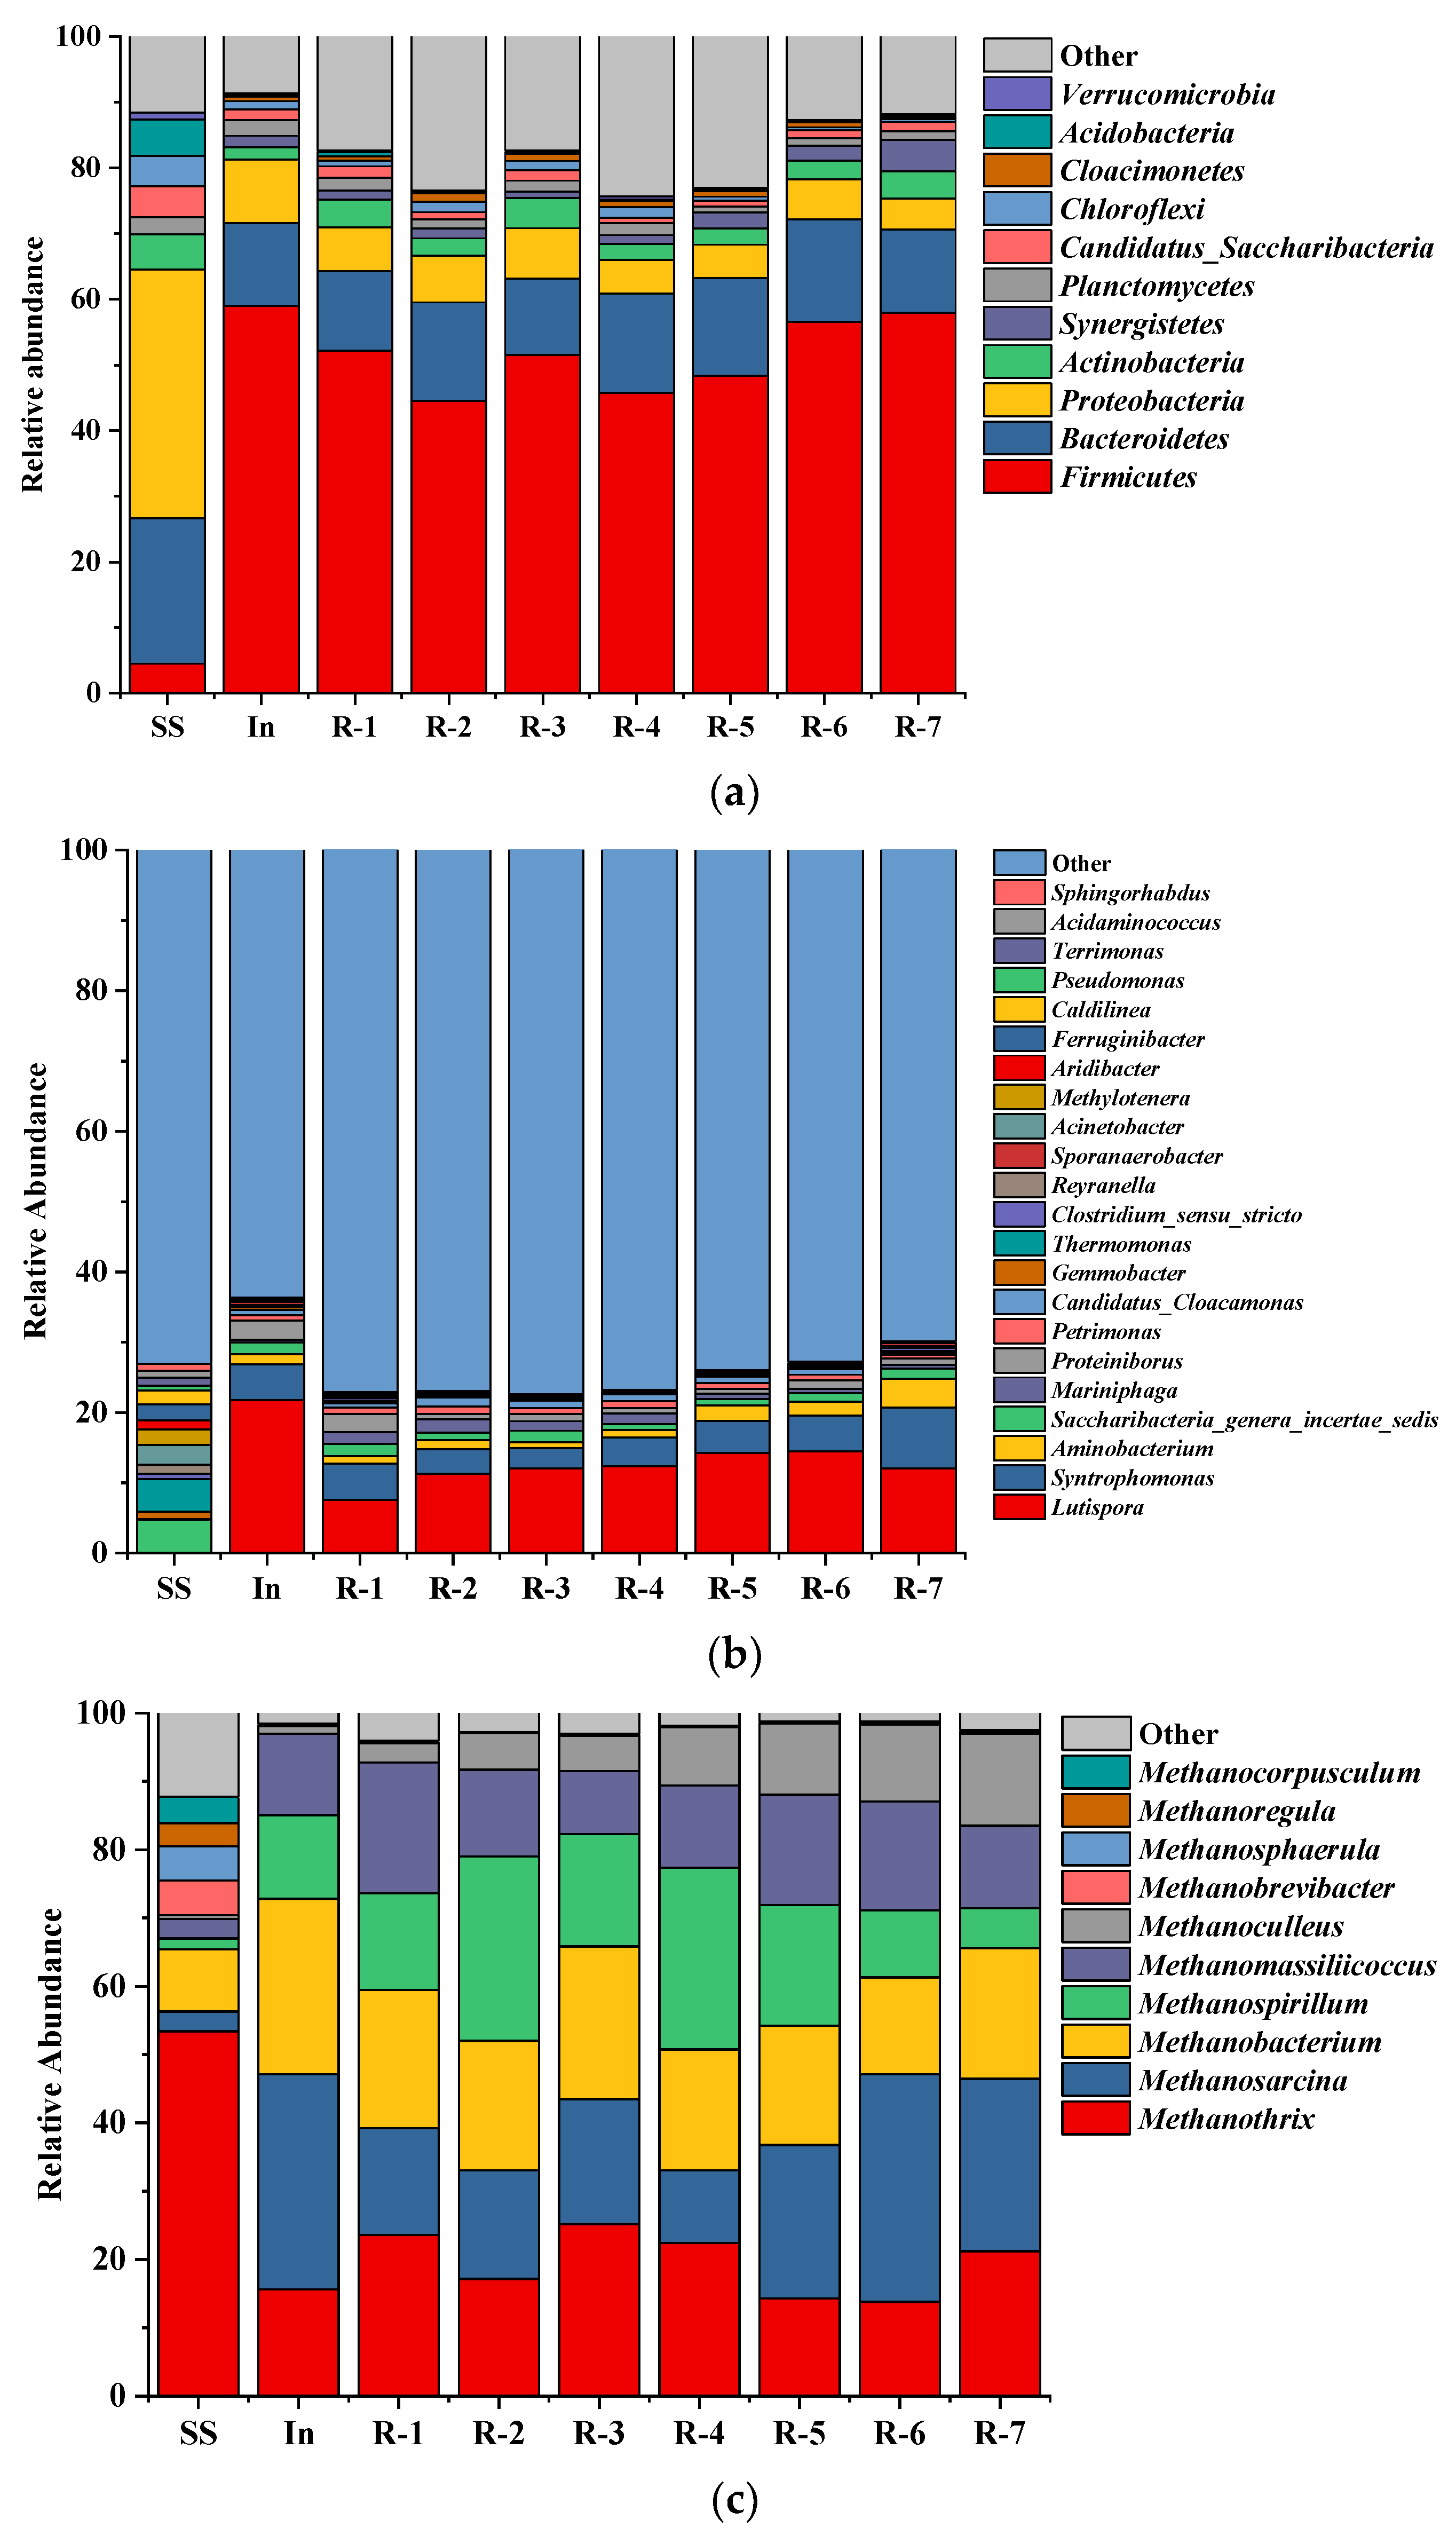
3.6.2. Taxonomic Composition of the Microbial Community

The classification of bacterial sequences from substrates were summarized at the phylum and genus level (Figure 5a,b). The dominant phylum of bacteria were Firmicutes (4.49–59.02%), Bacteroidetes (11.58–22.17%), Proteobacteria (4.74–37.87%), Actinobacteria (1.84–5.37%), Candidatus_Saccharibacteria (0.93–4.73%), Synergistetes (0.03–4.79%) and Planctomycetes (0.88–2.55%). It is reported that Firmicutes, Proteobacteria and Bacteroidetes play important roles in SO42 and NO3 co-reduction system [33]. The highest abundance of Firmicutes was 59.01% in R-6, which was close to that of inoculum. This phenomenon showed that the distribution of microorganisms in the inoculum has a great influence on the results of AcoD. The abundance of Proteobacteria in R-6 was much less than that of inoculum and SS, which was observed in desulfurization and denitrification process with increasing influent NO3 concentrations [34]. Additionally, Proteobacteria, Planctomycetes, Chloroflexi, Bacteroidetes and Acidobacteria were often found to play key roles in anammox reactors [35].
At the genus level, the relative abundance of dominant bacteria over 1% reduced from 13 genera to 5 genera compared with SS, which indicated the difference of substrate composition leading to the change of relative abundance of different functional microorganisms after the AcoD process. It has been reported that Clostridium sensu stricto and Lutispora belonging to Firmicutes play an important role in converting various organic compounds to VFAs during anaerobic digestion [36]. Methylotenera was confirmed to carry out heterotrophic denitrification by the utilization of methanol [37]. Sporanaerobacter contains known fermentative species coupled with the reduction of S0, suggesting its potential ability of extracellular electron transfer [38]. Petrimonas is capable of converting complex substrates to acetate in the presence of the elemental sulfur as an electron acceptor and is considered to be an electron-donating bacterium in DIET [39]. Caldilinea is observed to play significant roles in phosphorus removal and denitrification along with Acinetobacter [40].
The methanogenic capacity of the AcoD process is primarily related to the archaea communities’ structure. As showed in Figure 5c, the predominant archaea at the genus level (with relative abundance over 1%) were Methanothrix (14.28–53.43%), Methanosarcina (2.88–33.31%), Methanobacterium (9.07–25.68%), Methanomassiliicoccus (2.81–19.16%), Methanospirillum (1.65–26.97%) and Methanoculleus (0.57–13.49%). Methanothrix species are capable of accepting electrons via direct interspecies electron transfer (DIET) for the reduction of carbon dioxide to methane. As another predominated genus, Methanosarcina is known to generate methane by both acetoclastic and the hydrogenotroph methanogenesis pathways. Methanoculleus could not only ensure efficient CH4 production in a stable stage but also be tolerant to high ammonia in anaerobic digestion with organic wastewater [41].

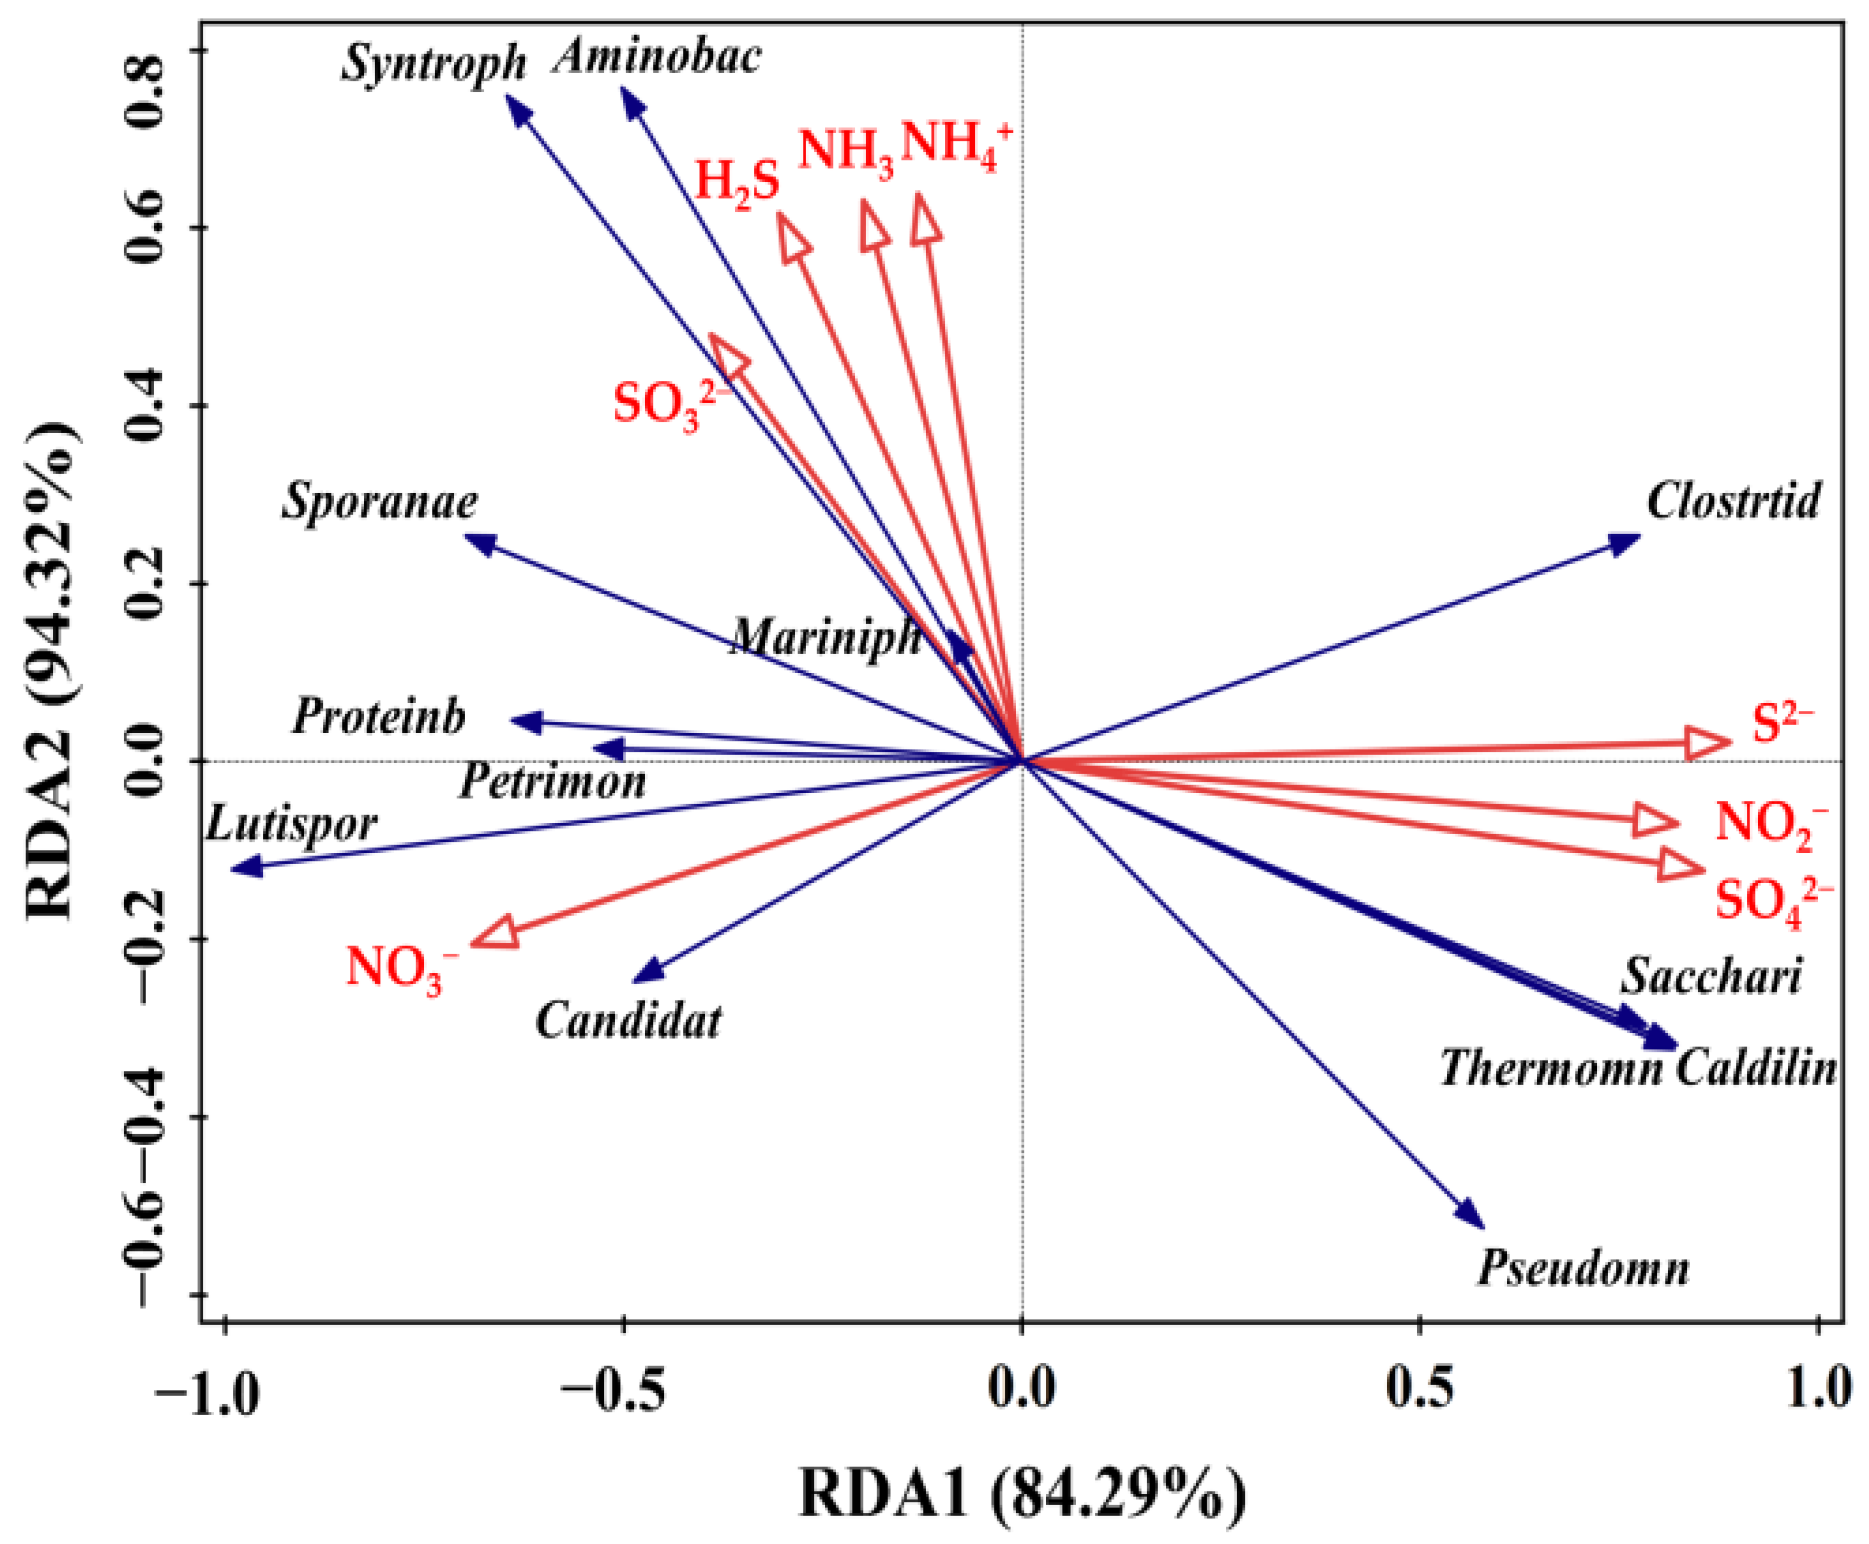
3.6.3. Relationships of the Bacterial Community with N and S Compounds

RDA was used to determine the correlation between the bacterial community and different dynamic parameters. As shown in Figure 6, the effect of S compounds on bacterial genera was displayed as follows: S2 > SO42 > H2S > SO32, while the effect of N was NO2 > NH3 > NH4+ > NO3. Obviously, the dominant genus Syntrophomonas and Aminobacterium were positively correlated to H2S, NH3, NH4+ and SO32, but negatively correlated to NO2 and SO42 which positively correlated with Saccharibacteria_genera_incertae_sedis and Thermomonas. The Syntrophomonas and Aminobacterium could not only participate in the degradation process of butyric acid and amino acids but also could indirectly intensify the performance of AD [42]. Notably, the SO42 had a positively relationship with NO2, and electron transfer might have occurred between them under the action of specific microorganisms. It has been confirmed that Pseudomonas has denitrification and desulphurization functions [43]. Thermomonas was always associated with N removal, especially with denitrification [39]. As for Candidatus_Cloacamonas, which was positively correlated to NO3, it was commonly associated with amino acid degradation [34]. These results suggested that N and S compounds had great influence on the structures of bacterial communities in the AcoD process and could be used as important indicators to effectively regulate the microbial ecosystem during AcoD.

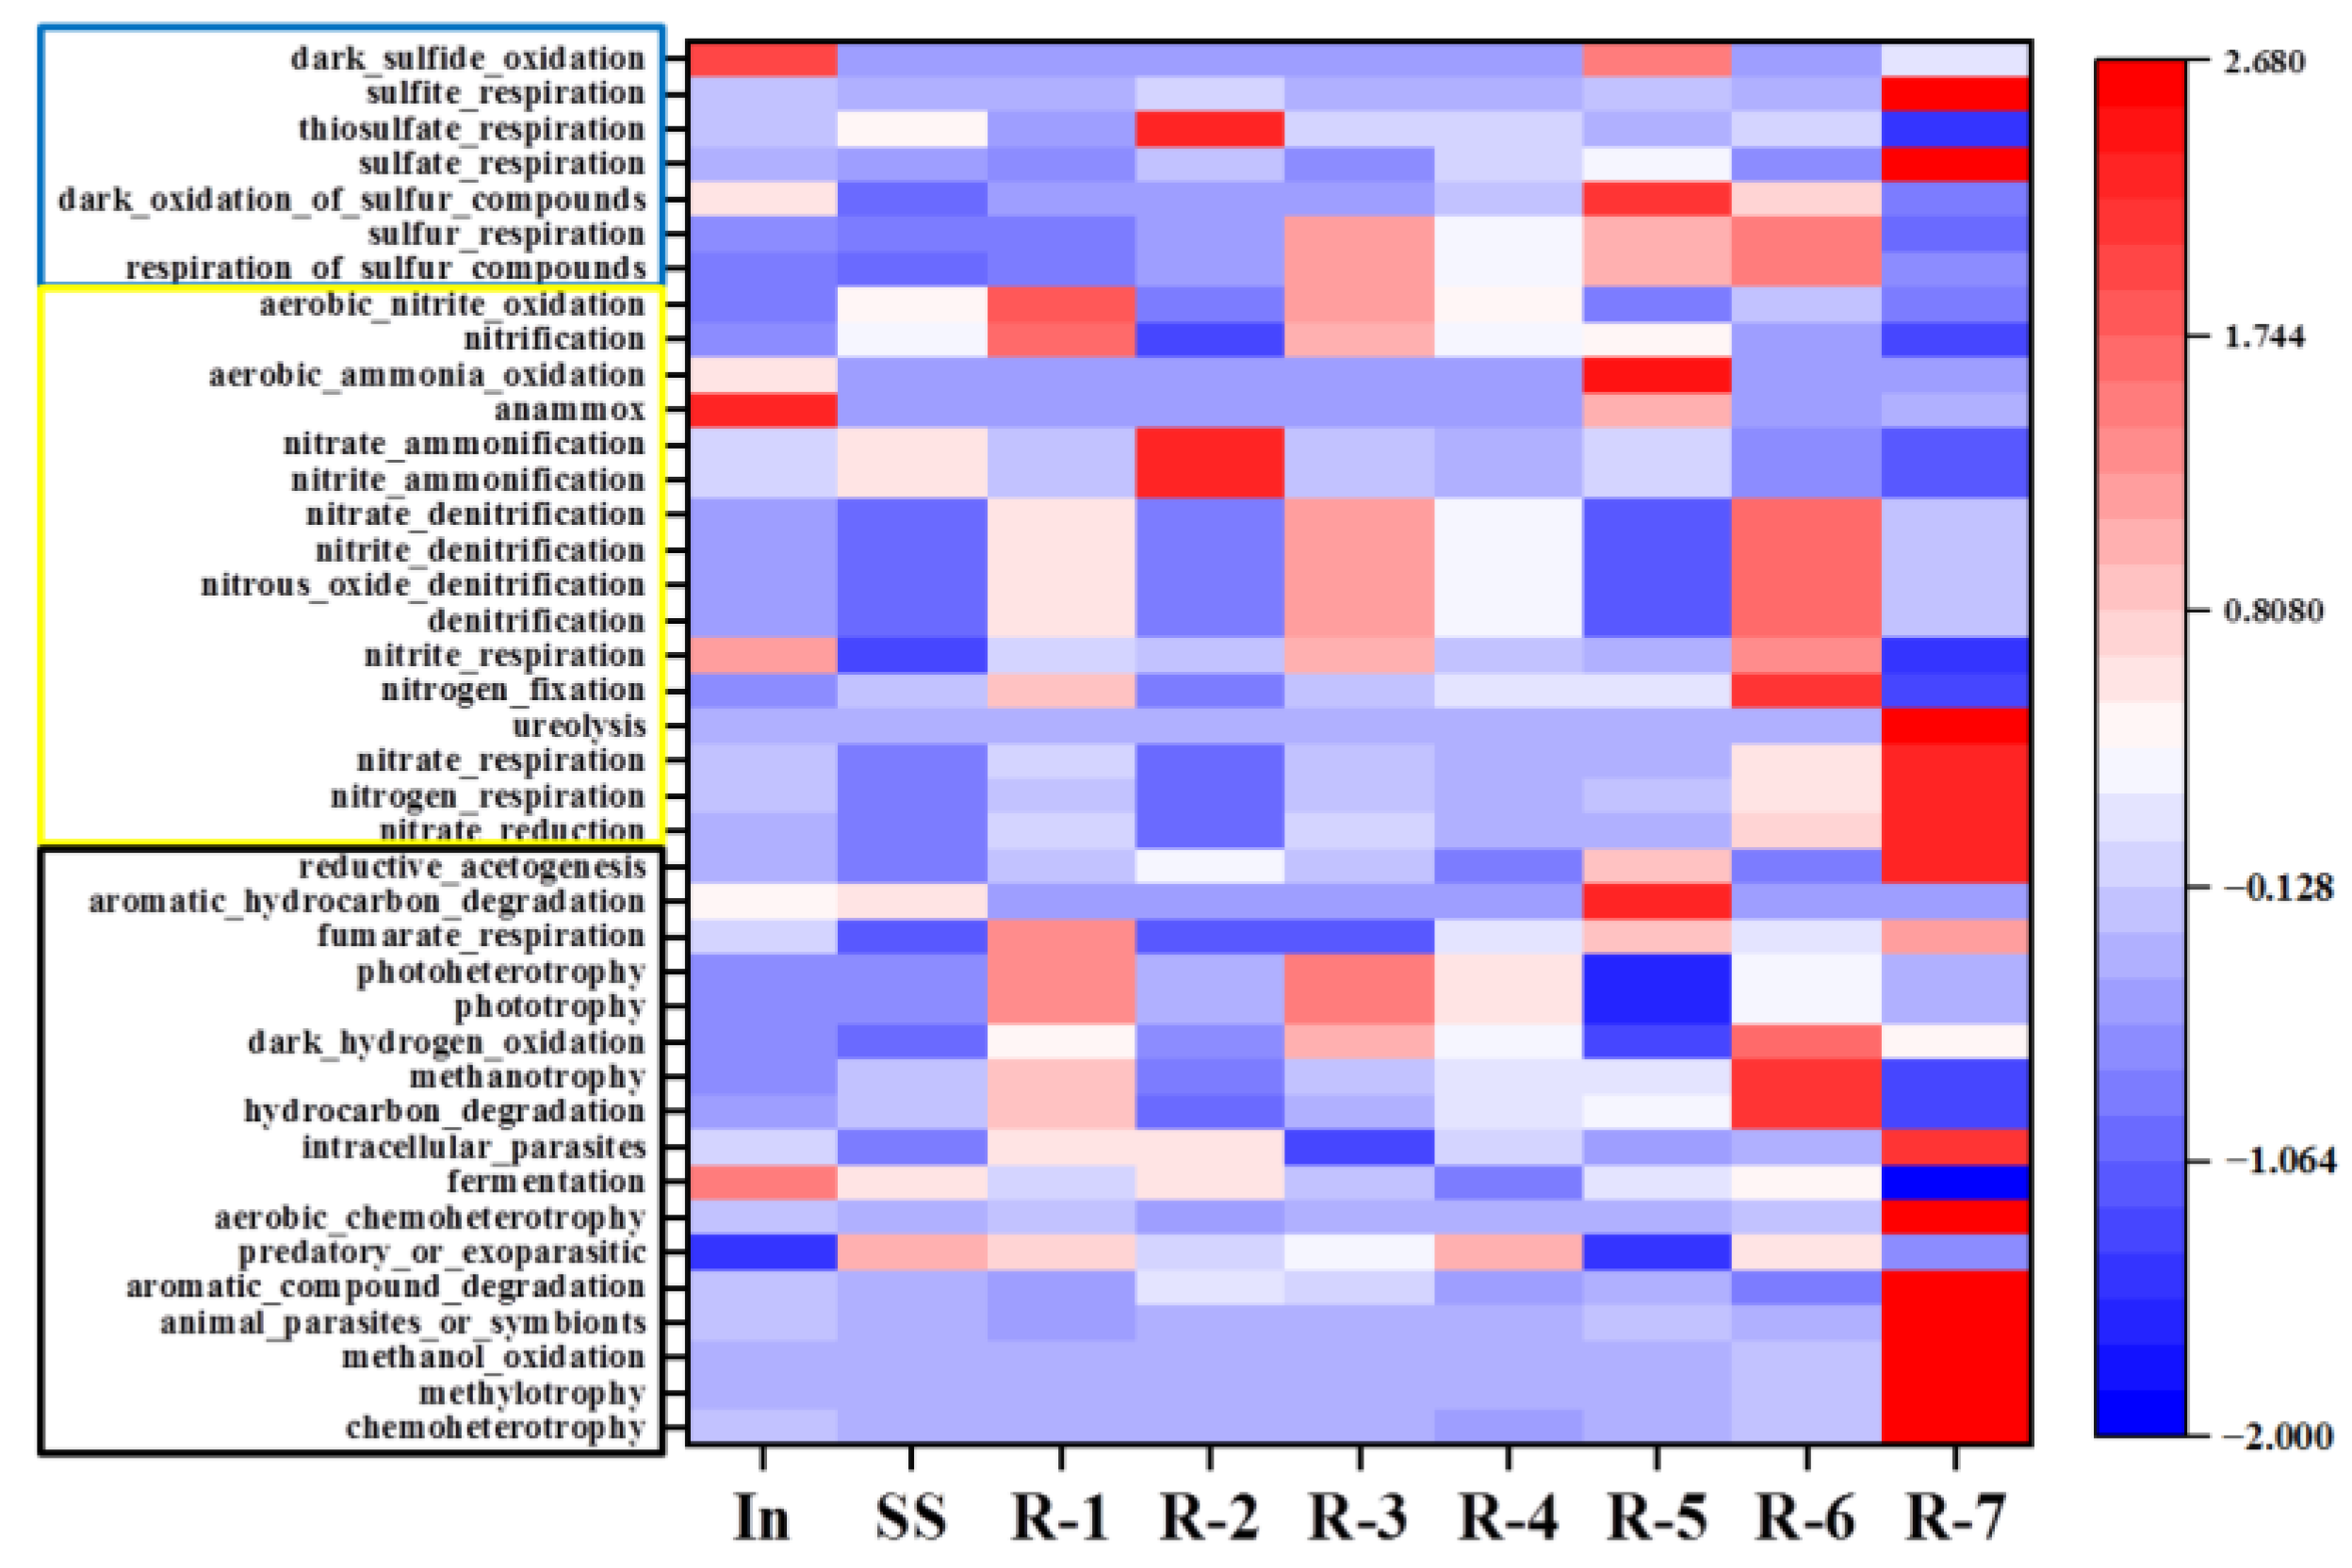
3.6.4. Functional Prediction of Bacterial Community

FAPROTAX (Annotation of Prokaryotic Taxa) was adopted to evaluate the metabolic pathways of N and S cycles in the AcoD. As shown in Figure 7, the abundance of functional groups involved in the cycles of N and S showed an increase with the ratio of SS:FW. In the reactor R-7, the presence of anaerobic regions in FW resulted in notable ureolysis, nitrate respiration, nitrogen respiration and nitrate reduction, thereby contributing to high NH4+. Bacterial functions for the S cycle were dominantly composed of sulfite and sulfate respiration. These functions made contributions to the notable H2S emission. Compared to the R-1, these bacterial activities were more abundant. Given their more severe anaerobic conditions, they would lead to much higher H2S and NH3 emission inside the composting pile with merely the FW only. These results were also consistent with previous bacterial community analysis.

3.7. Integrated Dynamic of N and S

Although N2 was used to create anaerobic conditions at the beginning of the test, there was still a small amount of O2 between the pores FW and SS, so that microorganisms with nitrification could oxidize NH4+ to NO2 and NO3. As another key nitrogen cycle, denitrifying microorganisms utilize NO3 and NO2 instead of O2 as the terminal electron acceptor in the oxidation of organic compound. As shown in Figure 8, the concentrations of NH4+ and NO2 changed greatly, while NO3 remained at a low level. It indicated that the accumulation of NH4+ over time might inhibit nitrification or denitrification. At the same time, sulfide has been found to inhibit nitrification [44]. Most sulfide existed in HS form at pH 8.0, and in the form of H2S at pH 6.0. Therefore, the lower the pH was, the more the H2S was formed in aqueous solution, which was consistent the results in Figure 2 [45]. This phenomenon was proved by the presence of Sporanaerobacter involved in sulfur reduction in this study. The Advenella involved in sulphide-oxidation coupled to nitrate reduction seems to be the predominant denitrification process in the AcoD of SS with FW. In addition, sulfate reduction also contributed to ammonium accumulation by organic matter mineralization [46]. At the end of AcoD, 2200 mg/L of NH4+ remained, which was much higher than other ions in the study. Hence, it could be inferred that nitrate reduction was indeed prior to NH4+ oxidization. Recent studies demonstrated the process of sulfate reducing ammonium oxidation (SRAO) could combine NH4+ and SO42 as Equations (2)–(4) [47]. Sporanaerobacter was found to have this function. It is interesting to notice that sulfide-dependent autotrophic denitrification (Equation (5)) is one of the reactions involved in the sulfammox process. The autotrophic denitrification reactions use S2− and SO32 as electron donors and NO3 and NO2 as electron acceptors (Equation (5)). In this study, Caldilinea, Thermomonas and Acinetobacter could participate in the process. Because the FW used in this experiment contains less NO3 and NO2, the denitrification activity might be limited.
3SO42 + 4NH4+ = 4NO2 + 3S2 + 4H2O + 8H+
2NO2 + 2NH4+ = 2N2 + 4H2O
5S2 + 8NO3 + 8H+ = 5SO42 + 4N2 + 4H2O
3S2 + 2NO2 + 8H+ = 3S0 + N2 + 4H2O

4. Conclusions

In this study, the AcoD of SS with FW were performed to investigate the temporal change of N-compounds and S-compounds under different VS ratios. The Gompertz model demonstrated that 2:8 of SS and FW was the optimum condition for methane production, whose cumulative methane yield was 15.12 L. When methane was no longer produced, the concentrations of NO3, NO2, NH4+, SO42−, SO32− and S2− were 0.00, 0.00, 2118.35, 0.00, 0.00 and 0.60 mg/L at the optimum ratio, respectively. In addition, Syntrophomonas and Aminobacterium were positively correlated to H2S, NH3, NH4+ and SO32−, while Saccharibacteria_genera_incertae_sedis and Thermomonas were positively correlated to SO42− and NO2. According to the Functional prediction, the ureolysis, nitrate respiration, nitrogen respiration and nitrate reduction contributed to high NH4+, while sulfite respiration and sulfate respiration contributed to the S cycle. The results of this study revealed the change mechanism of typical N-compounds and S-compounds in the AcoD, which could provide a basis for improving the efficiency for engineering application.

Supplementary Materials

The following supporting information can be downloaded at: https://www.mdpi.com/article/10.3390/su14094982/s1, Table S1: The definitions of the α diversity indices.

Author Contributions

Conceptualization, Y.Z. and X.G.; methodology, Z.Q., X.G. and P.K.; software, P.K.; validation, P.K.; formal analysis, Z.Q. and X.G.; investigation, P.K.; resources, Y.Z. and X.G.; data curation, X.G.; writing—original draft preparation, P.K.; writing—review and editing, Z.Q. and X.G.; visualization, P.K.; supervision, Z.Q.; project administration, Y.Z. and X.G.; funding acquisition, Y.Z. and X.G. All authors have read and agreed to the published version of the manuscript.

Funding

This research was funded by National Key Research & Development Program of China, grant number 2018YFC1901006; the Fundamental Research Funds for the Central Universities, grant number 2021YJSHH30.

Institutional Review Board Statement

Not applicable.

Informed Consent Statement

Not applicable.

Data Availability Statement

Data are contained within the article.

Acknowledgments

The authors would like to thank the Laboratory of Solid Waste Treatment and Recycling Research Center for Eco-Environmental Sciences for technical support.

Conflicts of Interest

The authors declare no conflict of interest.

Abbreviations

AcoDAnaerobic co-digestion
FWFood waste
SS Sweage sludge
N Nitrogen
S Sulfur
SCODSoluble chemical oxygen demand
VFAs Volatile fatty acids
CMY Cumulative methane yield
OTUs Operational taxonomic units
RDA Redundancy analysis
FAPROTAX Functional Annotation of Prokaryotic Taxa

References

  1. Xu, F.; Li, Y.; Ge, X.; Yang, L.; Li, Y. Anaerobic digestion of food waste–Challenges and opportunities. Bioresour. Technol. 2018, 247, 1047–1058. [Google Scholar] [CrossRef] [PubMed]
  2. Azarmanesh, R.; Zonoozi, M.H.; Ghiasinejad, H. Characterization of food waste and sewage sludge mesophilic anaerobic co-digestion under different mixing ratios of primary sludge, secondary sludge and food waste. Biomass Bioenergy 2020, 139, 105610. [Google Scholar] [CrossRef]
  3. Zaharioiu, A.; Bucura, F.; Ionete, E.I.; Ionete, R.E.; Ebrasu, D.; Sandru, C.; Marin, F.; Oancea, S.; Niculescu, V.; Miricioiu, M.G.; et al. Thermochemical Decomposition of Sewage Sludge-An Eco-Friendly Solution for a Sustainable Energy Future by Using Wastes. Rev. Chim. 2020, 71, 171–181. [Google Scholar] [CrossRef]
  4. Miricioiu, M.G.; Zaharioiu, A.; Oancea, S.; Bucura, F.; Raboaca, M.S.; Filote, C.; Ionete, R.E. Violeta Carolina Niculescu, Marius Constantinescu.Sewage Sludge Derived Materials for CO2 Adsorption. Appl. Sci. 2021, 11, 7139. [Google Scholar] [CrossRef]
  5. Bardi, M.J.; Aminirad, H. Synergistic effects of co-trace elements on anaerobic co-digestion of food waste and sewage sludge at high organic load. Environ. Sci. Pollut. Res. 2020, 27, 18129–18144. [Google Scholar] [CrossRef]
  6. Sheng, K.C.; Chen, X.; Pan, J.M.; Klossa, R.; Wei, Y.; Ying, Y.B. Effect of ammonia and nitrate on biogas production from food waste via anaerobic digestion. Biosyst. Eng. 2013, 116, 205–212. [Google Scholar] [CrossRef]
  7. Fisgativa, H.; Tremier, A.; Dabert, P. Characterizing the variability of food waste quality: A need for efficient valorisation through anaerobic digestion. Waste Manag. 2016, 50, 264–274. [Google Scholar] [CrossRef]
  8. Dewil, R.; Baeyens, J.; Roels, J.; Steene, B.V.D. Distribution of sulphur compounds in sewage sludge treatment. Environ. Eng. Sci. 2008, 25, 879–886. [Google Scholar] [CrossRef]
  9. Rusín, J.; Chamrádová, K.; Basinas, P. Two-stage psychrophilic anaerobic digestion of food waste: Comparison to conventional single-stage mesophilic process. Waste Mang. 2021, 119, 172–182. [Google Scholar] [CrossRef]
  10. Zan, F.; Hao, T. Sulfate in anaerobic co-digester accelerates methane production from food waste and waste activated sludge. Bioresour. Technol. 2020, 298, 122536. [Google Scholar] [CrossRef]
  11. Raketh, M.; Jariyaboon, R.; Kongjan, P.; Trably, E.; Reungsang, A.; Sripitak, B.; Chotisuwan, S. Sulfate removal using rubber wood ash to enhance biogas production from sulfate-rich wastewater generated from a concentrated latex factory. Biochem. Eng. J. 2021, 173, 108084. [Google Scholar] [CrossRef]
  12. Drosg, B. Process Monitoring in Biogas Plants; IEA Bioenergy: Paris, France, 2013. [Google Scholar]
  13. Genfu, W. Hydrogen sulfide-producing kinetics of Shewanella oneidensis in sulfite and thiosulfate respiration. Process. Biochem. 2020, 93, 21–27. [Google Scholar] [CrossRef]
  14. Federation, W.E.; Association, A. Standard Methods for the Examination of Water and Wastewater; American Public Health Association (APHA): Washington, DC, USA, 2005. [Google Scholar]
  15. Gu, J.; Liu, R.; Cheng, Y.; Stanisavljevic, N.; Li, L.; Djatkov, D.; Peng, X.; Wang, X. Anaerobic co-digestion of food waste and sewage sludge under mesophilic and thermophilic conditions: Focusing on synergistic effects on methane production. Bioresour. Technol. 2020, 301, 122765. [Google Scholar] [CrossRef] [PubMed]
  16. Liu, C.; Li, H.; Zhang, Y.; Liu, C. Improve biogas production from low-organic-content sludge through high-solids anaerobic co-digestion with food waste. Bioresour. Technol. 2016, 219, 252–260. [Google Scholar] [CrossRef] [PubMed]
  17. Heo, N.H.; Park, S.C.; Kang, H. Effects of mixture ratio and hydraulic retention time on single-stage anaerobic co-digestion of food waste and waste activated sludge. J. Environ. Sci. Health Part A 2004, 39, 1739–1756. [Google Scholar] [CrossRef] [PubMed]
  18. Kang, J.W.; Jeong, C.M.; Kim, N.J.; Kim, M.I.; Chang, H.N. On-site removal of H2S from biogas produced by food waste using an aerobic sludge biofilter for steam reforming processing. Biotechnol. Bioprocess Eng. 2010, 15, 505–511. [Google Scholar] [CrossRef]
  19. Lili, H.; Yan, Z.; Xibin, S.; Meng, H.; Weifang, L.; Xiaoyu, N.; Yuangang, W.; Zhiqiang, L. Odors emission characteristics in methanogenic stage of two-phase anaerobic fermentation of kitchen waste. Chin. J. Environ. Eng. 2014, 8, 4386–4392. [Google Scholar]
  20. Tian, G.; Xi, J.; Yeung, M.; Ren, G. Characteristics and mechanisms of H2S production in anaerobic digestion of food waste. Sci. Total Environ. 2020, 724, 137977. [Google Scholar] [CrossRef]
  21. Qian, J.; Zhang, M.; Niu, J.; Fu, X.; Pei, X.; Chang, X.; Wei, L.; Liu, R.; Chen, G.-H.; Jiang, F. Roles of sulfite and internal recirculation on organic compound removal and the microbial community structure of a sulfur cycle-driven biological wastewater treatment process. Chemosphere 2019, 226, 825–833. [Google Scholar] [CrossRef]
  22. Yongsiri, C.; Hvitved-Jacobsen, T.; Vollertsen, J.; Tanaka, N. Introducing the emission process of hydrogen sulfide to a sewer process model (WATS). Water Sci. Technol. 2003, 47, 85–92. [Google Scholar] [CrossRef]
  23. Kim, M.; Zhang, Z.G.; Okano, H.; Yan, D.L.; Groisman, A.; Hwa, T. Need-based activation of ammonium uptake in Escherichia coli. Mol. Syst. Biol. 2012, 8, 616. [Google Scholar] [CrossRef] [PubMed]
  24. Chen, Y.; Cheng, J.J.; Creamer, K.S. Inhibition of anaerobic digestion process: A review. Bioresour. Technol. 2008, 99, 4044–4064. [Google Scholar] [CrossRef]
  25. Benabdallah El Hadj, T.; Astals, S.; Gali, A.; Mace, S.; Mata-Alvarez, J. Ammonia influence in anaerobic digestion of OFMSW. Water Sci. Technol. 2009, 59, 1153–1158. [Google Scholar] [CrossRef] [PubMed]
  26. Angelidaki, I.; Ahring, B. Anaerobic thermophilic digestion of manure at different ammonia loads: Effect of temperature. Water Res. 1994, 28, 727–731. [Google Scholar] [CrossRef]
  27. Hu, C.; Cao, W.; Wang, M.; Hou, F.; Yu, A.; Xie, H.; Lou, J.; Sun, C.; Liu, R. Essential regulators of iron chemical speciation distributions in anaerobic digestion of pretreated food waste: Organic volatile fatty acids or inorganic acid radicals? Bioresour. Technol. 2019, 293, 122051. [Google Scholar]
  28. Drewnowski, J.; Makinia, J. The role of biodegradable particulate and colloidal organic compounds in biological nutrient removal activated sludge systems. Int. J. Environ. Sci. Technol. 2014, 11, 1973–1988. [Google Scholar] [CrossRef] [Green Version]
  29. Tang, J.; Wang, X.C.; Hu, Y.; Pu, Y.; Huang, J.; Ngo, H.H.; Zeng, Y.; Li, Y. Nutrients removal performance and sludge properties using anaerobic fermentation slurry from food waste as an external carbon source for wastewater treatment. Bioresour. Technol. 2019, 271, 125–135. [Google Scholar] [CrossRef]
  30. Cao, S.; Qian, T.; Zhou, Y. New insights on the sludge fermentation liquid driven denitrification: Evaluation of the system performance and effluent organic matter (EfOM). Bioresour. Technol. 2019, 289, 121621. [Google Scholar] [CrossRef]
  31. Liu, F.; Tian, Y.; Ding, Y.; Li, Z. The use of fermentation liquid of wastewater primary sedimentation sludge as supplemental carbon source for denitrification based on enhanced anaerobic fermentation. Bioresour. Technol. 2016, 219, 6–13. [Google Scholar] [CrossRef]
  32. Pereira, A.D.; de Almeida Fernandes, L.; Castro, H.M.C.; Leal, C.D.; Carvalho, B.G.P.; Dias, M.F.; Nascimento, A.M.A.; de Lemos Chernicharo, C.A.; de Araujo, J.C. Nitrogen removal from food waste digestate using partial nitritation-anammox process: Effect of different aeration strategies on performance and microbial community dynamics. J. Environ. Manag. 2019, 251, 109562. [Google Scholar] [CrossRef]
  33. Zhu, C.; Wang, H.; Yan, Q.; He, R.; Zhang, G. Enhanced denitrification at biocathode facilitated with biohydrogen production in a three-chambered bioelectrochemical system (BES) reactor. Chem. Eng. J. 2017, 312, 360–366. [Google Scholar] [CrossRef]
  34. Chen, C.; Xu, X.J.; Xie, P.; Yuan, Y.; Zhou, X.; Wang, A.-J.; Lee, D.-J.; Ren, N.-Q. Pyrosequencing reveals microbial community dynamics in integrated simultaneous desulfurization and denitrification process at different influent nitrate concentrations. Chemosphere 2017, 171, 294–301. [Google Scholar] [CrossRef] [PubMed]
  35. Pereira, A.D.; Cabezas, A.; Etchebehere, C.; Chernicharo, C.A.d.L.; de Araújo, J.C. Microbial communities in anammox reactors: A review. Environ. Technol. Rev. 2017, 6, 74–93. [Google Scholar] [CrossRef]
  36. Wang, B.; Ma, J.; Zhang, L.; Su, Y.; Xie, Y.; Ahmad, Z.; Xie, B. The synergistic strategy and microbial ecology of the anaerobic co-digestion of food waste under the regulation of domestic garbage classification in China. Sci. Total Environ. 2021, 765, 144632. [Google Scholar] [CrossRef] [PubMed]
  37. Mustakhimov, I.; Kalyuzhnaya, M.G.; Lidstrom, M.E.; Chistoserdova, L. Insights into denitrification in Methylotenera mobilis from denitrification pathway and methanol metabolism mutants. J. Bacteriol. 2013, 195, 2207–2211. [Google Scholar] [CrossRef] [PubMed] [Green Version]
  38. Hernandez-Eugenio, G.; Fardeau, M.-L.; Cayol, J.-L.; Patel, B.K.; Thomas, P.; Macarie, H.; Garcia, J.-L.; Ollivier, B. Sporanaerobacter acetigenes gen. nov., sp. nov., a novel acetogenic, facultatively sulfur-reducing bacterium. Int. J. Syst. Evol. Microbiol. 2002, 52, 1217–1223. [Google Scholar] [PubMed] [Green Version]
  39. Wang, J.; Lei, Z.; Wang, L.; Yang, S.; Zhao, Y.; Li, Y.-Y.; Chen, R. Insight into using up-flow anaerobic sludge blanket-anammox to remove nitrogen from an anaerobic membrane reactor during mainstream wastewater treatment. Bioresour. Technol. 2020, 314, 123710. [Google Scholar] [CrossRef] [PubMed]
  40. Kindaichi, T.; Nierychlo, M.; Kragelund, C.; Nielsen, J.L.; Nielsen, P.H. High and stable substrate specificities of microorganisms in enhanced biological phosphorus removal plants. Environ. Microbiol. 2013, 15, 1821–1831. [Google Scholar] [CrossRef]
  41. Lee, J.; Kim, E.; Han, G.; Tongco, J.V.; Shin, S.G.; Hwang, S. Microbial communities underpinning mesophilic anaerobic digesters treating food wastewater or sewage sludge: A full-scale study. Bioresour. Technol. 2018, 259, 388–397. [Google Scholar] [CrossRef]
  42. Zhao, Z.H.; Zhang, Y.B.; Zhao, H.M.; Quan, X. Evaluation on direct interspecies electron transfer in anaerobic sludge digestion of microbial electrolysis cell. Bioresour. Technol. 2015, 200, 235–244. [Google Scholar] [CrossRef]
  43. Huang, C.; Liu, Q.; Li, Z.L.; Ma, X.D.; Hou, Y.N.; Ren, N.Q.; Wang, A.J. Relationship between functional bacteria in a denitrification desulfurization system under autotrophic, heterotrophic, and mixotrophic conditions. Water Res. 2020, 188, 116526. [Google Scholar] [CrossRef] [PubMed]
  44. Ward, B.B. Nitrification in marine systems. Nitrogen Mar. Environ. 2008, 2, 199–261. [Google Scholar]
  45. Siles, J.; Brekelmans, J.; Martín, M.; Chica, A.; Martín, A. Impact of ammonia and sulphate concentration on thermophilic anaerobic digestion. Bioresour. Technol. 2010, 101, 9040–9048. [Google Scholar] [CrossRef] [PubMed]
  46. Canfield, D.E.; Stewart, F.J.; Thamdrup, B.; De Brabandere, L.; Dalsgaard, T.; Delong, E.F.; Revsbech, N.P.; Ulloa, O. A cryptic sulfur cycle in oxygen-minimum–zone waters off the Chilean coast. Science 2010, 330, 1375–1378. [Google Scholar] [CrossRef] [PubMed] [Green Version]
  47. Dominika, G.; Joanna, M.; Jacek, M. Sulfate reducing ammonium oxidation (SULFAMMOX) process under anaerobic conditions. Environ. Technol. Innov. 2021, 22, 101416. [Google Scholar] [CrossRef]
Figure 1. Cumulative methane yields with time in AcoD of SS and FW. (Symbols represent the experimental data, and solid lines represent the modified Gompertz model fit.)
Sustainability 14 04982 g001
Figure 2. Stability of AcoD: (a) variations of pH during AcoD process; (b) variations of SCOD during AcoD process.
Sustainability 14 04982 g002
Figure 3. Dynamics of sulfur chemical forms: (a) variations of H2S during AcoD process; (b) variations of SO42 during AcoD process; (c) variations of SO32 during AcoD process; (d) variations of S2− during AcoD process.
Sustainability 14 04982 g003
Figure 4. Dynamic of nitrogen chemical forms: (a) variations of NH3 during AcoD process; (b) variations of NH4+ during AcoD process; (c) variations of NO3 during AcoD process; (d) variations of NO2 during AcoD process.
Sustainability 14 04982 g004aSustainability 14 04982 g004b
Figure 5. Microbial community structure in AcoD systems: (a) bacteria at the phylum level; (b) bacteria at the genus level; (c) archaea at the genus level.
Sustainability 14 04982 g005
Figure 6. Redundancy analysis (RDA) of the relationship between N and S compounds and bacterial genera.
Sustainability 14 04982 g006
Figure 7. Heatmap of the abundance of the metabolic pathways of the sulfur cycle (blue solid line), nitrogen cycle (yellow solid line) and carbon cycle (black solid line).
Sustainability 14 04982 g007
Figure 8. Integrated variation of N and S species during AcoD at ratio 2:8: (a) nitrogen and sulfur in gas phase; (b) nitrogen and sulfur inorganic compounds in supernatant.
Sustainability 14 04982 g008aSustainability 14 04982 g008b
Table 1. Parameters of the Modified Gompertz model.
ParameterSS:FW
10:08:27:35:53:72:80:10
CMY5.956.7510.7312.8414.8115.1219.57
P6.046.4810.1411.7514.0414.5619.37
Rm0.270.270.501.130.811.301.04
λ3.281.112.003.262.852.122.65
Adj R20.990.980.980.980.990.990.99
Table 2. OTU and diversity index of bacterial communities under different co-digestion conditions.
SampleOTUsShannonChaoAceCoverage
SS9045.051004.96993.880.99
Inoculum8893.751142.051137.530.99
R-19914.221223.691213.370.99
R-28783.811170.191156.090.99
R-38803.831120.641146.370.99
R-48613.781203.011176.860.99
R-58103.781034.321053.540.99
R-68713.771170.071219.510.99
R-79464.191183.031151.820.99
Table 3. OTU and diversity index of archaea communities under different co-digestion conditions.
SampleOTUsShannonChaoAceCoverage
SS812.0782.582.310.99
Inoculum852.12107.67100.110.99
R-1632.307480.710.99
R-2772.2089.094.090.99
R-3822.2688.593.610.99
R-4702.1575.1476.290.99
R-5752.2610592.760.99
R-6902.139697.190.99
R-7732.3080.579.650.99
Publisher’s Note: MDPI stays neutral with regard to jurisdictional claims in published maps and institutional affiliations.

