
Application of the Viscoelastic Continuum Damage Theory to Study the Fatigue Performance of Asphalt Mixtures—A Literature Review


Abstract
:1. Introduction
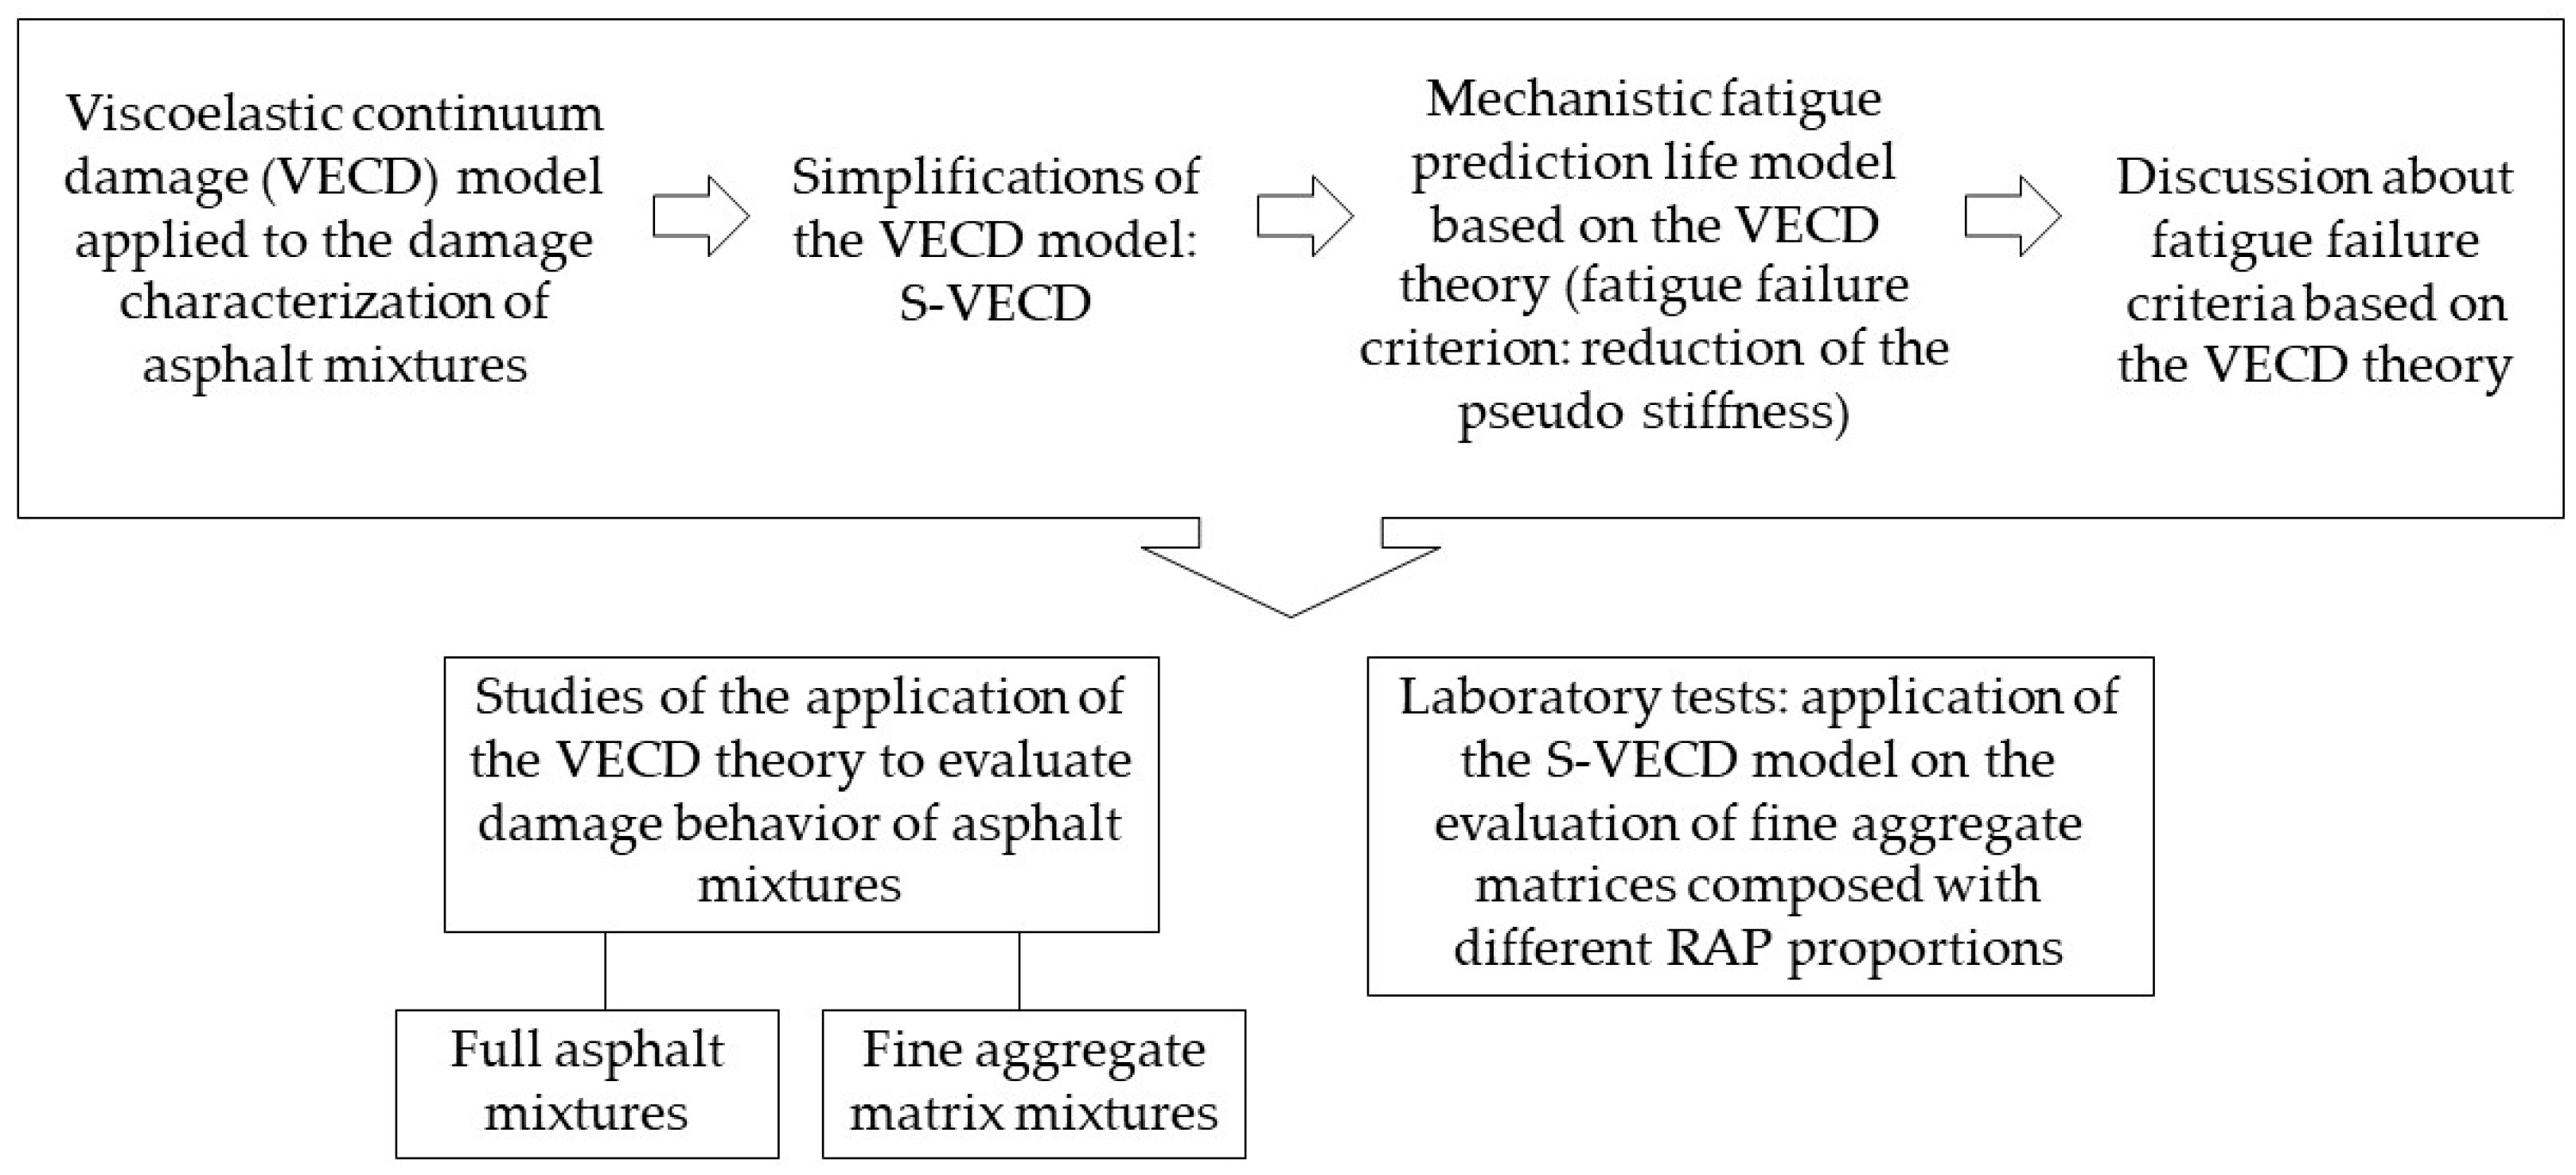
2. Theory of Viscoelastic Continuum Damage
2.1. The Work Potential Theory
2.2. Elastic–Viscoelastic Correspondence Principle
2.3. Viscoelastic Continuum Damage Model Applied to Asphalt Mixtures
2.4. Pseudo-Strain Calculation
2.5. Simplified Viscoelastic Continuum Damage Model
2.6. Mechanistic Fatigue Life Prediction Model
2.7. Fatigue Failure Criterion
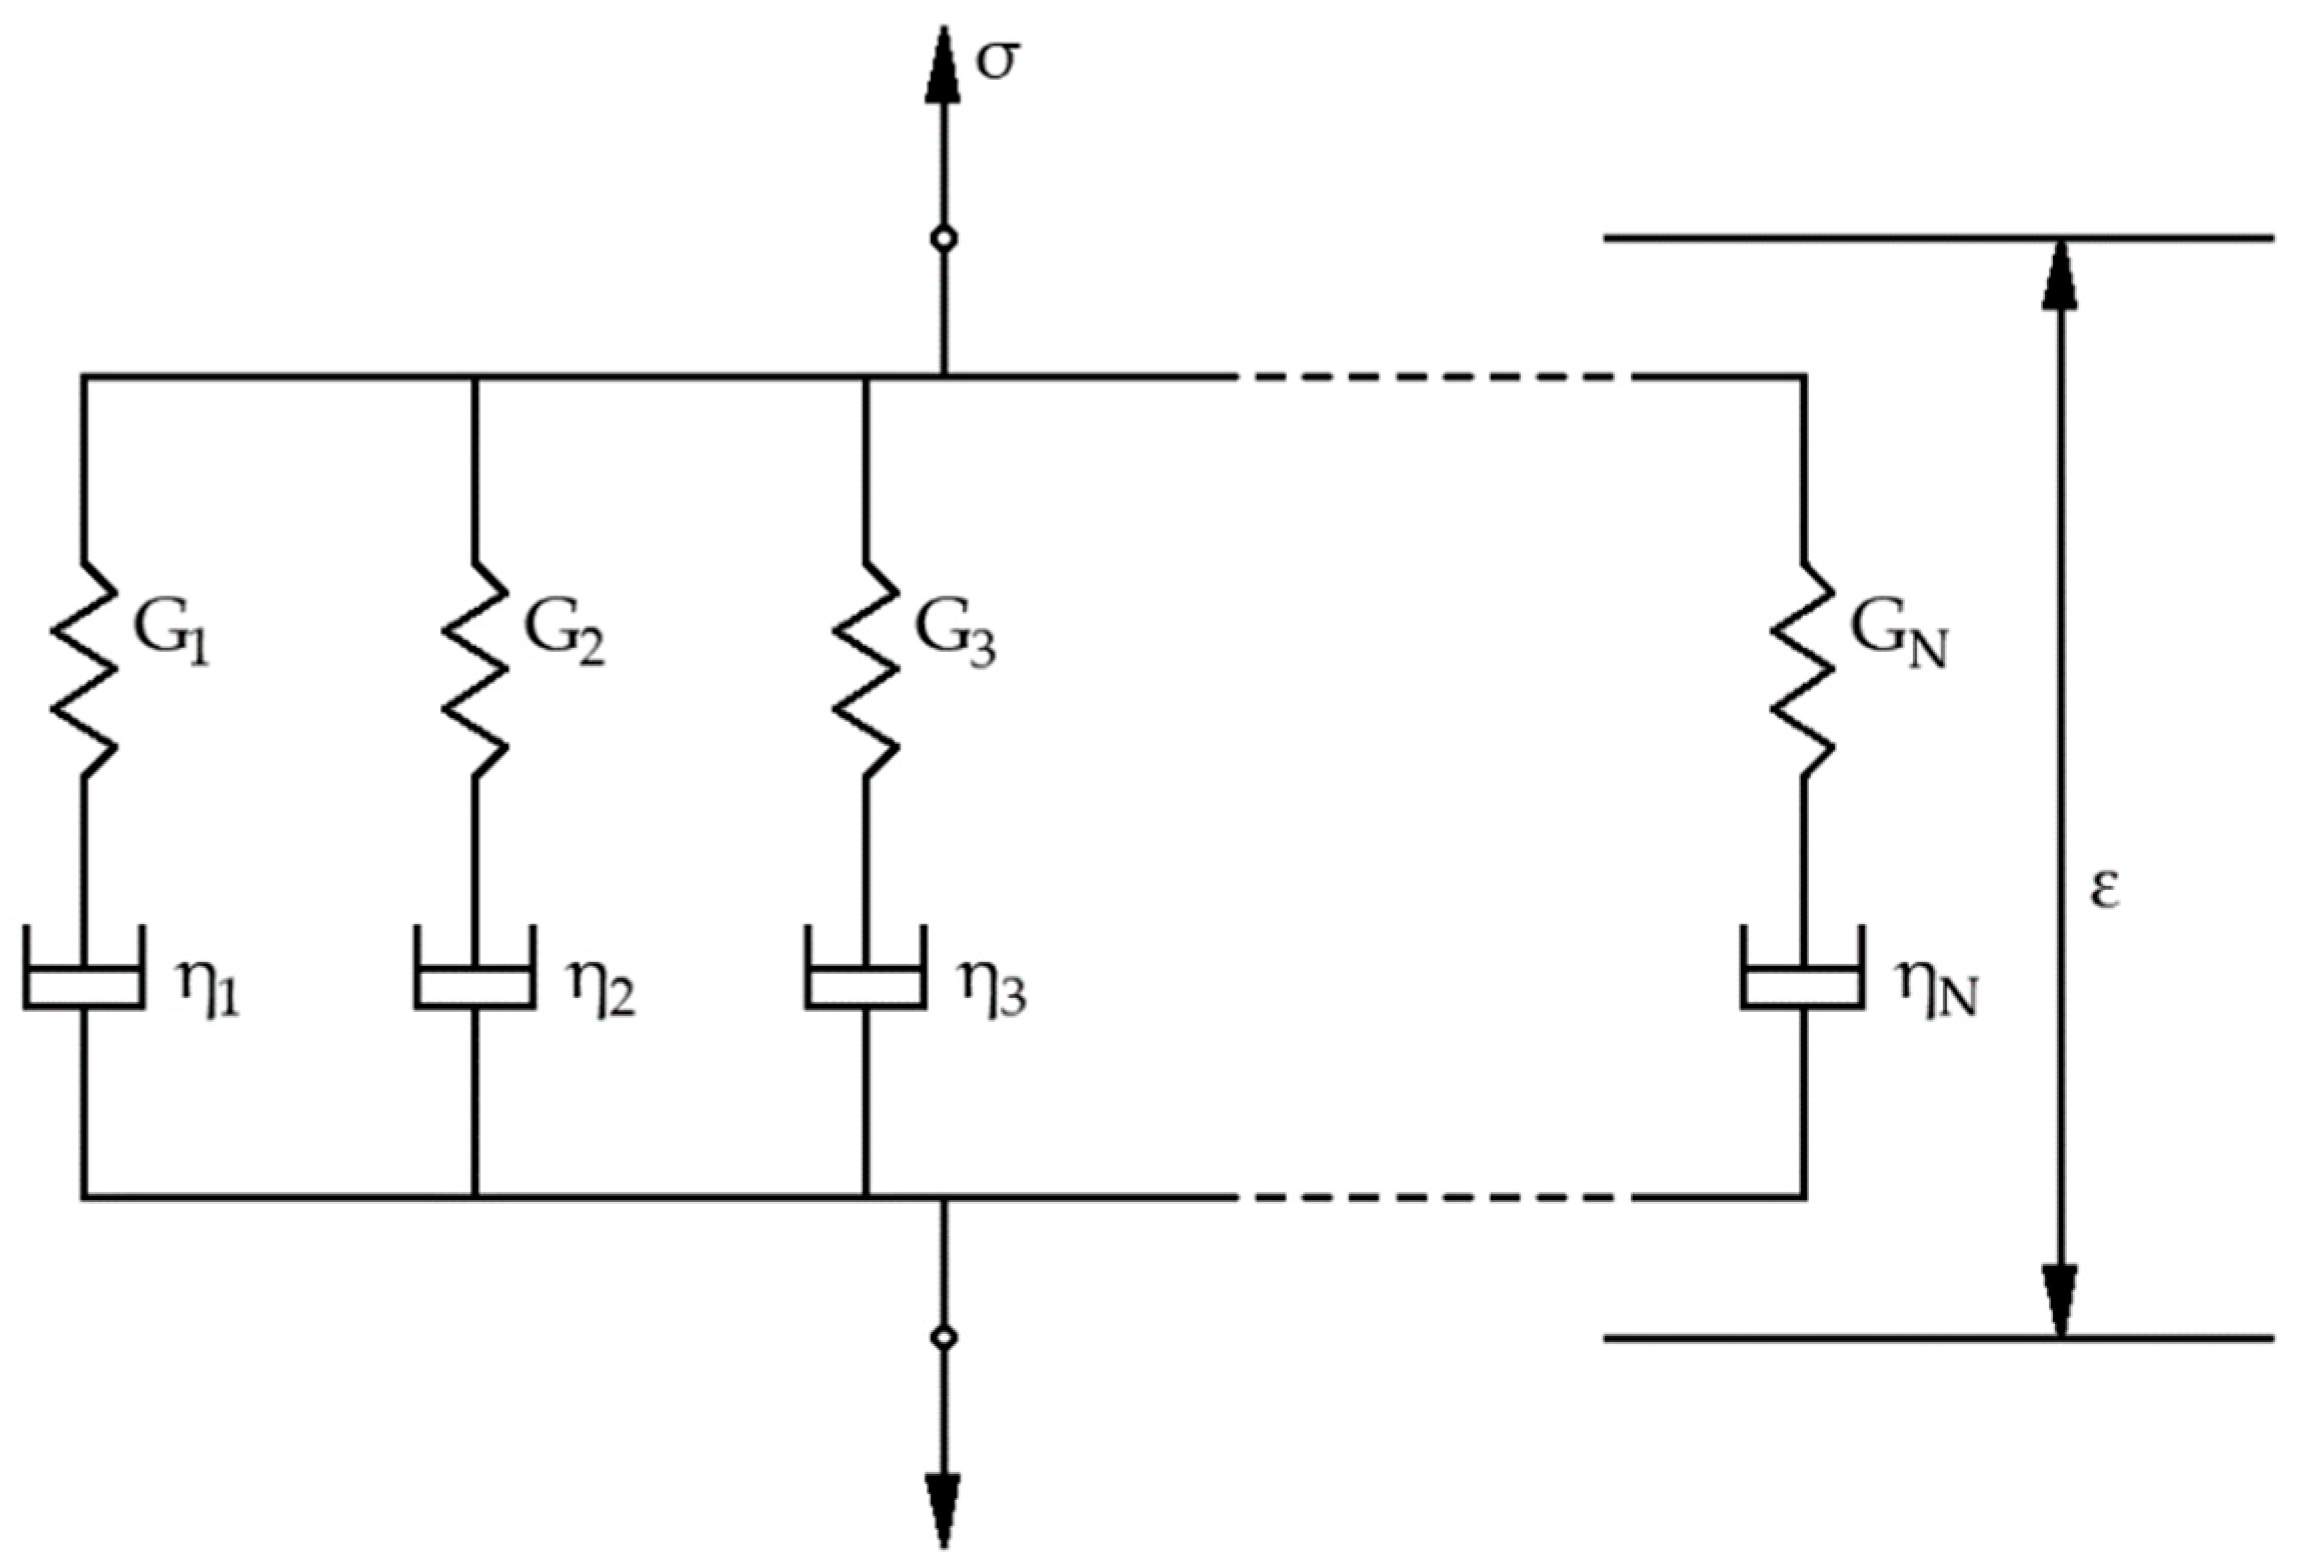
2.8. Linear Viscoelasticity
3. Studies on the Application of the VECD Theory
3.1. Full Asphalt Mixture Approach
3.2. Fine Aggregate Matrix Approach
4. Analysis Protocol of Tests with FAM Using the S-VECD Approach
5. Application of the S-VECD Theory: Laboratory Tests and Discussion of Results
5.1. Experimental Method—Materials and Preparation of the FAM Specimens
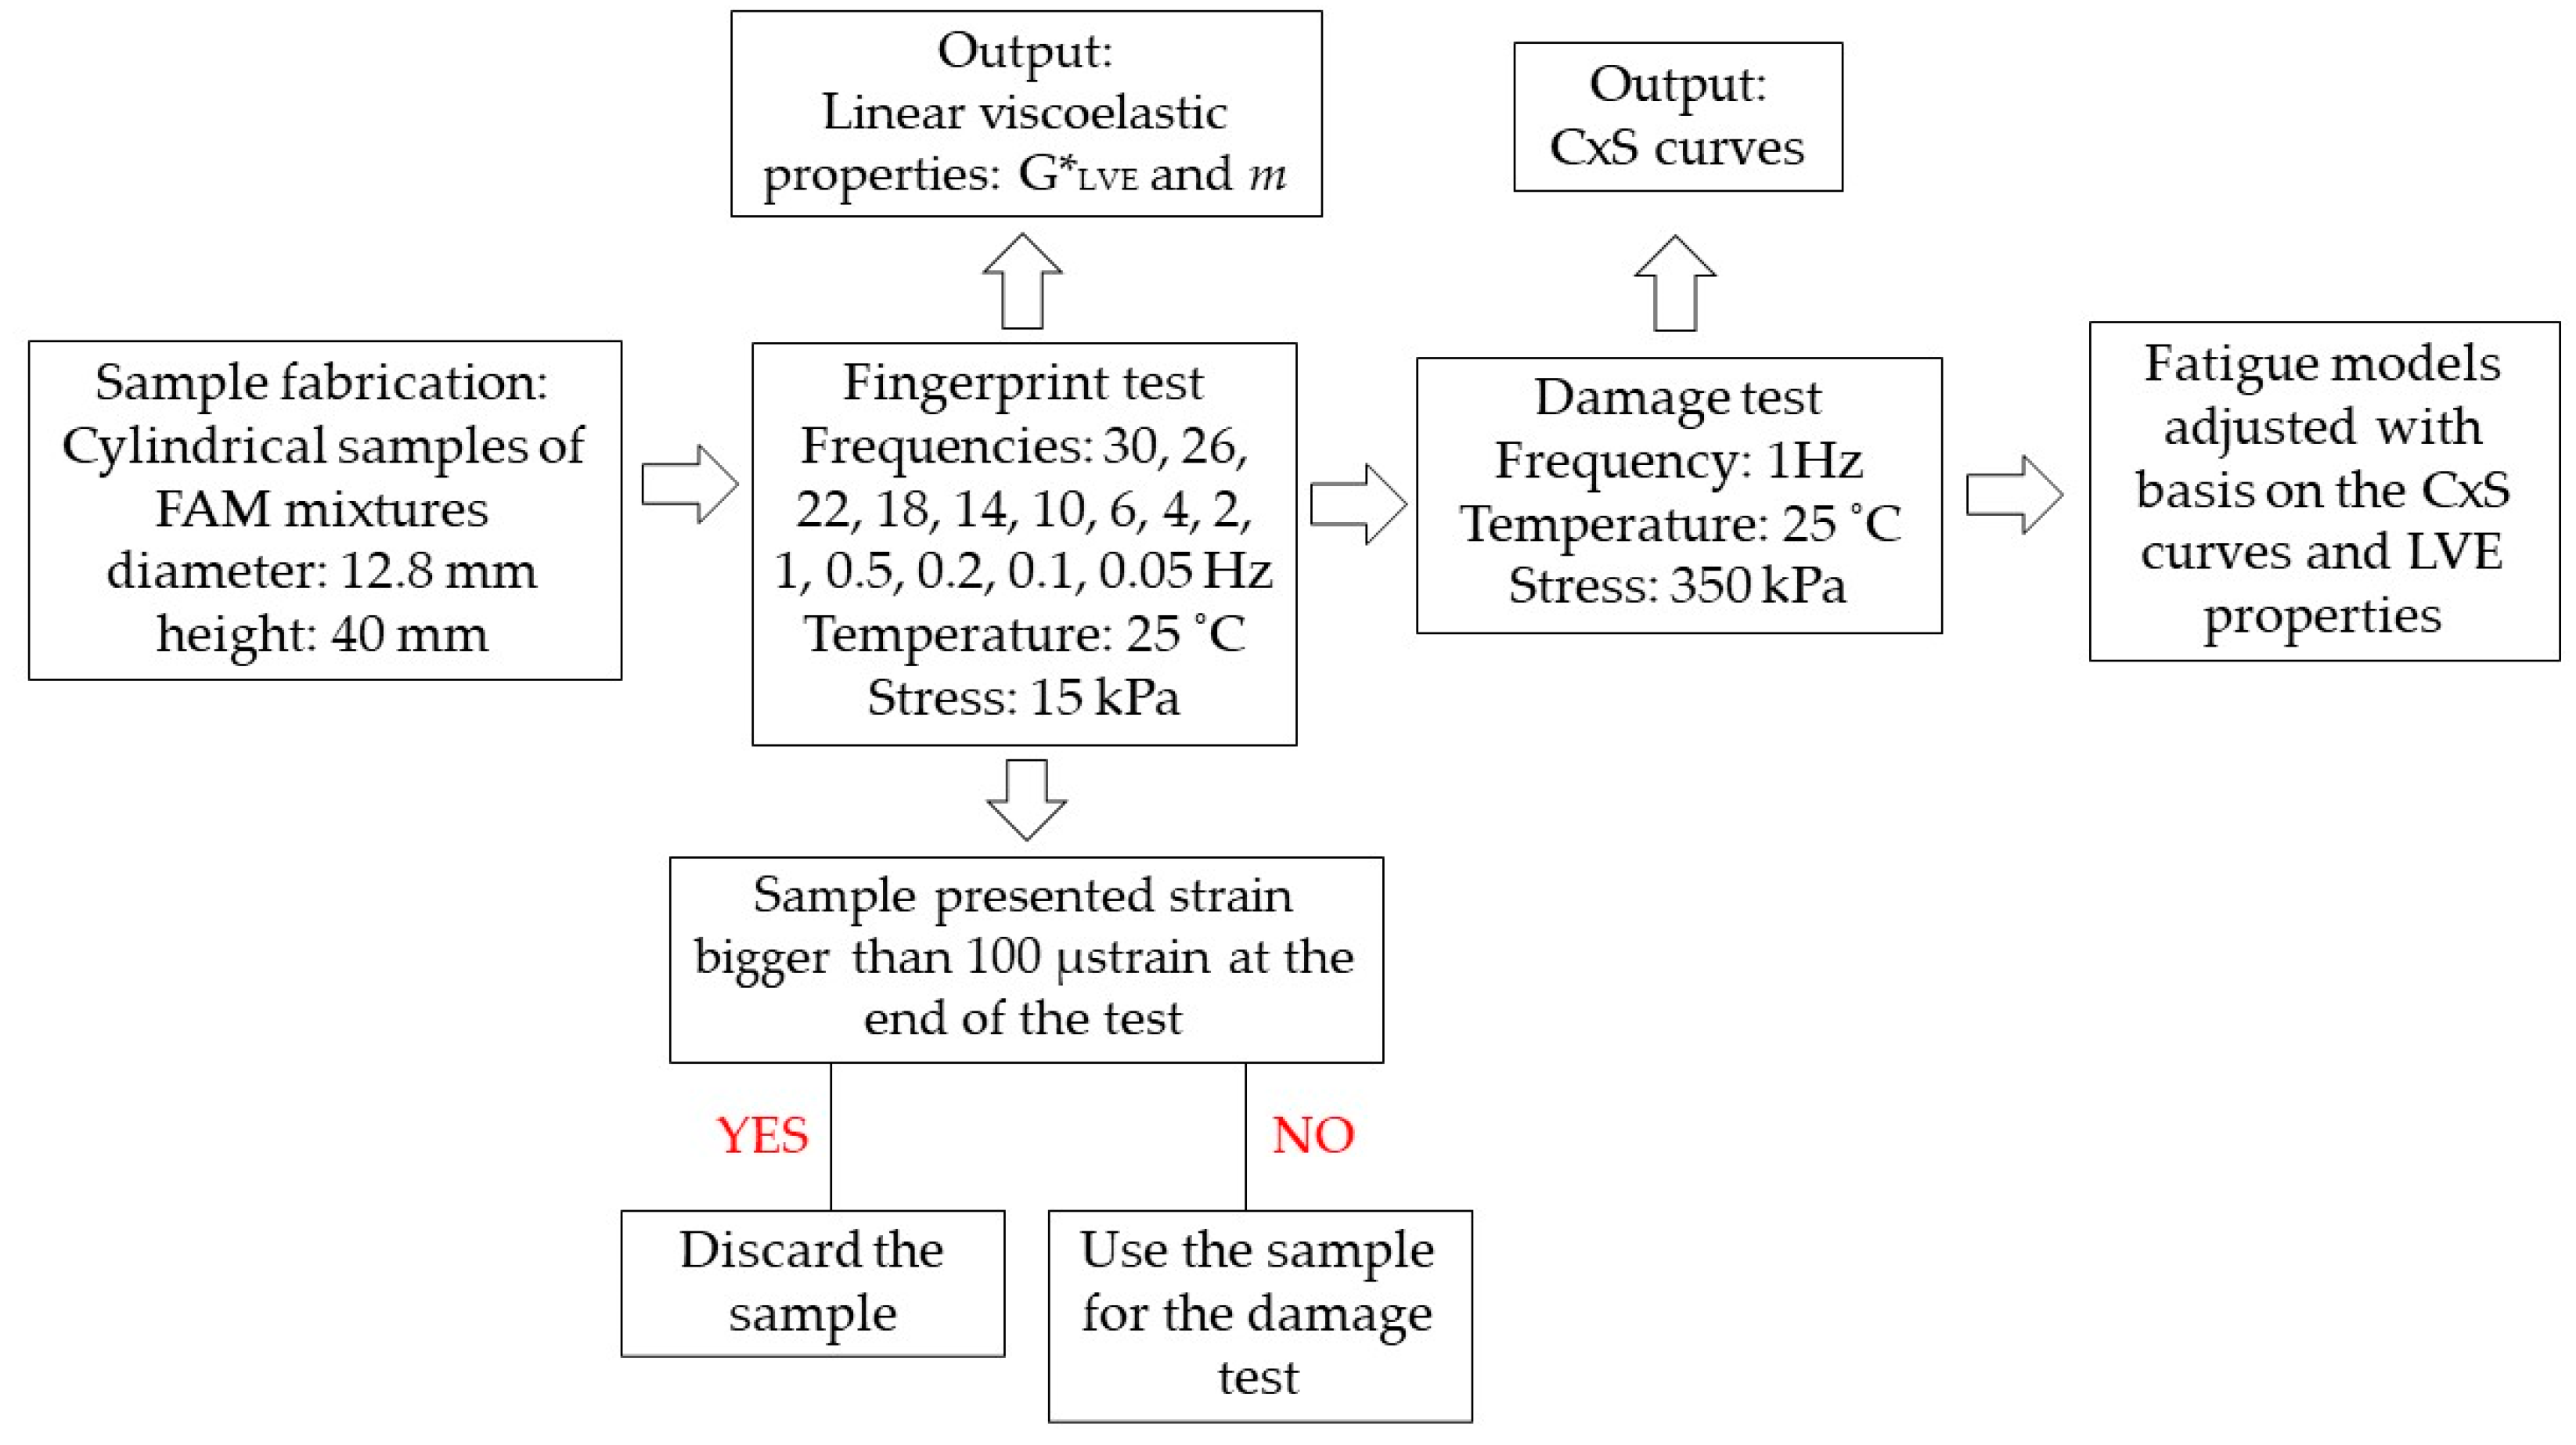
5.2. Experimental Method: Fingerprint Test
5.3. Experimental Method: Damage Test
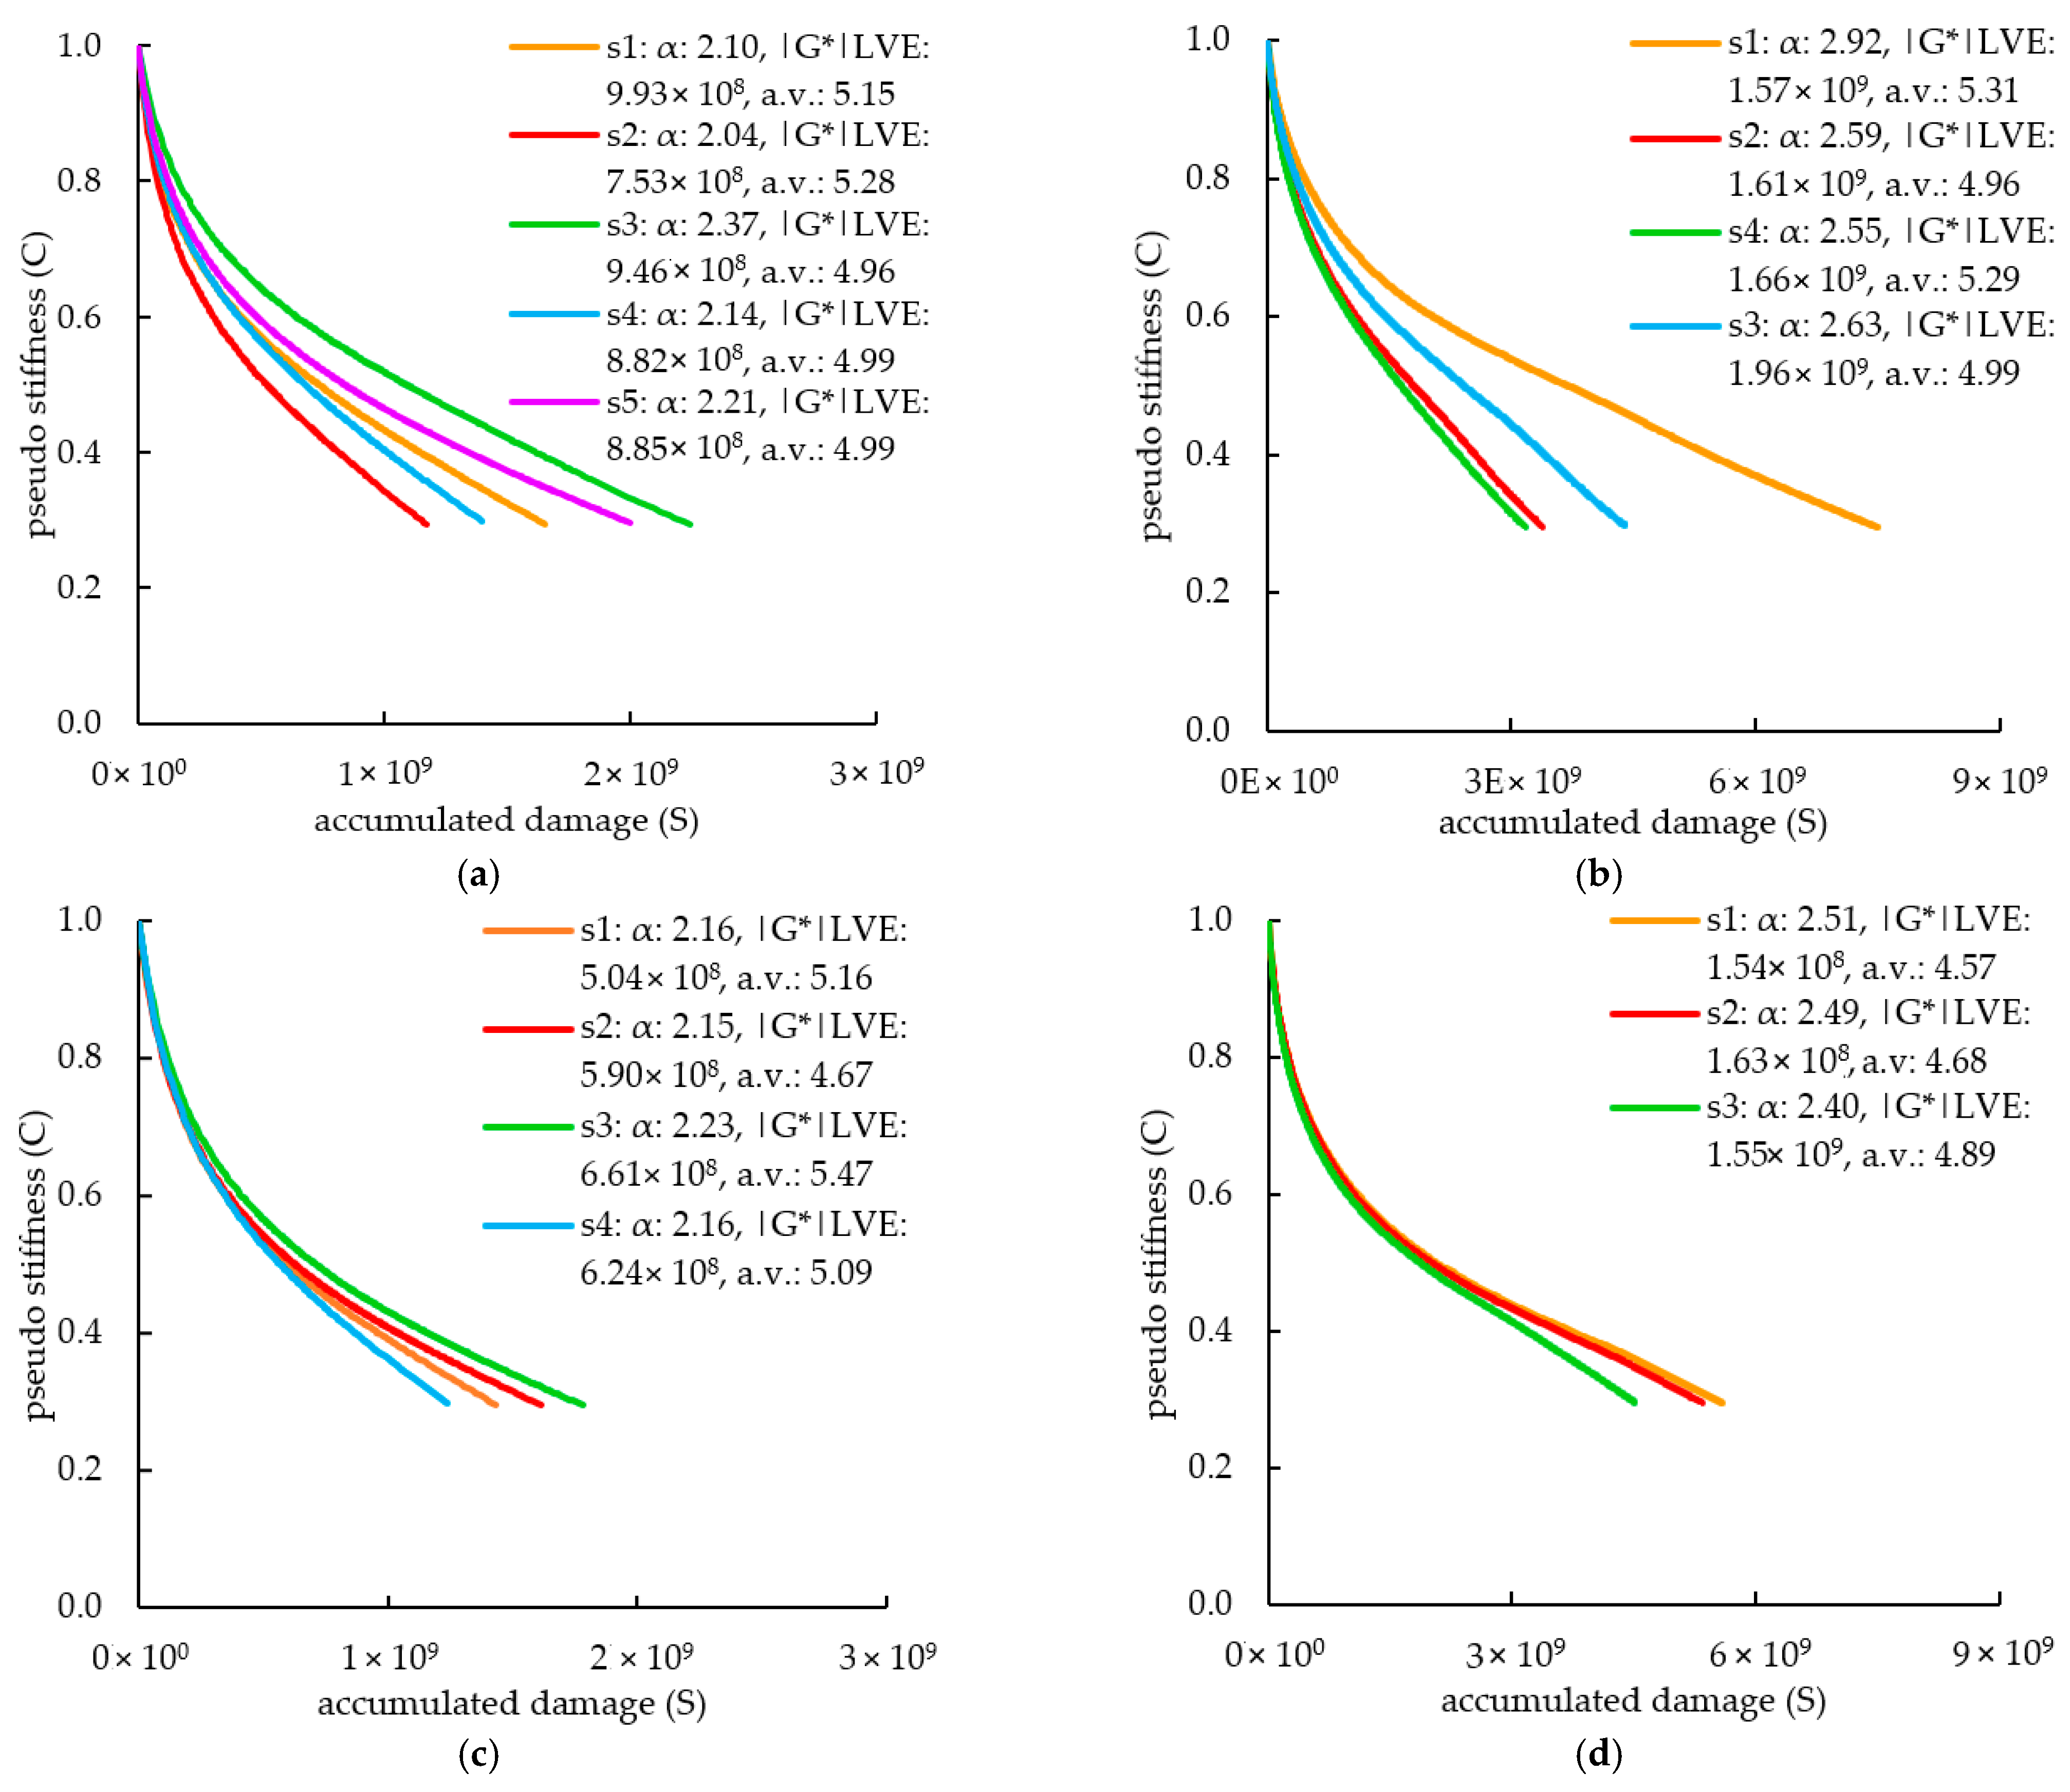
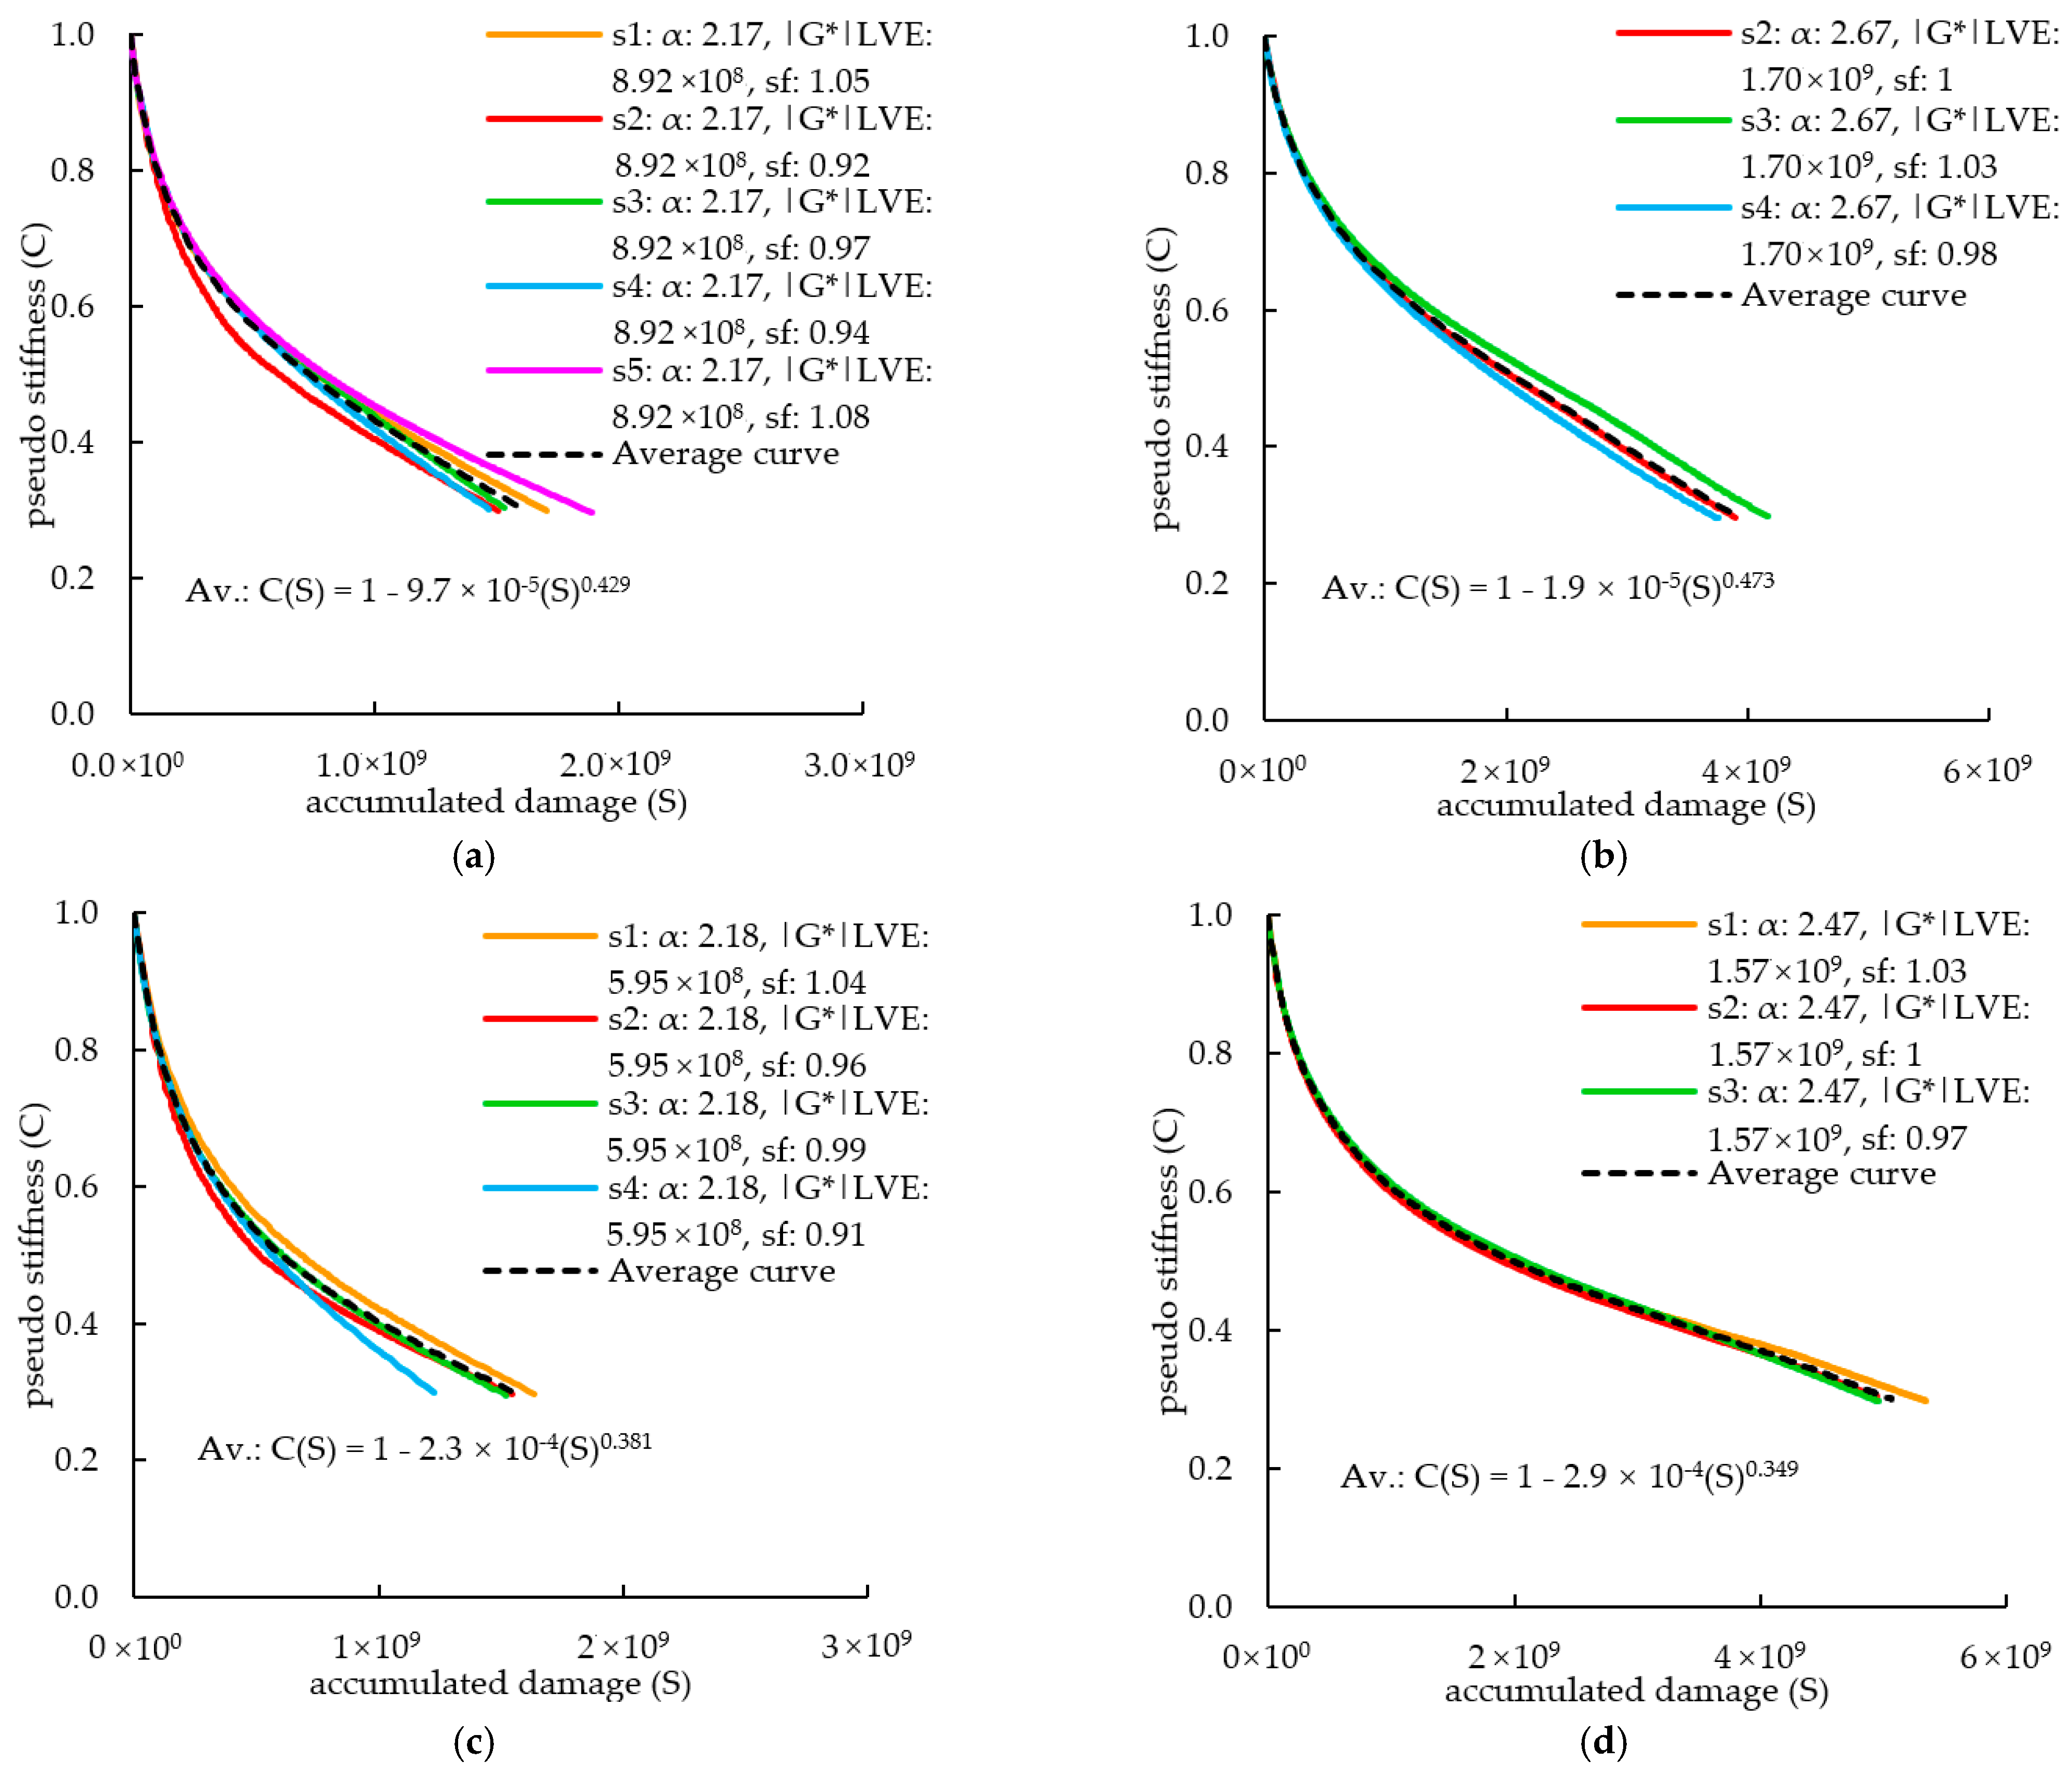
5.4. Analysis and Discussion of Results
6. Conclusions
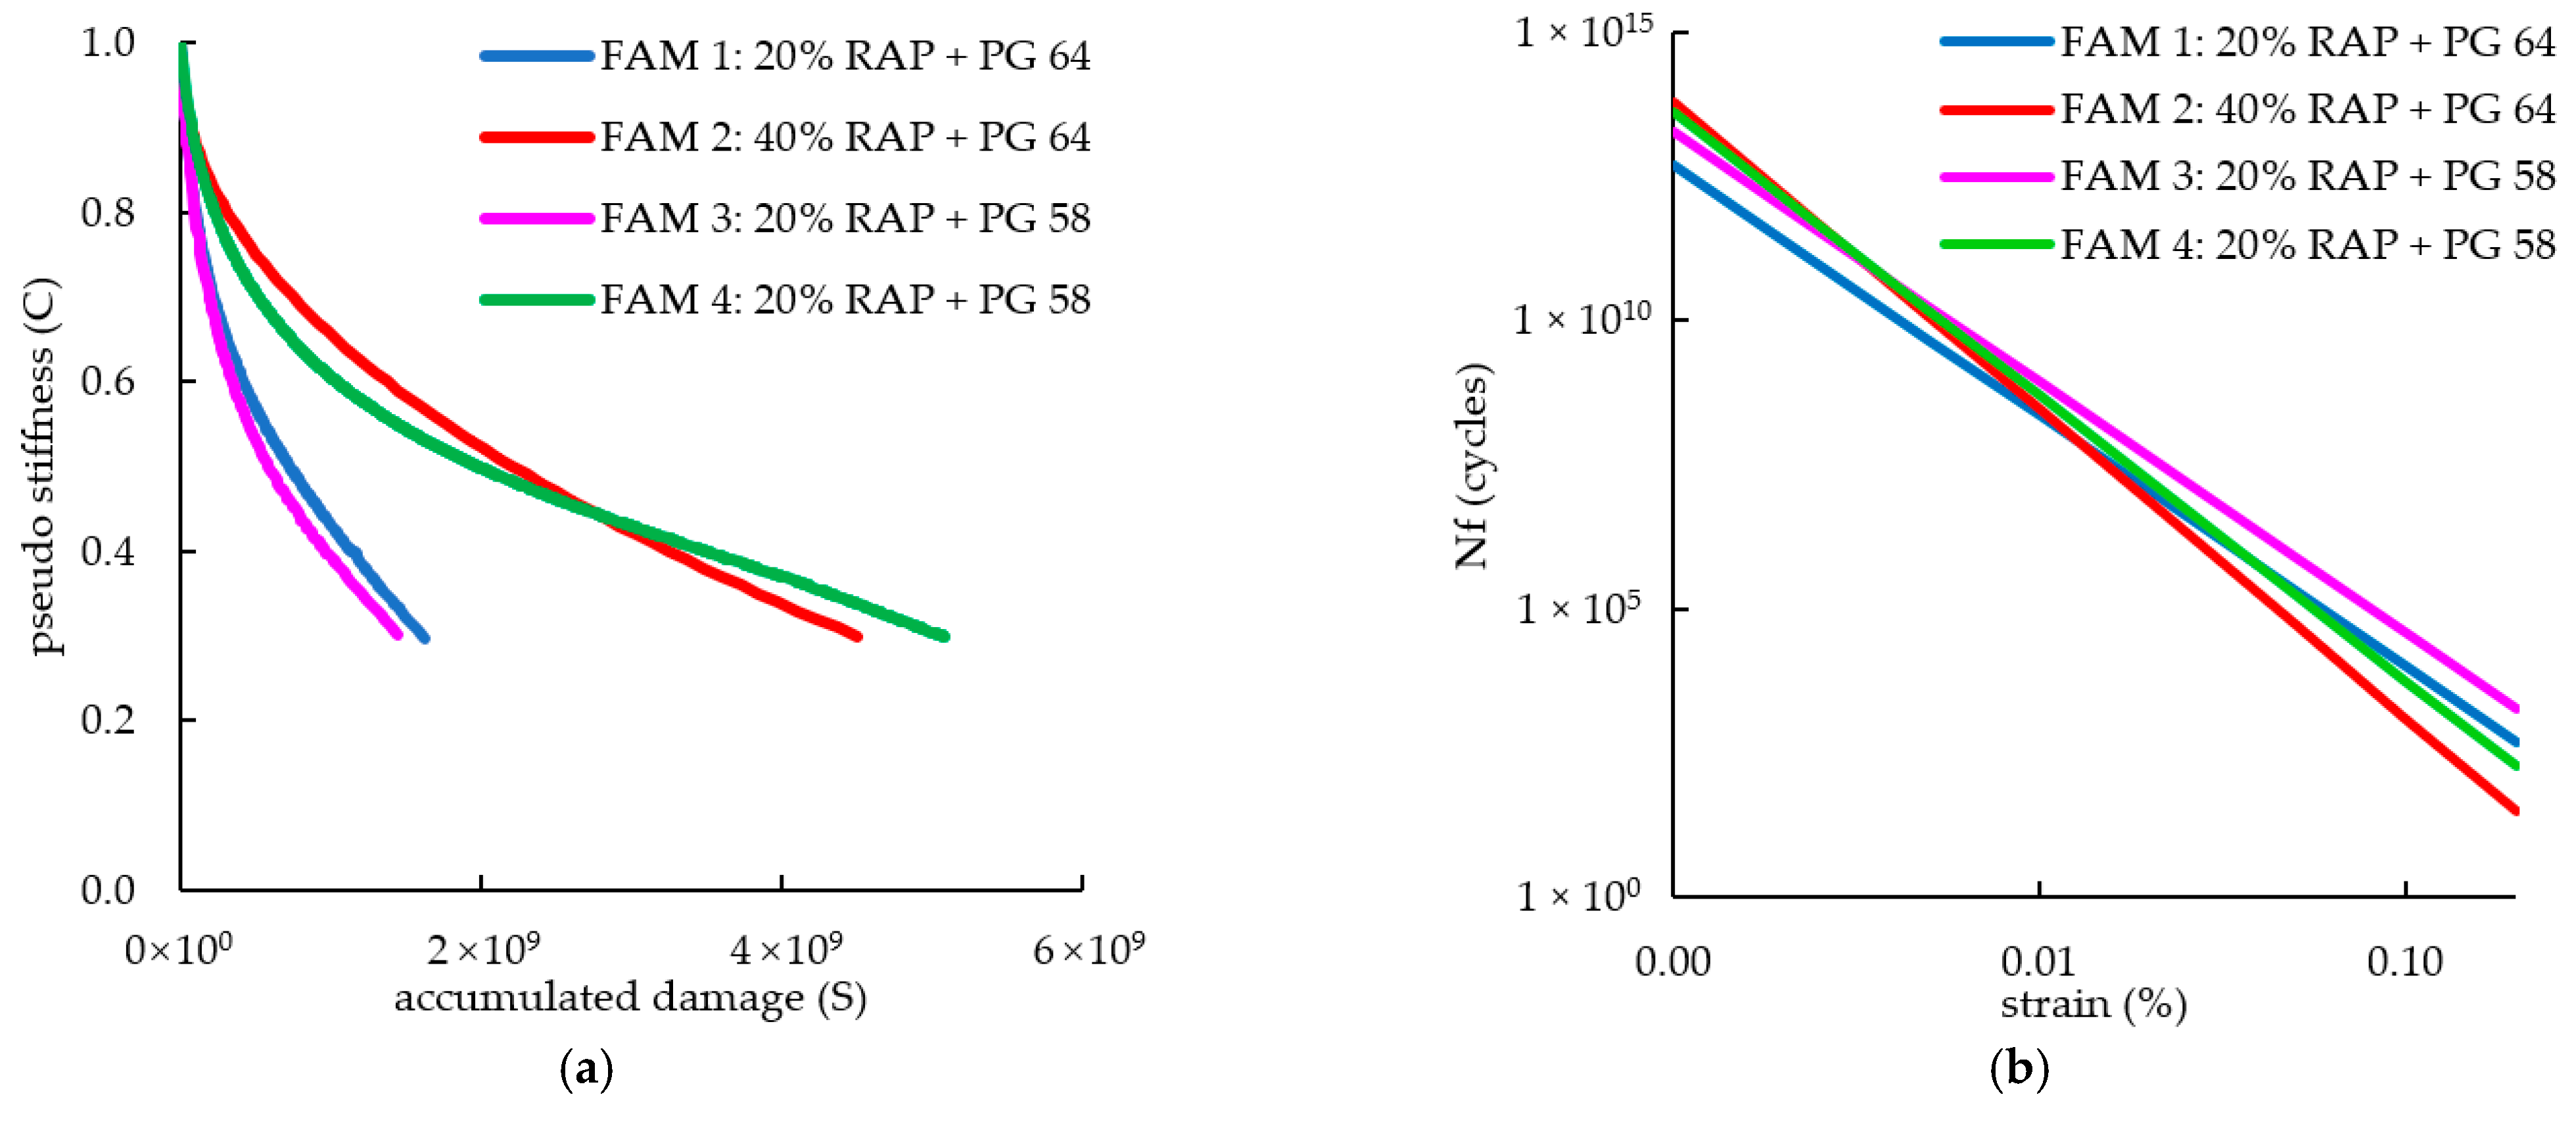
- The findings of the experimental study with RAP and binders PG 64-22 and PG 58-16 indicated that the FAMs containing 40% of RAP (2 and 4) presented higher |G*|LVE values and higher damage evolution ratios as compared to the FAMs containing 20% of RAP (1 and 3). Out of the FAMs prepared with 20% of RAP (FAM1 and FAM3), the highest |G*|LVE was observed for the FAM containing binder PG 64-22 (FAM1), and the damage evolution ratios were the same for both FAMs, which was an expected result, once the presence of the softest binder (PG 58-16) was supposed to reduce the stiffness of the FAMs (3 and 4).
- Regarding the prediction of the fatigue lives of the materials evaluated in the experimental study, the addition of RAP increased the parameter A of the fatigue model (related to the initial stiffness of the material and how the stiffness changed with the evolution of the damage) and the parameter B (related to the damage evolution rate)—the resulting fatigue lives of the FAMs prepared with 20% RAP were longer than the ones obtained for the FAMs prepared with 40% of RAP. The fatigue performance was directly related to the specimen stiffness: the higher the stiffness, the higher its susceptibility to damage and the lower the relaxation rates (which resulted in higher damage accumulation rates). The best solution to adjust the binder content of FAMs produced with 20% and 40% of RAP was the use of the binder PG 58-16. The FAM tests combined with the S-VECD theory as a tool to analyze the results was a practical approach, and is widely used to evaluate all sorts of variables of an asphalt mixture. However, some variables, such as low temperatures and/or high percentages of RAP, turn the mixtures into overly stiff materials, and the tests can be unpractical due to the limits of the rheometer torque. Equipment with a higher torque capability could accelerate the test duration.
- The improvement of computational simulations of the test protocols is an important subject for future works, and could contribute to a better understanding of the mechanisms and variables involved in the fatigue process, and could also help overcome the rheometer limitations.
- Comparisons between fractures mechanics and continuum mechanics results could also be an interesting topic to improve the VECD model in order to account for the different types of damage: adhesive or cohesive.
- Regarding materials science and development of advanced/new materials, the FAM approach combined with the S-VECD approach offered several new possibilities in terms of material performance evaluation and material development. Some examples can be mentioned concerning the fatigue performance: (i) the evaluation of the impact of higher RAP contents added to new AC mixtures; (ii) the evaluation of the impact of recycling agents at different contents, including petroleum-based materials, vegetable-based oils, and recycled oils; (iii) the assessment of the aging impact on fatigue; (iv) the assessment of moisture damage on fatigue resistance; (v) the assessment of new asphalt modifiers, including hybrid modification using virgin and recycled materials; and (vi) the evaluation of the effect of distinct aggregate types and aggregate gradations, among others. Several doubts related to these subjects can be countered by carrying out tests at the FAM scale and using the S-VECD approach. However, one must keep in mind that such a development also depends on a larger number of experiments on the correlation between the fatigue performance at the two scales (FAM and full asphalt mixtures). Such experiments are essential for the development and popularization of these very promising techniques.
Author Contributions
Funding
Institutional Review Board Statement
Informed Consent Statement
Data Availability Statement
Conflicts of Interest
References
- Tayebali, A.A.; Rowe, G.M.; Sousa, J.B. Fatigue response of asphalt-aggregate mixtures (with discussion). J. Assoc. Asph. Paving Technol. 1992, 61, 333–336. [Google Scholar]
- Di Benedetto, H.; De La Roche, C.; Baaj, H.; Pronk, A.; Lundström, R. Fatigue of bituminous mixtures. Mater. Struct. 2004, 37, 202–216. [Google Scholar] [CrossRef]
- Kim, Y.R. Mechanistic Fatigue Characterization and Damage Modeling of Asphalt Mixtures. Ph.D. Thesis, Texas A&M University, College Station, TX, USA, 2003. [Google Scholar]
- Chen, A.; Airey, G.D.; Thom, N.; Li, Y. Characterisation of fatigue damage in asphalt mixtures using X-ray computed tomography. Road Mater. Pavement Des. 2022, 1–19. [Google Scholar] [CrossRef]
- Kim, Y.-R.; Little, N.D. Development of Specification-Type Tests to Assess the Impact of Fine Aggregate and Mineral Filler on Fatigue Damage; FHWA/TX-05/0-1707-10; Texas Transportation Institute, Texas A&M University: College Station, TX, USA, 2005. [Google Scholar]
- Zhu, J.; Alavi, M.Z.; Harvey, J.; Sun, L.; He, Y. Evaluating fatigue performance of fine aggregate matrix of asphalt mix containing recycled asphalt shingles. Constr. Build. Mater. 2017, 139, 203–211. [Google Scholar] [CrossRef]
- Lee, H.-J.; Daniel, J.S.; Kim, Y.R. Continuum damage mechanics-based fatigue model of asphalt concrete. J. Mater. Civ. Eng. 2000, 12, 105–112. [Google Scholar] [CrossRef]
- Kim, Y.-R.; Little, D.N.; Lytton, R.L. Fatigue and healing characterization of asphalt mixtures. J. Mater. Civ. Eng. 2003, 15, 75–83. [Google Scholar] [CrossRef]
- Hou, T. Fatigue Performance Prediction of North Carolina Mixtures Using Simplified Viscoelastic Continuum Damage Model. Master’s Thesis, North Carolina State University, Raleigh, NC, USA, 2009. [Google Scholar]
- Rowe, G.M. Performance of asphalt mixtures in the trapezoidal fatigue test. J. Assoc. Asph. Paving Technol. 1993, 62, 344–384. [Google Scholar]
- Reese, R. Properties of aged asphalt binder related to asphalt concrete life. J. Assoc. Asph. Paving Technol. 1997, 66, 604–632. [Google Scholar]
- Hopman, P.C.; Kunst, P.A.J.C.; Pronk, A.C. A renewed interpretation method for fatigue measurement, verification of miner’s rule. In Proceedings of the 4th Eurobitume Symposium, Madrid, Spain, 4–6 October 1989; pp. 557–561. [Google Scholar]
- Rowe, G.M.; Bouldin, M.G. Improved techniques to evaluate the fatigue resistance of asphaltic mixtures. In Proceedings of the 2nd Eurasphalt & Eurobitume Congress, Barcelona, Spain, 20–22 September 2000; Volume 2000. [Google Scholar]
- Izadi, A. Quantitative Characterization of Microstructure of Asphalt Mixtures to Evaluate Fatigue Crack Growth. Ph.D. Thesis, University of Texas, Austin, TX, USA, 2012. [Google Scholar]
- Schapery, R.A. A theory of crack initiation and growth in viscoelastic media iii. analysis of continuous growth. Int. J. Fract. 1975, 11, 549–562. [Google Scholar] [CrossRef]
- Karki, P.; Kim, Y.-R.; Little, D.N. Dynamic modulus prediction of asphalt concrete mixtures through computational micromechanics. Transp. Res. Rec. 2015, 2507, 1–9. [Google Scholar] [CrossRef]
- Palvadi, S.; Bhasin, A.; Little, D.N. Method to quantify healing in asphalt composites by continuum damage approach. Transp. Res. Rec. 2012, 2296, 86–96. [Google Scholar] [CrossRef]
- Gudipudi, P.; Underwood, B.S. Testing and modelling of fine aggregate matrix and its relationship to asphalt concrete mix. Transp. Res. Rec. 2015, 2507, 120–127. [Google Scholar] [CrossRef]
- Behbahani, H.; Salehfard, R. A review of studies on asphalt fine aggregate matrix. Arab. J. Sci. Eng. 2021, 46, 10289–10312. [Google Scholar] [CrossRef]
- AASHTO, T, 27; Standard Method of Test for Sieve Analysis of Fine and Coarse Aggregates. American Association of State and Highway Transportation Officials: Washington, DC, USA, 2018.
- Park, S.W.; Kim, Y.R.; Schapery, R.A. A viscoelastic continuum damage model and its application to uniaxial behavior of asphalt concrete. Mech. Mater. 1996, 24, 241–255. [Google Scholar] [CrossRef]
- Schapery, R.A. Correspondence principles and a generalized J integral for large deformation and fracture analysis of viscoelastic media. Int. J. Fract. 1984, 25, 195–223. [Google Scholar] [CrossRef]
- Schapery, R.A. A theory of mechanical behavior of elastic media with growing damage and other changes in structure. J. Mech. Phys. Solids 1990, 38, 215–253. [Google Scholar] [CrossRef]
- Lee, H.-J. Uniaxial Constitutive Modelling of Asphalt Concrete Using Viscoelasticity and Continuum Damage Theory. Ph.D. Thesis, North Carolina State University, Raleigh, NC, USA, 1996. [Google Scholar]
- Lee, H.-J.; Kim, Y.R. Viscoelastic constitutive model for asphalt concrete under cyclic loading. J. Eng. Mech. 1998, 124, 32–40. [Google Scholar] [CrossRef]
- Park, S.W.; Schapery, R.A. A viscoelastic constitutive model for particulate composites with growing damage. Int. J. Solids Struct. 1996, 34, 931–947. [Google Scholar] [CrossRef]
- Kim, Y.R.; Little, D.N. One-dimensional constitutive modelling of asphalt concrete. J. Eng. Mech. 1990, 116, 751–772. [Google Scholar] [CrossRef]
- Schapery, R.A. On viscoelastic deformation and failure behavior of composite materials with distributed flaws. Adv. Aerosp. Struct. Mater. 1981, AD 01, 5–20. [Google Scholar]
- Lee, H.-J.; Kim, Y.R. Viscoelastic continuum damage model of asphalt concrete with healing. J. Eng. Mech. 1998, 124, 1224–1232. [Google Scholar] [CrossRef]
- Kutay, M.E.; Gibson, N.H.; Youtcheff, J. Conventional and viscoelastic continuum damage (VECD)-based fatigue analysis of polymer modified asphalt pavements (with discussion). J. Assoc. Asph. Paving Technol. 2008, 77, 395–434. [Google Scholar]
- Christensen Jr, D.W.; Bonaquist, R. Practical application of continuum damage theory to fatigue phenomena in asphalt concrete mixtures (With Discussion and Closure). J. Assoc. Asph. Paving Technol. 2005, 74, 963–1002. [Google Scholar]
- Christensen Jr, D.W.; Bonaquist, R. Analysis of HMA fatigue data using the concepts of reduced loading cycles and endurance limit. J. Assoc. Asph. Paving Technol. 2009, 78, 277–416. [Google Scholar]
- Underwood, B.S.; Kim, Y.R.; Savadatti, S.; Thirunavukkarasu, S.; Guddati, M. Response and fatigue performance modelling of ALF pavements using 3-D finite element analysis and a simplified viscoelastic continuum damage model. Asph. Paving Technol. Assoc. Asph. Paving Technol. Proc. Tech. Sess. 2009, 78, 829–868. [Google Scholar]
- Underwood, B.S.; Kim, Y.R.; Guddati, M.N. Improved calculation method of damage parameter in viscoelastic continuum damage model. Int. J. Pavement Eng. 2010, 11, 459–476. [Google Scholar] [CrossRef]
- Underwood, B.S.; Kim, Y.R.; Savadatti, S.; Thirunavukkarasu, S.; Guddati, M.N. Simplified fatigue performance modelling of ALF pavements using VECD+ 3-D finite element modelling. Adv. Test. Charact. Bitum. Mater. 2009, 2, 849–858. [Google Scholar]
- Lee, K.; Castorena, C.; Kim, Y.R. Improving the reliability of damage characteristic curves in the simplified viscoelastic continuum damage model. Transp. Res. Rec. 2018, 2672, 493–502. [Google Scholar] [CrossRef]
- Kutay, M.E.; Gibson, N.; Youtcheff, J.; Dongré, R. Use of small samples to predict fatigue lives of field cores: Newly developed formulation based on viscoelastic continuum damage theory. Transp. Res. Rec. 2009, 2127, 90–97. [Google Scholar] [CrossRef]
- Underwood, B.S.; Baek, C.; Kim, Y.R. Simplified viscoelastic continuum damage model as platform for asphalt concrete fatigue analysis. Transp. Res. Rec. 2012, 2296, 36–45. [Google Scholar] [CrossRef]
- Epps, J.A.; Monismith, C.L. Fatigue of asphalt concrete mixtures—Summary of existing information. In Fatigue of Compacted Bituminous Aggregate Mixtures; Gallaway, B., Ed.; ASTM International: West Conshohocken, PA, USA, 1972; pp. 19–45. [Google Scholar]
- Kim, Y.R. Evaluation of Healing and Constitutive Modelling of Asphalt Concrete by Means of the Theory of Nonlinear Viscoelasticity and Damage Mechanics. Ph.D. Thesis, Texas A&M University, College Station, TX, USA, 1988. [Google Scholar]
- Zollinger, C.J. Application of Surface Energy Measurements to Evaluate Moisture Susceptibility of Asphalt and Aggregates. Ph.D. Thesis, Texas A&M University, College Station, TX, USA, 2005. [Google Scholar]
- Masad, E.; Zollinger, C.; Bulut, R.; Little, D.; Lytton, R.; Khalid, H.; Guarin, A. Characterization of HMA moisture damage using surface energy and fracture properties. In Proceedings of the Asphalt Paving Technology, Proceedings of the Technical Sessions, Association of Asphalt Paving Technologists Annual Meeting, Savannah, GA, USA, 27–29 March 2006; volume 75, pp. 713–754. [Google Scholar]
- Daniel, J.S.; Bisirri, W.; Kim, Y.R. Fatigue evaluation of asphalt mixtures using dissipated energy and viscoelastic continuum damage approaches (with discussion). J. Assoc. Asph. Paving Technol. 2004, 73, 557–583. [Google Scholar]
- Tarefder, R.A.; Bateman, D.; Swamy, A.K. Comparison of fatigue failure criterion in flexural fatigue test. Int. J. Fatigue 2013, 55, 213–219. [Google Scholar] [CrossRef]
- Zhang, J.; Sabouri, M.; Guddati, M.N.; Kim, Y.R. Development of a failure criterion for asphalt mixtures under fatigue loading. Road Mater. Pavement Des. 2013, 14 (Suppl. 2), 1–15. [Google Scholar] [CrossRef]
- Sabouri, M.; Kim, Y. Development of a failure criterion for asphalt mixtures under different modes of fatigue loading. Transp. Res. Rec. 2014, 2447, 117–125. [Google Scholar] [CrossRef]
- Etheridge, R.A.; Wang, Y.D.; Kim, S.S.; Kim, Y.R. Evaluation of fatigue cracking resistance of asphalt mixtures using apparent damage capacity. J. Mater. Civ. Eng. 2019, 31, 04019257. [Google Scholar] [CrossRef]
- Wang, Y.; Kim, Y.R. Development of a pseudo strain energy-based fatigue failure criterion for asphalt mixtures. Int. J. Pavement Eng. 2019, 20, 1182–1192. [Google Scholar] [CrossRef]
- Keshavarzi, B.; Kim, Y.R. A dissipated pseudo strain energy-based failure criterion for thermal cracking and its verification using thermal stress restrained specimen tests. Constr. Build. Mater. 2020, 233, 117199. [Google Scholar] [CrossRef]
- AASHTO, T. AASHTO, T. 321; Standard Method of Test for Determining the Fatigue Life of Compacted Asphalt Mixtures Subjected to Repeated Flexural Bending. American Association of State and Highway Transportation Officials: Washington, DC, USA, 2017.
- Sabouri, M.; Bennert, T.; Sias Daniel, J.; Richard Kim, Y. A comprehensive evaluation of the fatigue behaviour of plant-produced RAP mixtures. Road Mater. Pavement Des. 2015, 16 (Suppl. 2), 29–54. [Google Scholar] [CrossRef]
- Norouzi, A.; Sabouri, M.; Richard Kim, Y. Fatigue life and endurance limit prediction of asphalt mixtures using energy-based failure criterion. Int. J. Pavement Eng. 2017, 18, 990–1003. [Google Scholar] [CrossRef]
- Cao, W.; Norouzi, A.; Kim, Y.R. Application of viscoelastic continuum damage approach to predict fatigue performance of Binzhou perpetual pavements. J. Traffic Transp. Eng. 2016, 3, 104–115. [Google Scholar] [CrossRef] [Green Version]
- Kim, D.; Norouzi, A.; Kass, S.; Liske, T.; Kim, Y.R. Mechanistic performance evaluation of pavement sections containing RAP and WMA additives in Manitoba. Constr. Build. Mater. 2017, 133, 39–50. [Google Scholar] [CrossRef]
- Rad, F.Y.; Elwardany, M.D.; Castorena, C.; Kim, Y.R. Investigation of proper long-term laboratory aging temperature for performance testing of asphalt concrete. Constr. Build. Mater. 2017, 147, 616–629. [Google Scholar]
- Daniel, J.S.; Corrigan, M.; Jacques, C.; Nemati, R.; Dave, E.V.; Congalton, A. Comparison of asphalt mixture specimen fabrication methods and binder tests for cracking evaluation of field mixtures. Road Mater. Pavement Des. 2019, 20, 1059–1075. [Google Scholar] [CrossRef]
- Júnior, J.L.L.; Babadopulos, L.F.; Soares, J.B. Moisture-induced damage resistance, stiffness and fatigue life of asphalt mixtures with different aggregate-binder adhesion properties. Constr. Build. Mater. 2019, 216, 166–175. [Google Scholar] [CrossRef]
- Rahbar-Rastegar, R.; Zhang, R.; Sias, J.E.; Dave, E.V. Evaluation of laboratory ageing procedures on cracking performance of asphalt mixtures. Road Mater. Pavement Des. 2019, 20 (Suppl. 2), S647–S662. [Google Scholar] [CrossRef]
- Bueno, L.D.; Schuster, S.L.; Specht, L.P.; Pereira, D.D.S.; Nascimento, L.A.H.D.; Kim, Y.R.; Brenner, M.G.B. Asphalt pavement design optimization: A case study using viscoelastic continuum damage theory. Int. J. Pavement Eng. 2020, 23, 1070–1082. [Google Scholar] [CrossRef]
- Sabouri, M. Evaluation of performance-based mix design for asphalt mixtures containing Reclaimed Asphalt Pavement (RAP). Constr. Build. Mater. 2020, 235, 117545. [Google Scholar] [CrossRef]
- Mensching, D.J.; Daniel, J.S.; Underwood, B.S. Exploring indicators for fatigue cracking in hot mix asphalt pavements using simplified-viscoelastic continuum damage theory. Road Mater. Pavement Des. 2018, 19, 536–545. [Google Scholar] [CrossRef]
- Wang, Y.D.; Keshavarzi, B.; Kim, Y.R. Fatigue performance prediction of asphalt pavements with FlexPAVETM, the S-VECD model, and DR failure criterion. Transp. Res. Rec. 2018, 2672, 217–227. [Google Scholar] [CrossRef]
- Nemati, R.; Dave, E.V.; Sias, J.E.; Thibodeau, E.S.; Worsman, R.K. Evaluation of laboratory performance and structural contribution of cold recycled versus hot mixed intermediate and base course asphalt layers in New Hampshire. Transp. Res. Rec. 2019, 2673, 467–476. [Google Scholar] [CrossRef]
- Zhang, R.; Sias, J.E.; Dave, E.V.; Rahbar-Rastegar, R. Impact of aging on the viscoelastic properties and cracking behavior of asphalt mixtures. Transp. Res. Rec. 2019, 2673, 406–415. [Google Scholar] [CrossRef]
- Wang, Y.D.; Underwood, B.S.; Kim, Y.R. Development of a fatigue index parameter, Sapp, for asphalt mixes using viscoelastic continuum damage theory. Int. J. Pavement Eng. 2020, 23, 438–452. [Google Scholar] [CrossRef]
- Cheng, H.; Sun, L.; Wang, Y.; Chen, X. Analysis of fatigue behaviors of asphalt mixture under actual loading waveforms using pseudo-strain-based approaches. Int. J. Pavement Eng. 2022, 1–14. [Google Scholar] [CrossRef]
- Zhang, R.; Sias, J.E.; Dave, E.V. Development of new performance indices to evaluate the fatigue properties of asphalt binders with ageing. Road Mater. Pavement Des. 2020, 23, 1–20. [Google Scholar] [CrossRef]
- Christensen, R.M. Theory of Viscoelasticity: An Introduction, 2nd ed.; Academic Press: Livermore, CA, USA, 1982. [Google Scholar]
- Chang, K.N.G.; Meegoda, J.N. Micromechanical simulation of hot mix asphalt. J. Eng. Mech. 1997, 123, 495–503. [Google Scholar] [CrossRef]
- Park, S.W.; Kim, Y.R. Fitting Prony-series viscoelastic models with power-law presmoothing. J. Mater. Civ. Eng. 2001, 13, 26–32. [Google Scholar] [CrossRef]
- AASHTO TP62; Standard Method of Test for Determining Dynamic Modulus of Hot-Mix Asphalt (HMA). American Association of State and Highway Transportation Officials: Washington, DC, USA, 2007.
- Ng, A.K.Y. Evaluation of the Fatigue Damage Behavior of Fine Aggregate Matrices Prepared with Modified Asphalt Binders. Ph.D. Thesis, University of São Paulo, Sao Paulo, Brazil, 2017. [Google Scholar]
- Klug, A.B.; Ng, A.K.Y.; Faxina, A.L.; Bhasin, A. Evaluation of the fatigue performance of fine aggregate matrices prepared with reclaimed asphalt pavements and shale oil residue. In Proceedings of the Transportation Research Board 97th Annual Meeting, Whashington, DC, USA, 7–18 January 2018. [Google Scholar]
- Kim, Y.R.; Daniel, J.S. Development of a Mechanistic Fatigue Prediction Model for Aging Asphalt-Aggregate Mixtures; Final Report; Western Research Institute: Laramie, WY, USA, 1997. [Google Scholar]
- Daniel, J.S.; Kim, Y.R. Development of a simplified fatigue test and analysis procedure using a viscoelastic, continuum damage model (with discussion). J. Assoc. Asph. Paving Technol. 2002, 71, 619–650. [Google Scholar]
- Lundström, R.; Isacsson, U. Characterization of asphalt concrete deterioration using monotonic and cyclic tests. Int. J. Pavement Eng. 2003, 4, 143–153. [Google Scholar] [CrossRef]
- Keshavarzi, B.; Kim, Y.R. A viscoelastic-based model for predicting the strength of asphalt concrete in direct tension. Constr. Build. Mater. 2016, 122, 721–727. [Google Scholar] [CrossRef]
- Chehab, G.R.; Kim, Y.R.; Schapery, R.A.; Witczak, M.W.; Bonaquist, R. Time-temperature superposition principle for asphalt concrete with growing damage in tension state. J. Assoc. Asph. Paving Technol. 2002, 71, 559–593. [Google Scholar]
- Schwartz, C.W.; Gibson, N.; Schapery, R.A. Time-temperature superposition for asphalt concrete at large compressive strains. Transp. Res. Rec. 2002, 1789, 101–112. [Google Scholar] [CrossRef]
- Zhao, Y.; Richard Kim, Y. Time–temperature superposition for asphalt mixtures with growing damage and permanent deformation in compression. Transp. Res. Rec. 2003, 1832, 161–172. [Google Scholar] [CrossRef]
- Underwood, B.S.; Kim, Y.R.; Guddati, M.; Pellinen, T.; Rongzong, W.; King, G.; Gibson, N. Characterization and performance prediction of ALF mixtures using a viscoelastoplastic continuum damage model. In Proceedings of the Technical Sessions, Association of Asphalt Paving Technologists 2006 Annual Meeting, Savannah, GA, USA, 27–29 March 2006; pp. 577–636. [Google Scholar]
- AASHTO, T. 107; Determining the Damage Characteristic Curve of Asphalt Concrete from Direct Tension Cyclic Fatigue Tests. American Association of State and Highway Transportation Officials: Washington, DC, USA, 2014.
- Lee, S.; Mun, S.; Kim, Y.R. Fatigue and rutting performance of lime-modified hot-mix asphalt mixtures. Constr. Build. Mater. 2011, 25, 4202–4209. [Google Scholar] [CrossRef]
- Underwood, B.S.; Yun, T.; Kim, Y.R. Experimental investigations of the viscoelastic and damage behaviors of hot-mix asphalt in compression. J. Mater. Civ. Eng. 2011, 23, 459–466. [Google Scholar] [CrossRef]
- Mbarki, R.; Kutay, M.E.; Gibson, N.; Abbas, A.R. Comparison between fatigue performance of horizontal cores from different asphalt pavement depths and laboratory specimens. Road Mater. Pavement Des. 2012, 13, 422–432. [Google Scholar] [CrossRef]
- Ahmed, A. Evaluation of Cracking Potential of Superpave Mixtures with High Reclaimed Asphalt Pavement Content. Ph.D. Thesis, Kansas State University, Kansas City, MO, USA, 2015. [Google Scholar]
- Lee, J.S.; Gibson, N.; Kim, Y.R. Use of mechanistic models to Investigate fatigue performance of asphalt mixtures: Effects of asphalt mix design targets and compaction. Transp. Res. Rec. 2015, 2507, 108–119. [Google Scholar] [CrossRef]
- Sabahfar, N.; Ahmed, A.; Aziz, S.R.; Hossain, M. Cracking resistance evaluation of mixtures with high percentages of reclaimed asphalt pavement. J. Mater. Civ. Eng. 2017, 29, 06016022. [Google Scholar] [CrossRef]
- Cao, W.; Mohammad, L.N.; Elseifi, M. Assessing the effects of RAP, RAS, and warm-mix technologies on fatigue performance of asphalt mixtures and pavements using viscoelastic continuum damage approach. Road Mater. Pavement Des. 2017, 18 (Suppl. 4), 353–371. [Google Scholar] [CrossRef]
- Baek, C.; Lee, S. Laboratory performance evaluation of HMA modified with various types and contents of polymer. Adv. Civ. Eng. 2018, 1–15. [Google Scholar] [CrossRef]
- Zhu, Y.; Wang, X.; Qiao, Y.; Shu, J. Thermal cracking and fatigue analysis of recycled asphalt mixture using DCT test and S-VECD model. In Proceedings of the GeoShanghai International Conference, Shanghai, China, 27–30 May 2018; Springer: Singapore; pp. 483–492. [Google Scholar]
- Hasan, M.M.; Hasan, M.A.; Tarefder, R.A. Evaluation of fatigue performance of coarse and fine graded asphalt concrete mix employing viscoelastic continuum damage (VECD) model. In Airfield and Highway Pavements 2019: Testing and Characterization of Pavement Materials; American Society of Civil Engineers: Reston, VA, USA, 2019; pp. 216–226. [Google Scholar]
- Kim, Y.R.; Baek, C.; Underwood, B.S.; Subramanian, V.; Guddati, M.N.; Lee, K. Application of viscoelastic continuum damage model based finite element analysis to predict the fatigue performance of asphalt pavements. KSCE J. Civ. Eng. 2008, 12, 109–120. [Google Scholar] [CrossRef]
- de Mello, L.G.R.; de Farias, M.M.; Kaloush, K.E. Using damage theory to analyse fatigue of asphalt mixtures on flexural tests. Int. J. Pavement Res. Technol. 2018, 11, 617–626. [Google Scholar] [CrossRef]
- Haddadi, F.; Ameri, M.; Mirabimoghadam, M.H.; Hosseini, H.R.A. Validation of a simplified method in viscoelastic continuum damage (VECD) model developed for flexural mode of loading. Constr. Build. Mater. 2015, 95, 892–897. [Google Scholar] [CrossRef]
- Zhang, C.; Ren, Q.; Qian, Z.; Wang, X. Evaluating the effects of high RAP content and rejuvenating agents on fatigue performance of fine aggregate matrix through DMA flexural bending test. Materials 2019, 12, 1508. [Google Scholar] [CrossRef] [PubMed] [Green Version]
- Caro, S.; Masad, E.; Airey, G.; Bhasin, A.; Little, D. Probabilistic analysis of fracture in asphalt mixtures caused by moisture damage. Transp. Res. Rec. 2008, 2057, 28–36. [Google Scholar] [CrossRef]
- Motamed, A.; Bhasin, A.; Izadi, A. Fracture Properties and Fatigue Cracking Resistance of Asphalt Binders; SWUTC/12/161122-1; University of Texas: Austin, TX, USA, 2012. [Google Scholar]
- Coutinho, R.P. Utilização da Parte Fina de Misturas Asfálticas Para Avaliação do Dano por Fadiga. Master’s Thesis, Federal University of Ceará, Fortaleza, Brazil, 2012. [Google Scholar]
- Im, S.; You, T.; Ban, H.; Kim, Y.R. Multiscale testing-analysis of asphaltic materials considering viscoelastic and viscoplastic deformation. Int. J. Pavement Eng. 2017, 18, 783–797. [Google Scholar] [CrossRef]
- Nabizadeh, H. Viscoelastic, Fatigue Damage, and Permanent Deformation Characterization of High RAP Bituminous Mixtures Using Fine Aggregate Matrix (FAM). Master’s Thesis, University of Nebraska-Lincoln, Lincoln, NE, USA, 2015. [Google Scholar]
- Haghshenas, H.; Nabizadeh, H.; Kim, Y.R.; Santosh, K. Research on High-Rap Asphalt Mixtures with Rejuvenators and WMA Additives; Report No SPR-P1(15) M016; Nebraska Department of Transportation Research Reports: Lincoln, NE, USA, 2016. [Google Scholar]
- Airey, G.; Collop, A.; Zoorob, S.; Elliott, R.C. Moisture damage assessment of asphalt mixtures using UK saturation aging tensile stiffness test. In Proceedings of the Transportation Research Board 86th Annual Meeting, Washington, DC, USA, 21–25 January 2007; Transportation Research Board: Washington, DC, USA, 2007. [Google Scholar]
- Underwood, B.S.; Kim, Y.R. Experimental investigation into the multiscale behaviour of asphalt concrete. Int. J. Pavement Eng. 2011, 12, 357–370. [Google Scholar] [CrossRef]
- Karki, P.; Bhasin, A.; Underwood, B.S. Fatigue performance prediction of asphalt composites subjected to cyclic loading with intermittent rest periods. Transp. Res. Rec. 2016, 2576, 72–82. [Google Scholar] [CrossRef]
- Freire, R.A.; Babadopulos, L.F.A.L.; Castelo Branco, V.T.F.; Bhasin, A. Aggregate maximum nominal sizes’ influence on fatigue damage performance using different scales. J. Mater. Civ. Engneering 2017, 29, 04017067. [Google Scholar] [CrossRef]
- Johnson, C.M. Estimating Asphalt Binder Fatigue Resistance Using an Accelerated Test Method. Ph.D. Thesis, University of Wisconsin, Madison, WI, USA, 2010. [Google Scholar]
- Freire, R.A. Evaluation of the Coarse Aggregate Influence in the Fatigue Damage Using Fine Aggregate Matrices with Different Maximum Nominal Sizes. Master’s Thesis, Federal University of Ceará, Fortaleza, Brazil, 2015. [Google Scholar]
- Freire, R.A.; Coutinho, R.P.; Castelo Branco, V.T.F. Uso do S-VECD Para Construção de Curvas Características de dano de Misturas Asfálticas Finas USando Ensaios de Varredura Linear de Amplitudes de Deformação; XXIX ANPET: Ouro Preto, Brazil, 2015. [Google Scholar]
- Cravo, M.C.C. Efeitos do Envelhecimento Térmico e Fotoquímico em Ligantes Asfálticos, Mástique e Matriz de Agregados Finos. Ph.D. Thesis, Federal University of Rio de Janeiro, Rio de Janeiro, Brazil, 2016. [Google Scholar]
- Cravo, M.C.C.; Correia e Silva, C.F.S.; Leite, L.F.M.; Motta, L.M.G. Estudo do Envelhecimento Térmico e Fotoquímico em Matriz de Agregados Finos (MAF); 45th RAPv: Brasilia, Brazil, 2016. [Google Scholar]
- Jiao, L.; Elkashef, M.; Jones, D.; Harvey, J.T. Evaluating fatigue performance of fine aggregate matrix mixes with reclaimed asphalt pavement and rejuvenating agents. Road Mater. Pavement Des. 2020, 23, 1–16. [Google Scholar] [CrossRef]
- Jiao, L.; Elkashef, M.; Harvey, J.T.; Rahman, M.A.; Jones, D. Investigation of fatigue performance of asphalt mixtures and FAM mixes with high recycled asphalt material contents. Constr. Build. Mater. 2022, 314, 125607. [Google Scholar] [CrossRef]
- Nabizadeh, H.; Haghshenas, H.F.; Kim, Y.R.; Aragão, F.T.S. Effects of rejuvenators on high-RAP mixtures based on laboratory tests of asphalt concrete (AC) mixtures and fine aggregate matrix (FAM) mixtures. Constr. Build. Mater. 2017, 152, 65–73. [Google Scholar] [CrossRef]
- Li, R.; Karki, P.; Hao, P. Fatigue and self-healing characterization of asphalt composites containing rock asphalts. Constr. Build. Mater. 2020, 230, 116835. [Google Scholar] [CrossRef]
- Sadeq, M.; Al-Khalid, H.; Masad, E.; Sirin, O. Comparative evaluation of fatigue resistance of warm fine aggregate asphalt mixtures. Constr. Build. Mater. 2016, 109, 8–16. [Google Scholar] [CrossRef]
- Sadek, H.; Masad, E.; Al-Khalid, H.; Sirin, O. Probabilistic analysis of fatigue life for asphalt mixtures using the viscoelastic continuum damage approach. Constr. Build. Mater. 2016, 126, 227–244. [Google Scholar] [CrossRef]
- Sharma, H.; Swamy, A.K. Development of probabilistic fatigue curve for asphalt concrete based on viscoelastic continuum damage mechanics. Int. J. Pavement Res. Technol. 2016, 9, 270–279. [Google Scholar] [CrossRef] [Green Version]
- Sadek, H.; Sadeq, M.; Masad, E.; Al-Khalid, H.; Sirin, O. Probabilistic viscoelastic continuum damage analysis of fatigue life of warm-mix asphalt. J. Transp. Eng. Part B Pavements 2019, 145, 04019024. [Google Scholar] [CrossRef]
- Arrambide, J.; Duriez, M. Liants Routiers et Enrobés: Matériaux de Protection, Plâtre, Agglomérés, Bois. In Les Manuels de l’Ingenieur et du Technicien de Batiment et de Travaux Publics; Dunod: Paris, France, 1959. [Google Scholar]
- Nascimento, L.A.H.; Rocha, S.M.N.; Nascimento, C.E.H.; Kim, Y.R.; Chacur, M.; Martins, A.T. Uso da mecânica do dano contínuo na caracterização de misturas asfálticas brasileiras. In 21 Encontro de Asfalto; Instituto Brasileiro do Petróleo: Rio de Janeiro, Brazil, 2014. [Google Scholar]


| Fingerprint Test | FAM1 Sample 1 | ||
|---|---|---|---|
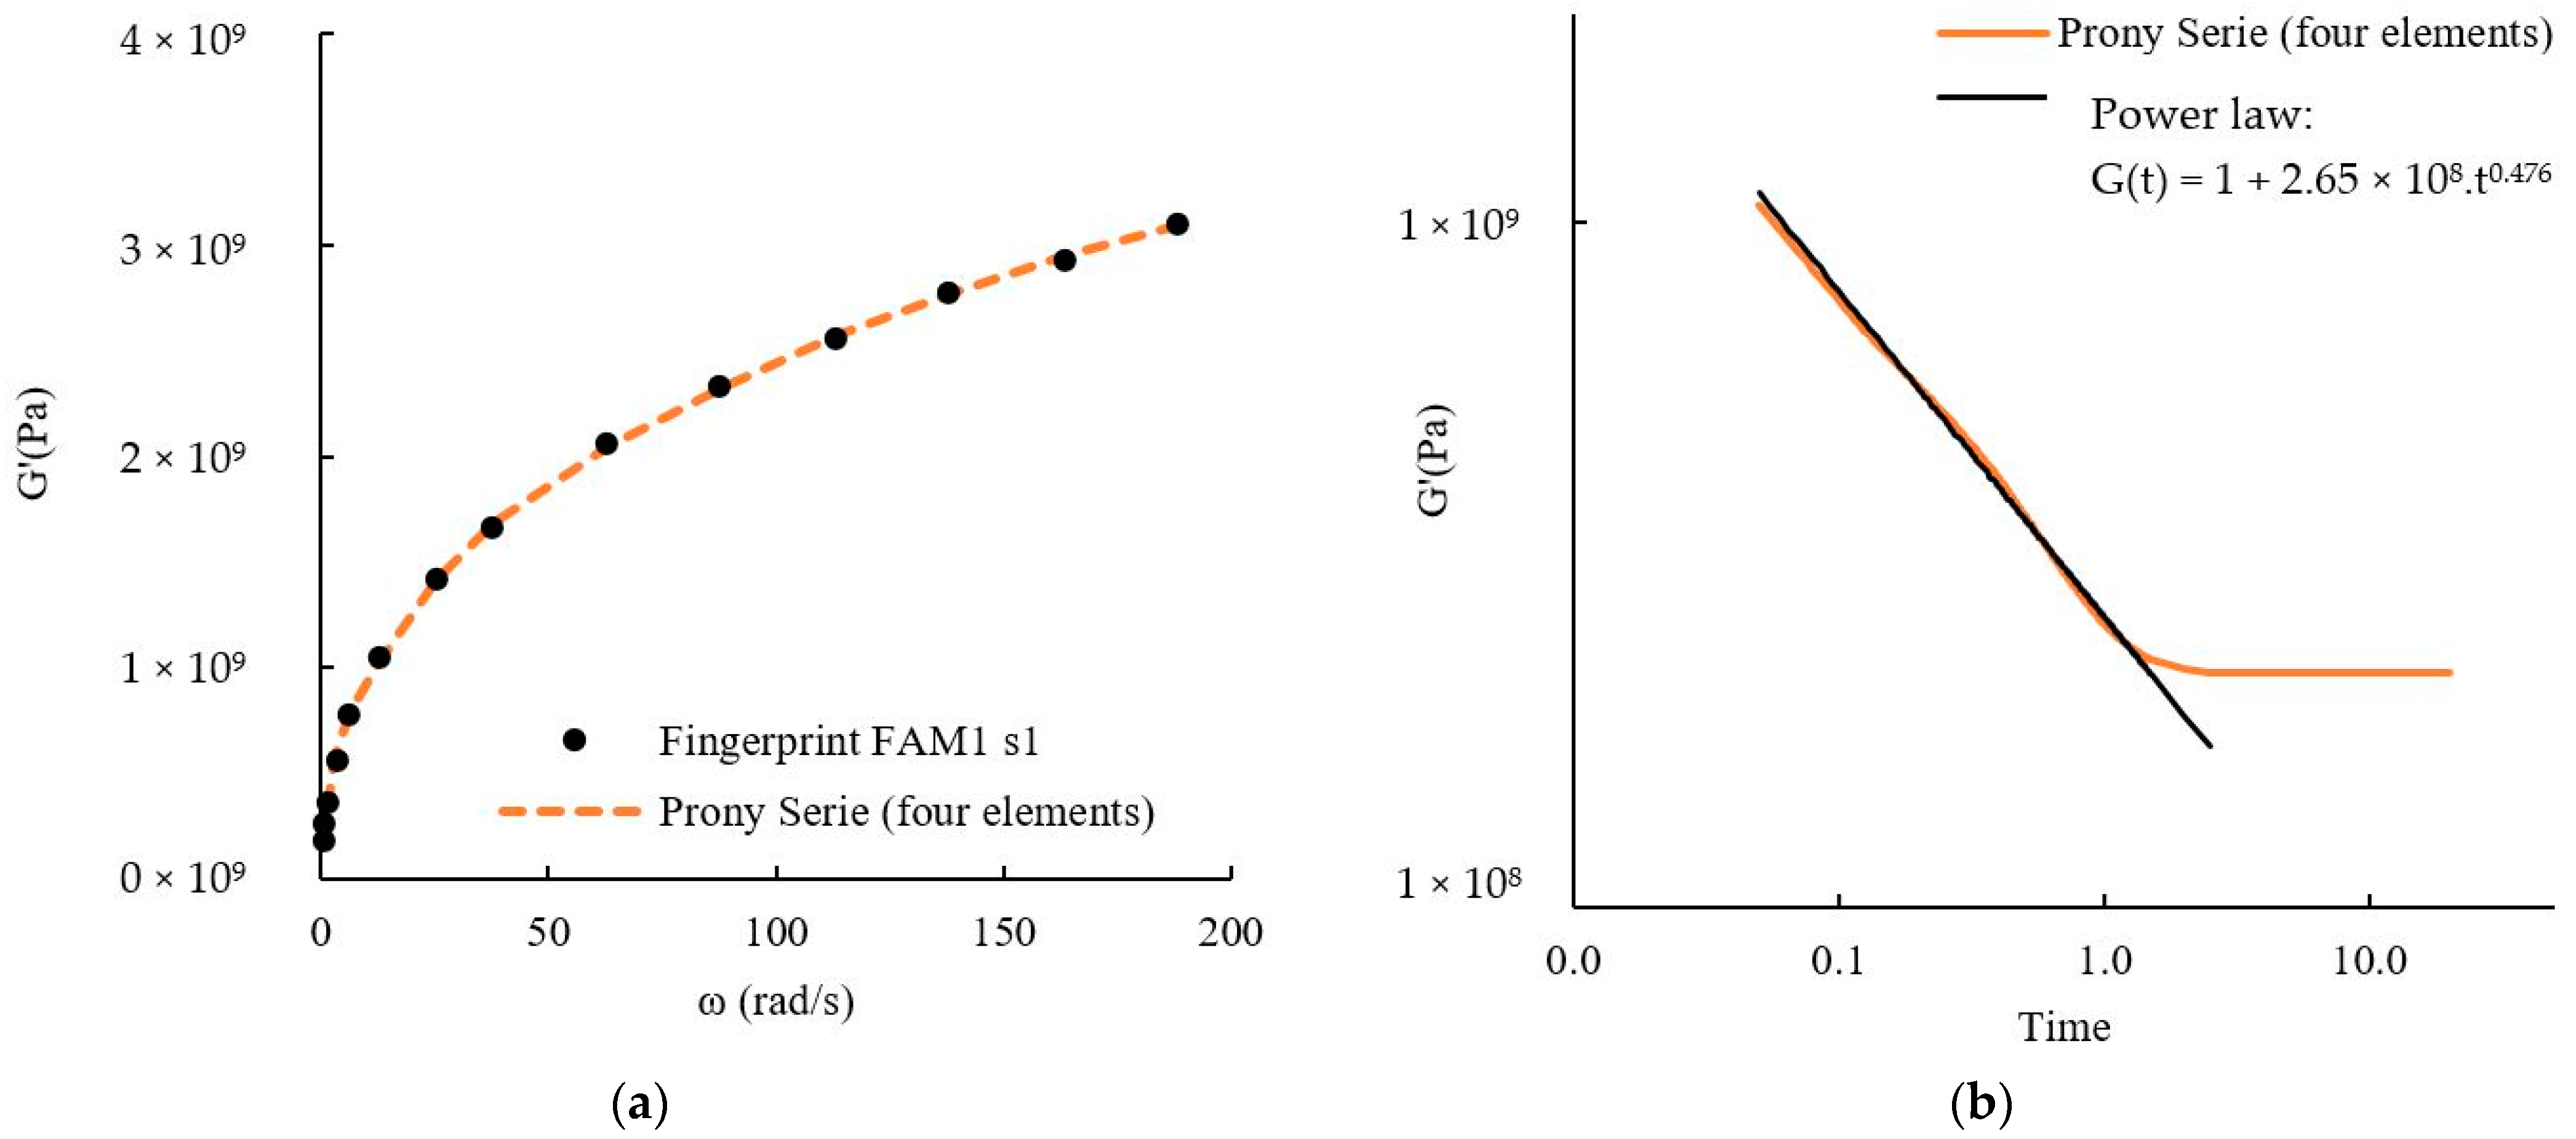
| 1. Data obtained from the fingerprint | Dynamic shear modulus within the linear-viscoelastic region (|G*LVE|), relaxation rate (m) (Figure 3a,b) | - | |G*|LVE = 9.93 × 10⁸ m = 0.476 |
| 2. Prony series fitted to the storage modulus values to obtain , ρi, and . | Equation (56) | , ρi, and are calculated by using Solver | |
| 3. Laplace transform to convert data from frequency to time domain | Equation (58) | values obtained by using the parameter of the Prony series | |
| 4. Model adjusted to data to obtain the material parameter, m | G(t) = G0+G1t−m (Figure 3b) | Equation (59) | G0 = 1 G1 = 2.65 × 10⁸ m = 0.476 |
| 5. Equation to obtain the material parameter, α | α = (1 + 1/m) for strain-controlled tests α = 1/m for stress-controlled tests | Equation (30) Equation (31) | α = 2.10 |
| Damage Test | FAM1 sample 1 k = 5 | ||
| 1. Data obtained from the damage tests | Complex modulus (|G*|), phase angle (φ), and strain (ε), at each cycle k | - | |G*|k = 1 = 7.87 × 10⁸ |G*|k = 5 = 6.91 × 10⁸ φ k = 5 = 49.5 ε k = 5 = 0.051% |
| 2. Peak pseudo strain during each cycle k, | Equation (45) | 5 | |
| 3. Pseudo stress, σR | σR = σ | Elastic-viscoelastic correspondence principle | σR = 350 kPa |
| 4. Initial pseudo stiffness, I | Dynamic shear modulus at the first cycle | ||
| 5. Normalized pseudo stiffness at each cycle k, C | Equation (47) | ||
| 6. Damage parameter, S | Equation (48) | ||
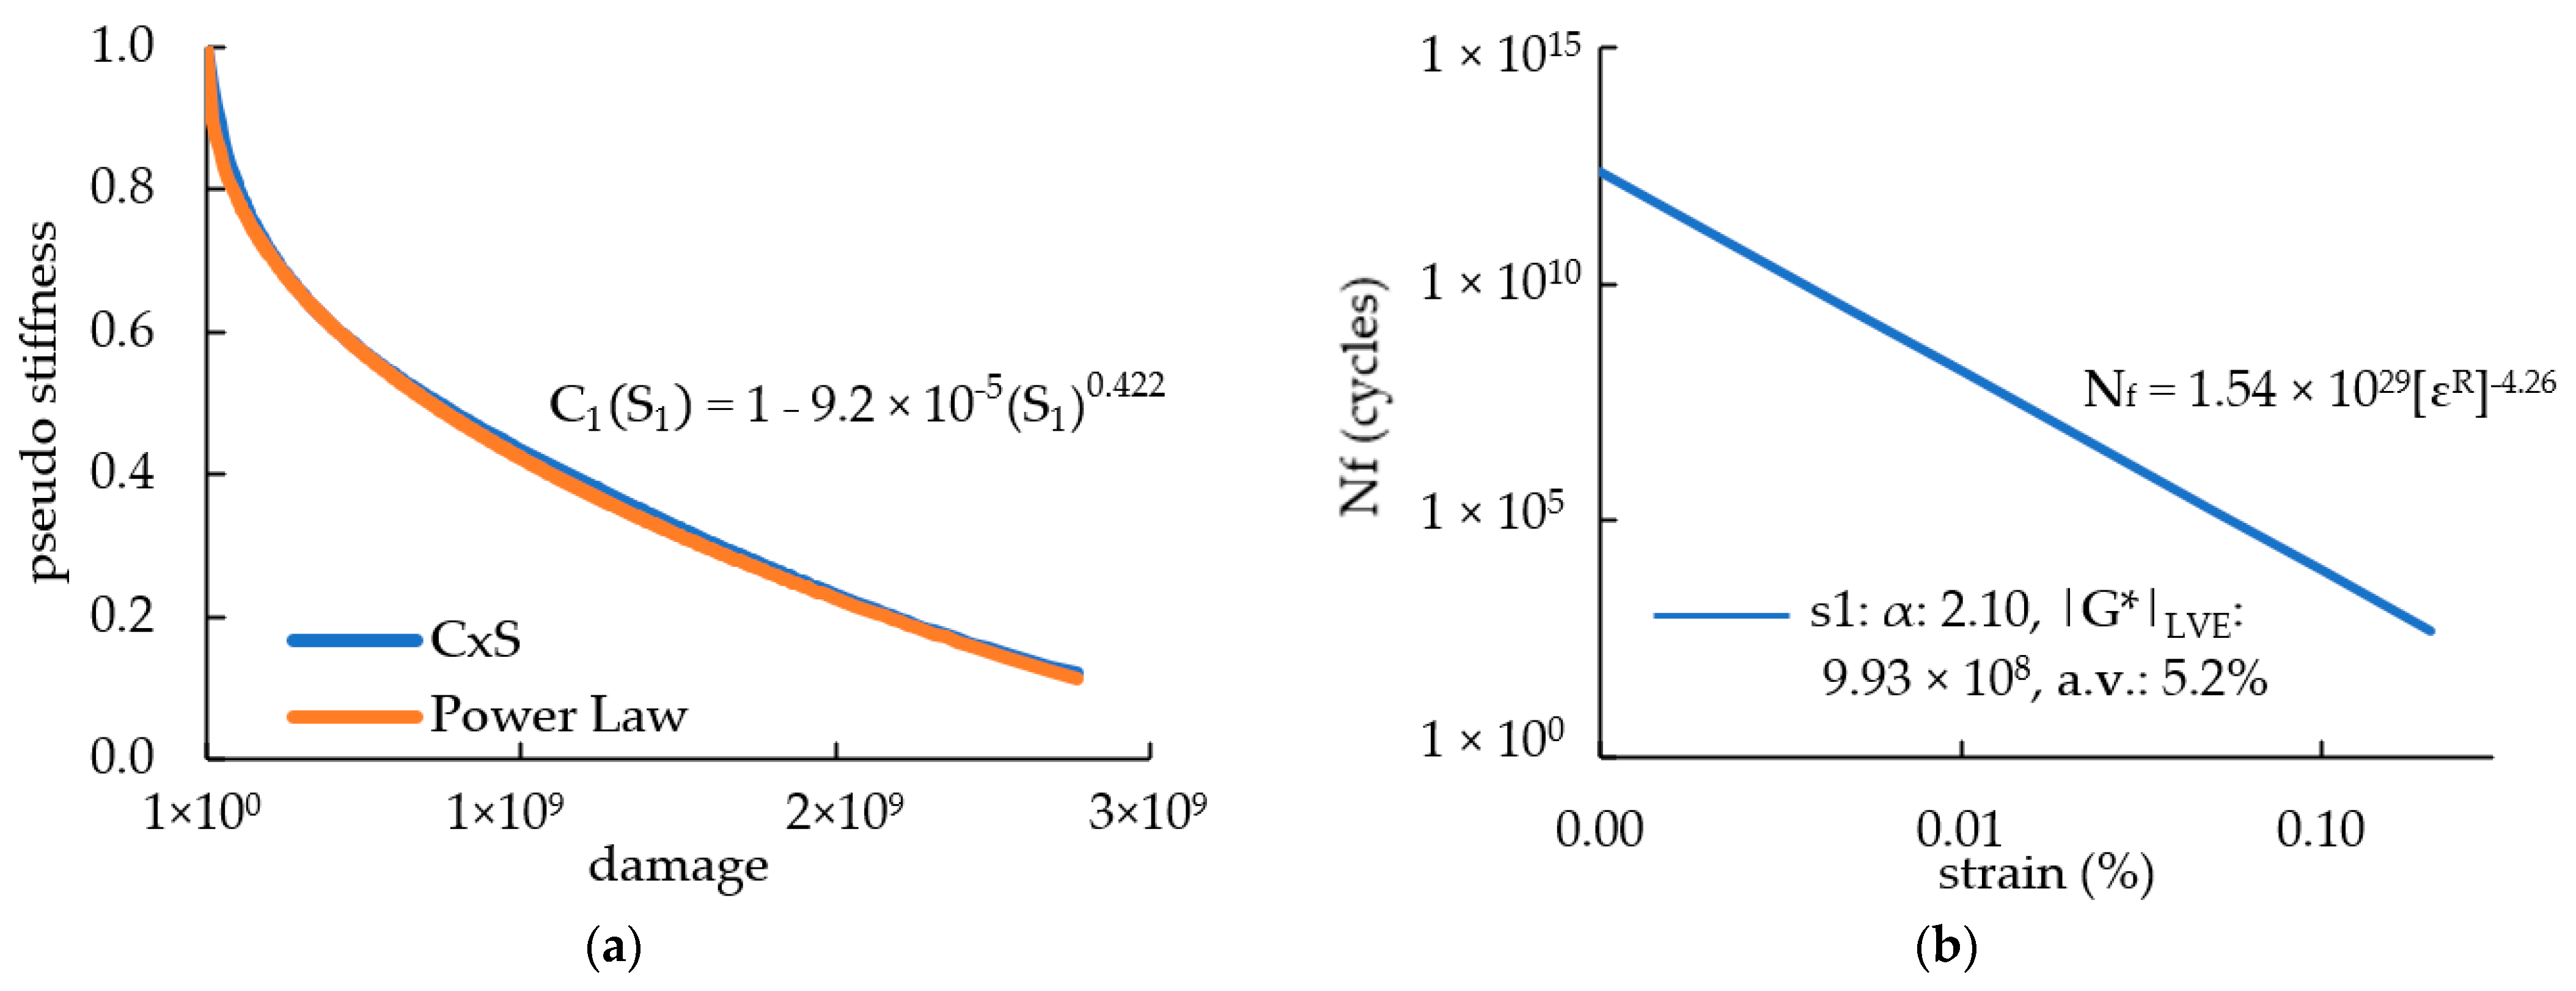
| 7. Characteristic curve, CxS | The characteristic curves, CxS, are obtained by cross-plotting the C values against the S values at each cycle k | Figure 4a | C5 = 0.88 vs. S5 = 4.71 × 10⁷ at cycle k = 5 |
| Fatigue Life Prediction Model | |||
|---|---|---|---|
| 1. Power law fitted to the CxS curve to obtain C10, C11, and C12 | Equation (40) | Figure 4a | |
| 2. Calculation of the parameter A | Equation (49) | A = 7.35 × 1029 | |
| 3. Calculation of the parameter B | B = 2α | Equation (50) | B = 4.35 |
| 4. Prediction fatigue life curve | Nf = A[εR]−B | Equation (51) | Figure 4b |
| 5. Nf (strain = 0.005%) | Nf(0.005%) = 7.35 × 1029 [4.46 × 10⁴]−4.35 | Equation (51) | 4.59 × 10⁹ |
| 6. Nf (strain = 0.2%) | Nf(0.2%) = 7.35 × 1029 [1.78 × 10⁶]−4.35 | Equation (51) | 500.25 |
| Basalt Rock | |||
|---|---|---|---|
| Quarry identification | Bandeirantes | ||
| Specific gravity of coarse aggregates (g/cm³) | 2.904 | AASHTO T 85 | |
| Specific gravity of fine aggregates (g/cm³) | 2.999 | AASHTO T 84 | |
| Specific gravity of filler (g/cm³) | 2.769 | ASTM D7928 | |
| Absorption (%) | 0.6 | ASTM C128 | |
| RAP Material | |||
| Quarry location | São Carlos/SP | ||
| Maximum specific gravity (g/cm³) | 2.596 | AASHTO T209 | |
| Asphalt Binders | |||
| Performance grade (PG) | PG 58-16 | PG 64-22 | ASTM D6373 |
| Specific gravity (g/dm³) | 1.015 | 1.004 | ASTM D70 |
| Continuous grade—virgin (°C) | 61.07 | 66.84 | ASTM D7175 |
| Continuous grade—short-term aged (°C) | 65.52 | 66.94 | ASTM D7175 |
| Continuous grade—long-term aged (S [60]1) | −20.7 | −26.9 | ASTM D6648 |
| Continuous grade—long-term aged (m [60]2) | −20.2 | −27.4 | ASTM D6648 |
| Material | Sample | Air Voids | Linear-Viscoelastic Properties | CxS Parameters | ||||||
|---|---|---|---|---|---|---|---|---|---|---|
| m | M (av) | cv (%) | |G*|LVE (kPa) | |G*|LVE (av) (kPa) | cv (%) | Shape Factor | DR | |||
| FAM1 | s1 | 5.15 | 0.476 | 0.461 | 3.2 | 9.93 × 10⁸ | 8.92 × 10⁸ | 11.3 | 1.05 | 0.382 |
| s2 | 5.28 | 0.490 | 6.2 | 7.53 × 10⁸ | −15.6 | 0.92 | 0.373 | |||
| s3 | 4.96 | 0.422 | −8.6 | 9.46 × 10⁸ | 6.1 | 0.97 | 0.350 | |||
| s4 | 4.99 | 0.467 | 1.2 | 8.82 × 10⁸ | −1.1 | 0.94 | 0.345 | |||
| s5 | 4.99 | 0.452 | −2.0 | 8.85 × 10⁸ | −0.8 | 1.08 | 0.394 | |||
| FAM2 | s1 | 5.19 | 0.342 | 0.375 | −8.7 | 1.57 × 10⁹ | 1.70 × 10⁹ | −7.6 | 0.8 | - |
| s2 | 5.05 | 0.386 | 2.9 | 1.61 × 10⁹ | −5.3 | 0.99 | 0.332 | |||
| s3 | 5.09 | 0.380 | 1.3 | 1.96 × 10⁸ | 15.3 | 1.03 | 0.332 | |||
| s4 | 5.05 | 0.392 | 4.5 | 1.66 × 10⁹ | −2.4 | 0.98 | 0.325 | |||
| FAM3 | s1 | 5.16 | 0.463 | 0.460 | 0.7 | 5.04 × 10⁸ | 5.95 × 10⁸ | −15.3 | 1.04 | 0.395 |
| s2 | 4.67 | 0.465 | 1.1 | 5.90 × 10⁸ | −0.8 | 0.96 | 0.415 | |||
| s3 | 5.47 | 0.448 | −2.5 | 6.61 × 10⁸ | 11.1 | 0.99 | 0.406 | |||
| s4 | 5.09 | 0.463 | 0.7 | 6.24 × 10⁸ | 4.9 | 0.91 | 0.360 | |||
| FAM4 | s1 | 4.57 | 0.398 | 0.406 | −1.8 | 1.54 × 10⁹ | 1.57 × 10⁹ | −2.1 | 1.03 | 0.455 |
| s2 | 4.68 | 0.402 | −1.0 | 1.63 × 10⁹ | 3.6 | 1.00 | 0.448 | |||
| s3 | 4.89 | 0.417 | 2.7 | 1.55 × 10⁹ | −1.5 | 0.97 | 0.423 | |||
| FAM | A | B | Nf (0.005%) | Rank Order | Nf (0.20%) | Rank Order | FFFAM | Rank Order |
|---|---|---|---|---|---|---|---|---|
| FAM1 | 7.35 × 1029 | 4.35 | 4.59 × 10⁹ | 4 | 500.25 | 2 | 2.32 | 3 |
| FAM2 | 2.68 × 1036 | 5.35 | 1.17 × 10¹⁰ | 3 | 31.80 | 4 | 2.30 | 4 |
| FAM3 | 5.25 × 1029 | 4.35 | 1.77 × 10¹⁰ | 1 | 1885.85 | 1 | 2.49 | 1 |
| FAM4 | 2.16 × 1034 | 4.93 | 1.52 × 10¹⁰ | 2 | 189.63 | 3 | 2.39 | 2 |
Publisher’s Note: MDPI stays neutral with regard to jurisdictional claims in published maps and institutional affiliations. |
© 2022 by the authors. Licensee MDPI, Basel, Switzerland. This article is an open access article distributed under the terms and conditions of the Creative Commons Attribution (CC BY) license (https://creativecommons.org/licenses/by/4.0/).
Share and Cite
Klug, A.; Ng, A.; Faxina, A. Application of the Viscoelastic Continuum Damage Theory to Study the Fatigue Performance of Asphalt Mixtures—A Literature Review. Sustainability 2022, 14, 4973. https://doi.org/10.3390/su14094973
Klug A, Ng A, Faxina A. Application of the Viscoelastic Continuum Damage Theory to Study the Fatigue Performance of Asphalt Mixtures—A Literature Review. Sustainability. 2022; 14(9):4973. https://doi.org/10.3390/su14094973
Chicago/Turabian StyleKlug, Andrise, Andressa Ng, and Adalberto Faxina. 2022. "Application of the Viscoelastic Continuum Damage Theory to Study the Fatigue Performance of Asphalt Mixtures—A Literature Review" Sustainability 14, no. 9: 4973. https://doi.org/10.3390/su14094973