Article

Evaluation of the Economic Performance of Coastal Trawling off the Southern Coast of Sicily (Central Mediterranean Sea)

1
Geological and Environmental Sciences (BIGEA)-Marine Biology and Fisheries Laboratory of Fano (PU), Department of Biological, University of Bologna, 40126 Bologna, Italy
2
Institute for Marine Biological Resources and Biotechnologies (IRBIM), National Research Council-CNR, 91026 Mazara del Vallo, Italy
3
Laboratory of Experimental Ecology and Aquaculture, Department of Biology, University of Rome Tor Vergata, 00133 Roma, Italy
*
Author to whom correspondence should be addressed.
Sustainability 2022, 14(8), 4743; https://doi.org/10.3390/su14084743
Submission received: 24 January 2022 / Revised: 28 March 2022 / Accepted: 8 April 2022 / Published: 15 April 2022

Abstract

:
The economic performances of four trawling fleets (those of the Sicilian cities of Trapani, Sciacca, Licata and Porto Palo di Capo Passero) operating in the coastal waters along the southern coast of Sicily (geographical Subarea 16), and potentially affected by the establishment of the Fisheries Restricted Areas (FRAs), were analysed. The main economic performance results (revenues, costs and profits) of 37 trawlers were calculated prior to the implementation of FRAs and compared with those estimated by the spatial bio-economic model SMART after the FRAs’ establishment. Results showed that the fleets of Sciacca and Licata, located in the central part of the southern Sicilian coast, had a short-term reduction of profits as a result of the implementation of the FRAs; conversely, a short-term increase in the economic performances of Trapani and Porto Palo di Capo Passero fleets was expected. Although the FRAs represent a good tool for rebuilding overexploited stocks, the different socio-economic impacts of the single fleets should be assessed before adopting them and the implementation of specific compensative measures should be planned for the impacted fleet until a more productive state of the stock is reached.

1. Introduction

Fisheries play a key role in providing food, income and employment in many parts of the world [1]. In particular, marine capture fisheries have a significant role in reaching the nutritional requirements of the population, providing food security, particularly for the coastal population of developing countries, and achieving the Sustainable Development Goals (SDGs) [2].
Despite these important roles in the world food system, too often fisheries have been determined as undertaking the unsustainable exploitation of resources (the so-called overfishing) and fish stocks are in decline worldwide [3,4,5,6,7].
Within this context, the socio-economic dimensions assume a fundamental role, encompassing both the basic bio-economic aspects of fisheries and the different effects of fishery policies on stakeholders and their potential social consequences [8]. Comparative scenario analyses of different potential remedial actions examine the economic costs and benefits of stock rebuilding policies when stocks are overfished or depleted [8] and economic indicators provide powerful instruments in assessing and supporting fishery management [9,10].
The Strait of Sicily (SoS hereafter), situated in the central Mediterranean Sea, represents one of the highest productive areas for demersal fisheries of the basin [11,12,13,14,15]. In 2016, the 395 Italian bottom trawlers operating in this area landed approximately 13,300 tons with an economic value of EUR 114 million [16]. The deep-water rose shrimp (DPS, Parapenaeus longirostris–Lucas, 1846), the European hake (HKE, Merluccius merluccius–Linnaeus, 1758), and the giant red shrimp (ARS, Aristaeomorpha foliacea–Risso, 1827) represent the main demersal targeted species with a yield of about 5290, 1490 and 1370 tons, respectively, and total revenue of approximately EUR 75.6 million in 2016 [16]. According to the most recent stock assessment [17], both HKE and DPS are overfished with a high proportion of undersized catches.
To help reduce overfishing, the General Fisheries Commission for the Mediterranean (GFCM) established three Fisheries Restricted Areas (FRAs) in the SoS, corresponding to areas where juveniles of European hake and deep-water rose shrimp aggregate annually (stable nurseries), aimed at improving the exploitation pattern of both HKE and DPS [18]. In these FRAs, located close to the Sicilian coast to the east of Adventure Bank, west of Gela Basin and east of Malta Bank [19], trawling activities are prohibited. By using the spatially explicit bio-economic model SMART (Spatial MAnagement of demersal Resources for Trawl fisheries), Russo et al. [14] demonstrated that the three FRAs improved both the state of HKE and DPS stocks and the overall fishery economic performance of the whole Italian trawler fleet operating in the SoS. However, since these closures can affect different fleets according to the spatial position of their traditional fishing grounds, further studies to assess the possible negative economic effects of management measures at local level are advisable.
In the present study, the economic performances of the trawling fleet operating in the SoS were analysed in order to (i) provide more detailed information on the structure of the different Italian trawling fleets operating in the SoS, in terms of capacity indicators and (ii) apply the spatial bio-economic model SMART to estimate the different effects in terms of short economic performances on single fleets operating close to the Italian territorial waters which are assumed to be more strongly affected by the FRAs.

2. Materials and Methods
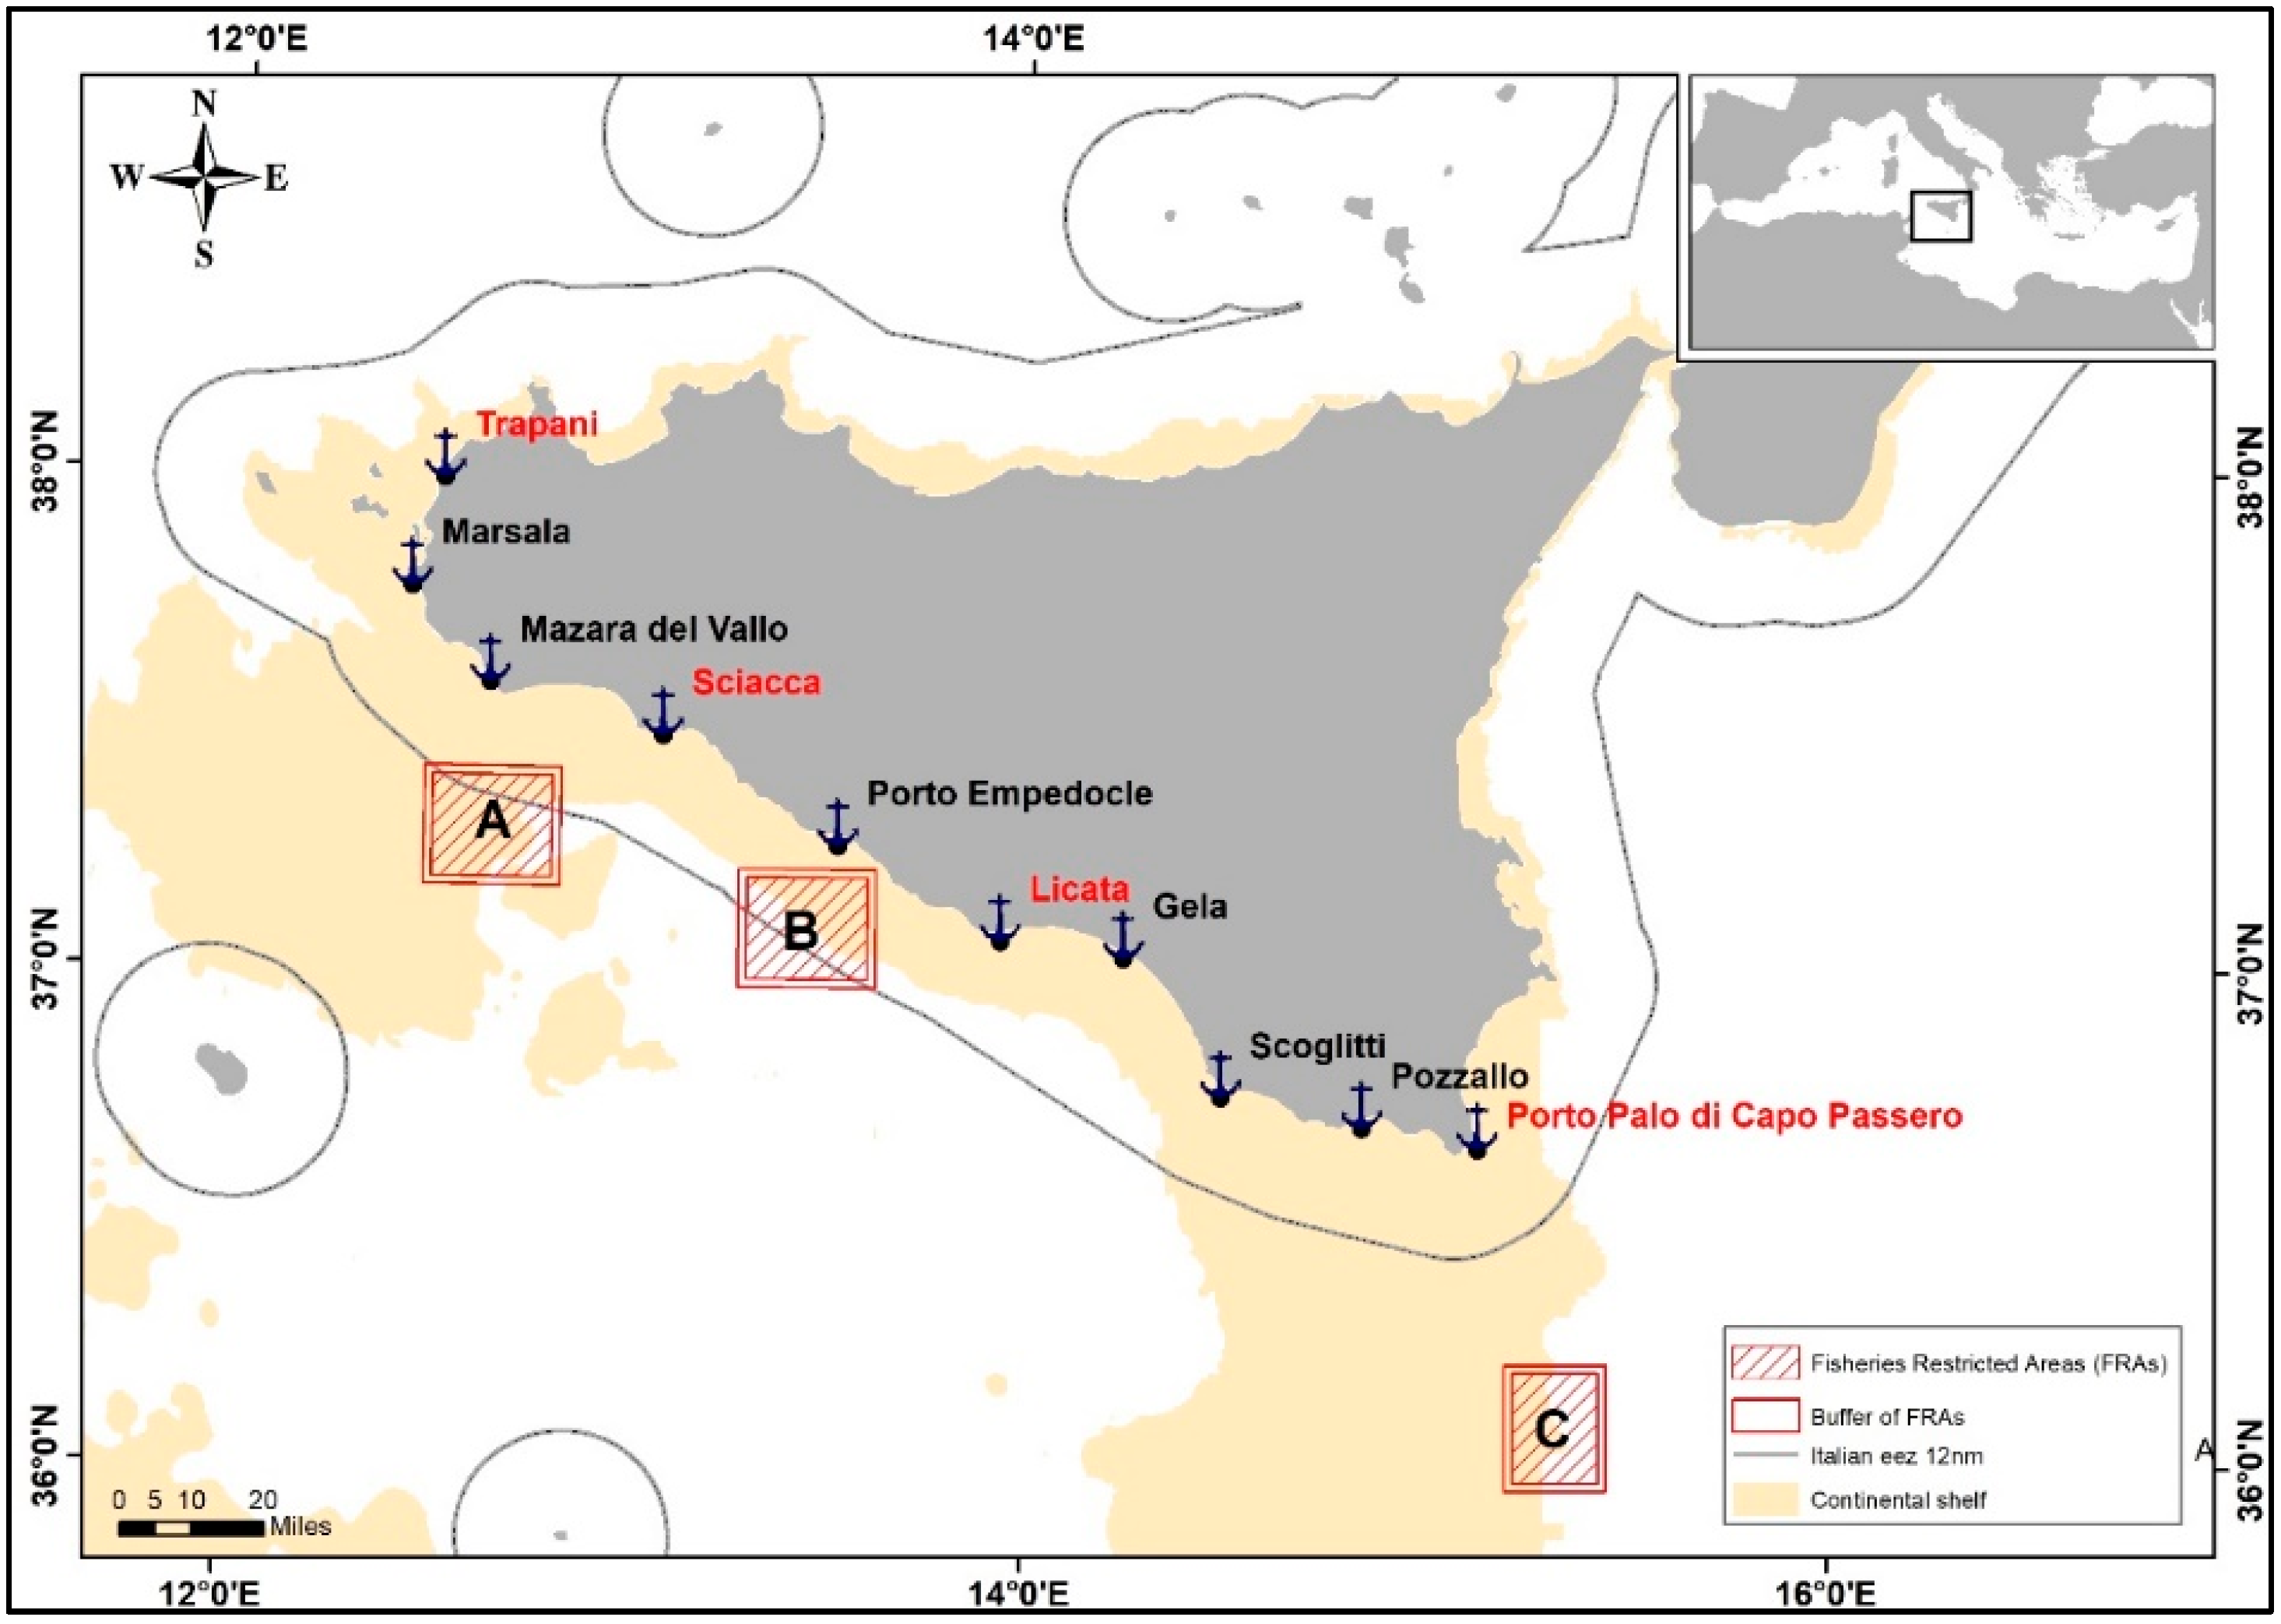
2.1. Study Area

The study area is located in the central Mediterranean Sea and comprises the Italian side of the SoS (Figure 1). According to the definition by the GFCM of geographical subareas (GSAs), this area corresponds to the GSA16 (southern Sicily) and extends for about 34,000 km2 [20]. Situated in the northern sector of the SoS, the FRAs occupy a total area of 1711 km2: 621 km2 (mean depth = 175 m; depth range = 73–720 m) for the FRA to the east of Adventure Bank, 621 km2 (mean depth = 315 m; depth range = 20–662 m) for the FRA to the west of Gela Bank and 469 km2 (mean depth = 249 m; depth range = 60–1195 m) for the FRA to the east of Malta Bank [21].
Finally, the study area is characterised by complex seafloor morphology and hydrodynamic process [22] with a wide range of water depths including two shallow banks (<100 m depth) on the western (Adventure Bank) and eastern (Malta Bank) side, respectively, separated by a narrow shelf in the middle.
The SoS constitutes an important fishing area for demersal resources and hosts several important marine fisheries (Figure 1). Among them, Mazara del Vallo is the main port for demersal fisheries; its fleet represents the main commercial fleet of trawlers in the SoS and one of the most important fleets in the Mediterranean Sea [11,23,24]. Bottom trawling is the most important fishing activity and includes three main segments: small vessel trawlers, with a length overall (LOA) between 12 and 18 m, medium vessels between 18 and 24 m and vessel trawlers larger than 24 m LOA. The first and the second segment (“domestic fleet”) operate mainly within or close to the Sicilian territorial waters (within 12 miles from the coast, fishing from 1 to 2 days); while the third one (“distant fleet”) operates some distance from the Sicilian coast both on the continental shelf and the slope down to 700–800 m depth with fishing trips lasting between 1–2 months. Every 20–30 days the catch, which is frozen on board, was landed in the closest port and then skipped to the home port in refrigerated trucks and, finally, distributed throughout Italy for consumption. According to De Angelis et al. [25], these “distant” trawlers adopt 4 different fishing strategies: (i) fishing on the African shelf and (ii) on the Sardinia shelf, both strategies being targeted at shallow waters species (mainly fish and cephalopods), (iii) wide deep water, operating from the Sardinia Channel to the coast of Libya and (iv) Eastern deep water, operating in the Aegean and in the Levant Sea, targeting deep water crustaceans.
Since the objective of the work is to evaluate the short-term expected effects of the FRAs on the fleets which are more strongly affected by the reduction of fishing grounds, we selected only the vessels with LOA comprised between 12 and 24 m, which operate almost exclusively within the territorial waters (hereafter “domestic” trawlers [25]).

2.2. Data

A set of 186 trawlers, equipped with vessel monitoring systems (VMS) and with an LOA between 12 and 24 m, representing 51% of the total trawlers based in GSA 16, was initially considered for this study. In order to identify how domestic fleets are affected by the FRAs, we decided to consider only the vessels that during the year, for at least 8 months, use the same port both as home and landing port. Thus, the initial set was reduced to a subset of 37 trawlers as shown in Table 1. The economic results of the fishing activities of these fleets were therefore interpreted according to their proximities to the adopted FRAs (Figure 1).
Landings data by vessel and species were collected within the Italian National Program under the European Data Collection Framework [26] during 2016. Price by species (EUR/kg) during 2016 year was taken from Maiorano et al. [16].

2.3. Economics Performance: Revenues, Costs and Profits

We used SMART, a spatial model to assess the state of the demersal resources and some aspects of bio-economic performance under different management scenarios [14,27,28]. In particular, this model combines multiple modeling components, integrating the best available sets of spatial data about catches and stocks, fishing footprint from VMS and economic parameters to describe the relationships between fishing effort pattern and impacts on resources and socio-economic performances. The structure of the SMART model can be summarised as follows:
(1)
Processing of landings data, combined with VMS data, to estimate the spatial/temporal productivity of each cell, in terms of aggregated landings per unit of effort (LPUE) by species, according to the method described and applied in Russo et al. [14];
(2)
Processing biological data to estimate LPUE by age and by species, for each cell/time;
(3)
Analysing VMS data to access the fishing effort by vessel/cell/time;
(4)
Combining LPUE by age with VMS data to model the landings by vessel/species/length class/time/cell;
(5)
Estimating the cost by vessel/time associated with a given effort pattern and the related revenues, as a function of the landings by vessel/species/length class/time (step 4);
(6)
Combining costs and revenues by vessel, at the early scale, to obtain the profit, which is the proxy of the vessel performance. Profit could be aggregated at the fleet level to estimate the overall performance;
(7)
Using estimated landings by species/age, together with survey data, to run a mouse model for the selected case of study in order to obtain a biological evaluation of the fisheries.
In this work, the fishing activity of each trawler before (2016) and after the FRAs adoption (2017–2019) was simulated and compared at the level of each single “domestic” fleet. Although the FRAs were implemented in 2016, they became effective only in July 2019 and, consequently, empirical data of the economic performance of the fleets/trawlers considered in this study were not available in the period examined. For this reason, we decided to use a simulation approach to compare the effects pre and post-FRAs in terms of economic performance.
To evaluate the positive or negative variation in profit of each fleet, the three “classical” indicators of economic performance by fleet were used: revenue (R), cost (C) and profit (P) [10]. According to Tietze et al. [29], R depends on species and quantities caught and prices which mainly vary according to markets and seasonal fluctuations. The main C factors are the operation costs (e.g., fuel and crew salaries) and the vessel costs (repair/maintenance of the vessel). Operation costs are principally composed of labour costs and fuel costs; other cost items include: cost of selling fish, port duties, cost of ice, food and supplies for the crew. The major components of labour cost are wages and other labour charges such as insurance and employer contributions to pension funds. Moreover, the major elements of vessel costs are vessel and gear repair and maintenance expenses and vessel insurance [30]. Finally, the economic performance in terms of P of each fleet was calculated according to a step-by-step procedure, considering the balance between costs and revenues of the vessels monitored in the fisheries.
Concerning the revenue before the FRAs’ adoption, the mean monthly revenue (Rm) of a single vessel v during the year 2016 (y) was firstly calculated as follows:
R m , v = ( s = 1 S ( q s , y × p s , y ) ) / 12
where qs,y is the number of landings (expressed in Kg) for the species s during the year y by the respective mean price at the market (ps,y) in EUR.
Secondly, the mean monthly revenue (RM) by fleet f, considering all the vessels v using the same landing port during the year y, was calculated as follows:
R M , f = ( v = 1 v R m , v ) / n
where n is the total number of vessels (v) that, in the same month, show the same landing port.
The simulated revenues (R) after the FRAs’ adoption for the vessel v during the period t were calculated as follows:
R v , t = s = 1 S l L ( q s , l , t × p s , l , t )
where qs,l,t is the number of landings for the species s and size class l during the period t by the respective price at the market (ps,l,t).
Accordingly, the simulated mean monthly revenue (RR) for fleet (f) during the period t was calculated as follows:
R R f , t = ( v = 1 v R v , t ) / n
where n is the total number of vessels (v) that, in the same month, show the same landing port.
Concerning costs, SMART distinguishes them into “spatial-based”, “effort-based” and “production-based” components. The spatial-based costs (SC) are a function of spatial locations of fishing operations being mainly related to fuel consumption and they were estimated starting from real values related to a subset of vessels. The effort-based costs (EC) regarding the number of days at sea spent by each vessel and include the labor costs (e.g., salaries) and the other expenses (repair/maintenance of the vessel) directly linked to the temporal duration of fishing activities. Finally, the production-based costs (PC) are linked to the number of landings (e.g., commercialisation costs) [14]. The EC and the PC were based on official aggregated data for the study area in the same period (source: [31]). The total costs (TC) before (2016) and after (2017–2019) the implementation of the FRAs were both simulated in the same way using the Smart model.
The spatial domain of the SMART model for the SoS was defined as a grid with 500 square cells c (15 × 15 nautical miles) and the spatial (for each cells c) and temporal (for each time t) distribution of the effort for each vessel v was reconstructed using VMS data. In particular, for the spatial-based costs, a spatial index (SI) was computed, for each vessel v and time t (month) as:
S I v , t = c = 1 C ( d v , c × E c , v , t )
where dv,c is the distance between cell c and the harbour of departure (computed as the linear distance between the center of each cell and the position of the harbour) for the vessel v and Ec,v,t is the amount of effort (in hours of fishing) deployed by vessel v in the cell c during the time period t.
The relationship for spatial-based costs is defined as:
SCv,t = α × LOAv × SIv,t
where SCv,t are the spatial-based costs (in EUR) borne by vessel v during the time period t; SIv,t is the spatial index defined above; LOAv is the length overall of the vessel v and α is the parameter to be estimated.
Instead, the effort-based costs were calculated as follows:
ECv,t = ɣ × LOAv × DSv,t
where ECv,t are the effort-based costs (in EUR) borne by vessel v during the time period t and ɣ is the parameter to be estimated.
The production-based costs were defined as:
PCv,t = μ × LVv,t
where PCv,t are the production-based costs (in EUR) by vessel v during the time period t; μ is the parameter to be estimated and LVv,t is the landing value, which is the product of landings by species and size times the respective prices.
Consequently, the mean total costs (TC) for fleet (f) during the period t were obtained as follows:
T C f , t = ( v = 1 V S C v , t + E C v , t + P C v , t ) / n
where n is the total number of vessels (v) that, in the same month, show the same landing port.
Thus, the mean monthly landings profit (Pm) for a fleet f during the period t is:
Pm,f,t = RM,fTCf,t
while the simulated mean monthly profit (PSm) for a fleet f during the period t is:
PSm,f,t = RRf,tTCf,t

3. Results

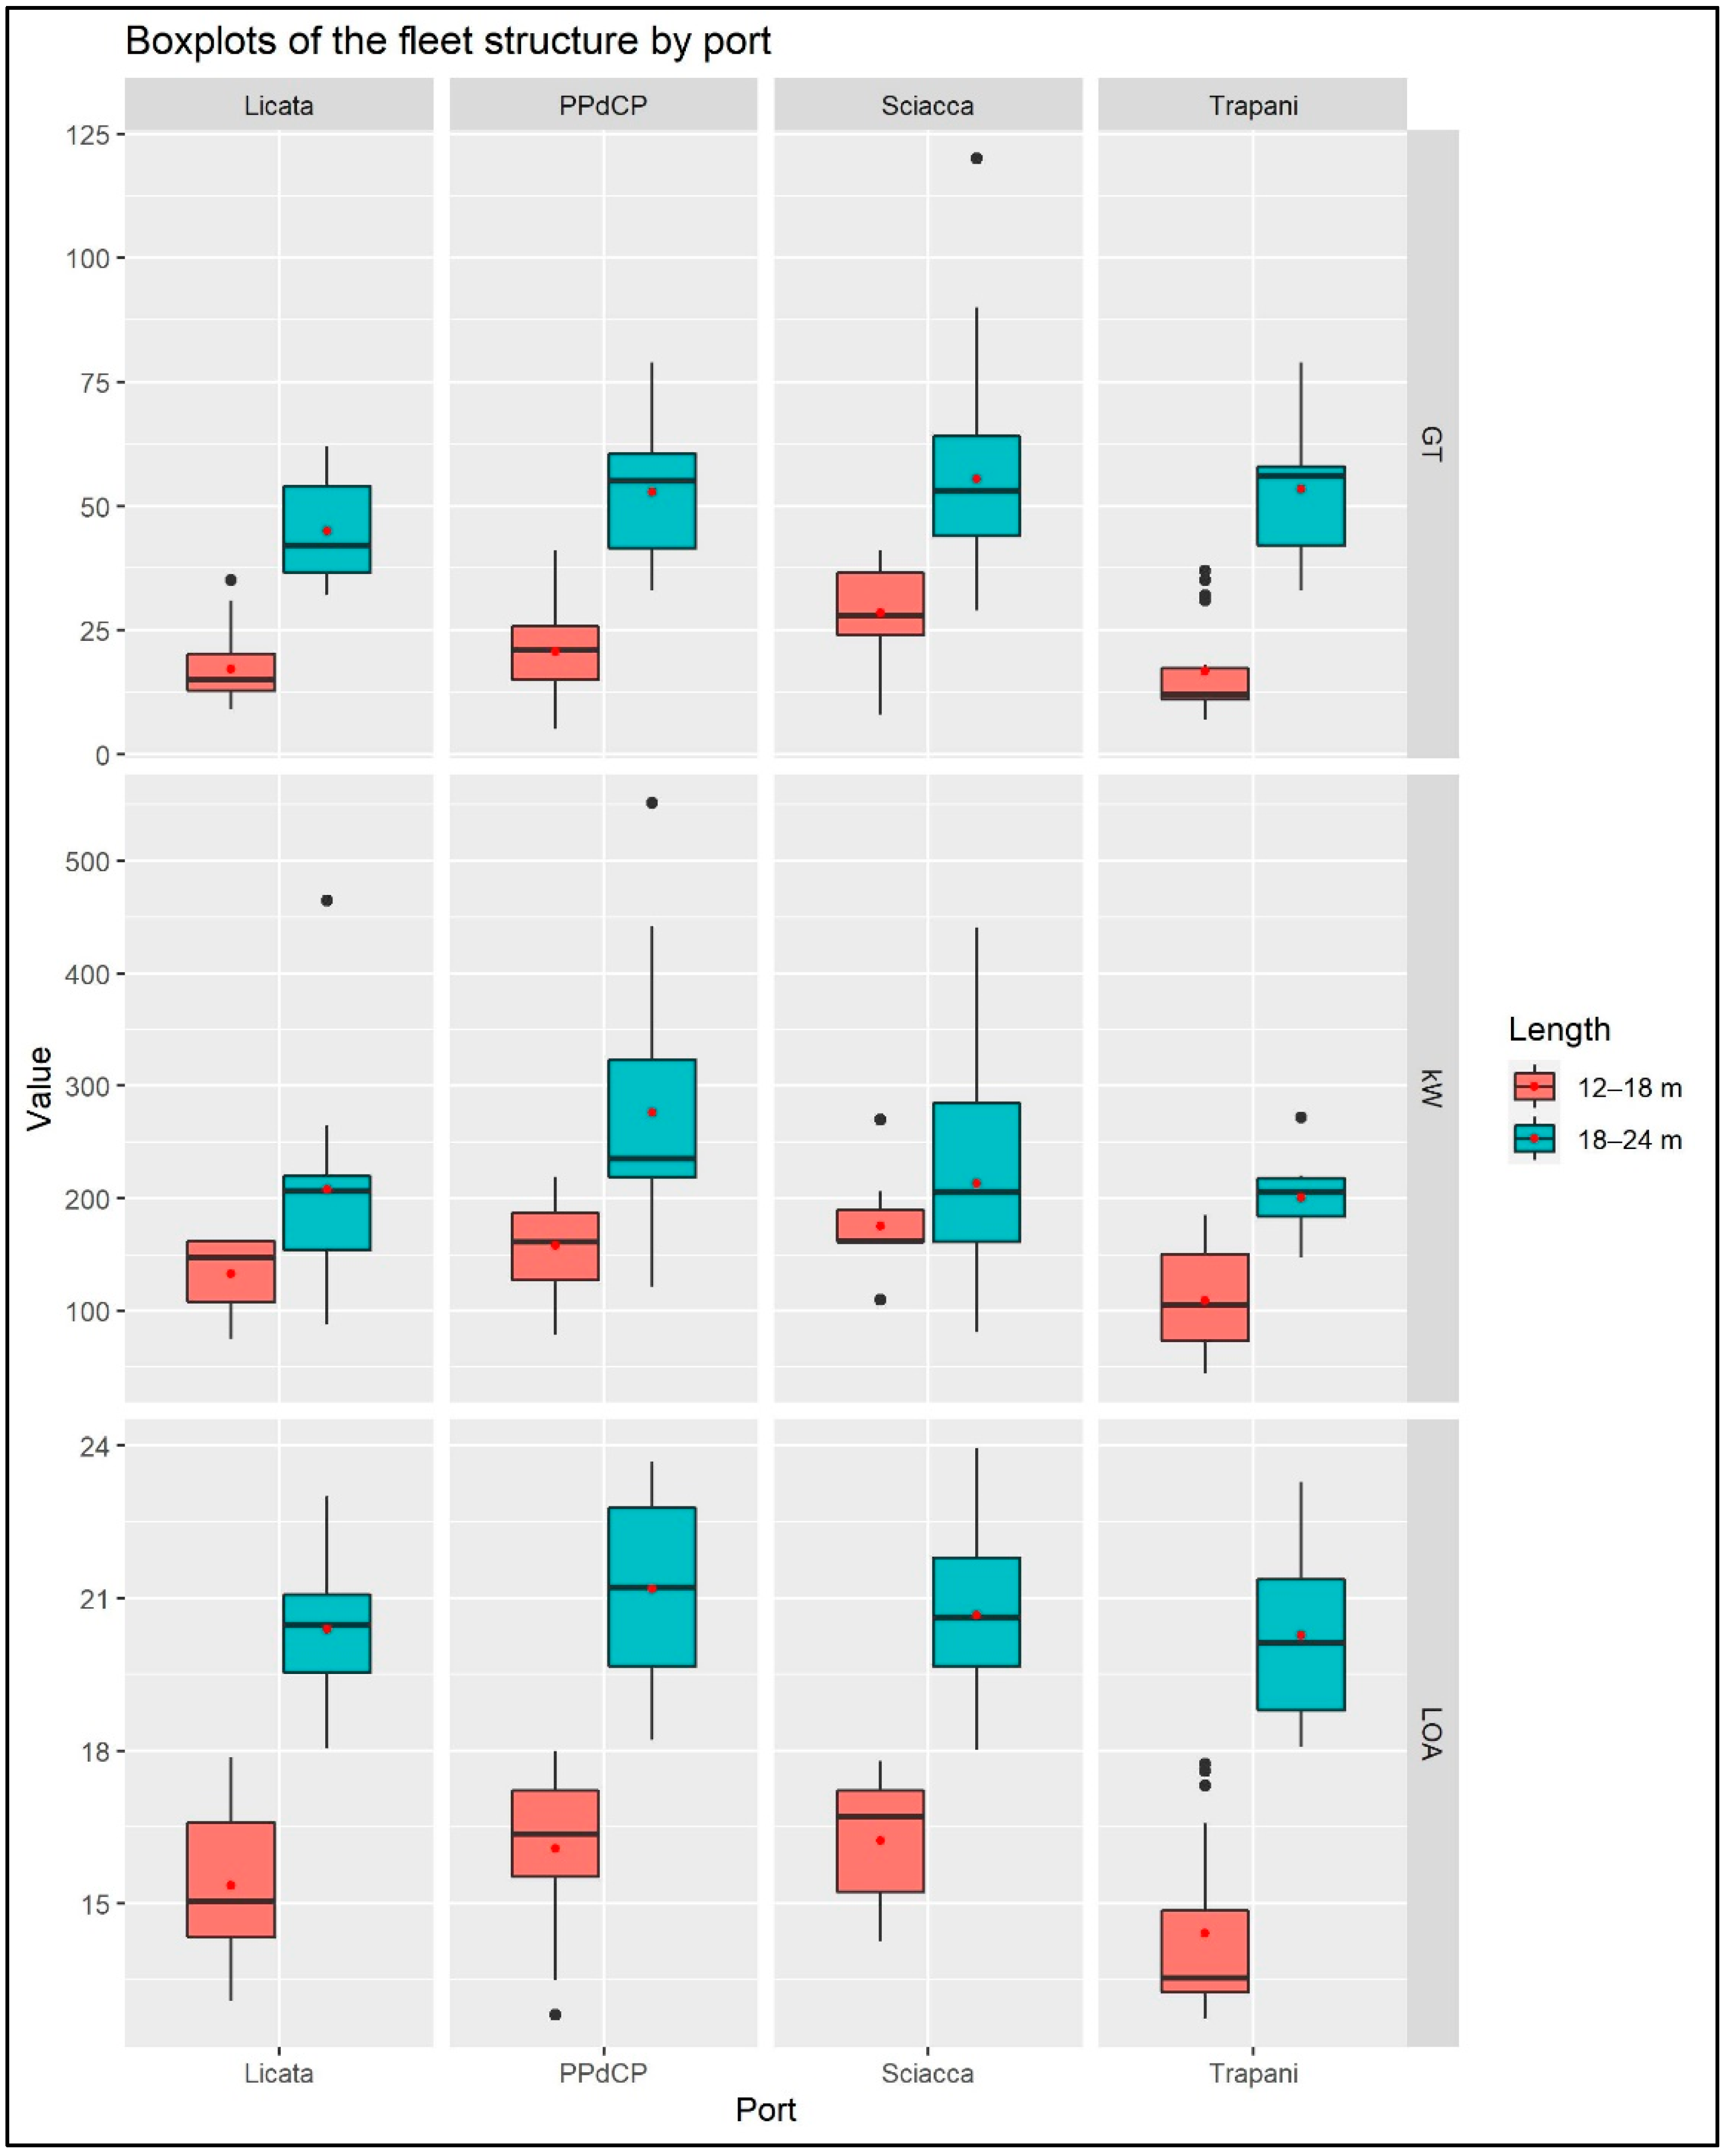
3.1. Structure and Fleet Capacity of the Marine Fisheries in the SoS

In 2016, according to the EU Community Fishing Fleet Register [32], 186 trawlers with LOA between 12 and 24 m were registered and operated in the investigated area with a total gross tonnage (GT) of about 7000 tons and engine power (kW) of about 35,000 kilowatts. Overall, vessel trawlers with LOA between 18 and 24 m are the most abundant (111 trawling vessels corresponding to 59.7% of the total). Sciacca constituted the fleet with the greatest number of vessels (78 vessels corresponding to 41.9% of the total), followed by Porto Palo di Capo Passero and Licata fleets with 40 (21.5%) and 39 vessels (21%), respectively. Trapani fleet showed the lowest number with 29 vessels (equivalent to 15.6% of the total) (Table 2).
No differences were evident in the capacity indicators between the fleets, with the exception of Trapani’s vessels in the segment 12–18 m which showed LOA, GT and kW lesser than the other fleets (Figure 2).

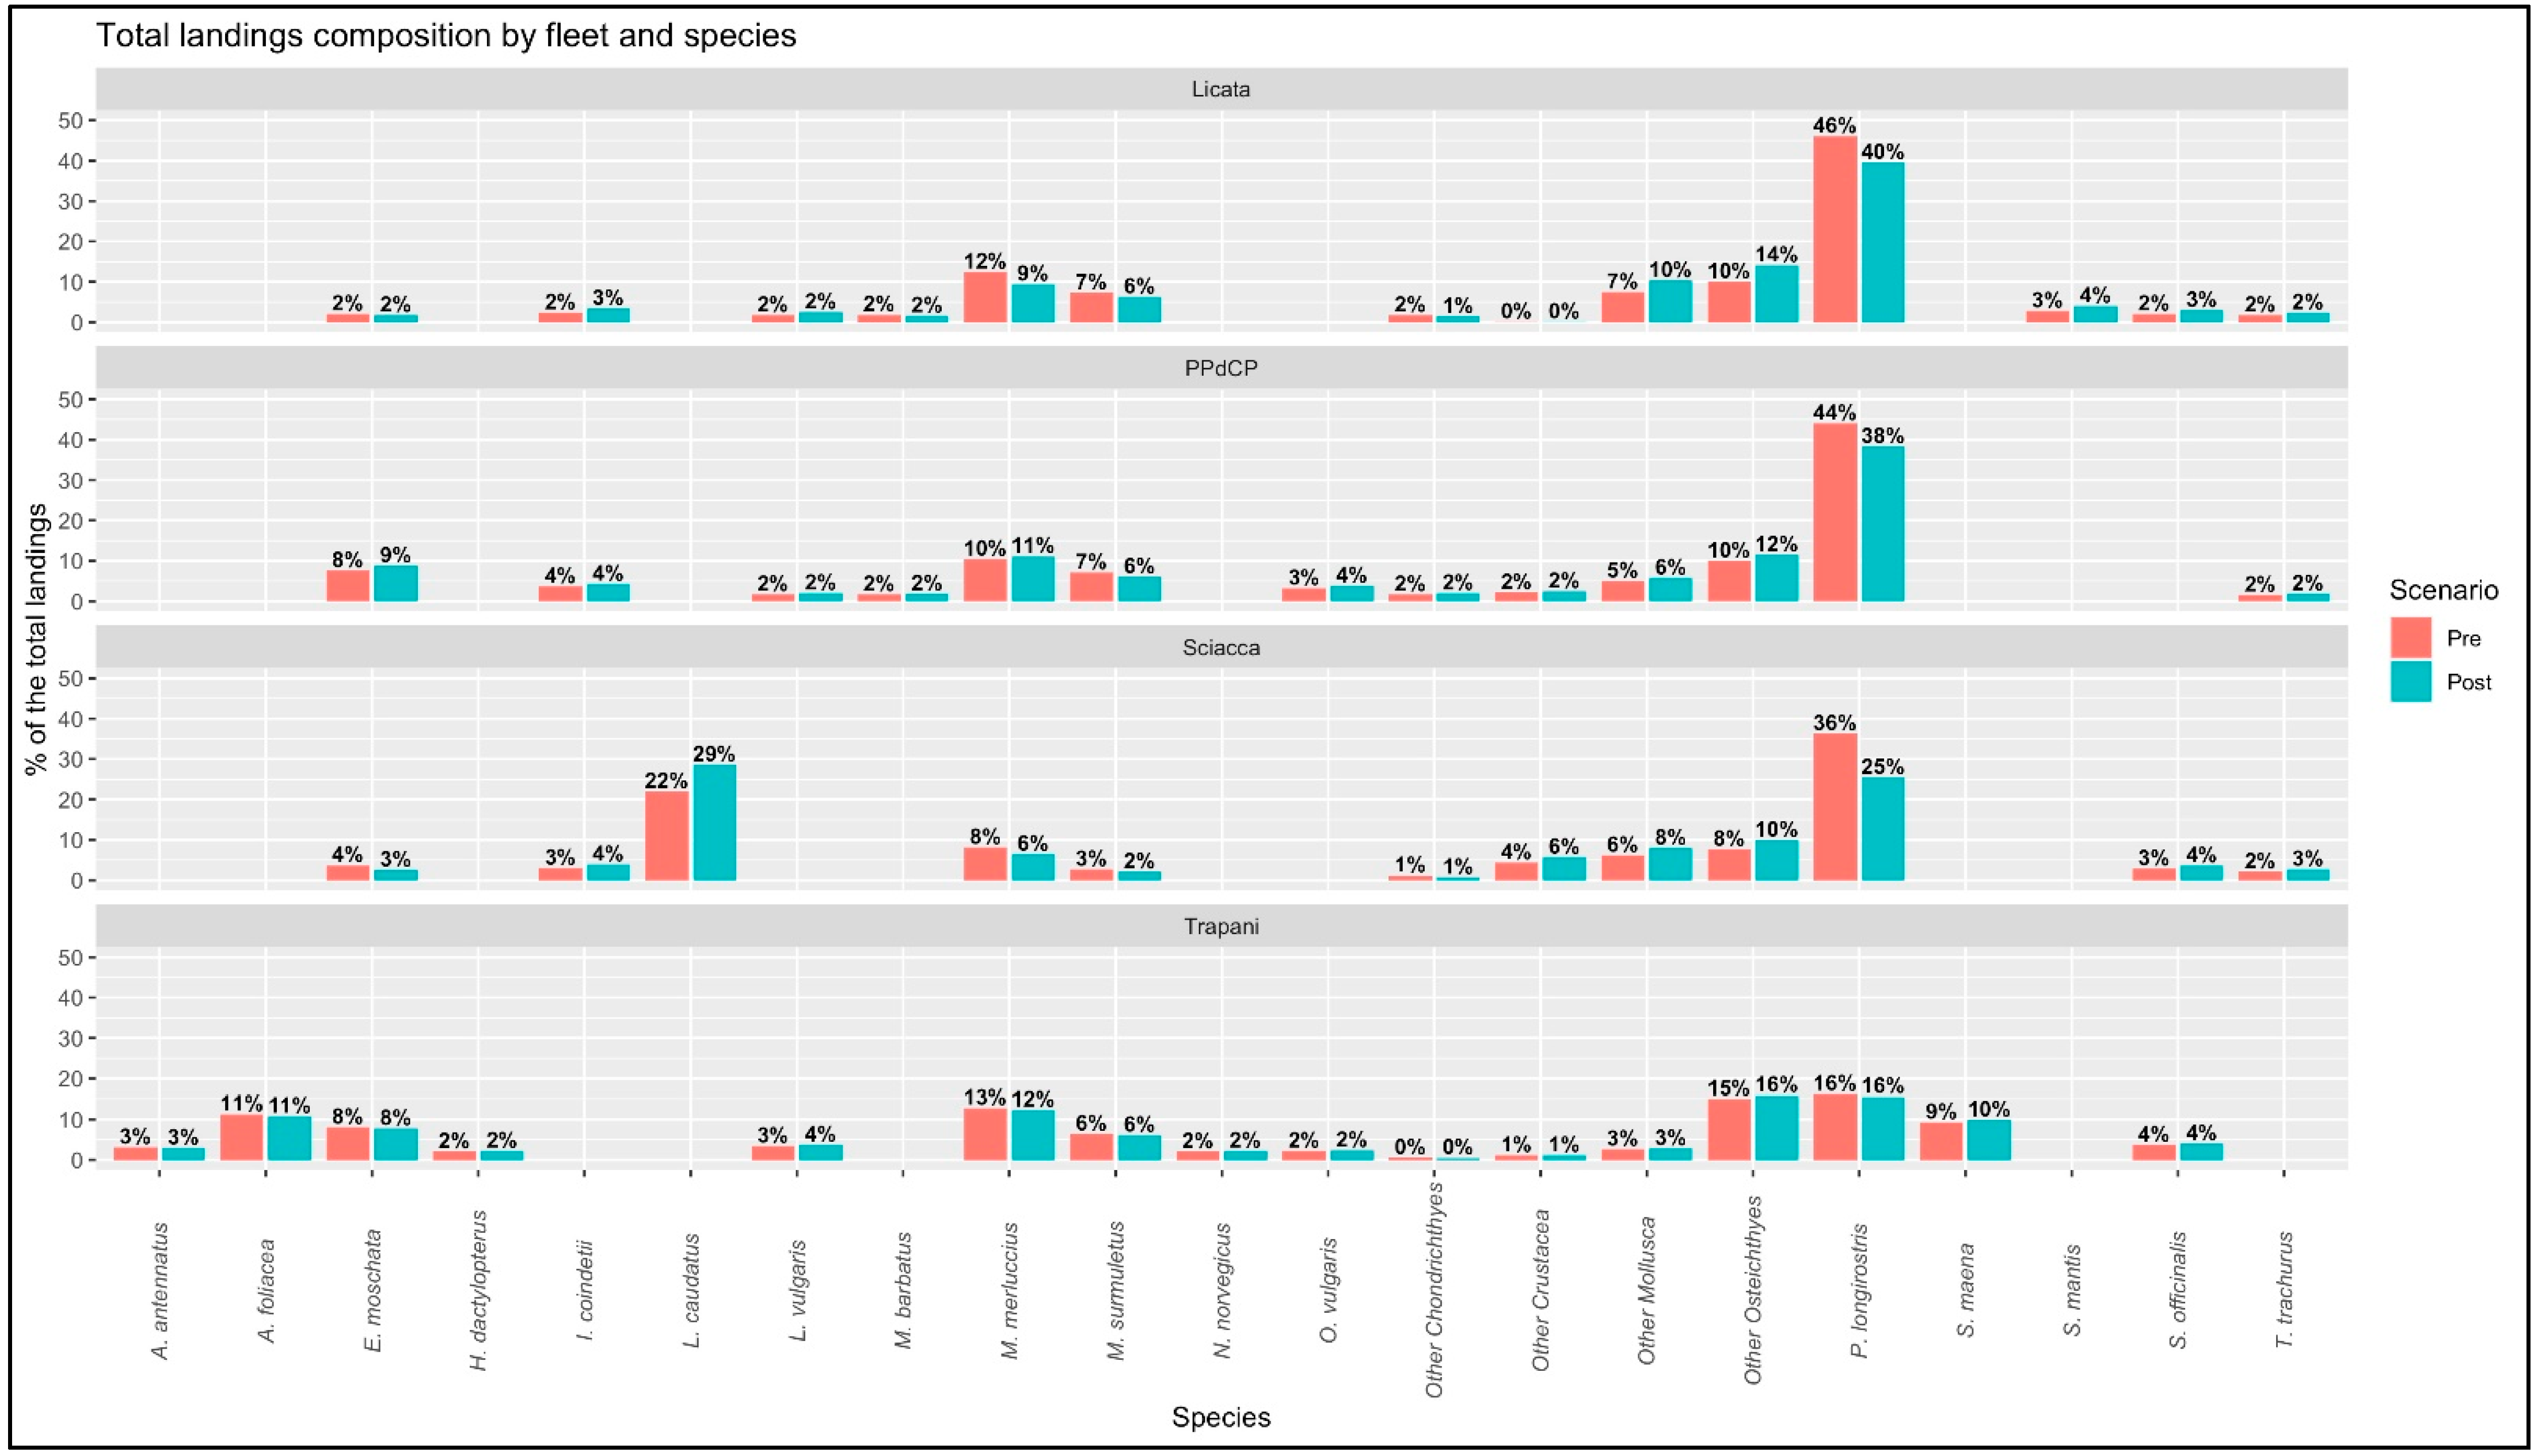
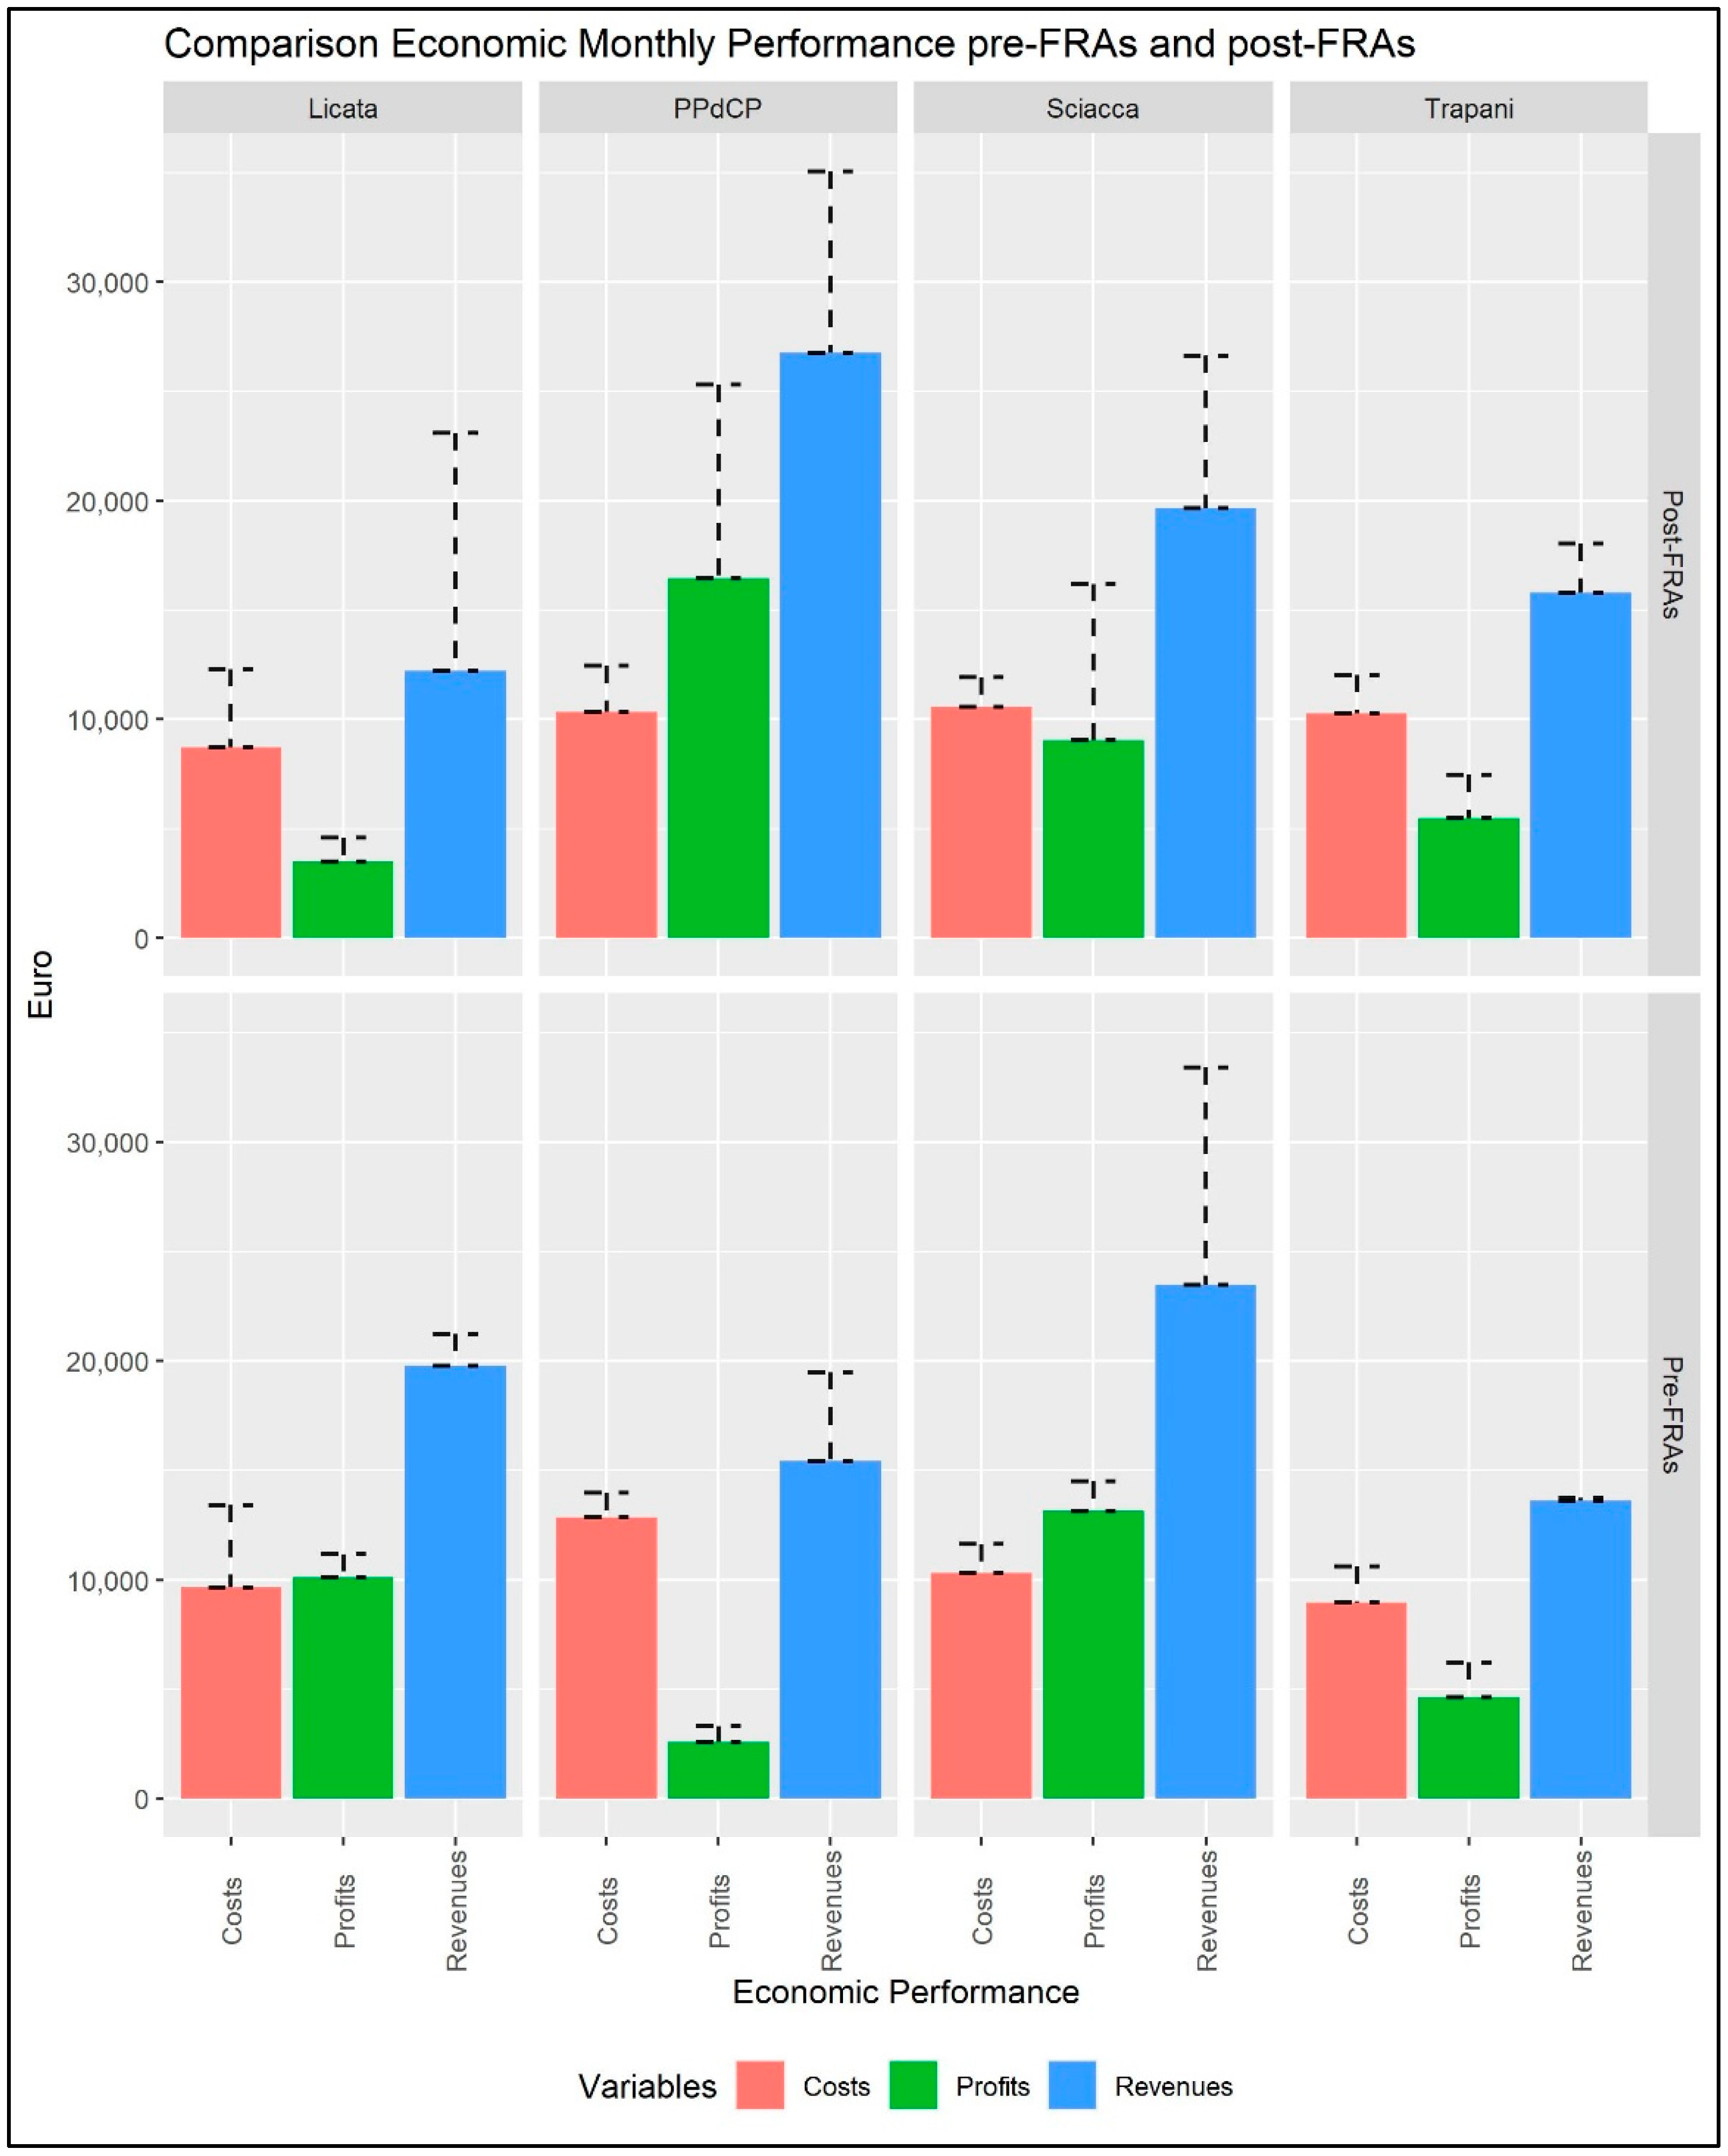
3.2. Catch Composition and Economic Performance

Approximately 1300 tons was landed by the 37 selected “domestic” trawlers (belonging to 89 species) in 2016. The landings consisted mainly of Crustacea (580 tons; 42.9% total landing), Osteichthyes (520 tons; 38.5%), Cephalopoda (about 230 tons; 17.2%) and Chondrichthyes (18 tons; 1.3%) commercial. The most abundant species was Parapenaeus longirostris which represent the 38.9% (about 520 tons) of the total landings; while Lepidopus caudatus, followed by Merluccius merluccius, constitute the second and the third most relevant fraction in terms of landings values with the 13% (about 175 tons) and the 9.5% (about 127 tons), respectively (Table 3).
Approximately 1200 tons of landings were simulated by the SMART model for the 37 selected “domestic” trawlers after the establishment of the FRAs (2017–2019). The simulated landings consisted mainly of Osteichthyes (557 tons; 45.9% total simulated landing), Crustacea (about 442 tons; 36.5%), Cephalopoda (about 201 tons; 16.6%) and Chondrichthyes (about 11 tons; 0.9%) commercial. Furthermore, during the simulations, the three most abundant species were Parapenaeus longirostris (about 276 tons; 22.8%), Lepidopus caudatus (about 266 tons; 22%) and Merluccius merluccius (about 91 tons; 7.5%) (Table 4).
The selected “domestic” trawlers of Sciacca, Porto Palo di Capo Passero and Licata showed the most abundant annual landings with about 770 tons (57.3%), about 340 tons (25.1%) and about 190 tons (14%), respectively; while Trapani represented the fleet with the lowest landings in the SoS with about 50 tons (3.6%).
Parapenaeus longirostris was the most caught species with landings amounting to: about 86 tons (46%) of the Licata fleet, about 149 tons (44%) of the Porto Palo di Capo Passero fleet, about 280 tons (36%) of the Sciacca fleet and about 8 tons (16%) of the Trapani fleet (Figure 3).
Except for the Sciacca fleet, the second most important catch is represented by Merluccius merluccius for all the fleets considered, with the Porto Palo di Capo Passero fleet showing the highest value (about 35 tons, 10.5%), followed by the Licata fleet with a landing value of about 23.5 tons (12.5%). Conversely, the most abundant species of Sciacca trawlers, after Parapenaeus longirostris, were Lepidopus caudatus and Merluccius merluccius with, respectively, landing values of about 169 tons (22%) and 62 tons (8.1%) (Figure 3).
Excluding the Sciacca fleet, the composition of the simulated landings confirmed that DPS is always the most caught species, even if it shows a general decrease in all the considered fleets: 40% for the Licata fleet, 38% for the Porto Palo di Capo Passero fleet, 25% for the Sciacca fleet and 16% for the Trapani fleet. L. caudatus was the most caught species of the fleet of Sciacca (Figure 3).
In this context, SMART returned estimates of the expected fishing effort pattern by vessels, and then at the aggregated level of the fleet, including the fishing effort displacement. Indeed, the establishment of the three FRAs is associated with an increase of the fishing effort around the FRAs, and in the south and southeast region of the SoS (for more details see [14]).
The comparison between the mean monthly economic performances and the corresponding standard deviation before the establishment of the FRAs (2016) and the simulated one after the FRAs establishment (2017–2019) for each fleet is shown in Figure 4.
Considering the landings economic performances before the FRAs adoption, the monthly revenues and profits of Sciacca and Licata fleet were the highest with the value of about EUR 23,500 ± 9900 and EUR 19,500 ± 1500 (revenues) and about EUR 13,000 ± 1300 and EUR 10,000 ± 1000 (profits), respectively. Trapani is the fleet providing the lowest revenues with about EUR 13,500 ± 140 per month. On the other hand, Porto Palo di Capo Passero showed the lowest monthly profits with a value of about EUR 2500 ± 750 (Figure 4).
The monthly costs are lower for the marine fisheries of Trapani and Licata (about EUR 9000 ± 1600 and EUR 9600 ± 3700, respectively); while they are slightly higher in the other marine fisheries: about EUR 12,800 ± 1100 for the Porto Palo di Capo Passero fleet and about EUR 10,300 ± 1300 for the Sciacca fleet (Figure 4).
Simulation of the economic performance after the adoption of the FRAs suggested strong short-term variation. In particular, the Porto Palo di Capo Passero fleet obtained the highest values both for revenues and profits with about EUR 26,000 ± 8000 and EUR 16,500 ± 8500, respectively. While, Sciacca and Trapani represent the second and the third marine fisheries in terms of revenues and profits with values of about EUR 19,500 ± 7000 and EUR 15,500 ± 2300 (revenues) and about of EUR 9000 ± 7000 and EUR 5500 ± 2000 (profits), respectively. Finally, Licata fleets show the lowest values both for revenues (about EUR 12,200 ± 10,500) and profits (about EUR 3500 ± 1000) (Figure 4).
As simulated the monthly costs concerns, Licata fleet obtained the lowest value with about EUR 8700 ± 3500. Conversely, the other fleets show very similar values being about EUR 10,300 ± 2100 for Porto Palo di Capo Passero, EUR 10,600 ± 1300 for Sciacca and EUR 10,200 ± 1700 for Trapani (Figure 4).

4. Discussion

In recent years, bio-economic models have been increasingly used to evaluate the impact of fishery policies before they are put in place [8,33,34]. In this study, the short-term effects of the FRAs’ implementation were evaluated by using the SMART bio-economic model on four trawler fleets distributed along the southern coast of Sicily and fishing within the territorial waters.
In the SoS, bottom trawling provides considerable revenue for marine fisheries. Considering the bottom trawlers with LOA > 24 m, the three shrimp species represented by DPS, ARS and ARA accounted for 65% of total landings for a value of about EUR 74,500 in 2016 [23]. Our results showed that DPS represents the most widely caught species also for the bottom trawlers with LOA < 24 m operating close to the territorial waters (“domestic” fleet), ranging from 17 to 45% of the total landings in the investigated fleets. These findings confirm the important role of this species in SoS fisheries and also in smaller vessels as reported by Knittweis et al. [35]. However, it is worth noting that the landings of smaller trawlers of the “domestic” fleet comprise a higher number of species than the yield of larger trawlers forming the distant fleet.
Prior to the implementation of the FRAs, results showed that the fleets operating in the central area of the southern coast of Sicily had the highest revenues and profits; this result could probably be due to the proximity of these marine fisheries to the Adventure Bank and the Malta bank, that are known as spawning and nursery areas for many demersal species of commercial interest, such as the deep-water rose shrimp, the European hake and the red mullet [36,37,38,39].
In particular, the Sciacca trawlers showed the greater value of DPS landing and the highest revenues before the adoption of the FRAs. This result could be explained by the favourable position of this fleet, situated in the middle of Adventure Bank and Gela basin, that would favour fishing activities in this area. Moreover, the high amount of Lepidopus caudatus landing, a species increasingly appreciated by Sicilian consumers [40], contributed to increasing fleet profits.
In terms of fleet capacity, Porto Palo di Capo Passero and Sciacca showed the highest mean values of LOA, GT and kW for the investigated vessel segments. In this context, in terms of costs and especially considering the price and consumption of fuel, it is interesting to note the relatively high costs for the Porto Palo di Capo Passero fleet. This result could mean that the Porto Palo di Capo Passero fishermen decided to fish in areas away from the coast where the main demersal target species are not overexploited and where they are more abundant or to fish near the Malta Bank, a fishing area located very far from the coast, but these operations mean greater fuel consumption and, also, an increase in the number of days at sea with a consequent increase of salaries. Probably, these increased costs are the main reasons why the Porto Palo di Capo Passero fleet has the lowest profits compared to the other marine fisheries distributed along the SoS.
Comparing the economic performance in the short-term before and after FRA establishment during this “transition period” from 2017 to 2019 and considering this period representative of the short-term changes caused by the closure of the FRAs, Porto Palo di Capo Passero represents the fleet with the highest benefits from the FRA implementation, obtaining the best simulated profits in absolute with an increase of about EUR 13,500. This pattern is likely due to the fact that, as the Malta Bank FRA is situated far from the coast, the fishermen of Porto Palo di Capo Passero are not as affected by the closure of this area in terms of reduction of fishing grounds but they can benefit from the positive effects of the northward spill-over from the FRA along the permanent front bordering the outer shelf of the Malta Bank [22].
On the other hand, the Trapani fleet showed a modest increase of about EUR 850 in terms of profits if compared to the Porto Palo di Capo Passero fleet. Due to its position in the southwest along the Sicilian coast, this fleet seems to not be negatively affected by the establishment of the FRAs and the slight increase in profits could likely be due to the increase in catches linked to the spill-over effect concerning the species that tend to migrate northward from Adventure Bank FRA.
As was to be expected, the fleets showing in the short-term the greatest disadvantages as a consequence of the establishment of the FRAs in terms of profits, were the ones located in the central part of the southern Sicilian coast, namely the Sciacca and Licata fleets, from which the FRAs subtracted traditional fishing grounds. These two marine fisheries reduced their monthly profits by about EUR 4000 and EUR 6500, respectively. Due to the closure of a part of their fishing areas, these two fleets are expected to be negatively affected by the FRAs because fishermen must necessarily lengthen their fishing trips with a consequent increase in costs, especially in terms of fuel consumption.
Even if the primary target of the FRAs is improving the status of fish stocks and enhancing fisheries [41,42], they can also contribute to biodiversity conservation [43,44]. Of course, these closures need to be ecologically coherent [45] and potential effects at different spatial scales must be considered [46].
Although the FRAs are a very important tool for the rebuilding of overexploited stocks and socio-economic performance at the whole-fleet level in the SoS [14,27], the short term profits of fleet fishing closer to the FRAs has resulted in them being negatively affected by the closures. Considering the different socio-economic impacts at the single-fleet level, specific compensative measures to help the impacted fleets could be planned till a more productive state of the stocks is reached.
In particular, since the management of Mediterranean fisheries is characterised by a large variety of complex and interdependent parameters (e.g., the predominance of multi-species stocks, a wide variety of fishing grounds, the high adaptability and techniques for ecological and economic market niches, the long-term coexistence of different production processes) for which the economic and social dimensions are often predominant [47], the evaluation of the socio-economic effects for each fleet involved in the management plan to rebuild overexploited stocks should be considered. Moreover, to support a spatially based approach to fishery management, the climate and environmental changes should be considered since they strongly affect the productivity of stocks through changes in terms of recruitment and other demographic parameters, causing a change in the sustainable yields of stock [48,49,50]. Consequently, in the long period, the real situation could be very different from the current one.
Although our analyses were based on a limited set of vessels, the results obtained seem to be relevant in assessing the short-term effect of closures of critical habitats, such as the nurseries, at the level of a single fleet. However, due to the growing importance of the use of the FRAs in the Mediterranean, the results from the simulation should be confirmed by the specific monitoring of stock within and close to the closures in order to clarify the spill-over pattern of the juveniles from the FRAs to the adjacent areas, and of trawlers operating close to the FRA to understand the variation in their economic performances in the short and long term.

Author Contributions

Conceptualisation, T.R. and F.F.; methodology, F.D.M. and T.R.; validation, F.D.M., T.R. and F.F.; formal analysis, F.D.M.; investigation, F.D.M., M.L.G. and D.S.; data curation, F.D.M., M.L.G. and D.S.; writing—original draft preparation, F.D.M.; writing—review and editing, F.D.M., M.L.G., D.S., T.R. and F.F.; visualisation, F.D.M.; supervision, T.R. and F.F. All authors have read and agreed to the published version of the manuscript.

Funding

This research received no external funding.

Institutional Review Board Statement

Not applicable.

Informed Consent Statement

Not applicable.

Data Availability Statement

The raw data supporting the conclusions of this article will be made available by the authors, without undue reservation.

Acknowledgments

The research leading to these results has been conceived under the International PhD Program “Innovative Technologies and sustainable Use of Mediterranean Sea Fishery and Biological Resources (www.FishMed-PhD.org)”. This study represents partial fulfilment of the requirements for the Ph.D. thesis of Federico Di Maio. This research was conducted thanks to the European Data Collection Framework (DCF)—Transversal Variables—funded by the European Union and the Italian Ministry for Agricultural, Food and Forestry Policies.

Conflicts of Interest

The authors declare no conflict of interest.

References

  1. Jennings, S.; Kaiser, M.; Reynolds, J.D. Marine Fisheries Ecology; John Wiley & Sons: Hoboken, NJ, USA, 2009; p. 432. [Google Scholar]
  2. Hák, T.; Janoušková, S.; Moldan, B. Sustainable Development Goals: A need for relevant indicators. Ecol. Indic. 2016, 60, 565–573. [Google Scholar] [CrossRef]
  3. Pauly, D.; Christensen, V.; Guenette, S.; Pitcher, T.J.; Sumaila, U.R.; Walters, C.J.; Watson, R.; Zeller, D. Towards sustainability in world fisheries. Nature 2002, 418, 689–695. [Google Scholar] [CrossRef] [PubMed]
  4. Branch, T.A.; Jensen, O.P.; Ricard, D.; Ye, Y.; Hilborn, R. Contrasting global trends in marine fishery status obtained from catches and stock assessments. Conserv. Biol. 2011, 25, 777–786. [Google Scholar] [CrossRef] [PubMed]
  5. Gascuel, D.; Merino, G.; Döring, R.; Druon, J.N.; Goti, L.; Guénette, S.; Macher, C.; Soma, K.; Travers-Trolet, M.; Mackinson, S. Towards the implementation of an integrated ecosystem fleet-based management of European fisheries. Mar. Policy 2012, 36, 1022–1032. [Google Scholar] [CrossRef] [Green Version]
  6. Prellezo, R.; Accadia, P.; Andersen, J.L.; Andersen, B.S.; Buisman, E.; Little, A.; Nielsen, J.R.; Poos, J.J.; Powell, J.; Röckman, C. A review of EU bio-economic models for fisheries: The value of a diversity of models. Mar. Policy 2012, 36, 423–431. [Google Scholar] [CrossRef]
  7. Hilborn, R.; Amoroso, R.O.; Anderson, C.M.; Baum, J.K.; Branch, T.A.; Costello, C.; Ye, Y. Effective fisheries management instrumental in improving fish stock status. Proc. Natl. Acad. Sci. USA 2020, 117, 2218–2224. [Google Scholar] [CrossRef] [Green Version]
  8. Garcia, S.M.; Ye, Y.; Rice, J.; Charles, A. Rebuilding of Marine Fisheries Part 1: Global Review; FAO Fisheries and Aquaculture Technical Paper No. 630/1; FAO: Rome, Italy, 2018; p. 294. [Google Scholar]
  9. Pinello, D.; Dimech, M. Socio-economic analysis of the Lebanese fishing fleet. In FAO EastMed Technical Documents; FAO: Athens, Greece, 2013; p. 81. [Google Scholar]
  10. Sreekanth, G.B.; Lekshmi, M.N.; Singh, N.P.; Chakraborty, S.K.; Reddy, V. Evaluation of economic performance of small scale fisheries in a tropical coastal ecosystem in southwest coast of India. Indian J. Geo-Mar. Sci. 2017, 46, 485–492. [Google Scholar]
  11. Gristina, M.; Bahri, T.; Fiorentino, F.; Garofalo, G. Comparison of demersal fish assemblages in three areas of the Strait of Sicily under different trawling pressure. Fish. Res. 2006, 81, 60–71. [Google Scholar] [CrossRef]
  12. Fiorentino, F.; Ben Hadj Hamida, O.; Ben Meriem, S.; Gaamour, A.; Gristina, M.; Jarboui, O.; Knittweis, L.; Rjeibi, O.; Ceriola, L. Synthesis of information on some demersal crustaceans relevant for fisheries target species in the south-central Mediterranean Sea. In GCP/RER/010/ITA/MSM-TD-32 MedSudMed Technical Documents; FAO: Rome, Italy, 2013; p. 120. [Google Scholar]
  13. Di Lorenzo, M.; Sinerchia, M.; Colloca, F. The North sector of the Strait of Sicily: A priority area for conservation in the Mediterranean Sea. Hydrobiologia 2017, 821, 235–253. [Google Scholar] [CrossRef]
  14. Russo, T.; D’Andrea, L.; Franceschini, S.; Accadia, P.; Cucco, A.; Garofalo, G.; Gristina, M.; Parisi, A.; Quattrocchi, G.; Sabatella, R.F.; et al. Simulating the effects of alternative management measures of trawl fisheries in the central Mediterranean Sea: Application of a multi-species bio-economic modeling approach. Front. Mar. Sci. 2019, 6, 542. [Google Scholar] [CrossRef]
  15. Geraci, M.L.; Colloca, F.; Di Maio, F.; Falsone, F.; Fiorentino, F.; Sardo, G.; Scannella, D.; Gancitano, V.; Vitale, S. How is artificial lighting affecting the catches in deep water rose shrimp trawl fishery of the Central Mediterranean Sea? Ocean Coast. Manag. 2021, 215, 105970. [Google Scholar] [CrossRef]
  16. Maiorano, P.; Sabatella, R.F.; Marzocchi, B.M. Annuario sullo stato delle risorse e sulle strutture produttive dei mari italiani. Biol. Mar. Mediterr. 2019, 22 (Suppl. S1), 432. (In Italian) [Google Scholar]
  17. General Fisheries Commission for the Mediterranean. Report of the meeting “Working Group on Stock Assessment of Demersal Species (WGMPA)”. In Proceedings of the Working Group on Stock Assessment of Demersal Species (WGMPA), Rome, Italy, 9–14 December 2019; FAO: Rome, Italy. [Google Scholar]
  18. Food and Agriculture Organization of the United Nations. Report of the Fortieth Session of the General Fisheries Commission for the Mediterranean (GFCM). In Proceedings of the Fortieth Session of the General Fisheries Commission for the Mediterranean (GFCM), St. Julian’s, Malta, 30 May–3 June 2016; GFCM Report No 40. FAO: Rome, Italy. [Google Scholar]
  19. Food and Agriculture Organization of the United Nations. Available online: http://www.fao.org/gfcm/data/maps/fras (accessed on 25 October 2021).
  20. General Fisheries Commission for the Mediterranean. On the Establishment of Geographical Sub-Areas in the GFCM Area. 2007. Available online: http://151.1.154.86/GfcmWebSite/docs/decisions/GFCM-Decision–RESGFCM_33_2009_2-en.pdf (accessed on 21 November 2021).
  21. Garofalo, G.; Fiorentino, F. In Proceedings of the Expert Meeting on Fisheries-Related Other Effective Area-Based Conservation Measures (OECMs) in the Mediterranean Sea, Rome, Italy, 16–17 February 2022.
  22. Béranger, K.; Mortier, L.; Gasparini, G.P.; Gervasio, L.; Astraldi, M.; Crépon, M. The dynamics of the Sicily Strait: A comprehensive study from observations and models. Deep-Sea Res. II Top. Stud. Oceanogr. 2004, 51, 411–440. [Google Scholar] [CrossRef]
  23. Pinello, D.; Gee, J.; Accadia, P.; Sabatella, E.C.; Vitale, S.; Polymeros, K.; Fiorentino, F. Efficiency of shallow-and deep-water trawling in the Mediterranean and its implications for discard reduction. Sci. Mar. 2018, 82, 97–106. [Google Scholar] [CrossRef] [Green Version]
  24. Falsone, F.; Scannella, D.; Geraci, M.L.; Vitale, S.; Colloca, F.; Di Maio, F.; Milisenda, G.; Gancitano, V.; Bono, G.; Fiorentino, F. Identification and characterization of trammel net métiers: A case study from the southwestern Sicily (Central Mediterranean). Reg. Stud. Mar. Sci. 2020, 39, 101419. [Google Scholar] [CrossRef]
  25. De Angelis, P.; D’Andrea, L.; Franceschini, S.; Cataudella, S.; Russo, T. Strategies and trends of bottom trawl fisheries in the Mediterranean Sea. Mar. Policy 2020, 118, 104016. [Google Scholar] [CrossRef]
  26. Council Regulation (EC) N° 199/2008 of February 2008 Concerning the Establishment of a Community Framework for the Collection, Management and Use of Data in the Fisheries Sector and Support for Scientific Advice Regarding the Common Fisheries Policy. Available online: https://eur-lex.europa.eu/legal-content/EN/TXT/?uri=CELEX:32008R0199 (accessed on 12 August 2021).
  27. Russo, T.; Parisi, A.; Garofalo, G.; Gristina, M.; Cataudella, S.; Fiorentino, F. SMART: A spatially explicit bio-economic model for assessing and managing demersal fisheries, with an application to italian trawlers in the strait of Sicily. PLoS ONE 2014, 9, e86222. [Google Scholar] [CrossRef]
  28. D’Andrea, L.; Parisi, A.; Fiorentino, F.; Garofalo, G.; Gristina, M.; Cataudella, S.; Russo, T. smartR: An R package for spatial modelling of fisheries and scenario simulation of management strategies. Methods Ecol. Evol. 2020, 11, 859–868. [Google Scholar] [CrossRef] [Green Version]
  29. Tietze, U.; Lash, R.; Thomsen, B.; Rihan, D. Economic Performance and Fishing Efficiency of Marine Capture Fisheries; FAO Fisheries Technical Paper; FAO: Rome, Italy, 2005; p. 482. [Google Scholar]
  30. Effiong, J.A.L.; Aligbe, J.O.; Uzoho, B.U.; Eze, E.U. Cost structure of trawl fisheries in Nigeria. Int. J. Adv. Acad. Res. 2016, 2, 2–4. [Google Scholar]
  31. Carvalho, N.; Keatinge, M.; Guillen, G. Scientific, Technical and Economic Committee for Fisheries (STECF): The 2019 Annual Economic Report on the EU Fishing Fleet (STECF 19–06). Available online: https://stecf.jrc.ec.europa.eu/documents/43805/2483556/STECF%2019-06%20-%20AER%20-%202019.pdf (accessed on 11 July 2021).
  32. The Community Fishing Fleet Register. Available online: https://data.europa.eu/euodp/it/data/dataset/the-community-fishing-fleet-register (accessed on 17 July 2021).
  33. Whitmarsh, D.; James, C.; Pickering, H.; Neiland, A. The profitability of marine commercial fisheries: A review of economic information needs with particular reference to the UK. Mar. Policy 2000, 24, 257–263. [Google Scholar] [CrossRef]
  34. Pascoe, S.; Kahui, V.; Hutton, T.; Dichmont, C. Experiences with the use of bioeconomic models in the management of Australian and New Zealand fisheries. Fish. Res. 2016, 183, 539–548. [Google Scholar] [CrossRef]
  35. Knittweis, L.; Arneri, E.; Ben Meriem, S.; Dimech, M.; Fiorentino, F.; Gancitano, V.; Jarboui, O.; Mbarek, K.B.; Ceriola, L. Stock Status and Potential Yield of Deep Water Rose Shrimp (Parapenaeus longirostris, Lucas 1846) in the South-Central Mediterranean SEA; MedSudMed Technical Documents No 28; FAO: Rome, Italy, 2013; p. 15. [Google Scholar]
  36. Fiorentino, F.; Garofalo, G.; De Santi, A.; Bono, G.; Giusto, G.; Norrito, G. Spatio-temporal distribution of recruits (0 group) of Merluccius merluccius and Phycis blennoides (Pisces, Gadiformes) in the Strait of Sicily (Central Mediterranean). Hydrobiology 2003, 503, 223–236. [Google Scholar] [CrossRef]
  37. Levi, D.; Andreoli, M.G.; Bonanno, A.; Fiorentino, F.; Garofalo, G.; Mazzola, S.; Norrito, G.; Patti, B.; Pernice, G.; Ragonese, S.; et al. Embedding sea surface temperature anomalies into the stock recruitment relationship of red mullet (Mullus barbatus L. 1758) in the Strait of Sicily. Sci. Mar. 2003, 67, 259–268. [Google Scholar] [CrossRef]
  38. Fortibuoni, T.; Bahri, T.; Camilleri, M.; Garofalo, G.; Gristina, M.; Fiorentino, F. Nursery and spawning areas of deep-water rose shrimp, Parapenaeus longirostris (Decapoda: Penaeidae), in the Strait of Sicily (Central Mediterranean Sea). J. Crust. Biol. 2010, 30, 167–174. [Google Scholar] [CrossRef]
  39. de Juan, S.; Lleonart, J. A conceptual framework for the protection of vulnerable habitats impacted by fishing activities in the Mediterranean high seas. Ocean Coast. Manag. 2010, 53, 717–723. [Google Scholar] [CrossRef]
  40. Falsone, F.; Scannella, D.; Geraci, M.L.; Gancitano, V.; Vitale, S.; Fiorentino, F. How Fishery Collapses: The Case of Lepidopus caudatus (Pisces: Trichiuridae) in the Strait of Sicily (Central Mediterranean). Front. Mar. Sci. 2021, 7, 1188. [Google Scholar] [CrossRef]
  41. Petza, D.; Maina, I.; Koukourouvli, N.; Dimarchopoulou, D.; Akrivos, D.; Kavadas, S.; Tsikliras, A.C.; Karachle, P.K.; Katsanevakis, S. Where not to fish—Reviewing and mapping fisheries restricted areas in the Aegean Sea. Mediterr. Mar. Sci. 2017, 18, 310–323. [Google Scholar] [CrossRef] [Green Version]
  42. Dimarchopoulou, D.; Dogrammatzi, A.; Karachle, P.K.; Tsikliras, A.C. Spatial fishing restrictions benefit demersal stocks in the north-eastern Mediterranean Sea. Sci. Rep. 2018, 8, 5967. [Google Scholar] [CrossRef] [Green Version]
  43. Rodríguez-Rodríguez, D.; Rodríguez, J.; Abdul Malak, D.; Nastasi, A.; Hernández, P. Marine protected areas and fisheries restricted areas in the Mediterranean: Assessing “actual” marine biodiversity protection coverage at multiple scales. Mar. Policy 2016, 64, 24–30. [Google Scholar] [CrossRef]
  44. Fraschetti, S.; Pipitone, C.; Mazaris, A.D.; Rilov, G.; Badalamenti, S.B.; Claudet, I.; Carić, H.; Dahl, K.; D’Anna, G.; Daunys, D.; et al. Light and shade in marine conservation across European and Contiguous Seas. Front. Mar. Sci. 2018, 5, 420. [Google Scholar] [CrossRef]
  45. Hiddink, J.G.; Hutton, T.; Jennings, S.; Kaiser, M.J. Predicting the effects of area closures and fishing effort restrictions on the production, biomass and species richness of benthic invertebrate communities. ICES J. Mar. Sci. 2006, 63, 822–830. [Google Scholar] [CrossRef]
  46. Dinmore, T.A.; Duplisea, D.E.; Rackham, B.D.; Maxwell, D.L.; Jennings, S. Impact of a large-scale area closure on patterns of fishing disturbance and the consequences for benthic communities. ICES J. Mar. Sci. 2003, 60, 371–380. [Google Scholar] [CrossRef] [Green Version]
  47. Bonzon, A. Development of economic and social indicators for the management of Mediterranean fisheries. Mar. Freshw. Res. 2000, 51, 493–500. [Google Scholar] [CrossRef]
  48. Moullec, F.; Barrier, N.; Drira, S.; Guilhaumon, F.; Marsaleix, P.; Somot, S.; Ulses, C.; Velez, L.; Shin, Y. An End-to-End Model Reveals Losers and Winners in a Warming Mediterranean Sea. Front. Mar. Sci. 2019, 6, 345. [Google Scholar] [CrossRef]
  49. Travers-Trolet, M.; Bourdaud, P.; Genu, M.; Velez, L.; Vermard, Y. The risky decrease of fishing reference points under climate change. Front. Mar. Sci. 2020, 7, 850. [Google Scholar] [CrossRef]
  50. Fiorentino, F.; Vitale, S. How Can We Reduce the Overexploitation of the Mediterranean Resources? Front. Mar. Sci. 2021, 8, 674633. [Google Scholar] [CrossRef]
Figure 1. Main trawl fleets based along the south coast of Sicily and the Fisheries Restricted Areas (FRAs) situated in the Strait of Sicily (SoS). In red, the investigated fleets in this work. A: the FRA situated to the east of Adventure Bank; B: the FRA situated to the west of Gela Basin; C: the FRA situated to the east of Malta Bank.
Sustainability 14 04743 g001
Figure 2. Boxplots of fleet capacity indicators in terms of gross tonnage (GT), engine power (kW) and length overall (LOA) of the different fleets considered in this study. Red point: mean; black line: median; boxplot: 25–75% quartiles.
Sustainability 14 04743 g002
Figure 3. Comparison between the total landings composition of the selected “domestic” trawlers by fleet and species in 2016 and the simulated total landings composition of the same trawlers by fleet and species after the establishment of the FRAs (2017–2019).
Sustainability 14 04743 g003
Figure 4. Mean monthly revenues (mean + standard deviation), mean monthly total costs (mean + standard deviation) and corresponding profits (mean + standard deviation) by fleet, before (2016) and after the establishment of the FRAs (2017–2019).
Sustainability 14 04743 g004
Table 1. Selected trawlers to calculate the economic performance by fleet.
PortLength Overall (m)N° of Vessels
Licata12–185
18–240
Porto Palo di Capo Passero12–188
18–244
Sciacca12–184
18–2413
Trapani12–180
18–243
Total12–2437
Table 2. The number of trawlers by length overall (LOA) of each port in 2016.
Port.LOA (m)No. of Vessels
Licata12–1824
18–2415
Porto Palo di Capo Passero12–1821
18–2419
Sciacca12–1812
18–2466
Trapani12–1818
18–2411
Table 3. Landings by species of investigated “domestics” trawlers in 2016 (Source: [26]).
SpeciesTaxonomic GroupTotal Landings (Tons)Percentage (%)Cumulative Percentage (%)
Parapenaeus longirostrisCrustacea523.338.938.9
Lepidopus caudatusOsteichthyes175.113.051.9
Merluccius merlucciusOsteichthyes127.69.561.4
Eledone moschataCephalopoda62.14.666.0
Mullus surmuletusOsteichthyes62.04.670.6
Illex coindetiiCephalopoda40.83.073.6
Sepia officinalisCephalopoda32.62.476.0
Trachurus trachurusOsteichthyes25.11.977.9
Loligo vulgarisCephalopoda23.71.879.7
Octopus vulgarisCephalopoda23.61.881.5
OtherOsteichthyes128.39.591.0
OtherCrustacea55.24.195.1
OtherCephalopoda49.43.798.8
OtherChondrichthyes18.11.2100
Table 4. Simulated landings by species of investigated “domestic” trawlers after the establishment of the FRAs (2017–2019).
SpeciesTaxonomic GroupTotal Landings (Tons)Percentage (%)Cumulative Percentage (%)
Parapenaeus longirostrisCrustacea276.822.822.8
Lepidopus caudatusOsteichthyes266.722.044.8
Merluccius merlucciusOsteichthyes91.57.552.3
Eledone moschataCephalopoda48.94.056.3
Mullus surmuletusOsteichthyes48.34.060.3
Illex coindetiiCephalopoda35.83.063.3
Sepia officinalisCephalopoda33.02.766.0
Trachurus trachurusOsteichthyes21.91.867.8
Loligo vulgarisCephalopoda25.32.169.9
Octopus vulgarisCephalopoda28.52.472.3
OtherOsteichthyes128.610.682.9
OtherCrustacea165.913.796.6
OtherCephalopoda29.82.599.1
OtherChondrichthyes11.20.9100
Publisher’s Note: MDPI stays neutral with regard to jurisdictional claims in published maps and institutional affiliations.

