1. Introduction
1.1. Motivation
Cost reductions and sustained political support are expected to fuel robust growth in global renewable energy sources (RES) beyond 2022 [
1]. According to the latest report from the International Energy Agency [
2], RES capacity is expected to grow globally by more than 60% between 2020 and 2026, reaching more than 4800 GW. This equates to the 2020 global energy capacity of combined fossil fuels and nuclear power. Overall, China is expected to lead for the next four years, accounting for 43% of global renewable capacity increase, followed by Europe, the United States (U.S.), and India. These four markets alone account for 80% of global renewable energy capacity growth. The European Union (EU) and China plan to exceed their current targets, laying the groundwork for more ambitious growth trajectories. On 14 July 2021, the European Commission adopted the “Fit for 55” [
3] package, which aims to achieve a 55% reduction in greenhouse gas emissions by 2030 compared to 1990 levels. The “Fit for 55” package also includes amendments to the EU’s Renewable Energy Directive and the Energy Efficiency Directive, which set targets for increasing the share of RES (up to 40%) and energy efficiency in virtually all segments of the economy. China’s commitment to carbon neutrality by 2060 has updated the nearest goals: to boost the total wind and solar panel capacity by 1200 GW by 2030 [
4]. Ambitious goals are setting RES on a course to new heights in India and the U.S. Compared to the existing capacity, renewables in India are growing faster than in any other key market. India aims to produce 175 GW by 2022 and 500 GW by 2030 from RES. From 2021 to 2026, U.S. RES capacity is expected to be 65% higher than in the previous five years. It is the cumulative result of the economic attractiveness of wind and solar technologies, increased ambition at the federal level, and growing support for offshore wind power [
5].
Nowadays, photovoltaic (PV) panels and onshore winds are already the cheapest ways to add new generating capacities in most countries. In states where good resources, governmental support, and consumer willingness to participate in RES development are available, wind and PV installations will replace existing fossil fuel technologies. Solar projects are now offering one of the lowest electricity cost values in history [
6]. PV alone accounts for 60% of all renewable energy capacity to be added by 2025, with wind providing another 30%. In addition, the 24 case studies JRC analyzed show that solar (38%) and wind (19%) are the most common used [
7]. In third and fourth place are biomass (17%) and biogas (15%). Bioeconomy could also play an important role in the low carbon economy as solar and wind [
8,
9]. However, several barriers prevent citizens from becoming producers of (bio)energy: lack of community readiness to harness the full potential of the bioenergy market, lack of awareness among bioenergy stakeholders of the potential of communities, and lack/unsupportive structure and political conditions [
10]. The issue is relevant and needs to be studied in more detail, but this is not the goal of this article. Based on the latest trends, this article is focused specifically on solar and wind energy.
The energy policy of the EU Energy Union strategy is based on consumers, encouraging them to take full responsibility for the transition to RES in order to benefit from new technologies and reduce electricity bills. Thanks to technological developments and innovations [
11,
12] based on EU and national policies [
13], it is necessary to envisage the introduction of efficient RES technologies for both small-scale (i.e., distributed energy level) and large-scale (i.e., energy community level) use in order to ensure significant cost reductions. It is worth noting that energy communities (ECom) are rapidly developing around the world and are an actual topic for research. ECom can play a key role in supporting national governments and the EU to achieve climate and energy goals [
14,
15] aimed at eliminating fossil-sourced energy and thoughtful social transformation (“Clean Energy Package”). This movement helps stimulate the development of local, decentralized energy networks, increases energy security, the reliability and resilience of the whole system, provides opportunities for local economic growth and promote public acceptance of the transition to new energy models [
16,
17,
18]. The path of the energy transition is significantly influenced by social development, cultural values, and political activities in the local context. In addition, the increasing decentralization of energy supply and management practices has led to the emergence of active prosumers (e.g., community groups, local governments) whose role in actively managing energy transitions is in demand and deserving of detailed study [
12,
19,
20,
21]. In the International Energy Agency report about energy transition is said [
15]: “People-centered transitions are morally required and politically necessary: As countries seek to advance their shifts to clean energy technologies, the success of these efforts will rest on enabling citizens to benefit from transition opportunities and to navigate disruptions. This includes social, environmental, and economic impacts on individuals and communities, as well as issues of affordability and fairness. A focus on training and skills development to equip all citizens to participate in the net zero economy is also critical.” The countries of the EU are striving for a significant use of environmentally friendly energy technologies. This and government support will depend on enabling citizens to take advantage of transition opportunities and to participate in the zero economy [
22].
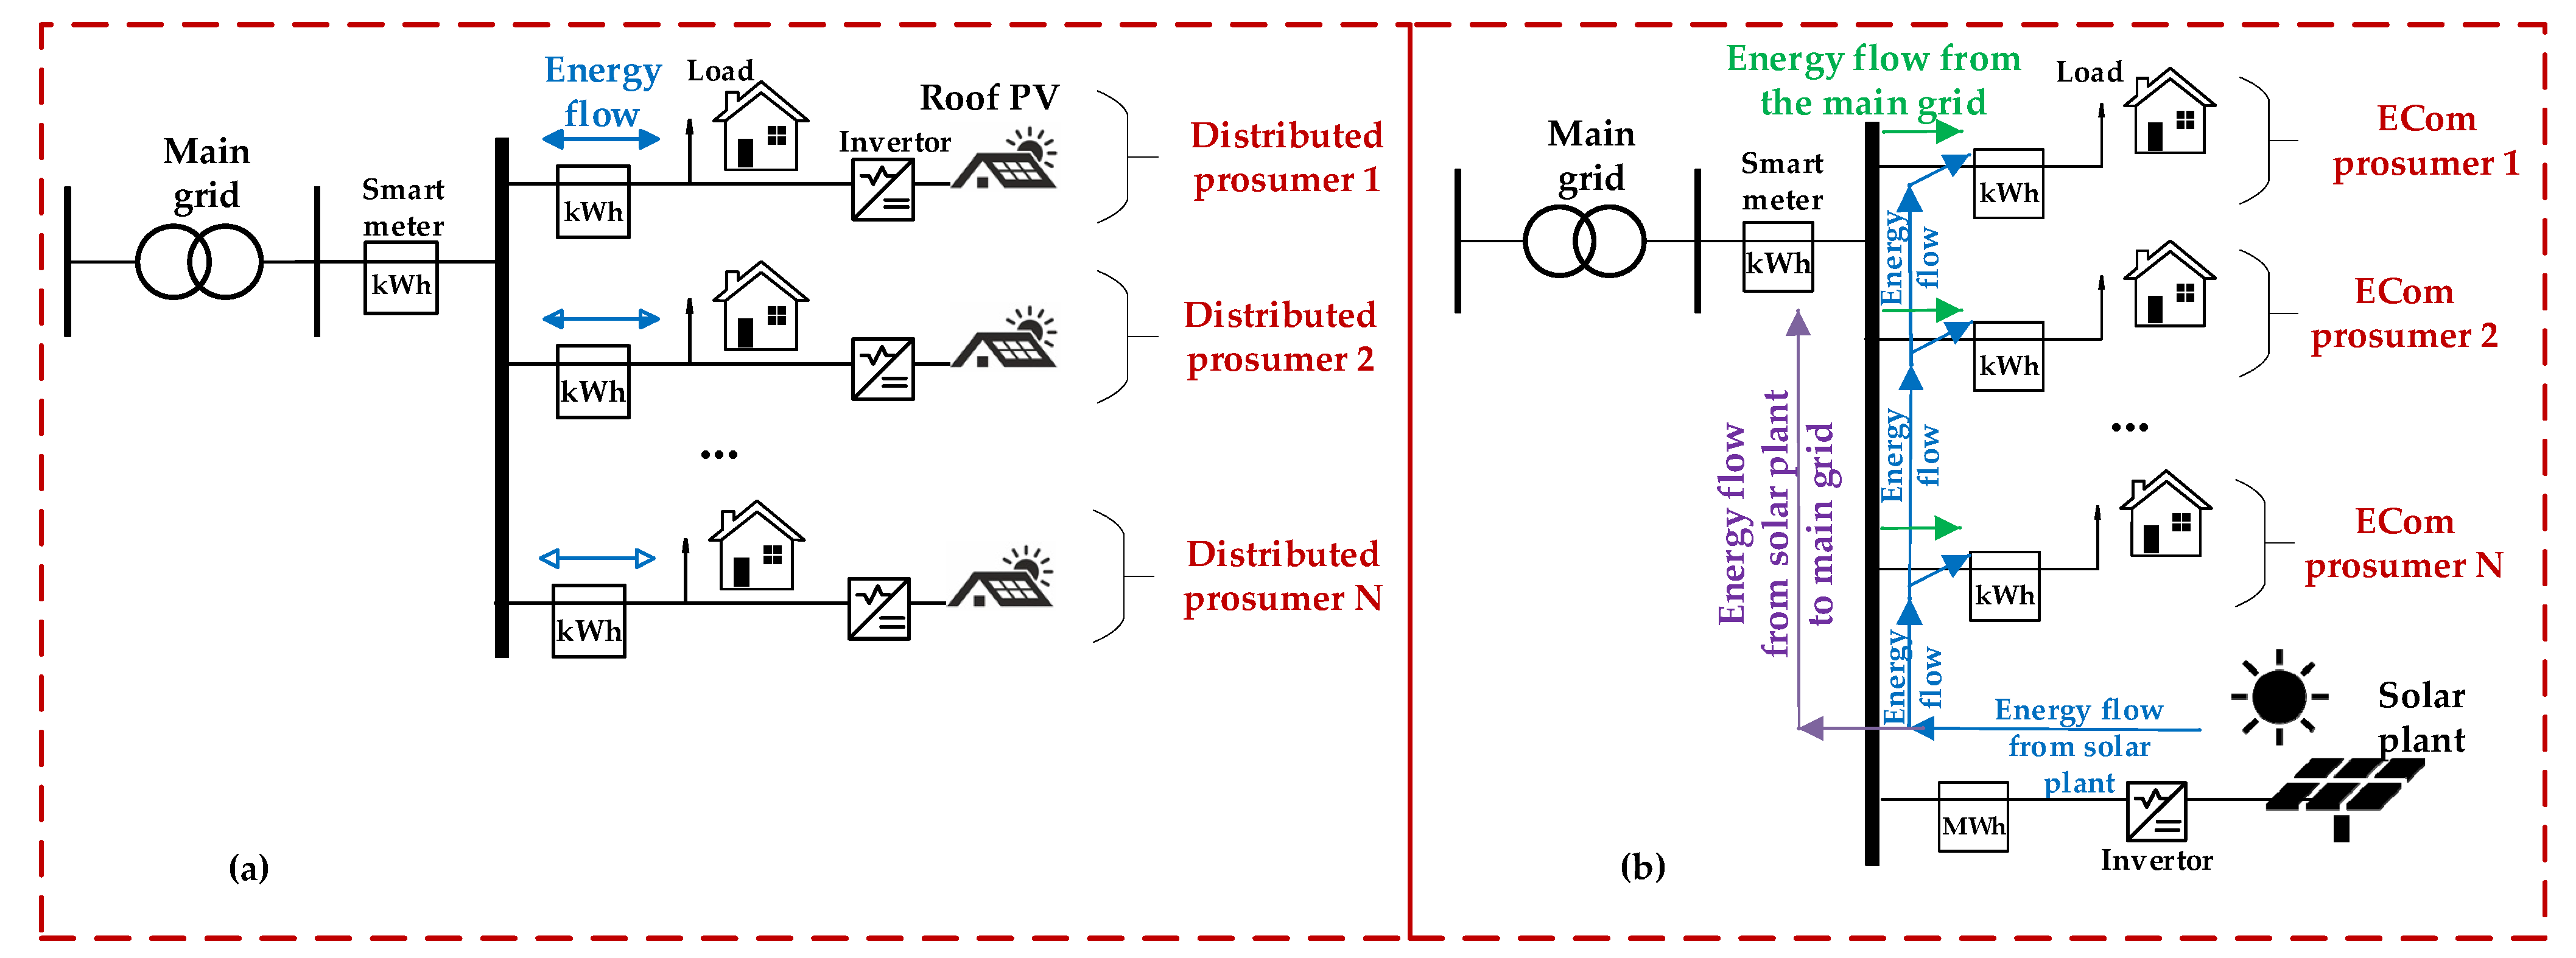
As mentioned apreviously, the widespread use of RES is transforming the energy production network from a classic producer-to-consumer scheme to new business models [
23,
24], where a small consumer with local generation becomes a prosumer, i.e., an active energy consumer who is also an energy producer. There are two main ways to “transform” a consumer into a prosumer (see
Figure 1). The first transformation possibility is the creation of distributed low power (several kW), which consists of many generation units at home (mainly rooftop solar PV and/or small wind turbines). The consumer with the first transformation method will hereinafter be referred to as the distributed prosumer (DP). The second way of transformation is the creation of medium-capacity energy communities (ECom) (up to several MW). EComs are available to energize consumers who are unable to install individual generation units on their roofs or site (e.g., due to their lack or inappropriate roof shape). Even residents of high-rise buildings in dense urban development can be full members of EComs. Thus, the consumer of the second transformation method is hereinafter referred to as the ECom’s prosumer (EComP).
Both of the above ways lead to one final goal and can be used separately or together. Either method ensures the inclusion in the energy transformation process, provides an opportunity to massively attract investments from the population, and to contribute to the choice of a rational and profitable mode of balancing the generation/consumption of the power system. Revealing the mutual advantages and disadvantages of these two ways of attracting the population to participate in energy transformation is the main goal of this article.
Increasing the number of prosumers can only be ensured on the condition that the investment in generation pays off within a reasonable period of time. The payback period depends on a number of factors and the specific conditions of use [
25]. The most important influencing factors include the required amount of investment, the meteorological conditions, the conditions for energy sale and purchase, load consumption profiles, energy prices, and the amount of support for “green” energy [
26].
1.2. Background
Several studies have been devoted to the opportunities and challenges associated with support schemes for DP and EComP [
27,
28,
29,
30,
31]. A support scheme is to be chosen by public authorities and is based on each country’s economic potential [
32]. Different schemes are used to support prosumers in different countries. The most commonly used schemes are the feed-in tariff, investment support mechanisms, and the net metering system (NMS) [
33]. This publication focuses on the NMS. For EComP, a virtual NMS is used [
34,
35]. Similar to NMS, the virtual NMS allows households to receive the net metering credits associated with a renewable energy project installed at a remote location. These credits are worth as much or close to as much as what they would pay for electricity from their utility. Each unit (kWh) of electricity generated by the ECom farm will effectively reduce the participant’s electricity bill, either as a one-for-one kilowatt hour basis or as a monetary credit.
A significant number of publications [
36,
37,
38,
39,
40,
41] is devoted to the analysis of the technical and economic aspects and billing policies of the NMS applications for EComP or DP. The profitability and optimal installation capacities of PV systems for ECom compared to individual buildings, considering constructions ranging from urban to suburban and historical to rural areas, is investigated in [
36]. The results show that the profitability of optimally-sized PV systems increases when forming EComs, and loads with varied profiles demonstrate better synergy effects and increase the cost-saving potential. Article [
37] estimates the economic viability for residential customers when participating in a renewable energy community, focused on PV electricity sharing. The article shows that DP can get the most profit from participation in ECom, as they can not only purchase cheaper electricity (through reduction of levies and grid charges) within the community, but also have an option to sell PV electricity at higher prices. In [
38], the environmental and economic advantages of ECom, calculated by aggregating consumers, prosumers, and variable RES at the distribution level and considering microgrid trades, are presented. The authors approve that ECom has the potential to be carbon-neutral in relation to electricity consumption and could reduce consumers’ costs. In [
41], ECom configurations of eight different countries are assessed in terms of costs and investments, with respect to country-specific climatic conditions. The economic performance of a DP versus an EComP under various frameworks is compared in [
40]. The study results identify fundamental differences between regulatory schemes, such as feed-in tariff, NMS and self-consumption schemes, and their suitability for the development of collective or individual entities, and also emphasize the need to develop a set of policies that consider the consumption habits of people for the effective development of ECom.
Based on the results of publications devoted to the implementation of distributed generation and ECom creation, one can conclude that RES development has many advantages, such as reduction of energy exchange with the grid, a decrease in environmental impact, and an increase in energy security, reliability, and resilience of the whole system. Existing studies develop new network plans, cost-effective business models, and ways to make the society sustainably carbon neutral. Different approaches of economic criteria calculation for solar and wind installations have been created, and various network models have been developed. However, the network models considered [
36,
37,
38,
40,
41] are greatly simplified (i.e., averaged annual parameters are used), which inevitably leads to errors in the assessment of economic criteria. All of these studies have focused on the cost-effectiveness of urban PV systems and solar communities, which are associated with the long-term planning of these systems. However, a detailed description of methods for energy prices’ forecasting, load, and RES generation has not been provided.
It should be noted that despite the rapid development of RES, an increase in the electricity prices, and reduction in the technology installation prices, the problem of the profitability of RES equipment and ensuring its efficient management is still relevant. In this respect, most proactive consumers face a dilemma: whether to be a DP or to become an EComP. Understanding the above factors is very important for both consumers and decision-making parties (government, EU decision makers, investors, etc.), who define the amount of support to ensure the economic viability of RES. In the authors’ opinion, this problem, important for a huge number of consumers, has not been sufficiently considered, especially in the Baltic countries.
Analyzing the Baltic countries separately, it can be concluded that Estonia and Lithuania are progressing in the issue of creating ECom, while Latvia is lagging behind in this matter. In the report [
42], it was concluded that for Estonia, there are opportunities for the expansion of EComP and they are connected with the reduction of the high share of shale oil in electricity production and the new energy efficiency regulation for buildings. For Latvia, researchers from [
42] were not able to find any project that would match the definition of ECom. However, the range of measures of the Latvian National Energy and Climate Plan 2021–2030, approved in January 2020, also includes support for EComs, RES projects, and promotion of self-consumption on a larger scale. The initial steps are to include the definition of energy communities and the basic conditions in Latvian legislation (Energy Law, Electricity Market Law), and it is necessary to provide public funding for community RES projects in the next period’s EU funds. The National Development Plan 2021–2027 also expresses support for increasing the share of RES, community initiatives, and microgeneration projects. However, there are obstacles to setting up energy communities [
43,
44,
45]. The regulation is not yet supportive of collective RES initiatives. The most obvious example is the net electricity billing system, which only applies to individual households, but cannot be applied to legal entities, including associations, which could be set up jointly by these households to use RES in apartment buildings. Creating an economically viable case is especially important for successful energy transition in this region due to the limited solar irradiation. In Lithuania, there is a solar ECom, called “Solar Community”, in operation [
46]. Lithuania companies launched an online consumer platform [
47], where everyone can buy a share (from 1 to 10 kW) of remote solar plants. The benefit of this project is that a citizen can consume and produce electricity for his/her own use in geographically different places.
Based on this analysis, this study concentrates on the real applications of PV and wind technologies and their development in Latvia.
1.3. Aim and Contribution
In particular, this article aims to develop a high-resolution methodology for decision-making under uncertainty in energy community or distributed energy projects relying on publicly the prediction of influencing processes (i.e., energy price, energy load, solar and wind generation, electricity consumption), producer-provided technical characteristics of RES technologies, end-user load measurements, meteorological measurements, and distributed power system configuration. This methodology will use a specific medium- and low-voltage model to determine the power flow and energy losses in the network. The authors are confident that this methodology will accelerate the process of RES penetration and help increase the economic efficiency of ongoing RES projects, especially in those countries where for instance, energy communities are only at the stage of consideration.
The main contributionS of this study are:
Investigation, assessment, and comparison of two approaches to renewable energy resources adoption and ownership by the end-users: an individually owned resource or an energy community. This problem is formulated mathematically. The formulation considers several distribution grid development scenarios, such as renewable proliferation level. It relies on the time series of realistic data with an hourly resolution: electricity prices, load, and intermittent generation profiles, and incorporates simulations of the grid operation, including changes in the network topology. The developed methodology considers today’s electricity billing and renewable support scheme—net metering, as it is currently deployed in the Baltics.
A presentation of reference data that has been collected for the Baltic region. The database contains historical statistics of hourly load profiles for different customer types, hourly solar and wind generation records, as well as hourly profiles of the same parameters under several forecasting scenarios for 25 years ahead.
The practical and realistic example of an energy community and quantification of the business case. Creating an economically viable case is especially important for successful energy transition in this region due to the limited solar irradiation;
Recommendations for the edits in the energy law to enable economically rational energy transition.
1.4. Paper Layouts
The rest of the paper is organized as follows.
Section 2 describes the methods and methodologies used to model the distribution network, the operation of prosumers, the rules of the electricity billing system, the forecast of electricity consumption and prices, as well as PV and wind generation. The NMS settlement system in Latvia and its operating principle are discussed.
Section 3 is devoted to the modeling of distribution networks, which was performed using different RES development scenarios. It contains a description of the initial data and assumptions and reflects the results of the economic comparison of DP vs. EComP. The key conclusions are summarized in
Section 4.
2. Materials and Methods
Any individual prosumer, as well as a group of prosumers, influences the operation of the grid it is connected to [
48,
49]. Joint operation of multiple prosumers also influences the loading of the energy producers and hence, the operation of the power system as a whole. A new connection changes power flows, increases or decreases energy and voltage losses, and may cause or reduce congestion. When connecting to the distribution network for one or many prosumers, several important tasks must be solved:
The technologies and their parameters must be chosen.
The compliance of the possible connection with the existing legislation must be checked.
The connection location and scheme must be selected.
The required capital investment must be assessed.
The return on investment must be assessed.
Power losses in the network must be checked.
These tasks are solved in compliance with the applicable government regulations, which determine the connection rules and restrictions, including those related to the operation of the distribution network. The resolution of these tasks is influenced by government regulations, distribution network regulations, and prosumers’ decisions. Thus, it can be argued that the connection or connections and the structure of the electricity network are the result of the actions of some decision-makers. In addition, the interests of these decision-makers may not coincide. It is natural to allow each of the decision-makers to try to solve the task of the energy system and the network as best as possible. To do this, it is desirable to simulate the work of the distribution network and prosumers. The model includes a series of sub-models that perform:
Forecasting of influencing processes
Modeling of prosumer operation (generation or consumption)
Network modeling (current, voltage, power, loss calculations)
Estimation of objective functions
The distribution network serves many different prosumers, the composition of which may change over the years. The problem of the development of the distribution grid expansion encompasses varied tasks related to the need to make forecasts of impacting processes and ensure the making of rational decisions on their basis. Although the decision-making problem solving depends on actual goals, it is still possible to single out the main objectives and steps that are characteristic of many tasks.
2.1. Decision-Making Algorithm
The desire to cover a varied range of tasks and the presence of many decision makers leads to the use multiple criteria forms of setting the optimization problem [
50]. In mathematical terms, our problem can be formulated as Equation (1):
where NPV
Tplan stands for the net present value of cash flow [
51] at the end of planning period, T
plan (this objective function is to be maximized, that so its negative is used), €; IRR stands for internal return rate, % [
52]; LCOCE stands for levelized costs of consumed energy, €/kWh [
53]; T
pp stands for payback period in years; and Ploss stands for losses of power in the distribution grid, kWh. A detailed description of economic indicators is presented in
Section 2.3.
Each of the objective functions included in Equation (1) depends on a number of optimization variables: technology (sun or wind), total power, and place of connection to the grid. Problem (1) has to be solved considering many technical and legal constraints. Technical restrictions apply to distribution networks (power lines must not be overloaded, voltage fluctuations must be within specified limits) [
54]. Legislation limits the power of generators.
The authors are tasked with finding a representative set of solutions and quantifying possible trade-offs that satisfy the subjective preferences of a decision maker. The minimization procedure (1) is implemented based on the use of an algorithm for enumeration of options and scenarios.
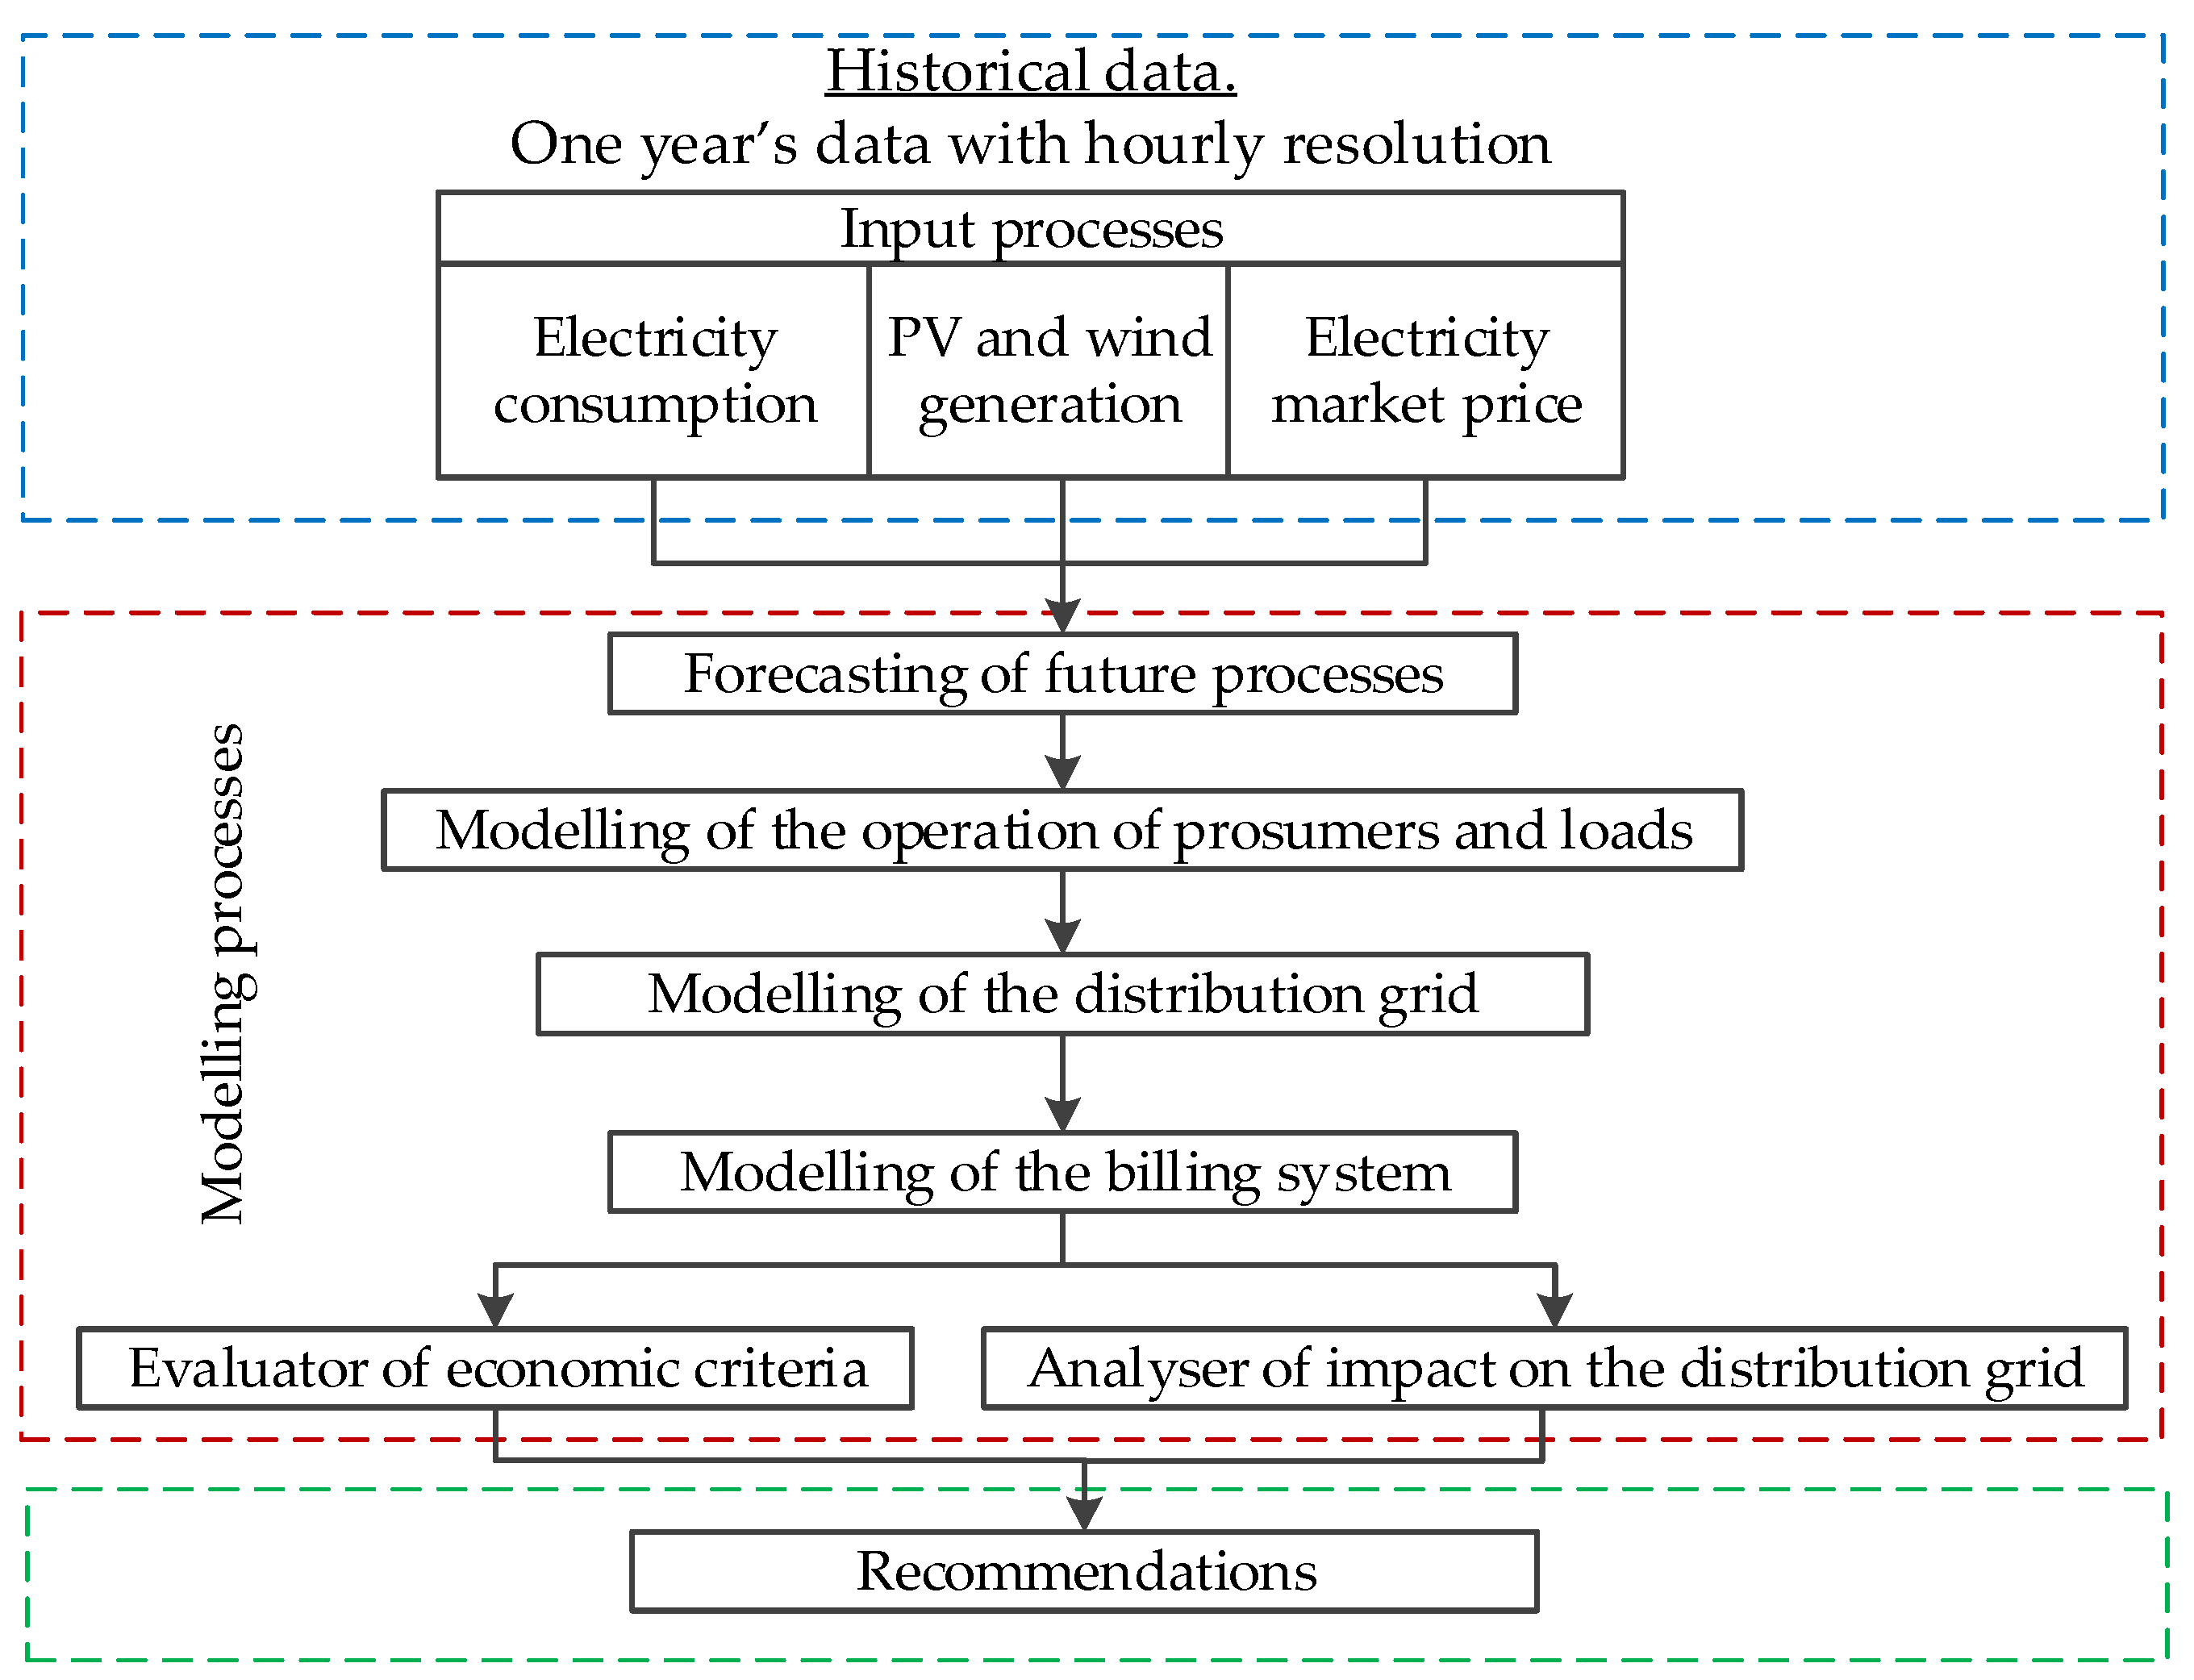
The decision-making algorithm provided in
Figure 2 is divided into three main blocks: Block 1 contains records of historical data of impacting processes and Block 2 forecasts future processes, models the billing system, simulates the operation of the distribution grid, prosumers, and loads, and evaluates economic and technical indicators; Block 3 elaborates recommendations for decision-makers.
Forecasts of processes are used, which have been formed on the basis of measurements of the processes in question and by applying the so-called naive forecasting approach [
55] to solar and wind generation, energy consumption, which assumes that past processes will repeat in the future. For electricity price forecasting, the authors offered a prediction method based on the Fourier transformation [
56] to capture the seasonality characteristics of the price series.
The next step is to estimate the avoided costs [
57], considering the rules of the NMS, the tariff policy, and other indicators that are necessary for the specific case. Finally, the economic criteria for the installation of RES technology are being assessed and are having an impact on the distribution network.
2.2. Historical Data and Forecasting of Future Processes
The authors use historical data of hourly measurements of the following input processes: the end user’s energy consumption, PV and wind generation, and the market prices of electricity.
In most cases, forecasts are made using historical measurements and registration data. If the data contain permanent relationships, they can be detected by statistical analysis or artificial intelligence techniques, including the use of a time series. Knowing the connections can predict the future, to assess the profitability of the distribution network or its elements, long-term forecasts of the following most influential processes are required: electricity prices, fuel prices, electricity demand, heat demand, air temperature, solar radiation, and wind speed.
These processes can be used to model the development or operation of an existing and planned distribution network. One-hour process recordings are required to assess its cost-effectiveness. Given that the activity is planned for 25 years or more, it can be argued that the duration of the expected processes should be the same. The authors assume that long-term trends in energy prices can be described by changes in annual averages. This assumption allows the use of models proposed to estimate annual average market price trends.
Initially, the hourly energy price for 2019 is taken from the Nord Pool database. 2020 and 2021 are not taken as base years due to the impact of the COVID-19 pandemic on electricity prices.
In this study, two scenarios of electricity price forecasting are used:
In this study, the authors assume that 2025 is the year of investing. Consequently, the forecasting data on the electricity price for 2025–2050 is used.
2.3. Modelling the Operation of Prosumers, Loads, and Distribution Grid
Big data on electricity consumption were collected from more than 100 Latvian consumers. In our case study, the authors consider different prosumers, whose annual electricity consumption is in the range from 12,000 to 20,000 kWh, was randomly chosen.
The evaluation of PV generation was done with the experimental approach where the amount of PV energy generation is determined on the basis of locally measured data. For this study, the data are taken from the EU Photovoltaic Geographical Information System. For the center of Riga, a full time series with hourly values for both solar and PV performance is evaluated, assuming that the slope of the PV modules (i.e., the angle with the horizontal plane) is 41° for a fixed (non-solar) mounting type, azimuth 1°, and crystalline silicon photoelectric technology. The authors assume that the approximate system loss amount is 14% radiation for DP and 10% for EComP, according to [
61].
Regarding the simulation of the operation of a wind power plant, this article uses experimental data. Statistical data of wind generation can be obtained from various sources. Data on Europe can be obtained from Nord Pool [
62] and the ENTSO-E Transparency Platform of ENTSO-E [
63]. In this case study, the authors used data on Latvia’s wind energy from the website of the Latvian Distribution Network Company website [
64]. The data has been scaled for specific scenarios, which are described in
Section 3.
A practical test system with an unbalanced load profile was chosen, and calculation and analysis of power flows were done with a three-phase current injection method, which is a modification of the Newton-Raphson (NR) method [
65,
66]. Unlike the traditional NR solver, in which voltage and voltage angle are calculated, the modified solver calculates the real and the reactive power.
The backward-forward sweep (BFS) was used to check the convergence of the results.
2.4. Modelling of Billing System
The billing rules differ from country to country. Prosumers are entitled to choose the most suitable rules from the set of rules that exists in the country in question [
67]. Many countries offer the possibility of choosing dynamic tariffs based on wholesale market prices [
68]. The bill formation rule, considering the dynamic tariff, can be formulated by Equation (2):
where
stands for the total costs of the i-th end user for their electricity bill at hour t, €;
stands for the energy consumed by the i-th end user at hour t, kWh;
stands for the electricity market price at hour t, €/kWh;
reflects the additional variable components of the billing system without the electricity market price at hour t, €/kWh;
and
are the proportionality coefficients;
is the fixed component of the electricity bill for the i-th end user, €/h.
To determine the economic efficiency of RES technologies, avoided costs (AC) are calculated, where AC ( (€)) is defined as the difference between the energy costs in the case when RES technologies are not in place (() (€)) and the energy costs in the case when RES technologies are used () (€)).
According to (2), the annual costs (
) for the prosumer’s energy consumption before the installation of RES technologies are estimated in Equation (3):
where
stands for the energy consumption costs before installing the RES technologies at year y (the base case), €;
stands for the energy consumption of the i-th prosumer at hour t of day d, kWh.
For the conditions of Latvia,
and
from Equation (3) can be rewritten as follows:
where
is a capacity-based connection fee that the i-th prosumer pays to the distribution system operator at year y, €;
is the energy-based distribution fee at hour t of day d, €/kWh;
is the mandatory procurement component for the connection of the i-th prosumer at year y, €;
is the mandatory procurement component for the electricity consumed from the grid at hour t of day d, €/kWh.
The annual costs after installing the RES technologies (
) in the case of PV and wind technologies are as follows in Equation (5):
where
stands for the amount of electricity generated by PV technologies at hour t of day d, kWh.
and are calculated from Equation (4).
The feasibility study is usually carried out based on economic criteria as the net present value (NPV) of cash flow [
51], internal return rate (IRR), the levelized cost of energy (LCOE) [
52,
53], and payback period (
).
Considering Equations (3) and (5), NPV can be formulated as follows in Equation (6):
where
is the planning period of RES technologies in years (e.g., T
plan = 25) [
69];
stands for the initial investments into RES technologies, €; i
d is the discount rate, %;
stands for the operation and maintenance costs for the RES technology at a year y, €;
stands for the interest to be paid to the bank at a year y for the received loan, €.
An economic criterion as levelized costs of consumed energy (LCOCE), which considers the annual costs that are incurred by the prosumer after installing the RES technology (
) as well as the total amount of electricity consumed by the prosumer over the year,
, is used. The levelized costs of consumed energy are calculated as follows in Equation (7):
The IRR equation has been taken from [
70] and is estimated by Equation (8):
2.5. The Functioning Principle and Simulation of the NMS Billing System
The monthly electricity costs of households in Latvia contain three components:
The service fee of the distribution system operator
The fixed part of the mandatory procurement component (MPC) (correspondingly to the capacity of the connection) and its variable part (renewable energy sources, combined heat, and power generation)
The payment for electricity
For Latvian households that generate electricity from RES, the payment of the MPC variable part was waived on 1 April 2020 [
71].
The NMS system payment is the payment for the net consumption, i.e., the payment for the difference between the amount of electricity received from the grid and the amount of electricity transmitted to the grid. The net payment depends on electricity consumption, the amount of electricity generated and transmitted to the grid, as well as the price of electricity at the exchange. If the prosumer generates a smaller amount of electricity than it consumes (over a month), then, according to the NMS, the prosumer’s bill contains the fixed fee and the variable fee, which includes payment only for the difference between the amount of energy received from the grid and the amount of energy submitted to the grid. In the opposite case, when the prosumer consumes less than it has generated and has submitted more energy to the grid than it has received, then the resulting difference is regarded as the debt of the power system, which is included in the bills of the following months. A detailed description of the Latvian NMS system is described in [
72].
3. Results and Discussions
This section describes the scenarios of simulating the operation of prosumers and networks and the results achieved, including the costs of the users of the NMS system, payback periods for various scenarios, technologies, and electricity prices, as well as the energy losses and their impact on the distribution grid.
The obtained results prove that it is beneficial to be the owner of RES technologies in different circumstances. The benefits depend on several parameters: the capacity, location, and technical capabilities of RES technologies, electricity prices, consumption time schedules, the structure of the energy tariff system, etc.
This study focuses on the specific cases of PV, wind technologies, and their development in Latvia.
In this subsection, the authors look at one example of a distribution grid from several aspects:
A DP with rooftop PV installations is compared with EComP in terms of energy losses. The main purpose of this analysis is to evaluate and compare the energy losses of the two options mentioned previously.
A DP with rooftop PV installations is compared with EComP in terms of the economic benefit obtained. This study aims to analyze the profitability of individual PV facilities compared to ECom. Based on the obtained results, ways to reduce energy costs for prosumer and how to choose the most realistic development opportunities for the future electricity grid are suggested.
A prosumer is a member of the solar and wind energy community, EComP. The main purpose of this analysis is to compare EComs in terms of economic benefits.
It is worth noting that according to the study on wind efficiency [
73] carried out in the territory of Latvia, the wind efficiency is low, which reduces the amount of electricity produced by low-power wind turbines. Therefore, this publication does not cover scenarios when a prosumer has its own small-capacity wind turbine.
In the case study of forming an ECom, the Lithuanian project [
47], which offers householders the possibility to purchase energy generated in geographically different locations, is taken as the basis.
3.1. Object under Review and Assumptions
For the hourly load of the end users, the time series is collected by an automatic energy metering system are used, encompassing the whole year as well as various consumers of the residential sector in Latvia: privately owned houses and other types of dwellings. Eleven different load profiles are selected for the year. The annual consumption lies in the range of 11,677 kWh–19,652 kWh.
To all the alternatives—the DP who are owners of rooftop PV installations as well as the EComP—the model “IEEE 123 Node Test Feeder” (
Figure 3) [
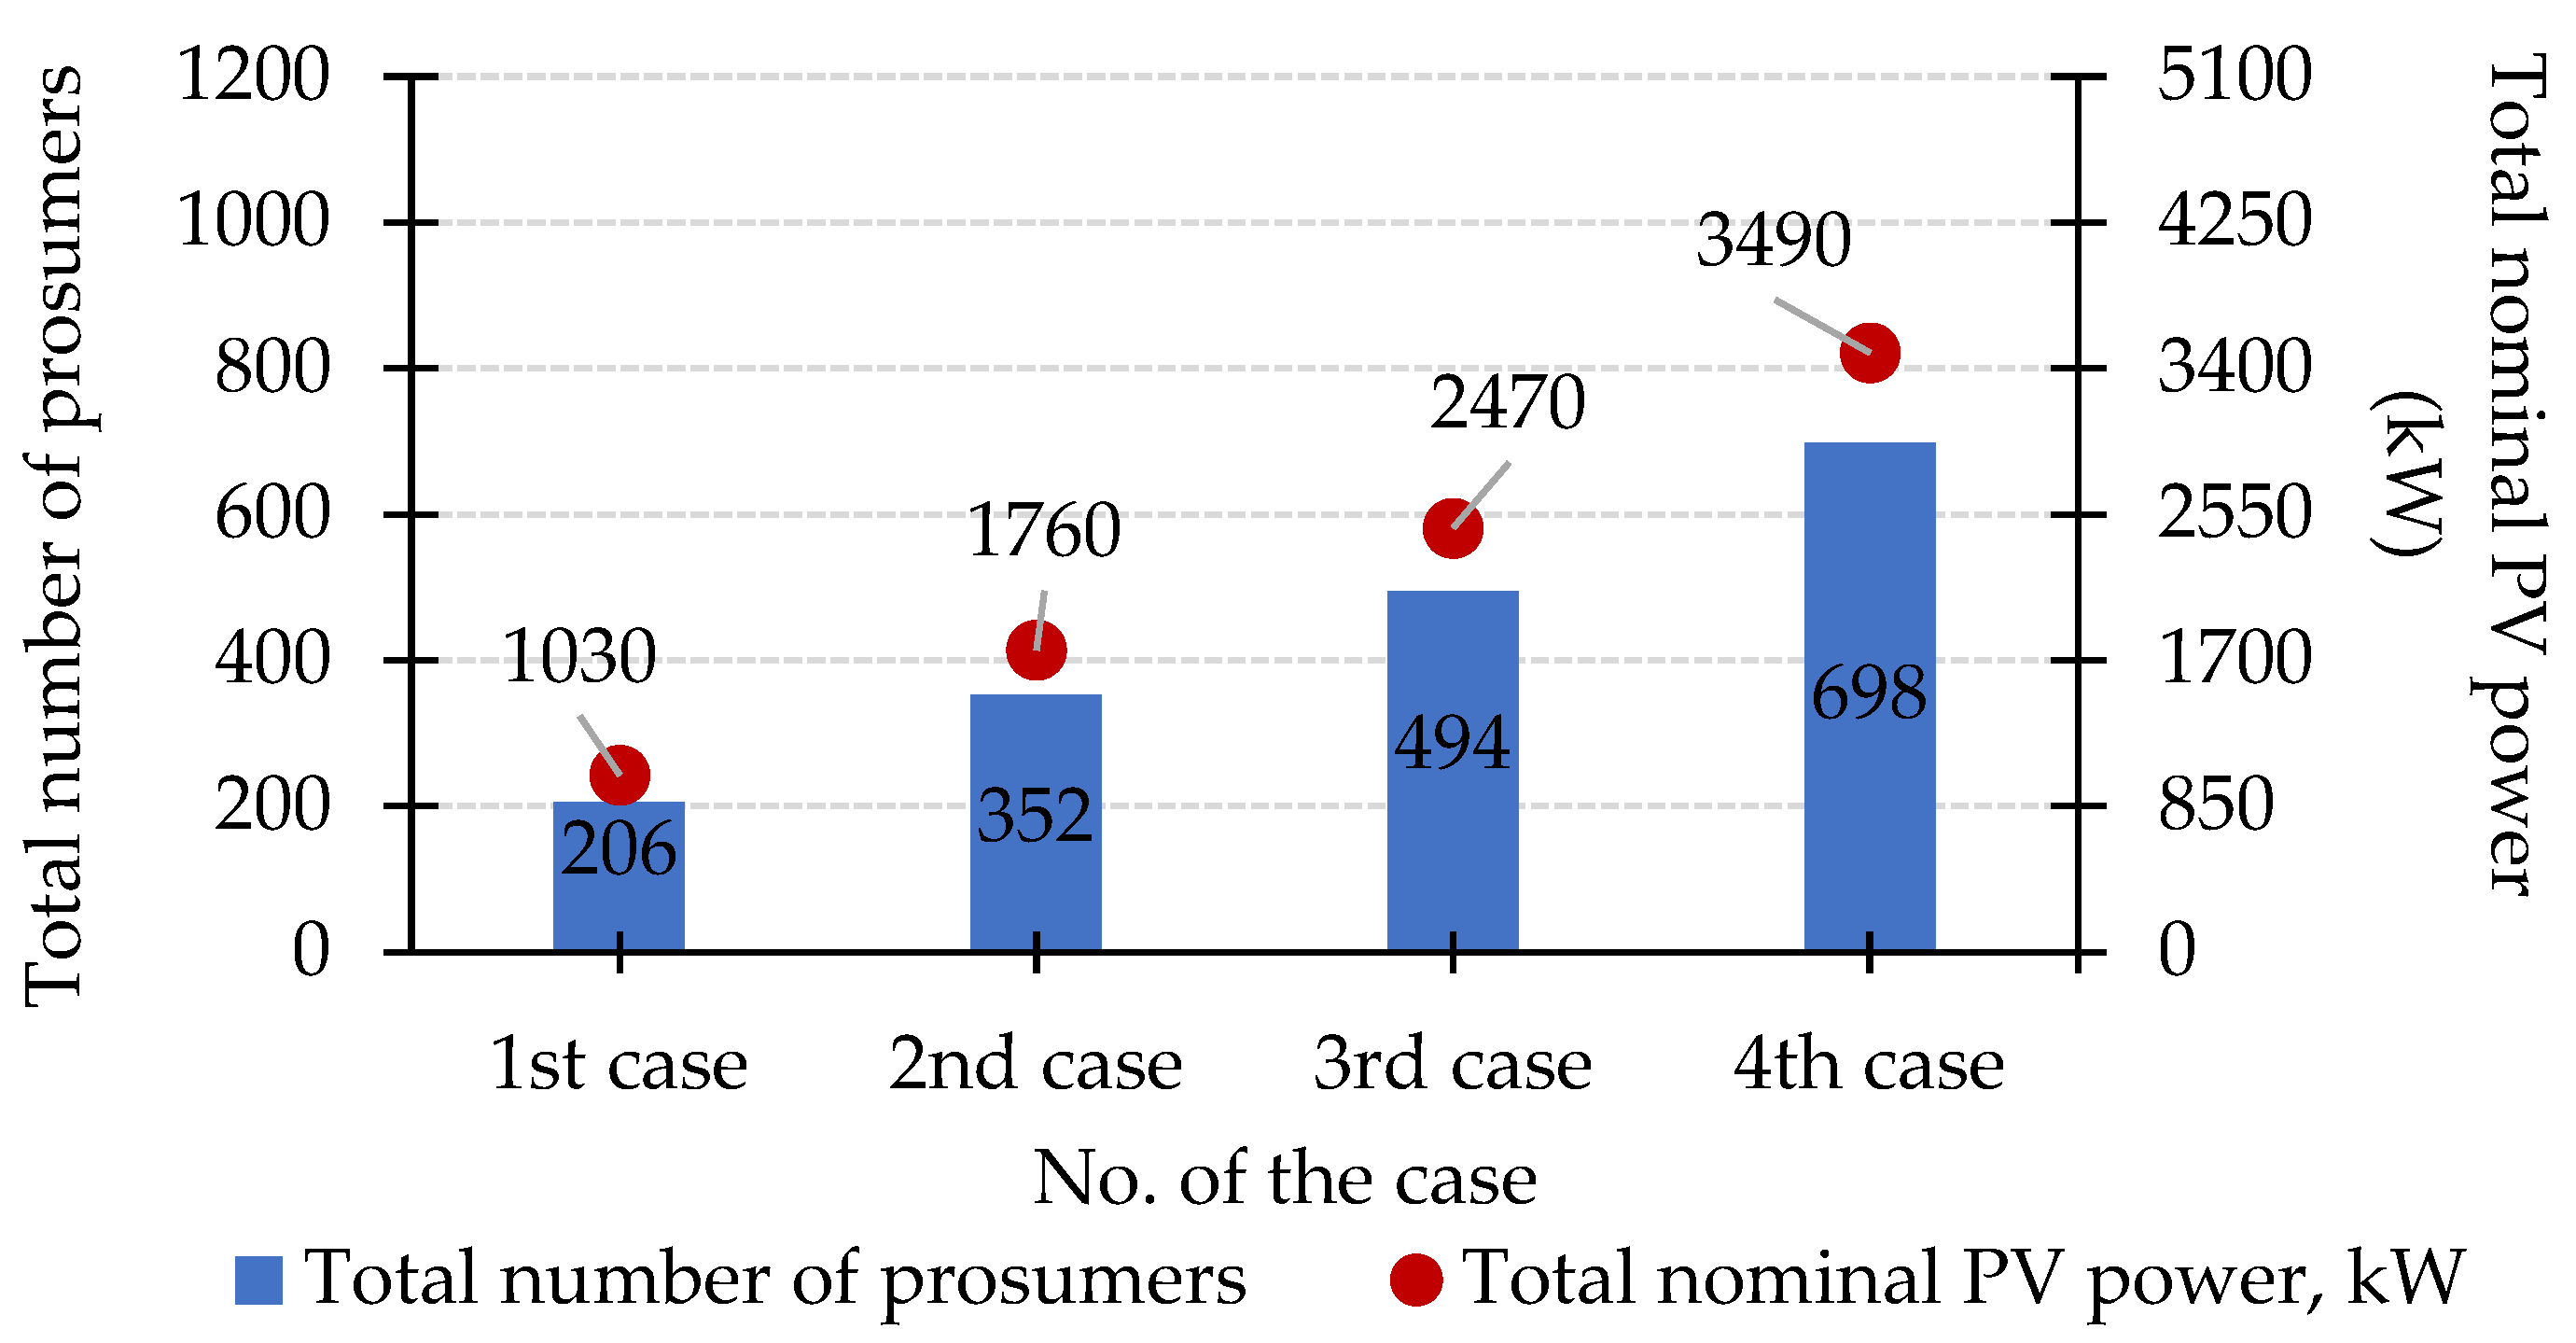
74] is applied for evaluating profitability. It is assumed that out of 123 nodes, 95 are phase-load nodes with a total installed capacity of 3490 kW. The total number of consumers is 698 (
Figure 4). At node 160, an ECom is formed.
The selected model “IEEE 123 Node Test Feeder” is a validation model of the methodology developed by the authors. In the future it is planned to use a real network example.
Since the calculated number of consumers is large, in real life it is impossible to equip all of them with PV panels simultaneously. Therefore, considering the structure and scale of the layout used, the authors looked at four cases of prosumer distribution:
Producers with PV technology were integrated with continuously changing load profiles. The PV installations were distributed throughout the energy distribution system in a scattered manner, so that this reminds real-life situations in existing networks, while striving to maintain the initial load ratio for each phase and between phases.
The authors have assumed that the installed capacity of PV panels is 5 kW for each prosumer. In the case of a community, each consumer purchases a part of a solar/wind power plant with a capacity of 5 kW as well. Equal opportunities are considered to evaluate and compare the economic parameters of both considered possibilities.
The total number of prosumers and the capacity of the PV installations in each case are shown in
Figure 4.
In this study, the authors consider and analyze four capacities of a community plant: 1.03 MW, 1.76 MW, 2.47 MW, and 3.49 MW.
For the examples, the following limiting conditions and assumptions were considered:
The billing period of the NMS is retained in compliance with the valid normative documents, i.e., from 1 April till 31 March. This period is suitable for the Nordic prosumer, as during the winter, they has the opportunity to use the electricity transmitted to the grid to the maximum extent. This period increases the economic profitability for the prosumer.
It is assumed that the year of RES investment will be 2025, but the year of starting activity will be 2026.
It is assumed that the year of the start of PV efficiency decrease will be 2027.
It is assumed that the size of the system of one prosumer is 5 kW. Such an assumption is based on the maximum hourly energy consumption of the consumer.
The efficiency of PV panels is assumed to be 21% [
75].
PV performance ratio is 0.50%/year [
76].
Wind turbine degradation indicator is assumed to be 1.6%/year.
A fixed payment for providing a connection is retained in compliance with the valid normative documents [
77,
78].
A distribution tariff for a solar energy community prosumer and generation tariff is retained in compliance with the valid normative document [
77].
Additional variable components of the billing system are retained in compliance with the valid normative document [
79].
Calculations are carried out with the parameters of a typical vertical wind turbine, EWT DW61-1000 [
80].
Considering the service life of RES technologies (25 years), the assumed planning period of the equipment is 25 years.
Electricity market prices: the Nord Pool market prices are used [
62].
The net present value is calculated for two alternatives: in Alternative 1, it is assumed that a loan is taken, whereas Alternative 2 provides for no loan, planning that the savings of the prosumer will be used.
Roof PV investments are assumed to be 1300 €/kW, but investment costs for a PV power plant—900 €/kW [
46] (based on the example of a virtual net metering system in Lithuania).
Investment costs for large-sized wind turbines are assumed to be 1200 €/kW.
Operation and maintenance costs for PV rooftop panels are assumed 1%/year [
81], but for a PV power plant—19 €/kW/year [
46].
Operation and maintenance costs for large-sized wind turbines are assumed 40 €/kW/year.
The loan interest rate is assumed in accordance with the interest rates laid down by the Bank of Latvia, i.e., 3.0% per annum. The discount rate is assumed to be 1.4% per annum.
3.2. Scenario Modelling
In total, 24 scenarios were developed and simulated. An overview of all the scenarios is provided in
Table 1. For each scenario, four characterizing parameters are used: percentage of prosumers in the distribution network, the use of NMS, the price forecast, and type of prosumer.
As the base scenarios, Nos. 1–8 are taken, when the NMS system is not applied. Nos. 9, 10, 13, 14, 17, 18, 21, and 22 are scenarios that entail rooftop PV installations. The rest of the scenarios are community based.
3.3. Results of Price and Photovoltaic and Wind Generation Forecasting
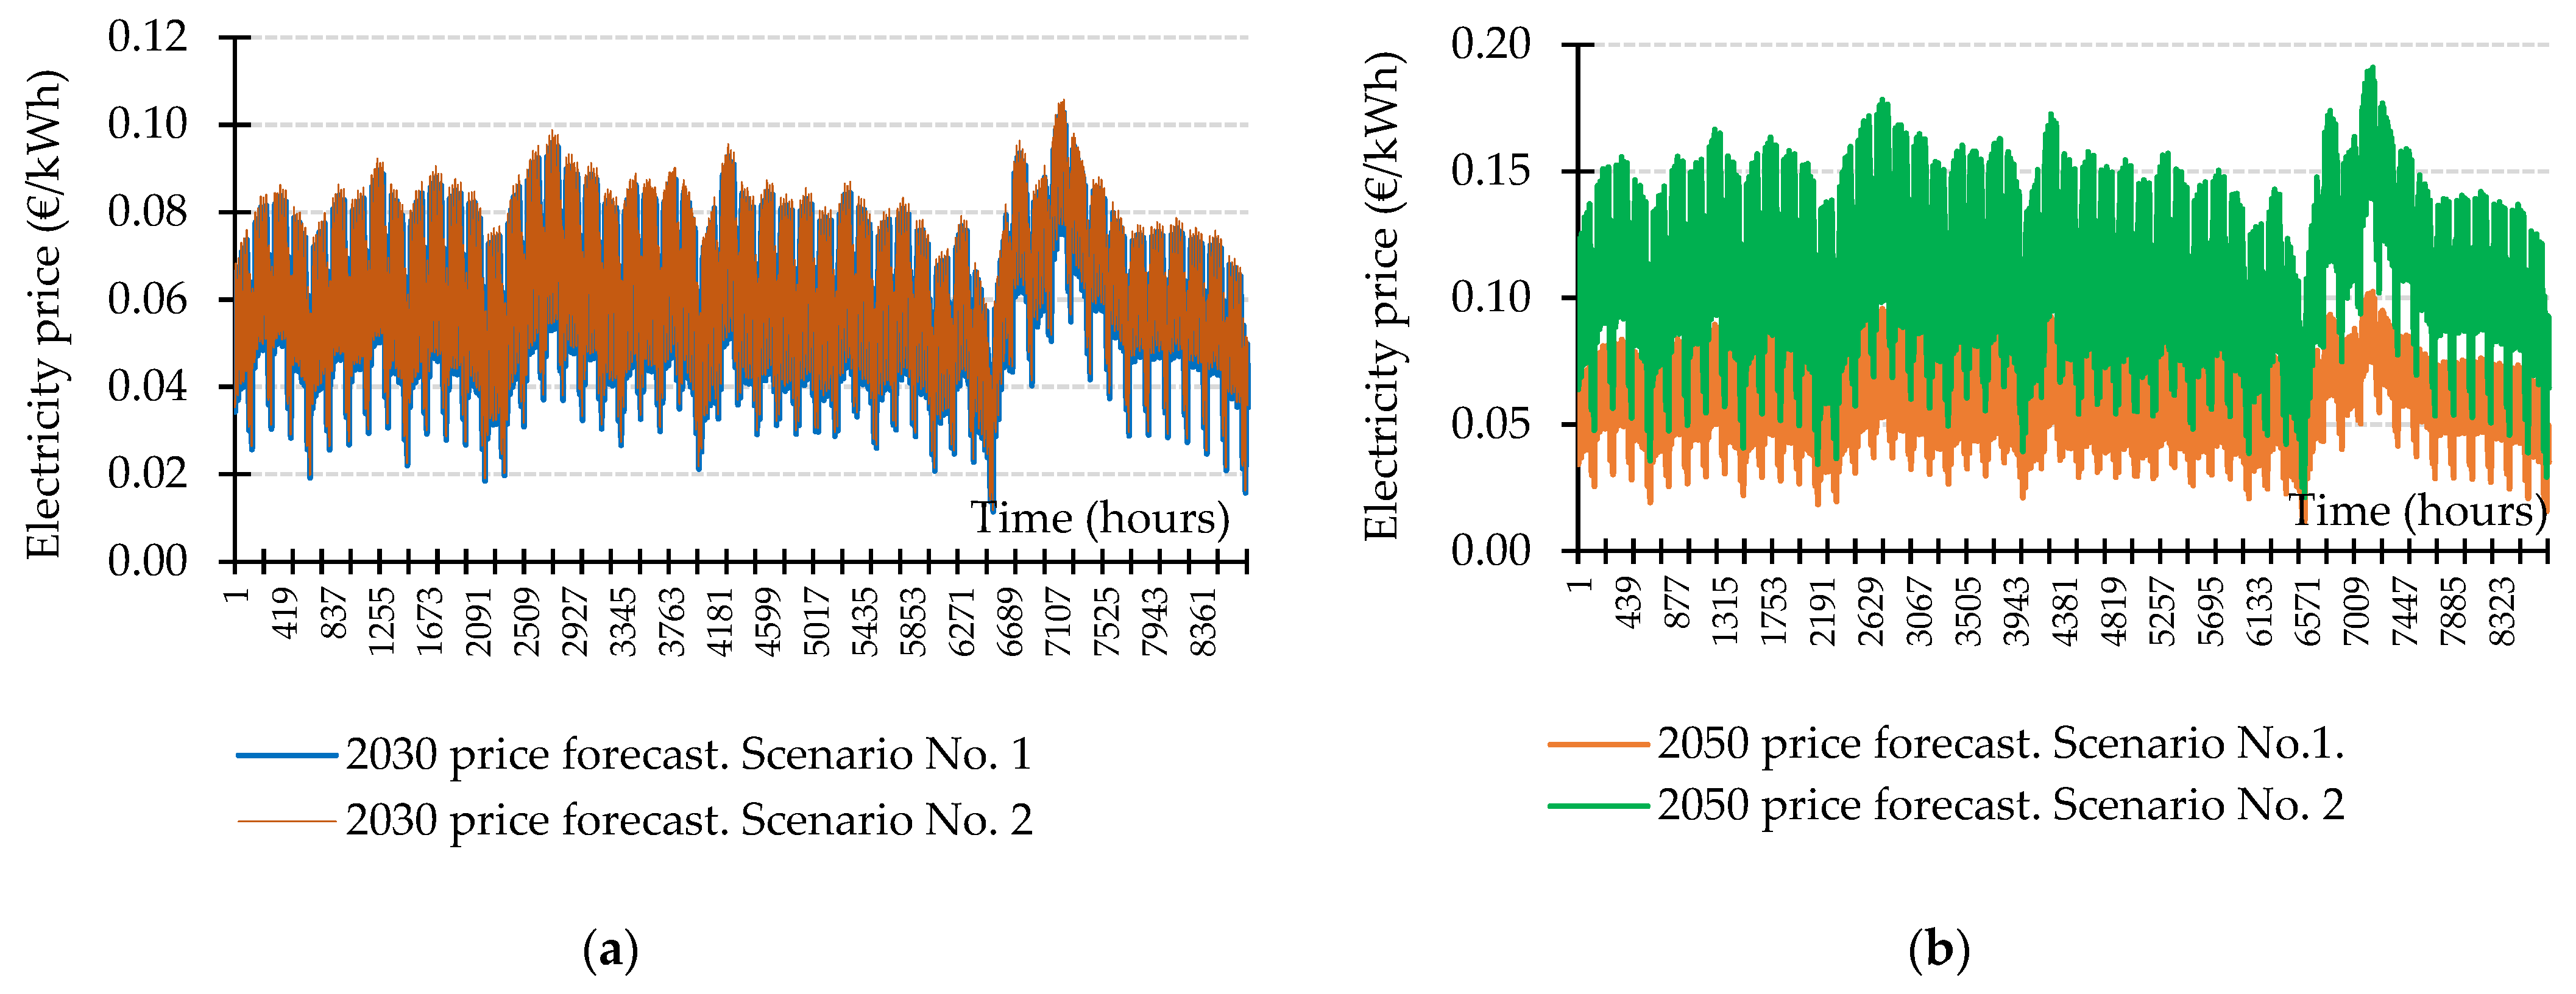
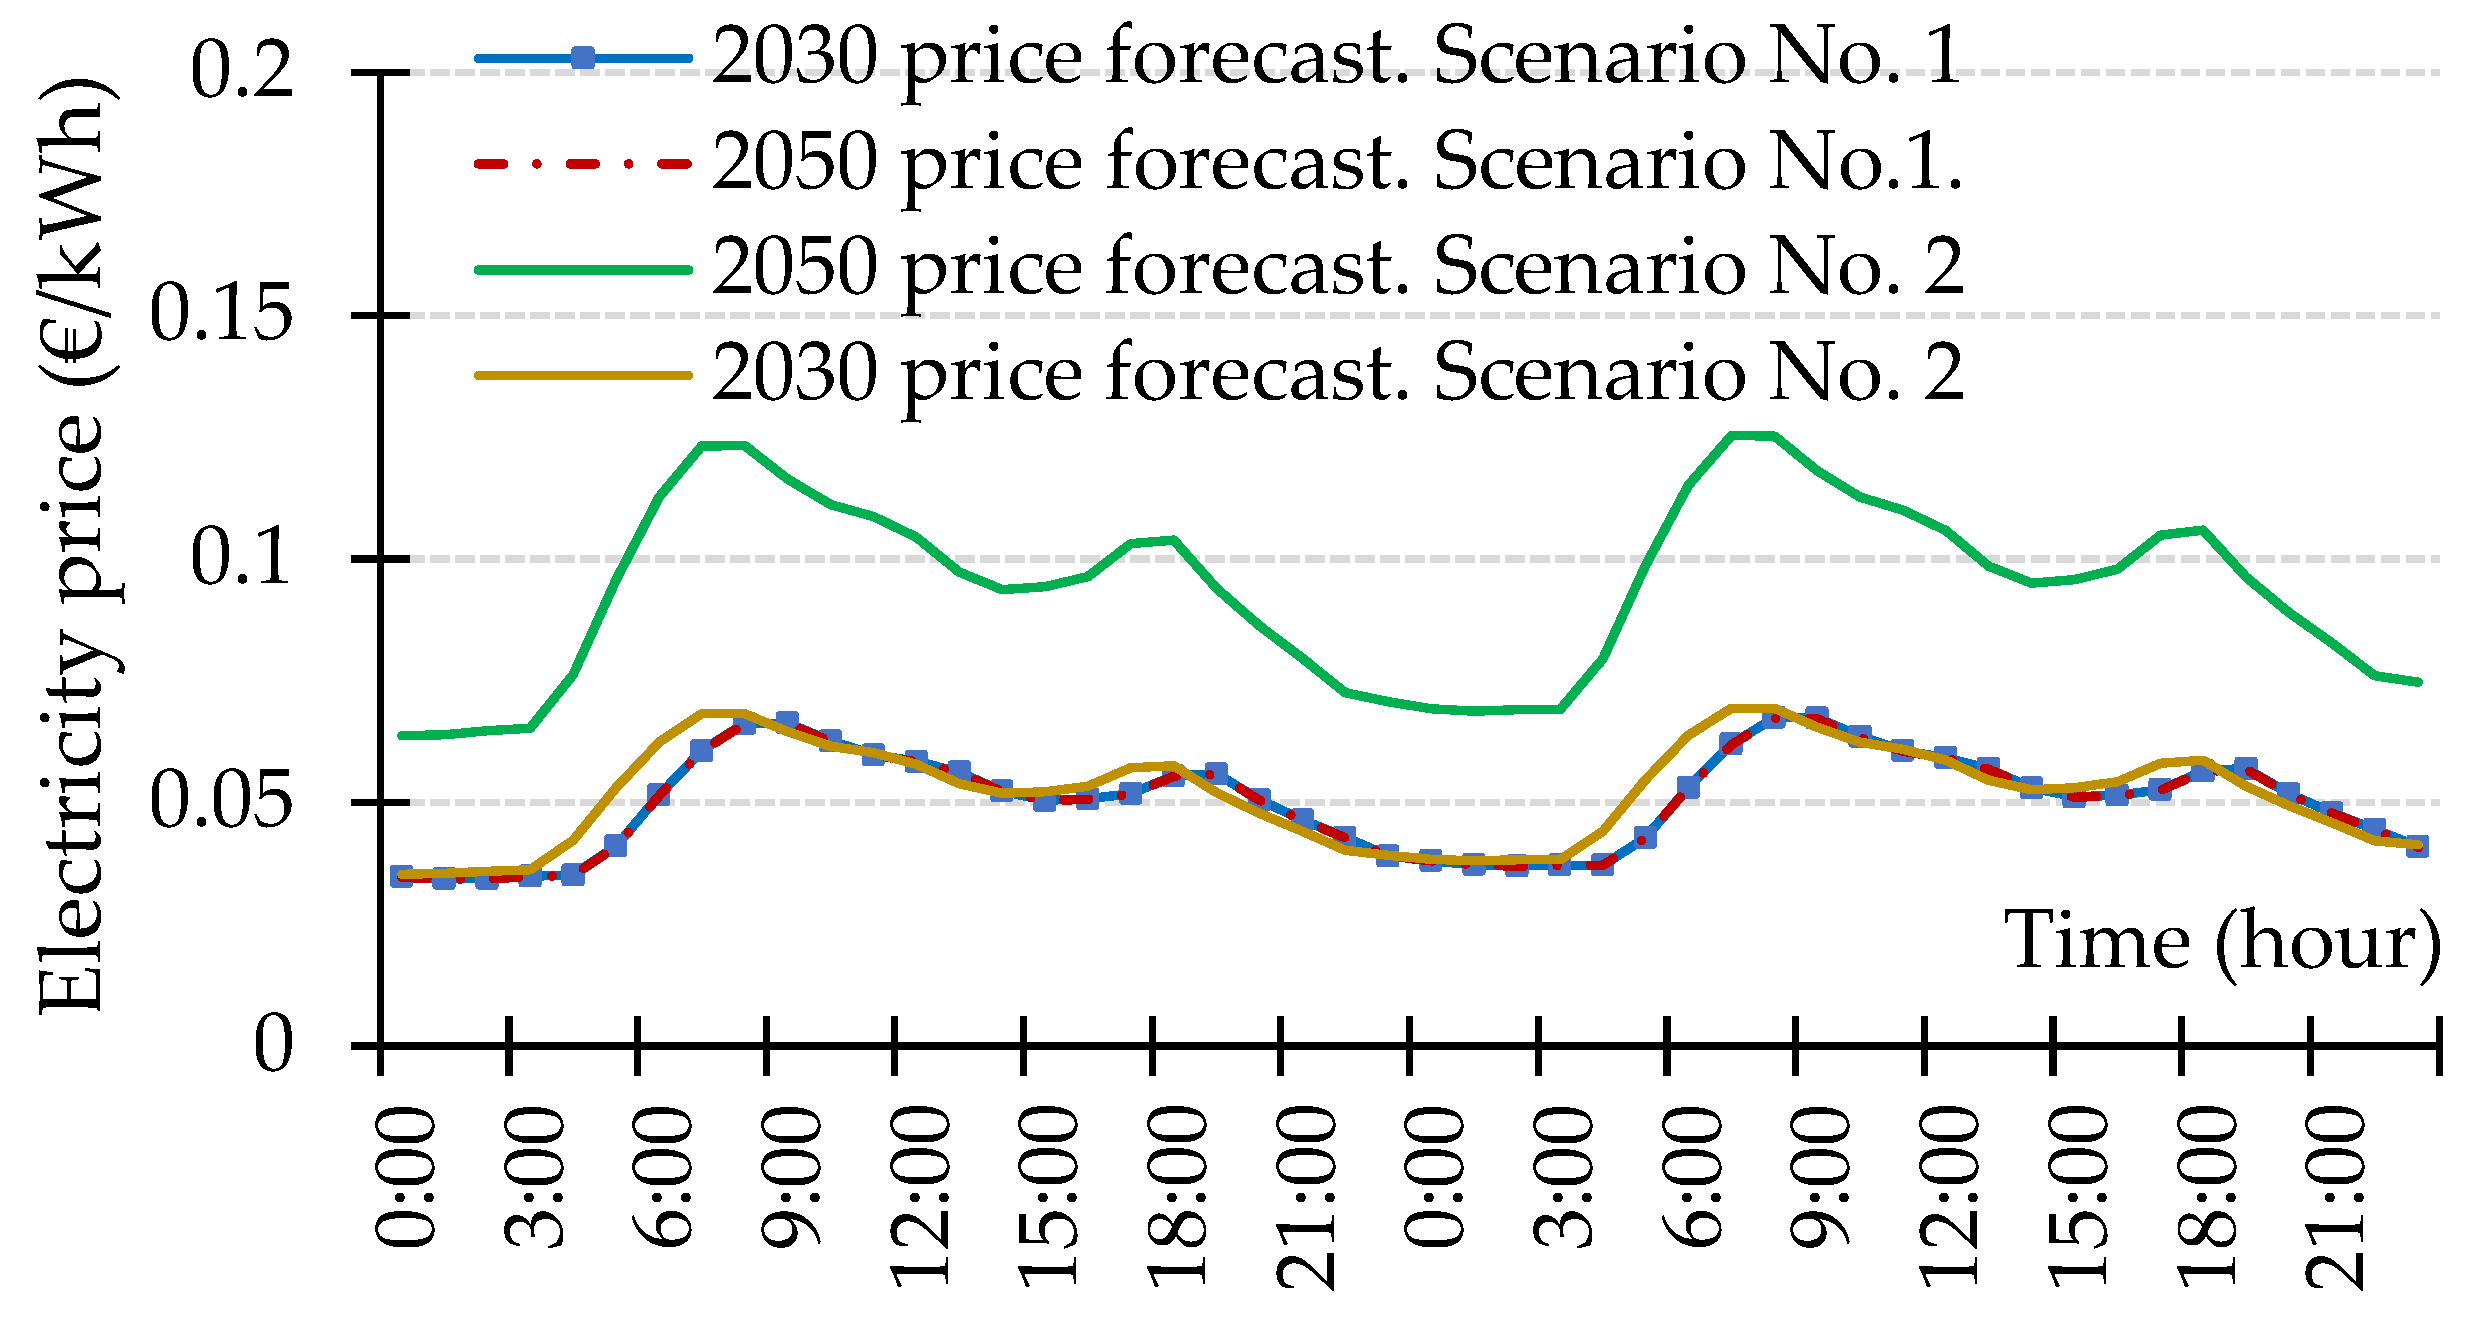
The authors take a more detailed look into electricity price forecasts for two points in time—the year 2030 and the year 2050.
Figure 5 shows the forecast of the electricity price in Latvia. The average electricity price in 2030 for Scenario 1 is 0.0604 €/kWh (by 11.2% higher than in 2025) and the corresponding value in 2050 is 0.0603 €/kWh (by 11% higher than in 2025). The average electricity prices for Scenario 2 are 0.0621 €/kWh and 0.112 €/kWh, which is 13.6% and 52.24% more, respectively, as compared with the year 2025.
As the electricity price forecast according to Scenario 1 is difficult to see in
Figure 5,
Figure 6 provides a fragment of the forecast (01.04–2.04), which underlines the difference between the price growth scenarios.
Figure 6 shows that electricity prices under Scenario No. 1 almost coincide, with a difference of 0.20%. This difference can be explained by the fact that the forecast, according to the SKM Market Predictor was made in 2019 before the COVID-19 pandemic, and no significant increase in average annual prices was forecast and planned. In contrast, in scenario No. 2, the price difference is clear (around 45%).
It is worth noting that according to Nord Pool data, the average price for 2020 was 0.03405 €/kWh, but in 2021 (01.01.2021–03.11.2021) it is already equal to 0.0732 €/kWh, which is almost two times more. According to forecast Scenario No. 2, a similar average value will be reached in 2035–2036 years (0.0721 €/kWh, 0.0743 €/kWh).
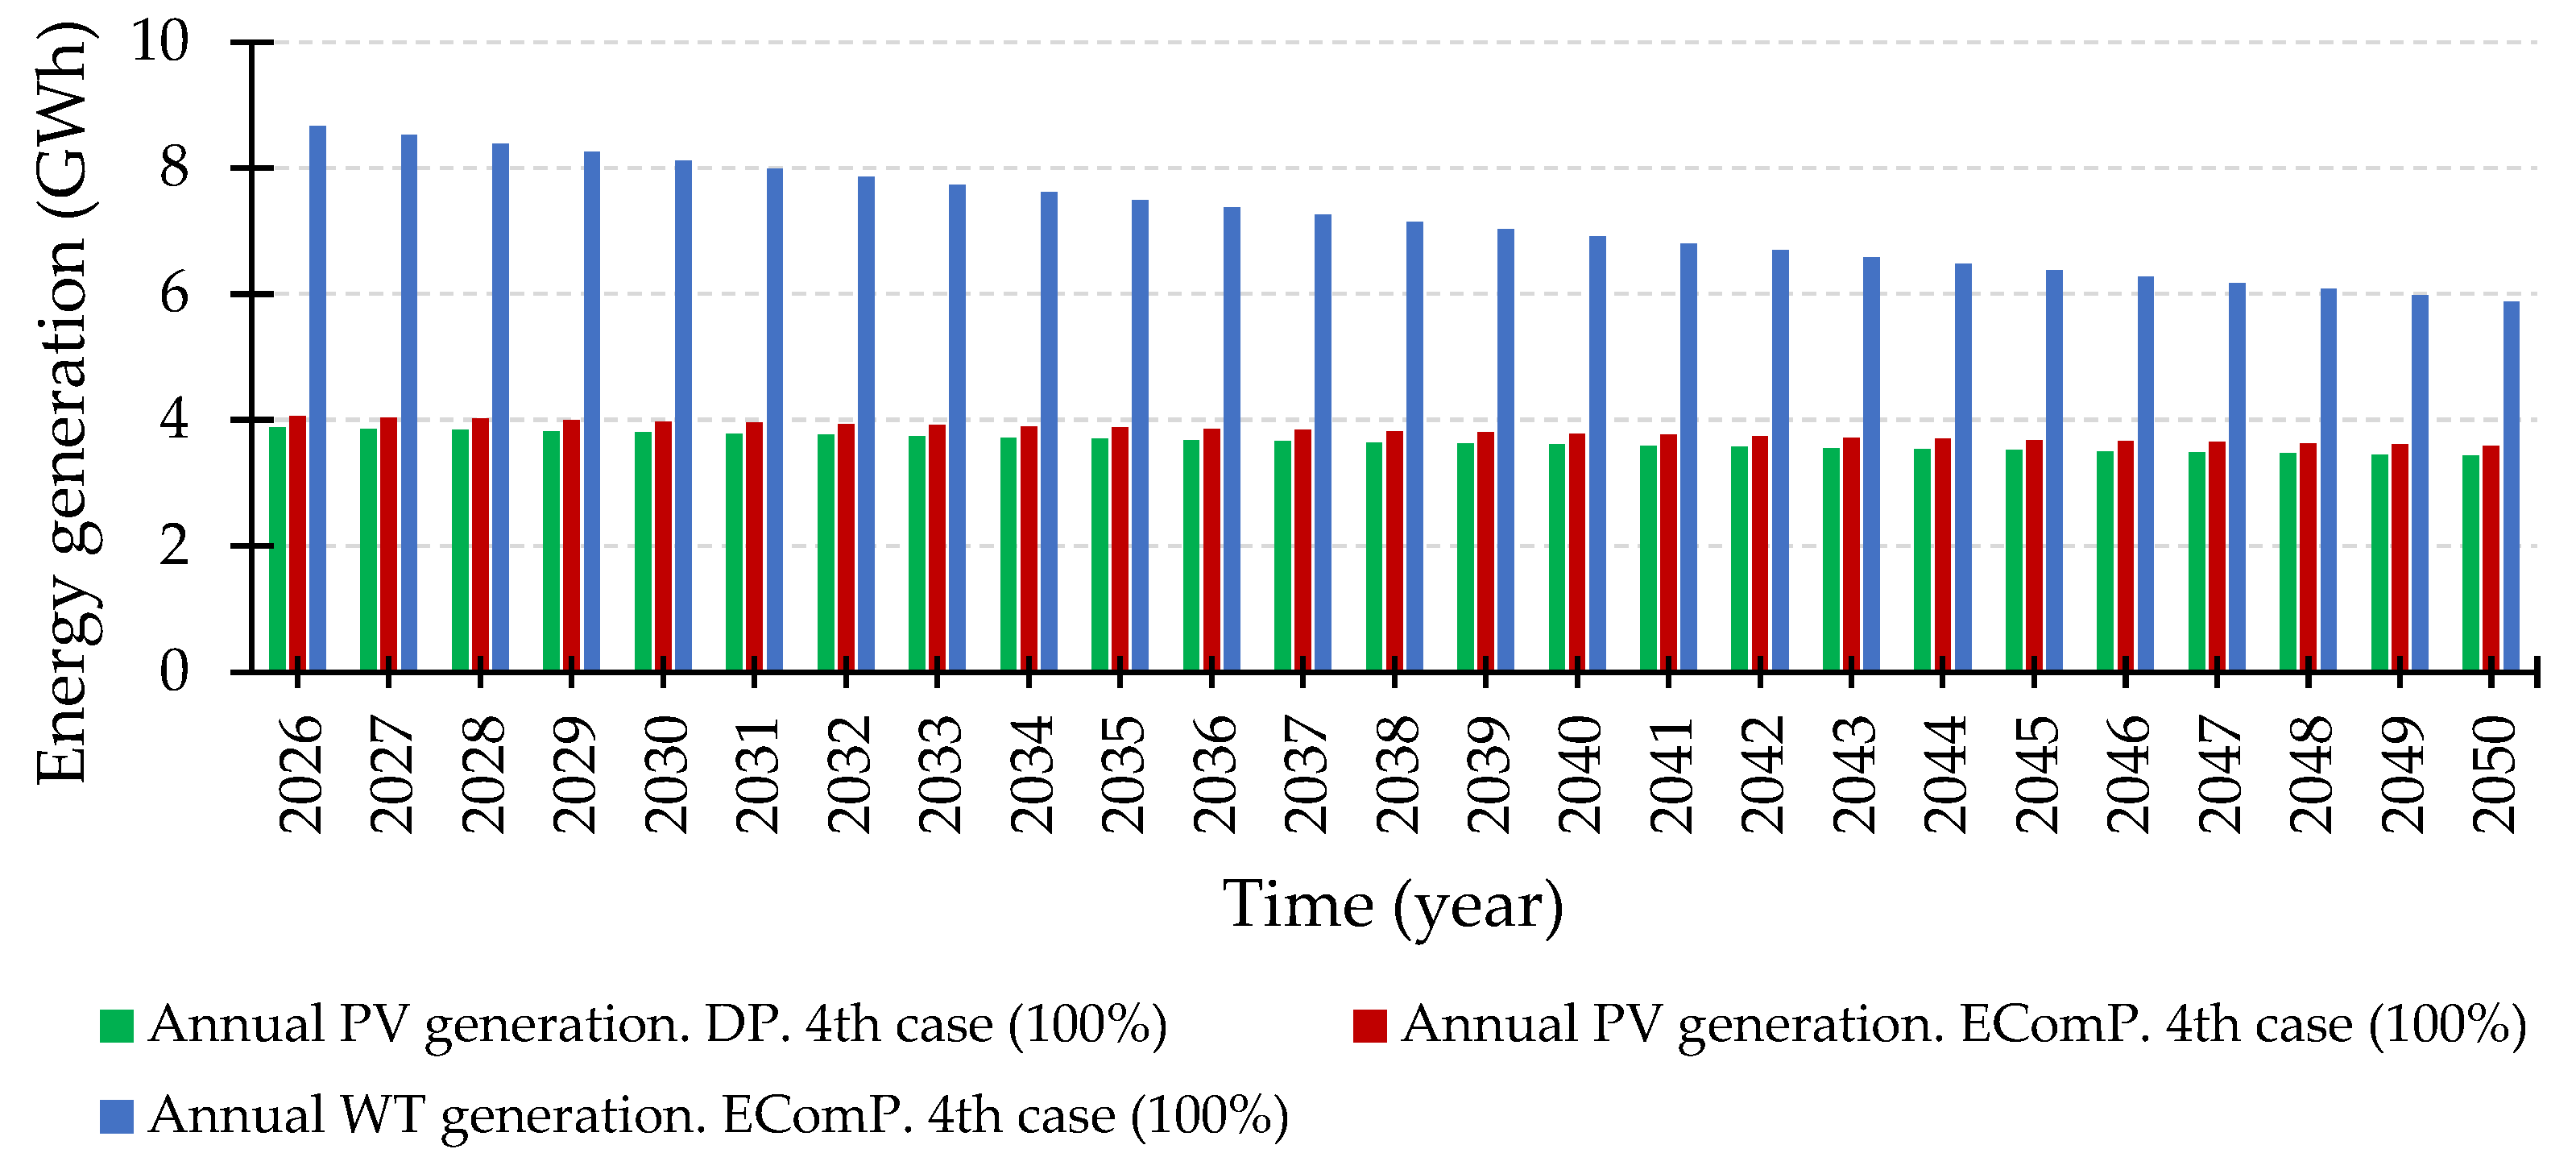
An evaluation of solar and wind generation is made based on the amount of annual PV generation from rooftop panels and a solar power plant, as well as the amount of generation of the wind power plant (
Figure 7). This figure demonstrates the fourth case, when the percentage of prosumers in the considered distribution layout is 100%.
Upon analyzing the forecasts regarding the amount of electricity generated in PV generation, it can be said that at the end of the planning period, the forecast amount of generated electricity diminishes by 11.3% because of degradation of solar cells; in the case of wind generation, the drop is 47.27%. This means that self-consumption also diminishes. The difference between rooftop solar panel generation and generation at solar power plant generation is 4.4%. Compared with generation at a wind power plant, a large difference is observed. For example, in 2026, the generation at a wind power plant is 8.6 GWh, whereas at a solar power plant, the generation is only around 4.1 GWh. Although wind is an unstable RES, wind power plants can generate electricity both in the daytime and at night, as well as on sunless days.
3.4. Results of Assessing the Profitability of RES Equipment
The results obtained from all scenarios are also summarized in
Table 2.
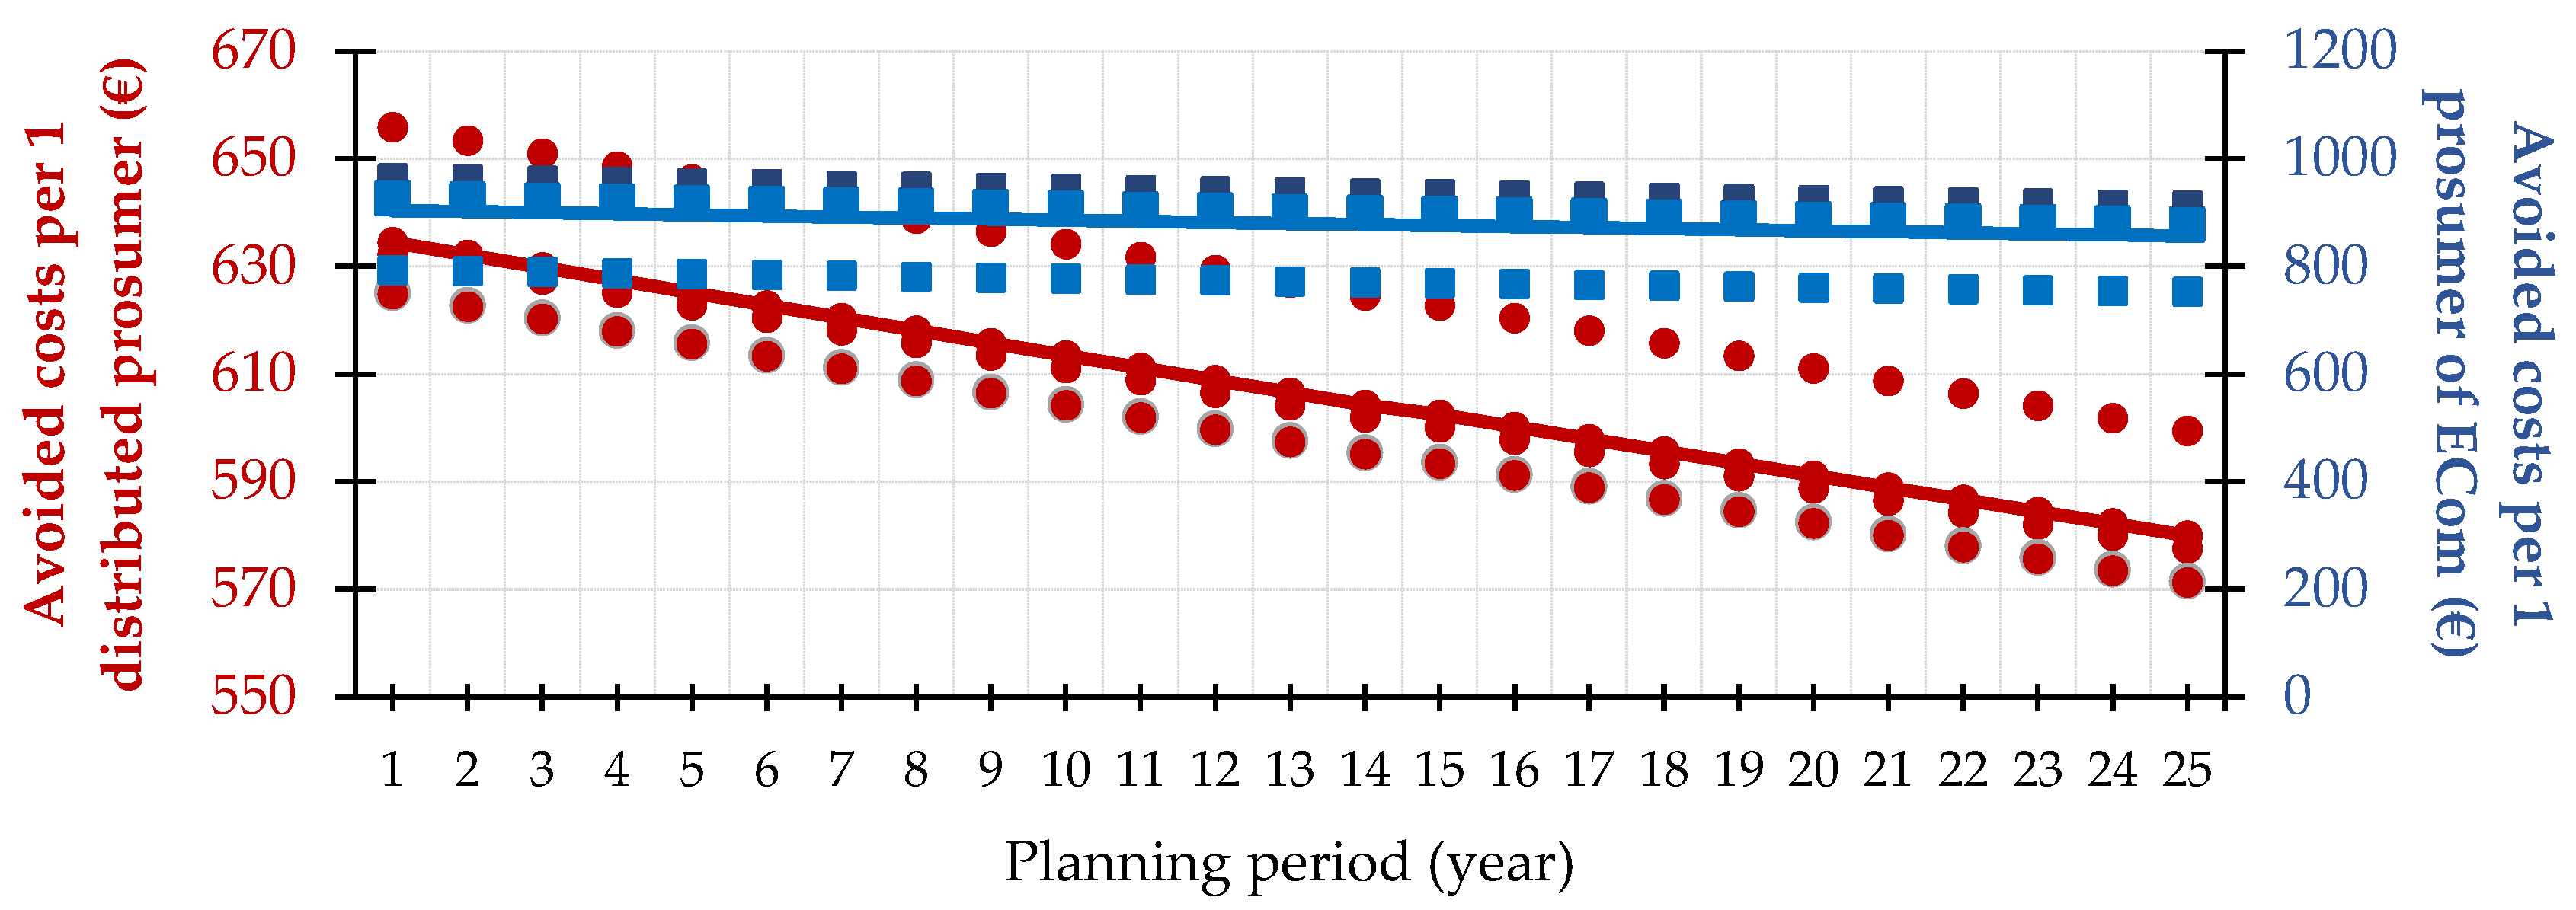
The avoided costs from PV installations by year are given in
Figure 8 for both options: DP and EComP. Results are shown per prosumer.
Figure 8 shows the range of AC per one prosumer (red dots) as well as the average annual AC (red line). These values show the extent to which the NMS is beneficial to prosumers, and how much it saves per year compared to the situation without PV installations. Blue dots indicate the range of AC for an EComP. The blue line shows the average annual AC. As can be seen from the graph, the AC in both cases differ significantly, by 29.79% to 32.27%. This difference is based on the annual amount of PV generation (
Figure 7).
First, the authors take examine the values of the IRR. The difference between the IRR and the discount rate (in our case, 1.4%) reflects the effect of investment activities (the efficiency of business activity). From
Table 2, it can be concluded that the investments pay off in the observed scenarios. The IRR ranges from 4.72% to 19.74%.
A detailed analysis will be applied to the results of the fourth case when the share of prosumers is 100% (Scenarios Nos. 7, 8, 21, 22, 23, and 24). For the scenarios studied, the authors have the following LCOCE values for the base scenarios (Nos. 7 and 8): 0.1221 €/kWh (the 1st scenario of the electricity price forecast is applied) and 0.1283 €/kWh (the 2nd scenario of the electricity price forecast is applied). When applying the NMS to prosumers who own the rooftop installations (DP) and prosumers who are EComP, LCOCE decreases slightly: for DP (Scenarios Nos. 21 and 22), LCOCE varies over the range of 0.109–0.120 €/kWh, while for EComP (Scenarios Nos. 23 and 24) it varies over the range of 0.095–0.104 €/kWh. The LCOCE results achieved by the prosumers testify to the efficiency provided by installing PV equipment.
The advantages of solar ECom can be confirmed by comparing LCOCE values: for Scenario 23 without a loan, communities show the LCOCE that is by 14.7% lower than the LCOCE of individual prosumers (0.109 €/kWh) (Scenario 21 without a loan). With a loan, this difference increases—17.17%. A similar tendency can be seen when comparing the scenarios of Nos. 22 and 24: communities result in a LCOCE that is 13% lower than the total LCOCE of the DP without taking a loan. If a loan has been taken, the LCOCE difference between the community and the individual prosumer increases by 15.38%.
The payback period for the capital investments of PV equipment will vary from 6 to 19 years. The highest NPV is reached in Scenario 24 (an energy community; 100% prosumer share; no loan is taken, and the second variant of electricity price is used), namely, 6.98 million € in 2050. The payback period is seven years. The lowest NPV is reached in Scenario 9 (a prosumer who owns rooftop PV installations; 30% prosumer share; a loan is taken, and the first variant of electricity price is used), namely, 0.58 million € in 2050. The payback period is 18 years.
The paper’s results show that the ECom is a more profitable framework than the individually distributed prosumer. ECom development and implementation is a good opportunity to realize the goals of increasing the share of renewable energy and public interest in participating in the decarbonization of the energy system.
Next, the authors analyze the profitability of wind and solar communities in electricity markets. Community-based scenarios are as follows: 11, 12, 15, 16, 19, 20, 23, and 24 (
Table 1). The results obtained in all the community-based scenarios and are summarized in
Table 3.
The payback period for the capital investments in the plants vary from five to nine years. The highest NPV is reached in Scenario 24 (a prosumer which is a wind ECom; 3.49 MW; no loan is taken, and the second variant of electricity price is used)—8.88 million € in 2050. The payback period is seven years. The lowest NPV is reached in Scenario 11 (a prosumer which is a solar ECom; 1.03 MW; a loan is taken, and the first variant of electricity price is used)—2.16 million € in 2050. The payback period is seven years.
From
Table 3, it can be concluded that investments pay off in the observed scenarios. The IRR varies from 12.30% to 21.95%.
Next, the authors analyze, in detail, the results of scenarios Nos. 23 and 24, when the capacity of the community is 3.49 MW. For the wind ECom scenarios, the authors have the following range of LCOCE values: 0.088…0.098 €/kWh, whereas for the solar ECom the values are from 0.095 €/kWh to 0.104 €/kWh. Yet, the LCOCE results reached by the communities testify to the effectiveness of installing RES equipment.
3.5. The Results of the Assessment of Energy Losses of PV Equipment
To compare the performance of DP vs. EComP in terms of power and energy losses, nine cases were elaborated. Their description is given in
Table 4. In terms of grid configuration and compositions of DPs and EComPs, these cases correspond to the cases described in
Table 1. References to the cases from
Table 1 are given in the second column of
Table 4.
The power flow calculations were performed in GridLAB-D software with the three-phase current injection NR and BFS methods (see
Section 2.3), while PV installations were treated as negative generation. Both methods demonstrated good convergence, and their outputs are almost identical. The results of the calculations of energy losses (active, reactive, and total), energy generation from PV installations of DP and EComP, and energy consumption of the consumers of the power system are demonstrated in
Table 5. The share of energy losses related to the total energy demand is shown in the last column.
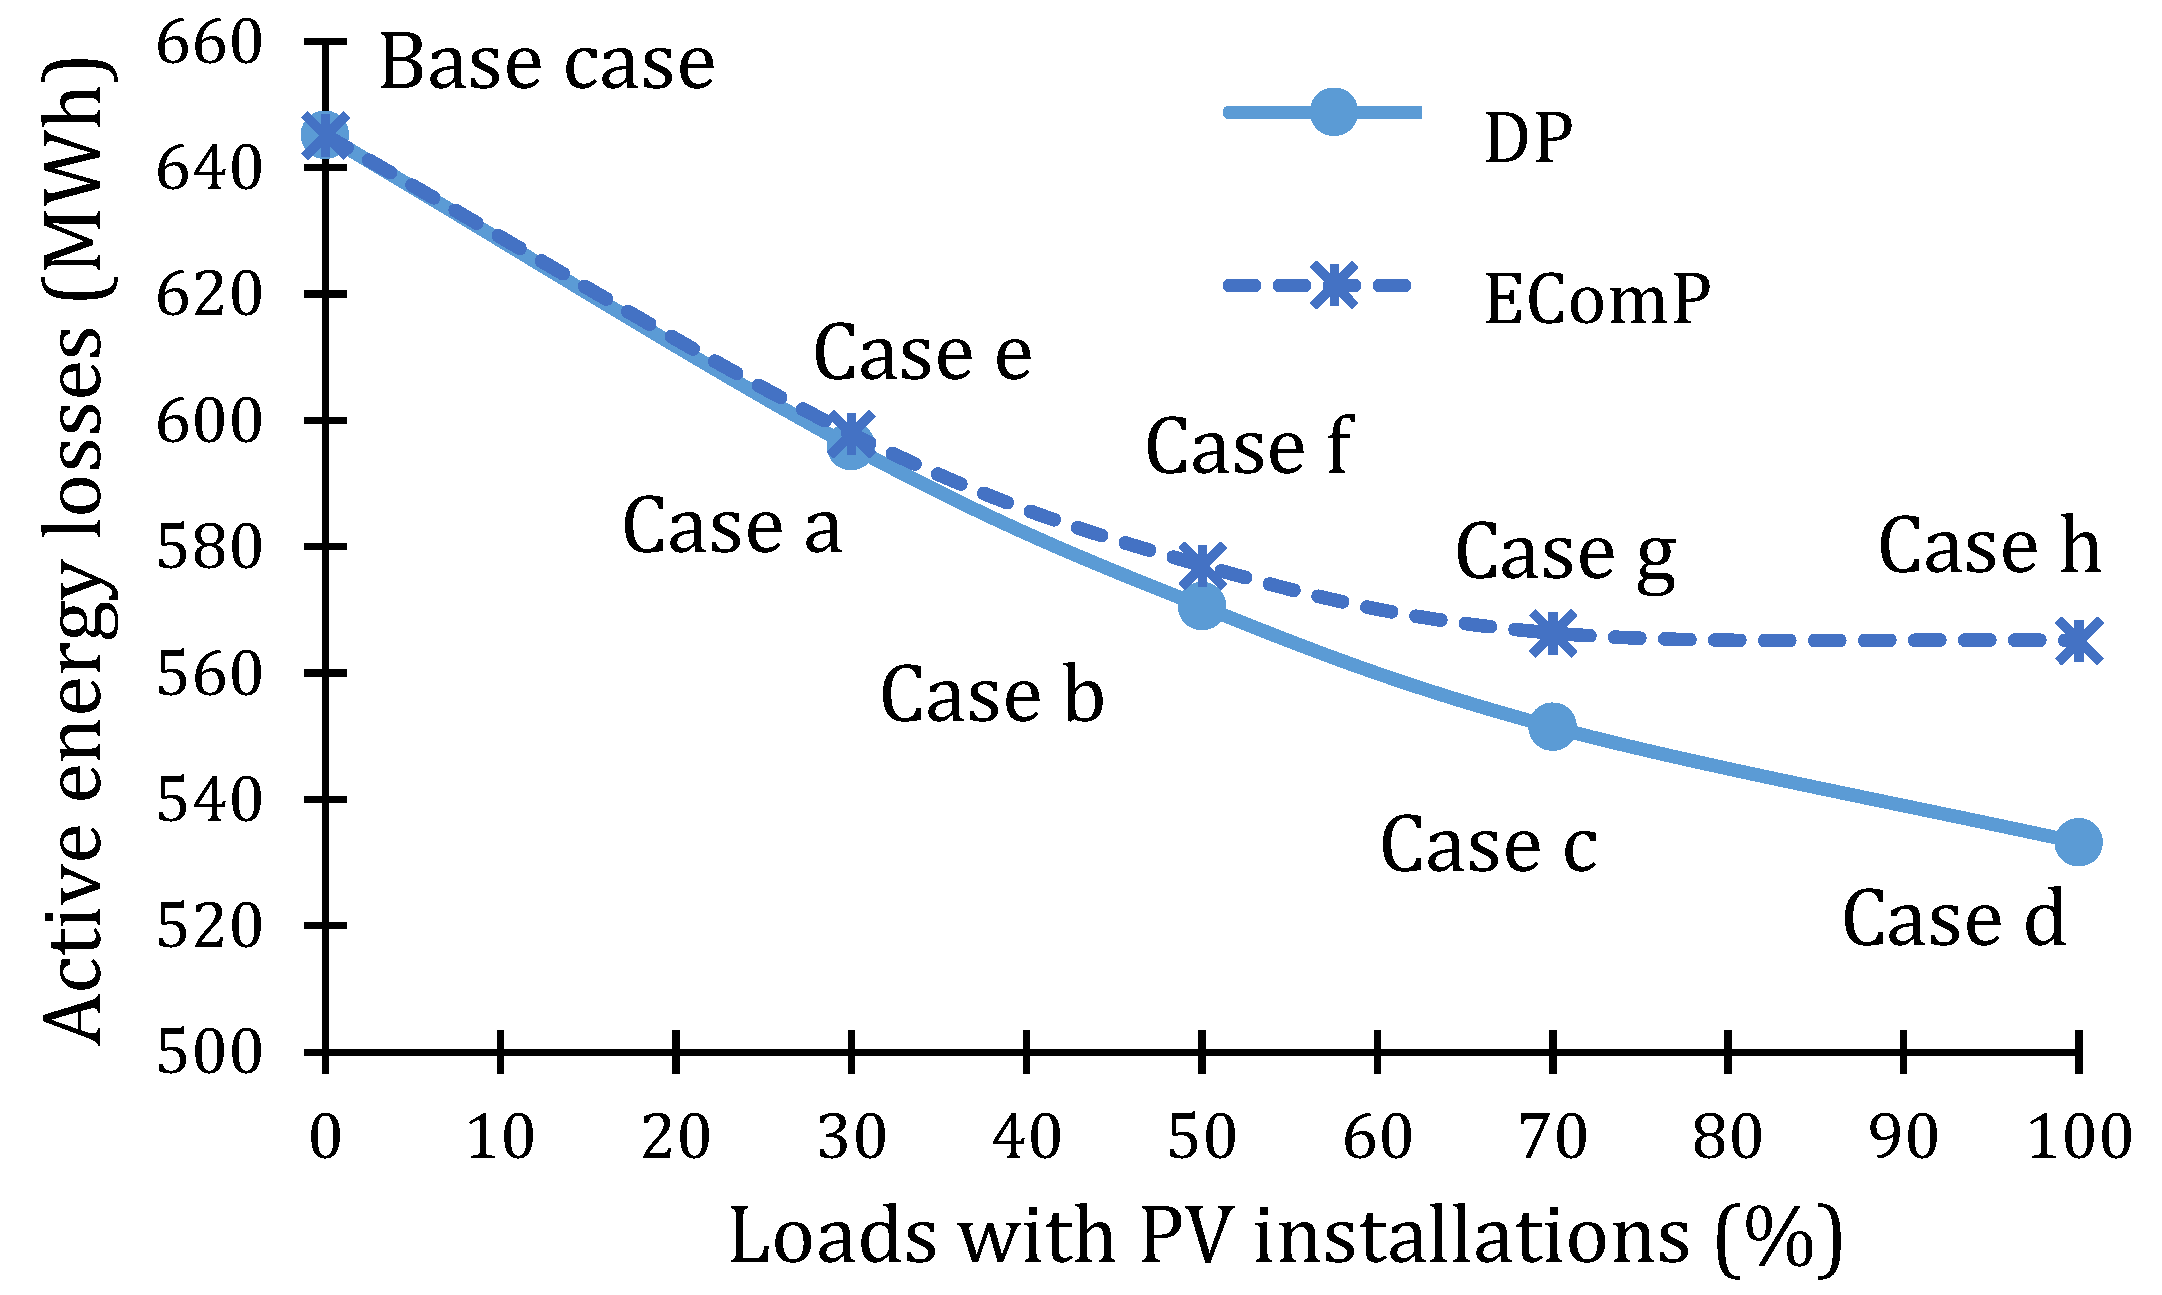
The results of yearly active energy losses estimation for DP and for EComP are visualized in
Figure 9. As it can be seen, the energy losses are lower for DP.
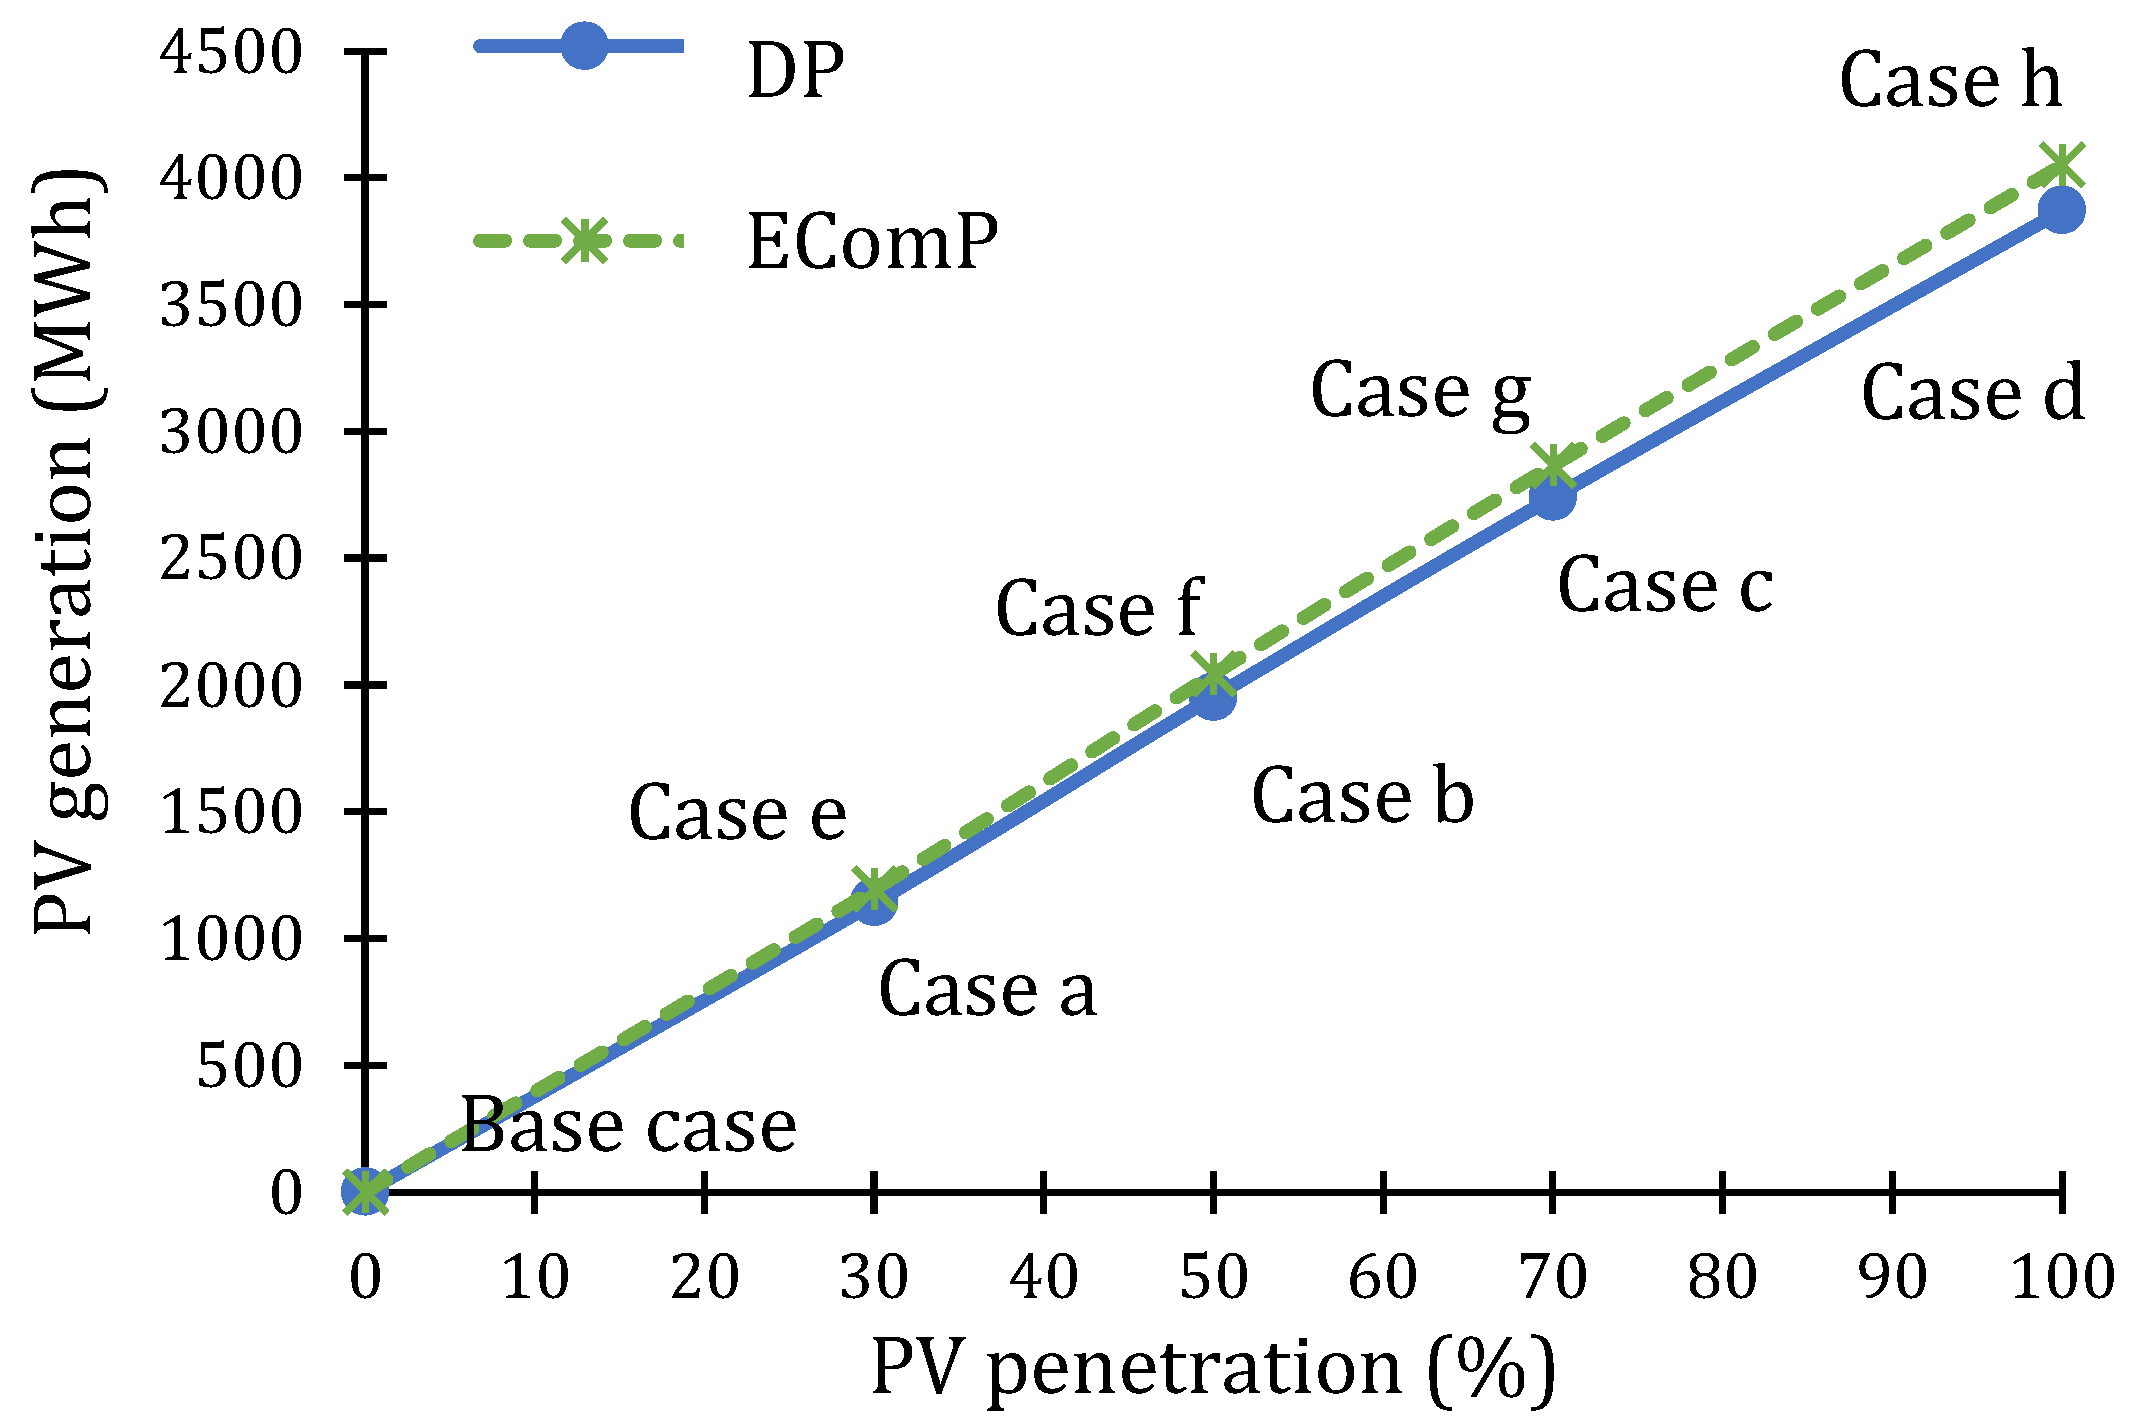
Figure 10 displays the PV output for different scenarios. PV generation for ECom is generally higher, since total interconnection losses (including inverters, efficiency rates) for ECom is 10% vs. 14% for individual DP.
As can be seen from
Table 5 and
Figure 10, with increasing penetration of DP and EComP with RES, energy losses are constantly decreasing. Yet, this trend is more outspoken for prosumers: at 100% PV penetration level, prosumers with individual PV installations help to decrease energy losses by 0.85% compared to the base case, while an EComP of the same installed power contributes to the decrease in energy losses only by 0.65%.
Assuming that a tariff for electricity distribution services is 0.025 €/kWh [
82], an economic assessment of the reduction of energy loss due to the deployment of PV generation units can be performed. Here, the only considered cases are when PV penetration is 100% of the rated power of each prosumer, and the ECom is located in the node 160. The results are given in
Table 6.
Reduction in the costs of power losses was calculated for a one-year period in €. In terms of losses reduction, the most preferable scenario is when all of the consumers are prosumers (i.e., DP, scenarios through a to d), and the capacity of their rooftop PV installations is 100% from the prosumers’ rated power (loading). About 2800 € can be saved, compared to the base case. Scenarios with EComP (i.e., scenarios through e to h) demonstrate higher power losses, and the reduction in the costs of losses is smaller. If the installed power of the EComP is 100% of the total rated power of the loads, about 2000 € can be saved.
4. Conclusions
The assessment and comparison of two approaches to renewable energy resource adoption and ownership by the end-users has been performed. This problem is formulated as a multiple criteria optimization problem. The paper’s results show that the ECom is a more profitable framework than the individual distributed prosumer. According to the results obtained, the payback period of a solar power plant of a solar ECom is from seven to nine years. The payback period for a PV installation for DPs is between 13 and 18 years depending on the scenario, resulting in zero revenue for these periods. However, EComP revenue during this time is 2.66 million euros (for 13 years) and 3.96 million euros (for 18 years). In addition, the LCOCE of EComP is 13…17.17% less compared to the total LCOCE of distributed prosumers.
The results show that the energy losses in the power distribution system are slightly higher for the case of energy communities rather than individual prosumers, yet the difference is insignificant.
However, there are barriers to creating energy communities in practice. Relatively large initial investments are required, and the implementation of projects depends on administrative and technical capacity, and on national regulations. Regulatory barriers shall be removed to enable participation of prosumers and distribution system operators to the EComs, as it will benefit all the stakeholders and facilitate economically efficient energy transition.
The issue of the future of EComs is crucial for Latvia, as it can be expected to have an impact on the economy as a whole and on all its sectors.
The results of this study could be adopted by decision-makers, such as government agencies, companies, and PV and wind turbine owners, and they are recommended for potential investors for the development of EComs.


