Article

Retrofitting Strategies Based on Orthogonal Array Testing to Develop Nearly Zero Energy Buildings

College of Engineering and Technology, Jilin Agricultural University, Changchun 130118, China
*
Author to whom correspondence should be addressed.
Sustainability 2022, 14(8), 4451; https://doi.org/10.3390/su14084451
Submission received: 11 March 2022 / Revised: 4 April 2022 / Accepted: 6 April 2022 / Published: 8 April 2022

Abstract

:
Retrofitting existing buildings to be a nearly zero energy building (nZEB) is an effective solution for greenhouse gas emissions and primary energy consumption reduction. A hybrid approach that integrates the building energy simulation method and orthogonal array testing (OAT) to renovate buildings to nZEB is proposed in this paper. Within a residential building in Changchun, Jilin of China, the total energy consumption index (TECI) and CO2 emission factor for heating are used as evaluation criteria. The reliability of the building energy model is validated and adopted to forecast the energy performance of different building renovation strategies. According to OAT, four passive measures can be ranked by their influence on TECI in descending order as follows: external wall heat transfer coefficient, airtightness, window heat transfer coefficient, and roof heat transfer coefficient. The optimal renovation solution of the studied building can reduce the TECI by 43.18% by only reducing the external wall heat transfer coefficient from 0.5 to 0.2 W/m2·K and the infiltration N50 from 3.6 to 0.4 ac/h. Besides, combined heat and power (CHP) utilities emit less CO2 than heat pumps in providing heating under the current CO2 emission factor of the power grid in China, making it impossible to give up district heating systems until carbon emissions of electricity generation have declined significantly. The results can provide a reference for the application of the nZEB standard in actual retrofitting projects.

1. Introduction

In modern society, buildings are responsible for a significant amount of energy consumption and CO2 emissions [1,2,3]. For example, in the European Union, buildings account for about 40% of total primary energy consumption and emit around 36% of the CO2 emission [4,5,6]. In China, buildings now account for 44.7% of the national energy usage and more than 33% of the annual carbon emission due to the rapid urbanization in recent decades [7,8,9,10]. Therefore, researchers are seeking measures that can increase the energy efficiency and decrease the energy demand of buildings. Zero energy buildings (ZEB) have been widely studied because of their advantage in energy-saving and environmental protection and have been regarded as a promising solution [11,12,13].
Since first proposed in the 1970s, ZEB has developed rapidly in different regions [14]. The ZEB standard set by the Passive House Institute of Germany requires a “passive house” to have a heating demand and a total primary energy consumption less than 15 and 120 kWh/m2·a, respectively [15]. In South Korea, the “2050 Carbon Neutral Strategy” requires all new public buildings built after 2020 to comply with its ZEB standards [16]. The U.S. aims to achieve zero net greenhouse gas emission from commercial building by defining buildings with zero net energy [17]. The roadmap for Net Zero Energy (NZE) home [18] in Canada strikes a balance for a detached single-family house between energy production and consumption. Driven by the demonstration effects of Sino-German and Sino-US cooperation projects, China formally promulgated the national nZEB (nearly zero energy buildings) standard in 2019 (The Technical Standard for nearly Zero Energy Buildings) [19]. According to this document, nZEB must be able to (1) minimize energy demand through passive methods (e.g., high performance roof and wall insulation, airtightness design, sun shading, efficient window system, natural ventilation), (2) improve energy efficiency by active technologies (e.g., fresh air heat recovery system, temperature control appliances, efficient lighting), and (3) use renewable energy resources to meet remaining energy requirements (e.g., heat pumps, solar heating systems, photovoltaic panels).
Whereas these policies can be readily applied to new buildings for which the design stage already addresses the energy performance, existing buildings require dedicated retrofitting strategies that can improve their energy performance and ensure compliance with nZEB by changing their structures, energy systems, operations, etc. In Europe, approximately 90% of the existing buildings must be transformed into nZEB to decarbonize the building stock and improve energy efficiency [20]. According to the Energy Performance of Buildings Directive (EPBD) [21] of the E.U., which was amended in 2018 (2018/844/EU) to be an essential part of the renovation wave strategy, the annual energy renovation rate of buildings will be at least doubled by 2030. Besides, EU countries must establish strong long-term renovation strategies to decarbonize the national building stocks by 2050. The Passive House Institute (PHI) has developed the EnerPHit-Standard for adapting existing buildings [22]. Moran et al. [23] optimized the retrofitting plans for semi-detached and end-terraced houses in Ireland based on three indicators, i.e., energy efficiency, life cycle environment effects, and renovation cost, and found that deep retrofits were economically viable with policy encouragement and monetary subsidy. Hamburg et al. [24] measured the energy performance of a renovated apartment in Estonia and found that due to unexpected occupant behavior and operation schedules, the nZEB target is not achieved despite minimization of energy requirements. Indeed, the active cooperation of users plays a pivotal role in developing nZEB. Researchers have coupled the renovation toward nZEB with simulation-based optimization methods and theories [25,26,27]. Mateus et al. [28] analyzed the environmental and life cycle costs of retrofitting a house in Porto, Portugal and achieve nZEB by both adopting passive measures and installing solar thermal and photovoltaic panels. Ferrari and Beccali [29] assessed an energy retrofit of a representative public building in Italy toward nZEB by studying the influence of thermal insulation, mechanical ventilation with heat recovery, energy saving rates, costs, and greenhouse gas emissions.
China’s urbanization rate had increased from 37.7% in 2001 to 59.6% in 2018 [30]. The total urban building area has increased by one billion square meters every year since 2010 [31], which should be renovated to nZEB to reduce energy consumption and carbon emissions. Although the worldwide discussed case studies can guide the development of renovating existing buildings to nZEB in China, it is still worthwhile to explore the following issues.
(1)
How to ensure the reliability of the building energy model
Before using the simulation results to analyze appropriate nZEB renovation strategies, it is necessary to first ensure the validity and accuracy of the building energy model.
(2)
How to transform a building into a nZEB with minimal renovations.
In previous studies, buildings were converted to nZEB by adopting a variety of passive measures. However, some parameters (such as window to wall ratio and building orientation) are difficult to change in an existing building. Besides, reducing the workload of building renovation can reduce the difficulty of turning buildings into nZEB. Therefore, the ranking of the influences of different passive technologies on building energy efficiency should be studied to determine the retrofit solution with the least volume of work.
(3)
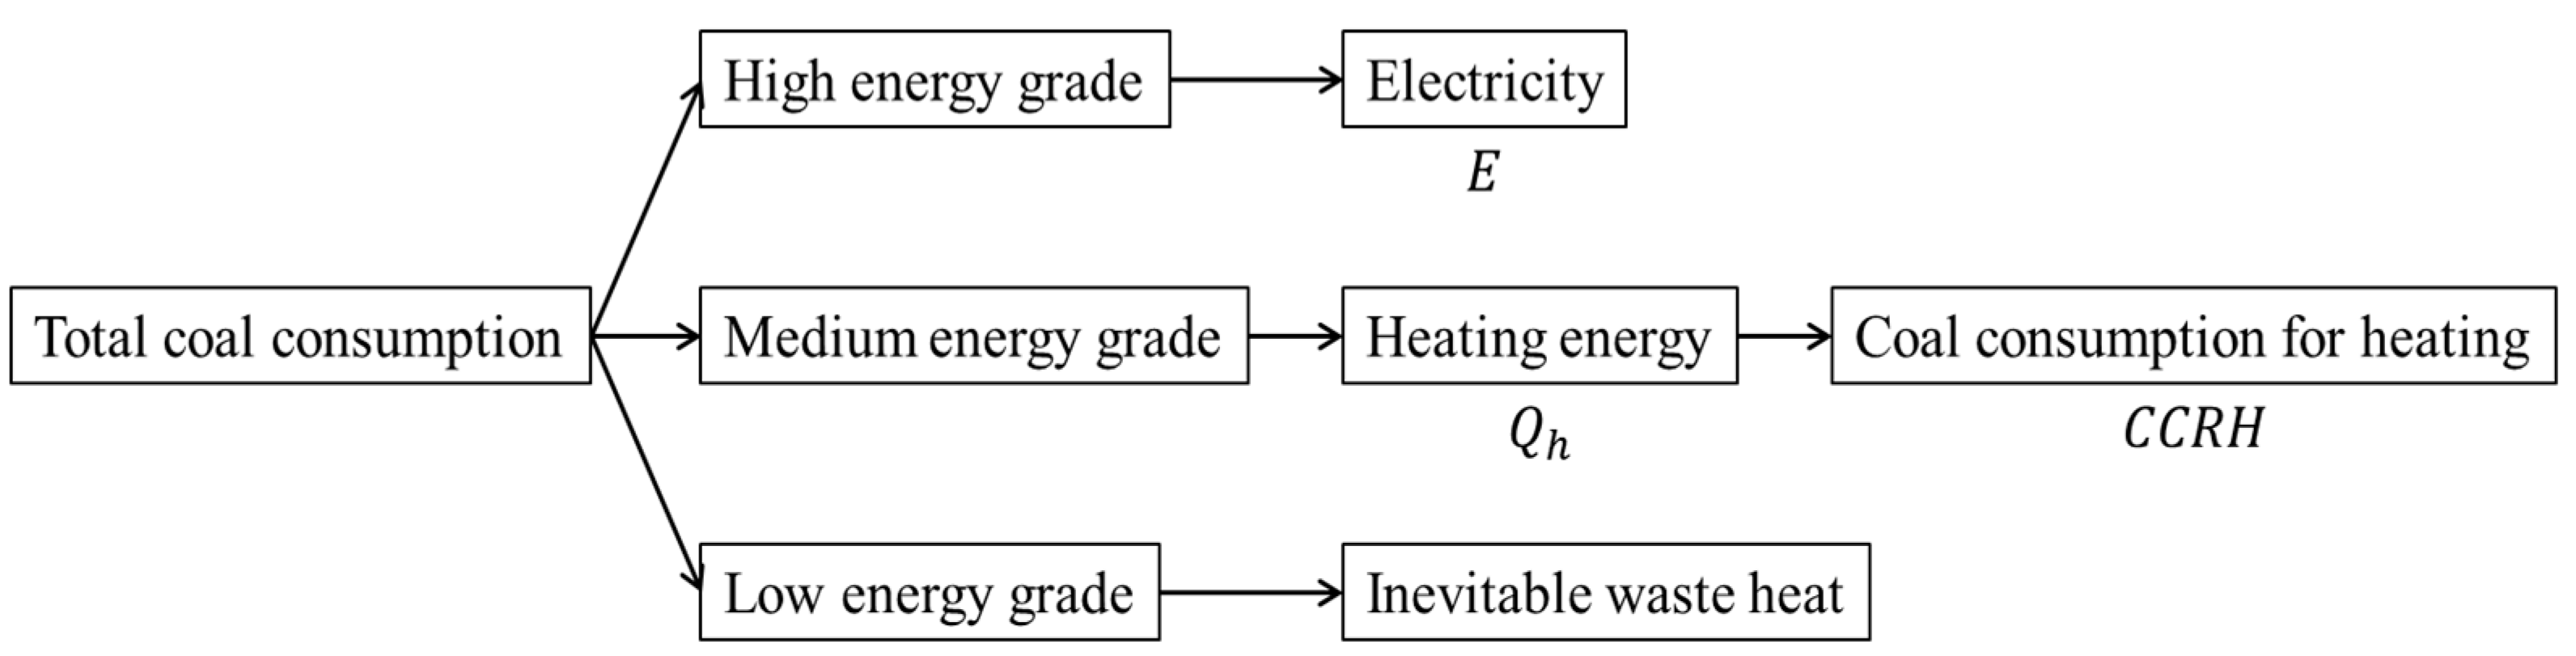
How to take full advantage of coal-fired power plants.
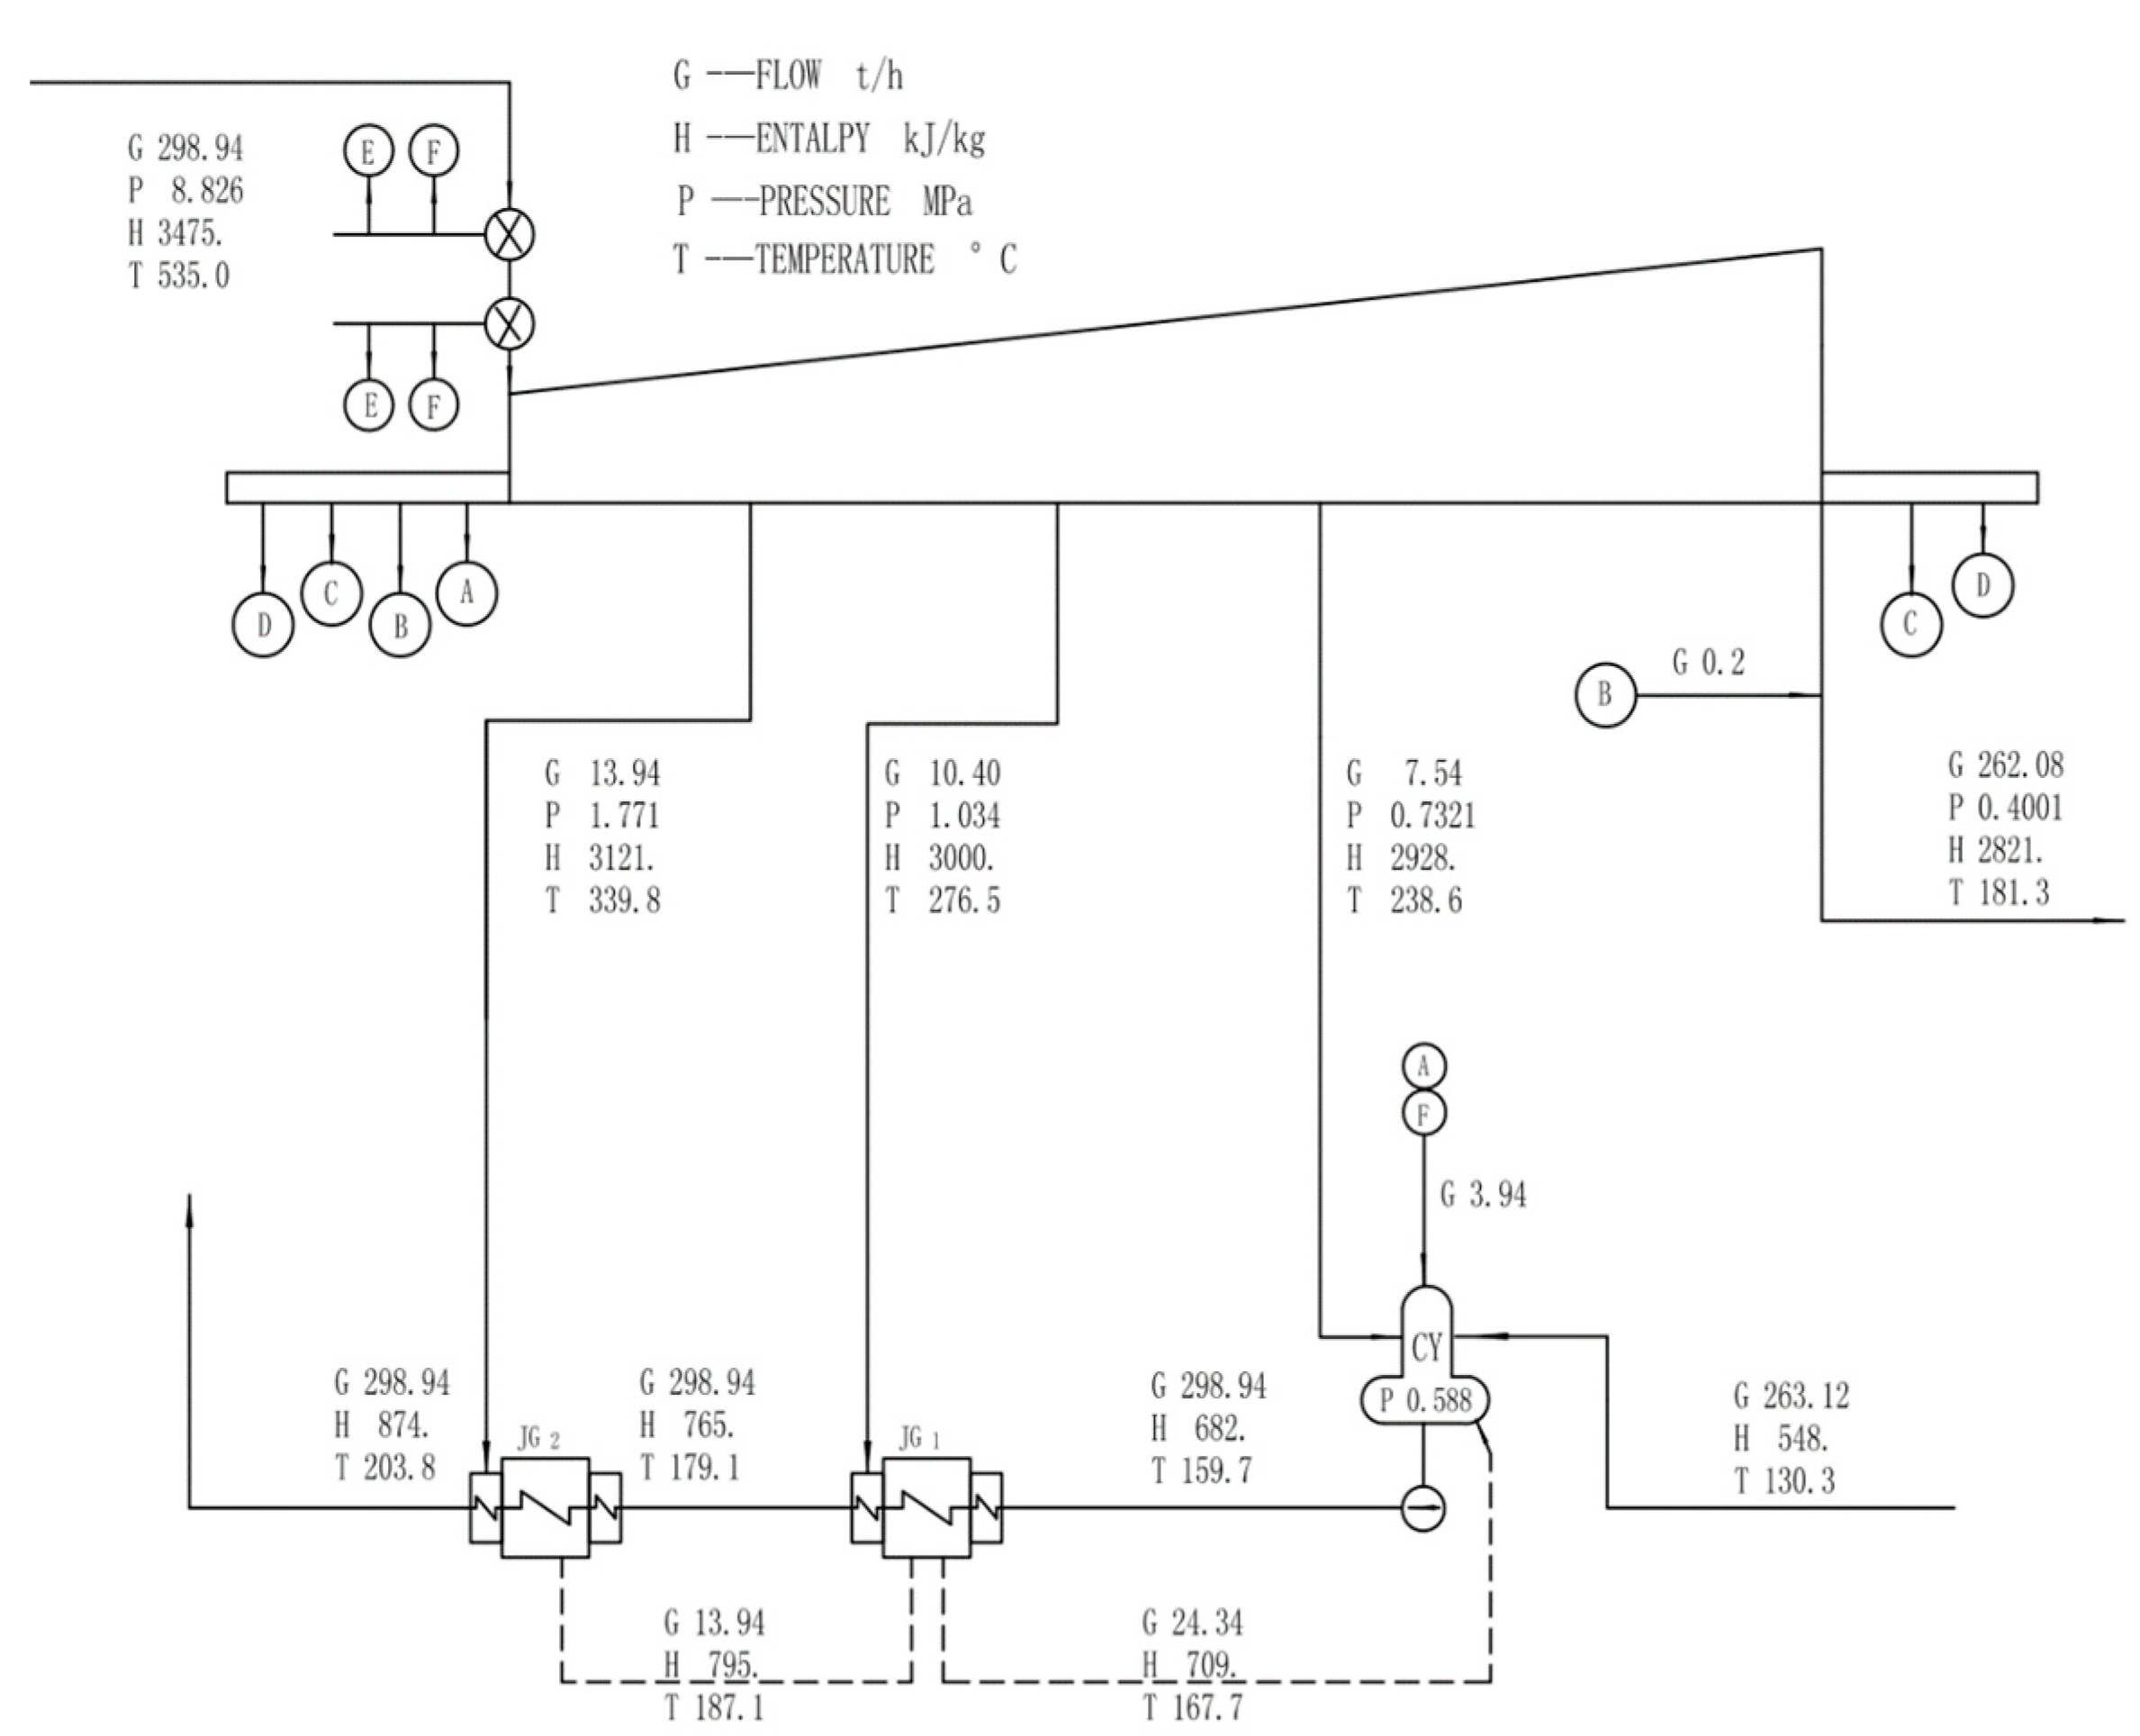
The energy structure in China is quite different from other countries. Although renewable energy (such as wind power and solar power) are increasingly generating electricity to the public grid, coal-fired power plants still provided more than 60% of total electricity in 2020 [32]. Thus, coal-fired combined heating and power utilities (CHP) and district heating will play an essential role in improving primary energy efficiency for a long time in the future, making it impossible to give up centralized heating systems like in Germany.
Energy performance renovation often involves multiple factors, and each factor usually takes different levels of values [33,34,35]. A well-designed multifactor experiment can reduce the number of tests and obtain ideal results. Shen et al. [36] developed a fast multi-objective optimization method by adopting a differential evolution algorithm. Future climate conditions and lifecycle cost analysis were considered to evaluate retrofit performance. Jafari and Valentin [37] proposed a decision-making framework considering a broad economic objective using a genetic algorithm method. Asadi et al. [38] combined a genetic algorithm and artificial neural network to assess a school building retrofit project quantitatively. Orthogonal array testing (OAT) is an essential branch of statistical mathematics that uses an “orthogonal table” to arrange and analyze multi-factor optimization [39], designed to carry out as few experiments as possible to get the best experimental results. Orthogonal experimental design is a scientific test design method that selects the right number of representative cases from many experimental data to arrange tests [40,41,42]. Searching for optimal nZEB retrofit strategies through the combination of computer simulation and OAT has not been widely discussed.
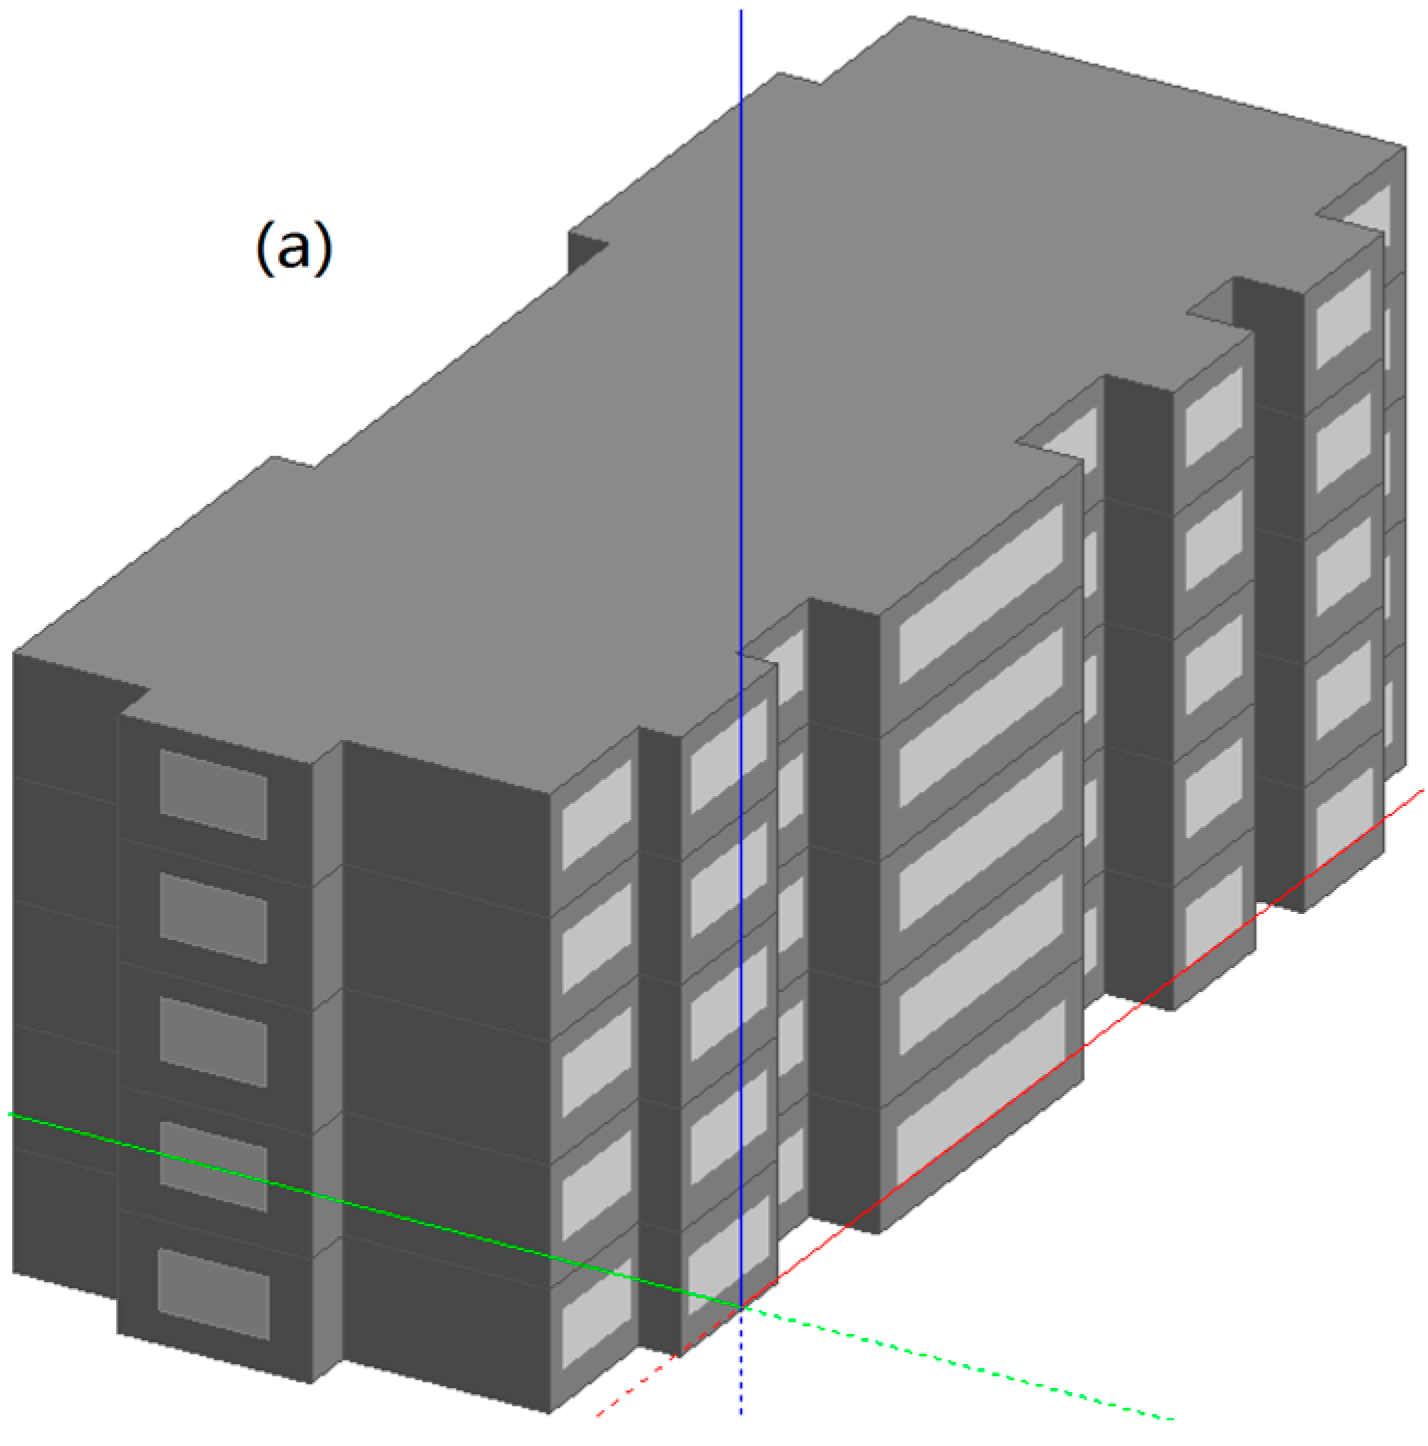
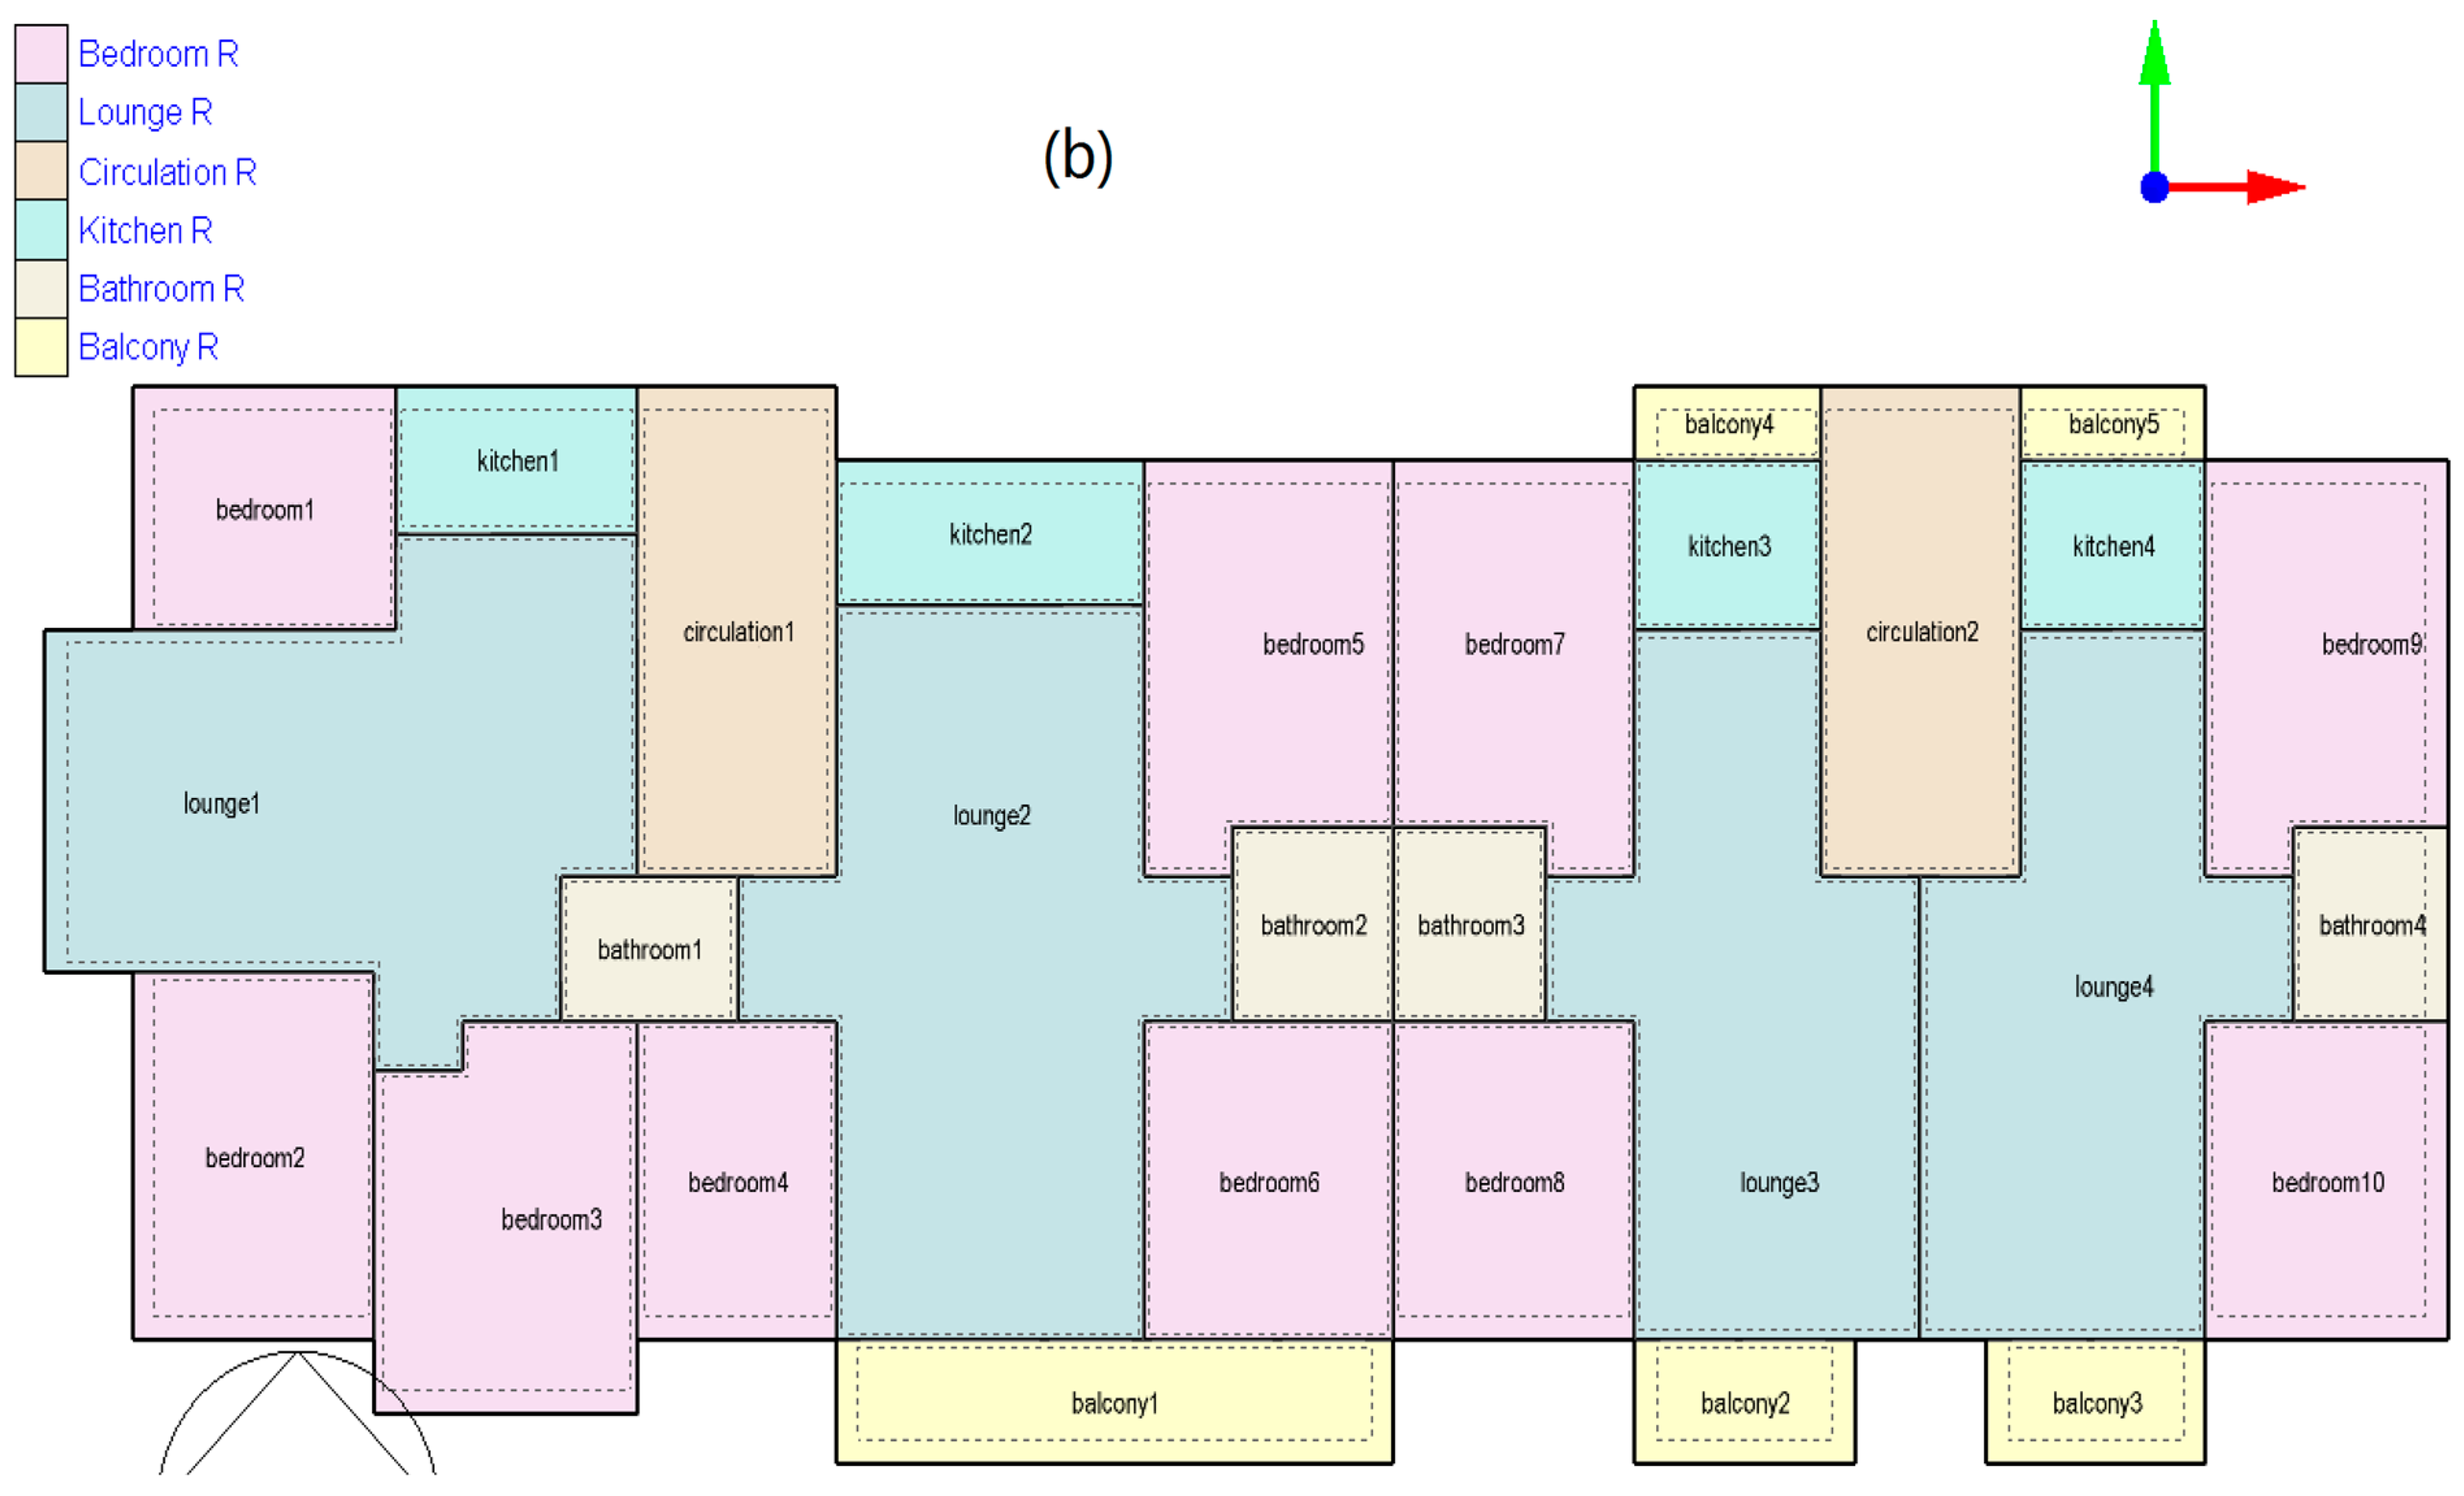
Therefore, in this study, a simulation-based method integrated OAT for nZEB retrofit is introduced. Energy performance optimization of a residential building in Jilin Province, located in the northeast of China, is selected as the case study to develop optimal passive renovation packages. The CO2 emission comparison between heat pumps and CHP are discussed as well. The results can help architects and engineers renovate residential buildings to nZEB with minimum change.

2. Methodology

2.1. Energy Simulation and Validation of the Residential Building

We use DesignBuilder [43], a popular building energy simulation model powered by EnergyPlus as the simulation engine, for the model simulation and the energy consumption analysis. Specifically, we studied an apartment building in the Changchun city of the Jilin province of China (an ASHRAE 6A climate zone). The building has five floors and four apartments on each floor (Figure 1). The total area of all 20 apartments is 1635.25 m2.
For all units, the floor-to-ceiling height is 2.8 m. The window to wall ratio is 0.25 on the north façade, 0.45 on the south façade, and 0.3 on the east and west façades. The main facades are oriented to the north and south. Table 1 lists the heat transfer coefficient of the building envelope before renovation. Door and window joints and exterior wall insulation were designed with corrected thermal bridges. Besides, the infiltration rate at 50 Pa (N50) is 3.6 ac/h. All parameters in Table 1 are obtained from the field investigations.
The building does not have any mechanical ventilation system, and fresh air demand is fulfilled by opening windows. A radiant floor heating system connected to the CHP district heating network meets the heating demand (DH, kWh/m2·a) during the heating season (20 October to 6 April) with a setpoint temperature at 20 °C. There is no heating setback temperature because the room temperature must remain constant for 24 h to maintain appropriate living standard. The building does not have any central cooling equipment, and the cooling demand (DC, kWh/m2·a) is provided by the air conditioners in each household. Furthermore, when the air temperature outside is below 26 °C, cooling demand can be satisfied by exchanging air through natural ventilation. Considering the 20-year average temperature of Changchun, we arbitrarily define a cooling season that starts on 27 June and ends on 9 September, with setpoint temperature at 26 °C and setback temperature at 31 °C. Table 2 shows for the rooms with specific functions the different indoor settings, including occupant density, illumination, lighting density, and domestic hot water (DHW). Occupant density data are obtained from field investigations, and other data are extracted from national standards [44]. The values in Table 1 and Table 2 are used as inputs into DesignBuilder.
The model validation compares the energy consumption simulated by the building energy model with the actual energy consumption to calibrate the model and predict the energy performance of different building renovation strategies. The American Society of Heating, Refrigerating and Air-Conditioning Engineers (ASHRAE) Guideline 14-2014 [45] provide standardized procedures for reliably measuring the energy, demand, and water savings achieved in conservation projects. The two following indicators from the ASHRAE Guideline 14-2014 describe how well the energy simulation model can represent the variability in measured data. The computer model is deemed reliable when an NMBE is <5% and CV[RMSE] is <15% relative to monthly calibration data.
CV [ RMSE ] = i = 1 n ( y i y ^ i ) 2 n 1 y ¯
NMBE = i = 1 n ( y i y ^ i ) ( n 1 ) y ¯
where CV[RMSE] is the coefficient of variation (CV) of the root-mean-square error (RMSE), which indicates how much variation there is between the data and the model, calculated by dividing RMSE by the average energy use; NMBE is the normalized mean bias error; y ^ i and y i represent simulation predicted data and operation data of the month n , respectively; y ¯ is the arithmetic mean of the operation data.

2.2. Orthogonal Array Testing Design

OAT is used to arrange and test the energy-saving potential of some proposed passive renovation methods. The influence of four architectural parameters that can be readily adjusted through renovation is assessed by OAT, including external wall heat transfer coefficient (A), roof heat transfer coefficient (B), infiltration N50 (C), and window heat transfer coefficient (D), as shown in Table 3. A blank row (E) is set as the fifth parameter to measure the reliability of OAT. Other passive measures, such as window to wall ratio and building orientation, are not assessed as they are difficult to change for an existing building.
The tests are arranged by the orthogonal table L25(56) generated in the SPSS software, where L represents the symbol of OAT, 25 denotes the number of tests, 5 indicates the number of levels, and 6 represents the maximum number of columns of the selected orthogonal table. The seed number “20201028” should be used to repeat the experiments and verify the results as this orthogonal table designed by SPSS is not a standard one.
Table 3 shows the five levels set for all factors. In Table 3, level 1 corresponds to the basic structure of the building envelope before renovation, whereas level 5 display corresponds to the specifications in the technical standard for nearly zero energy buildings (GB/T 51350-2019) of China national nZEB standard 2019 [19]. The recommended values corresponding to level 5 are not the mandatory limits for nZEB retrofits, and the values in levels 2, 3, and 4 are the gradients calculated by simple mathematics. The total energy consumption index (TECI) reflects whether the building has reached the nZEB level (see Section 2.3.1).
Other researchers are developing lighter and thinner insulation materials [46], which will be much more cost-effective and energy-efficient. Thus, only the changes in heat transfer coefficients and airtightness are counted in this study, without the insulation layer thickness, window types, and costs of existing materials.
The range analysis of OAT results reveals how much influence the individual factor can exercise on the energy efficiency of the building:
k ij = D ij 4
R i = max ( k ij ) min ( k ij )
where kij represents the average value of test results of factor i at level j, i denotes different factors (factor A, B, C, and D), j represents different levels (level 1, 2, 3, 4 and 5), ∑Dij represents the summation of the experimental results corresponding to the same level of a factor (e.g., ∑DA1 means the summation of the experimental results corresponding to level 1 of factor A), and Ri is the range value of factor i. The factor has greater impact on building energy efficiency when R is larger. The “4” in the denominator of Equation (3) indicates the degree of freedom of each factor.

2.3. Evaluation Criteria

2.3.1. Total Energy Consumption Index

The total energy consumption index (TECI, kWh/m2·a) defined in the national nZEB standard GB51350-2019 of China [19] includes energy usage from heating, cooling, mechanical ventilation, lighting, domestic hot water (DHW), and elevator. It does not include the energy usage that varies significantly among households and is not predictable at the design stage (i.e., cooking, plug loads, etc.). A building that complies with the nZEB standard of China should have a TECI no greater than 55 kWh/m2·a.
Since active technologies are not adopted and residents’ living habits are not changed in this study, the load of lights and DHW remain constant in the following simulations. The studied building does not have an elevator, and the energy consumption from elevator is thus zero. On the other hand, mechanical ventilation with heat recovery is indispensable for nZEB in cold climate zones, because when the air tightness of the building increases, natural ventilation through the window increases the energy consumption and affects the thermal comfort of the building. Thus, all subsequent building energy simulations include mechanical ventilation systems.

2.3.2. CO2 Emission Factor for Heating of the CHP

A novel CO2 emission analyzing method based on the energy cascade utilization is proposed in this paper. The cascade utilization of energy is the most outstanding technical feature of the CHP system. The energy from coal can be divided into three grades during the electricity-generating process, as shown in Figure 2. For a CHP, electricity, heat, and waste heat correspond to the high, medium, and low grade of energy respectively, and the coal consumption for electricity can be distinguished from that for heat. The criteria of CO2 emission established according to the cascade utilization of energy provide a more accurate reference about the greenhouse gas emission arising from electricity and heating.
Based on the cascade utilization theory, in this work, exergy analysis is used to analyze the the carbon emissions of the CHP that simultaneously supplies electricity and heating, as it reveals how much of the total energy in coal can be transformed into electricity as the high-grade energy. Equation (5) gives the exergy conversion factor of the heating supplied by CHP:
λ s = r h 1 h 2 ( 1 T 0 T 1 ) + ( 1 r h 1 h 2 ) ( 1 T 0 T 1 T 2 ln T 1 T 2 )
where λs is the exergy conversion factor of the heating, T0 denotes the average outdoor temperature in winter in Changchun (K), T1 represents the temperature of the extracted steam for heating (K), T2 indicates the condensate temperature of the extracted steam for heating (K), r is the latent heat of vaporization of the extracted steam at T1 (kJ/kg), h1 represents the enthalpy of the extracted steam (kJ/kg), and h2 is the enthalpy of the condensate (kJ/kg).
The heating ratio (HR) of CHP is calculated by Equation (6), which expresses the percentage of total available energy used for heating.
HR = Q h × λ s E + Q h × λ s
where Qh is the heating energy supplied by CHP (kWhh), and E refers to the electricity generated by CHP (kWhe). Besides, the subscripts h and e of the kWh indicate heating and power generation, respectively.
The coal consumption rate for heating (CCRH) of the CHP units is shown in Equation (7), which indicates the amount of coal consumed for every kWh of heating supplied.
CCRH = F CHP × HR Q h
where FCHP is the coal consumed by the CHP (t).
Finally, CO2 emission factor for heating of the CHP (CEFCHP) is calculated by Equation (8).
CEF CHP = CCRH × LHV × CEF coal
where LHV is the lower heating value of coal (MJ/kg), and CEFcoal is the CO2 emission factor per unit Joule value of coal (t CO2/TJ).

2.3.3. CO2 Emission Factor for Heating of Heat Pump and Coal-Fired Boiler

Jilin Province currently uses both CHP and coal-fired heating boilers (CB) for the heating service in winter for residential buildings. Meanwhile, the government encourages household to install heat pump units (HP) because HP as a clean technology for heating can reduce carbon emissions c.
Therefore, as for comparison, the CO2 emission factor for heating of the HP (CEFHP) is shown in Equation (9).
CEF HP = Q h × CEF grid COP
where COP is the coefficient of performance of the heat pump, CEFgrid is the CO2 emission factor of the power grid (g CO2/kWhe).
The CO2 emission factor for heating of the CB (CEFB) is shown in Equation (10).
CEF B = CEF coal × LHV × Q h , b η
where Qh,b is the heating energy supplied by CB, and η is the efficient of the CB.

3. Results and Discussions

3.1. Simulation Results and Validation

A comparison between the simulated and monitored energy consumption data is conducted on a monthly basis, as displayed in Figure 3. The simulated and actual annual energy consumption of the building is 151.11 and 148.36 MWh, and the simulated and actual TECI is 94.24 and 90.73 kWh/m2·a, respectively (Figure 3). The CV[RMSE] and NMBE values are 11.48% and 4.22% according to Equations (1) and (2), both within the limits set in Section 2.1. Therefore, the model is reliable and is suitable for evaluating renovation measures to improve the energy efficiency of the building.
The simulated TECI (94.24 kWh/m2·a) is 1.71 times that of the nZEB standard (55 kWh/m2·a). Because Changchun is in a severely cold region with low average summer temperature, heating contributes to 68% of the TECI whereas cooling only contributes to 4.08% of the TECI. The load of lighting and the DHW usage are kept constant in the simulations, as we do not adopt active technologies or change the living habits of the residents. There is ample room to improve the energy efficiency of the building through retrofitting to accomplish nZEB.

3.2. Analysis of the OAT Results

3.2.1. Range Analysis and Variance Analysis of Factor Levels

Table 4 shows the L25(56) orthogonal table and its results. Five tests are conducted at each level of the four selected factors shown in Table 3. The building energy consumption data of all 25 scenarios are generated and simulated using DesignBuilder.
Figure 4 illustrates the range analysis (as defined in Equations (3) and (4)) of factor levels on TECI, DH, and DC based on the results obtained in Table 4. Taking factor A as an example, as shown in Figure 4a, the TECI at level 1, 2, 3, 4, and 5 are 87.79 kWh/m2·a, 79.39 kWh/m2·a, 71.16 kWh/m2·a, 63.12 kWh/m2·a, and 55.43 kWh/m2·a, respectively. It can be concluded that TECI is the lowest when factors A, B, C, D are at level 5. With the building envelope structure optimization and thermal insulation performance improvement, the TECI shows a downward trend (Figure 4a), and DH is also continuously decreasing (Figure 4b).
However, DC slightly increases when the residential building renovates to nZEB, as shown in Figure 4c. The lowest DC can be obtained at level 1 of all factors. Before the renovation, DC only accounted for 4.08% of TECI. Therefore, although the change trend of DC is different from that of DH and TECI, the building energy consumption still reaches the lowest value when all factors take level 5. This conclusion is consistent with previous studies, indicating that reducing the heat transfer coefficient and air leakage of the building can effectively reduce the building’s energy demand and fulfill the purpose of energy-saving [47,48,49].
Besides, according to Equation (4), the ranking of the influences of each factor on TECI and DH is RA > RC > RD > RB. However, the influence of factor B on Dc is different from other factors. Thus, the ranking of the influence of each factor on Dc cannot be obtained by range analysis.
There are two methods to analyze the results of the orthogonal experiments, namely, range analysis and variance analysis. The variance analysis is a more reliable method to distinguish whether different test results are obtained by changing the factor levels or by the fluctuation of error.
According to the range analysis, the impact of factors on TECI and DH falls in the order of A > C > D > B, whereas the impact of factors on DC falls in the order of D > A > C > B. As the change of factor B from level 1 to 2 and from level 3 to 4 does not alter the DC, we use variance analysis to determine if the results of range analysis genuinely arise from the change of factor levels or are artifacts due to the fluctuation of the variable. Table 5 and Table 6 show that all four factors have significant impacts on TECI and DH, although there are large differences in the magnitude of impact as is reflected by the F value. The impact of the four factors on TECI and DH is also ordered identically as in the range analysis (i.e., A > C > D > B).
In contrast, only factors A, C, and D have a significant impact on DC (Table 7), and the change of factor B (i.e., roof insulation) does not have a significant effect on DC. The degree of their impact on DC ranks as D > C > A according to the F value.

3.2.2. Determination of Building Envelope Renovation Strategy

As defined in the previous section, the renovated building can meet China’s nZEB standard requirement when TECI is less than or equal to 55 kWh/m2·a. There are twelve renovation schedules in Table 4 that meet the nZEB standard of China (TECI no more than 55 kWh/m2·a), including tests No. 5, 12, 14, 16, 17, 18, 20, 21, 22, 23, 24, and 25. They all require changing three or four factors. However, one of the objectives of this study is to make full use of the energy-saving potential of passive technologies and reduce the workload and difficulty of renovation. The range analysis and variance analysis results show that factor A (external wall heat transfer coefficient) and factor C (infiltration N50) have the greatest impact on building energy consumption. Therefore, complementary experiments are implemented to investigate whether changing only factor A and factor C could transform the building to nZEB.
Table 8 examines three renovation plans that only require changing factor A and factor C and compare their energy performance. In Table 8, test No. 3 attains a 43.18% reduction of TECI (from 94.24 to 51.54 kWh/m2·a) without changing factor B (roof heat transfer coefficient) and the factor D (window heat transfer coefficient), hence obviating a complete renovation of the building [23,24,28] while still effectively reducing energy consumption. In addition, the retrofitting plan does not substantially impact the residents’ living habits as it does not change the window-to-wall ratio or the heat transfer coefficient of the exterior windows.
This result can provide a reference for the application of the nZEB standard in actual retrofitting projects. Figure 5 shows the daily building energy consumption curve and energy reduction rates after renovation based on test No. 3 in Table 8.

3.3. Impact on CO2 Emission

After using passive technology to reduce residential energy consumption, previous studies always introduce a scenario considering active renewable energy systems to balance the buildings energy requirements and reduce the carbon emissions. Since TECI is mainly influenced by DH, it is necessary to select suitable renewable energy for heating, which mainly include solar heating, air-source heat pumps and ground-source heat pumps.
However, the high occupancy density of Chinese buildings does not provide enough space for ground-source heat pump and solar heating technologies. Therefore, air-source heat pump technology is more frequently used in nZEB buildings in China [7]. Air-source heat pumps consume electrical energy during operation, which means that the carbon emissions of air source heat pumps depend on the carbon emissions of electricity generation. As mentioned earlier, the primary means of power supply in China today is coal-fired power generation, and the primary heating means is coal-fired CHP. It is necessary to compare whether air-source heat pumps can really reduce CO2 emissions compared to CHP according to the equations presented in Section 2.3.2 and Section 2.3.3.

3.3.1. CHP and the CB

For residential houses in northeastern China, the comfortable winter heating temperature is 20 °C, and any heat source that can release heat at 20 °C can theoretically be used to provide heating. To maximize efficiency, low-grade energy should be utilized to heat buildings. The use of CHP instead of CB can effectively reduce CO2 emissions, as CB converts the high-grade chemical energy of coal directly into low-grade thermal energy.
The LHV and CEFcoal of typical anthracite coal, bituminous coal, and lignite coal in China are shown in Table 9. The data of CEFcoal comes from 2019 Refinement to the 2006 IPCC Guidelines for National Greenhouse Gas Inventories [50].
The heat balance diagram of a typical 50MW back pressure coal-fired CHP unit is shown in Figure 6, where T1, T2, T0, h1, h2, and r equals 454.45 K (181.3 °C), 416.77 K (143.6 °C), 265.55 K (−7.6 °C), 2820.56 kJ/kg, 604.67 kJ/kg, and 2132.96 kJ/kg, respectively. Besides, the efficiency of the CB is 90%.
CEFB and CEFCHP are shown in Figure 7 and Table 9. For CHP, the coal type has a heavy influence on the CO2 emissions, as different types of coal vary in their carbon content and LHV. Figure 7 shows that the CO2 emission of CB is generally 1.6 times that of CHP, and for both CB and CHP, the CO2 emission is the least and the greatest when bituminous coal and lignite coal are used, respectively. It should be noted that in severely cold regions of China, the high-quality anthracite and bituminous coals are mainly used in industrial settings such as coking plants, whereas CHP mainly burns lignite coal. Directing industrial waste heat for district heating should also help reduce CO2 emission.

3.3.2. HP

The data in Table 10 demonstrates the CO2 emissions when HP units are used for heating. Currently, the COP of HP heating is about 2 in severe cold regions [19]. According to the “Thirteenth Five-Year Plan” issued by the State Council in 2016 to control greenhouse gas emissions, the amount of carbon dioxide emissions per kilowatt of China’s large power generation groups should be less than 550 g CO2/kWhe before 2020 [51]. IEA data shows that the global average carbon dioxide emissions intensity in 2019 was 340 g CO2/kWhe [52]. U.S. Energy Information Agency (EIA) reported that the power sector emitted about 0.92 pounds of CO2 per kWhe (417.68 g CO2/kWhe) in 2019 [53]. European Environment Agency calculated that the greenhouse gas emission intensity of electricity generation in E.U. was 275 g CO2/kWhe [54].
Figure 7 shows that although HP is a popular clean method to provide heating in Europe and the U.S. [13], in China the CO2 emission from HP for heating is much higher than that of CHP because the CO2 emission of electricity generation is relatively high. Heating with HP cannot accomplish environmental protection in China unless the power system is decarbonized to reduce the CO2 emission from electricity generation to a relatively low level.
For the severely cold regions in China, winter has a relatively low electricity demand but a very strong heating demand, and at present CHP and CB jointly provide heating for buildings. Additional heat sources must be used to match the heat between the supply side and the demand side when CHP cannot provide all the heating needed by buildings. In the future, to reduce the CO2 emission from heating buildings in China, HP may effectively replace CB for heating when the CEFgrid is lower and when the COP is further decreased by technological advancements.
Renovating the studied building according to the test No. 3 of Table 8 not only achieves nZEB but also significantly reduces the CO2 emission from heating. The CO2 emission in Figure 8 is calculated based on the emission factors of the lignite coal because the studied building is in Changchun. After the renovation, the CO2 emission from heating is reduced from 24.51 to 9.92 t/a for CHP and from 39.33 to 15.92 t/a for CB, respectively. That is, a lower heating demand can effectively reduce the carbon emission from the building. The CO2 emission from heating the retrofitted building by HP is 11.61 t/a, which is more than that of CHP and less than that of CB, due to the high CO2 emission intensity of electricity generation in China.

4. Conclusions

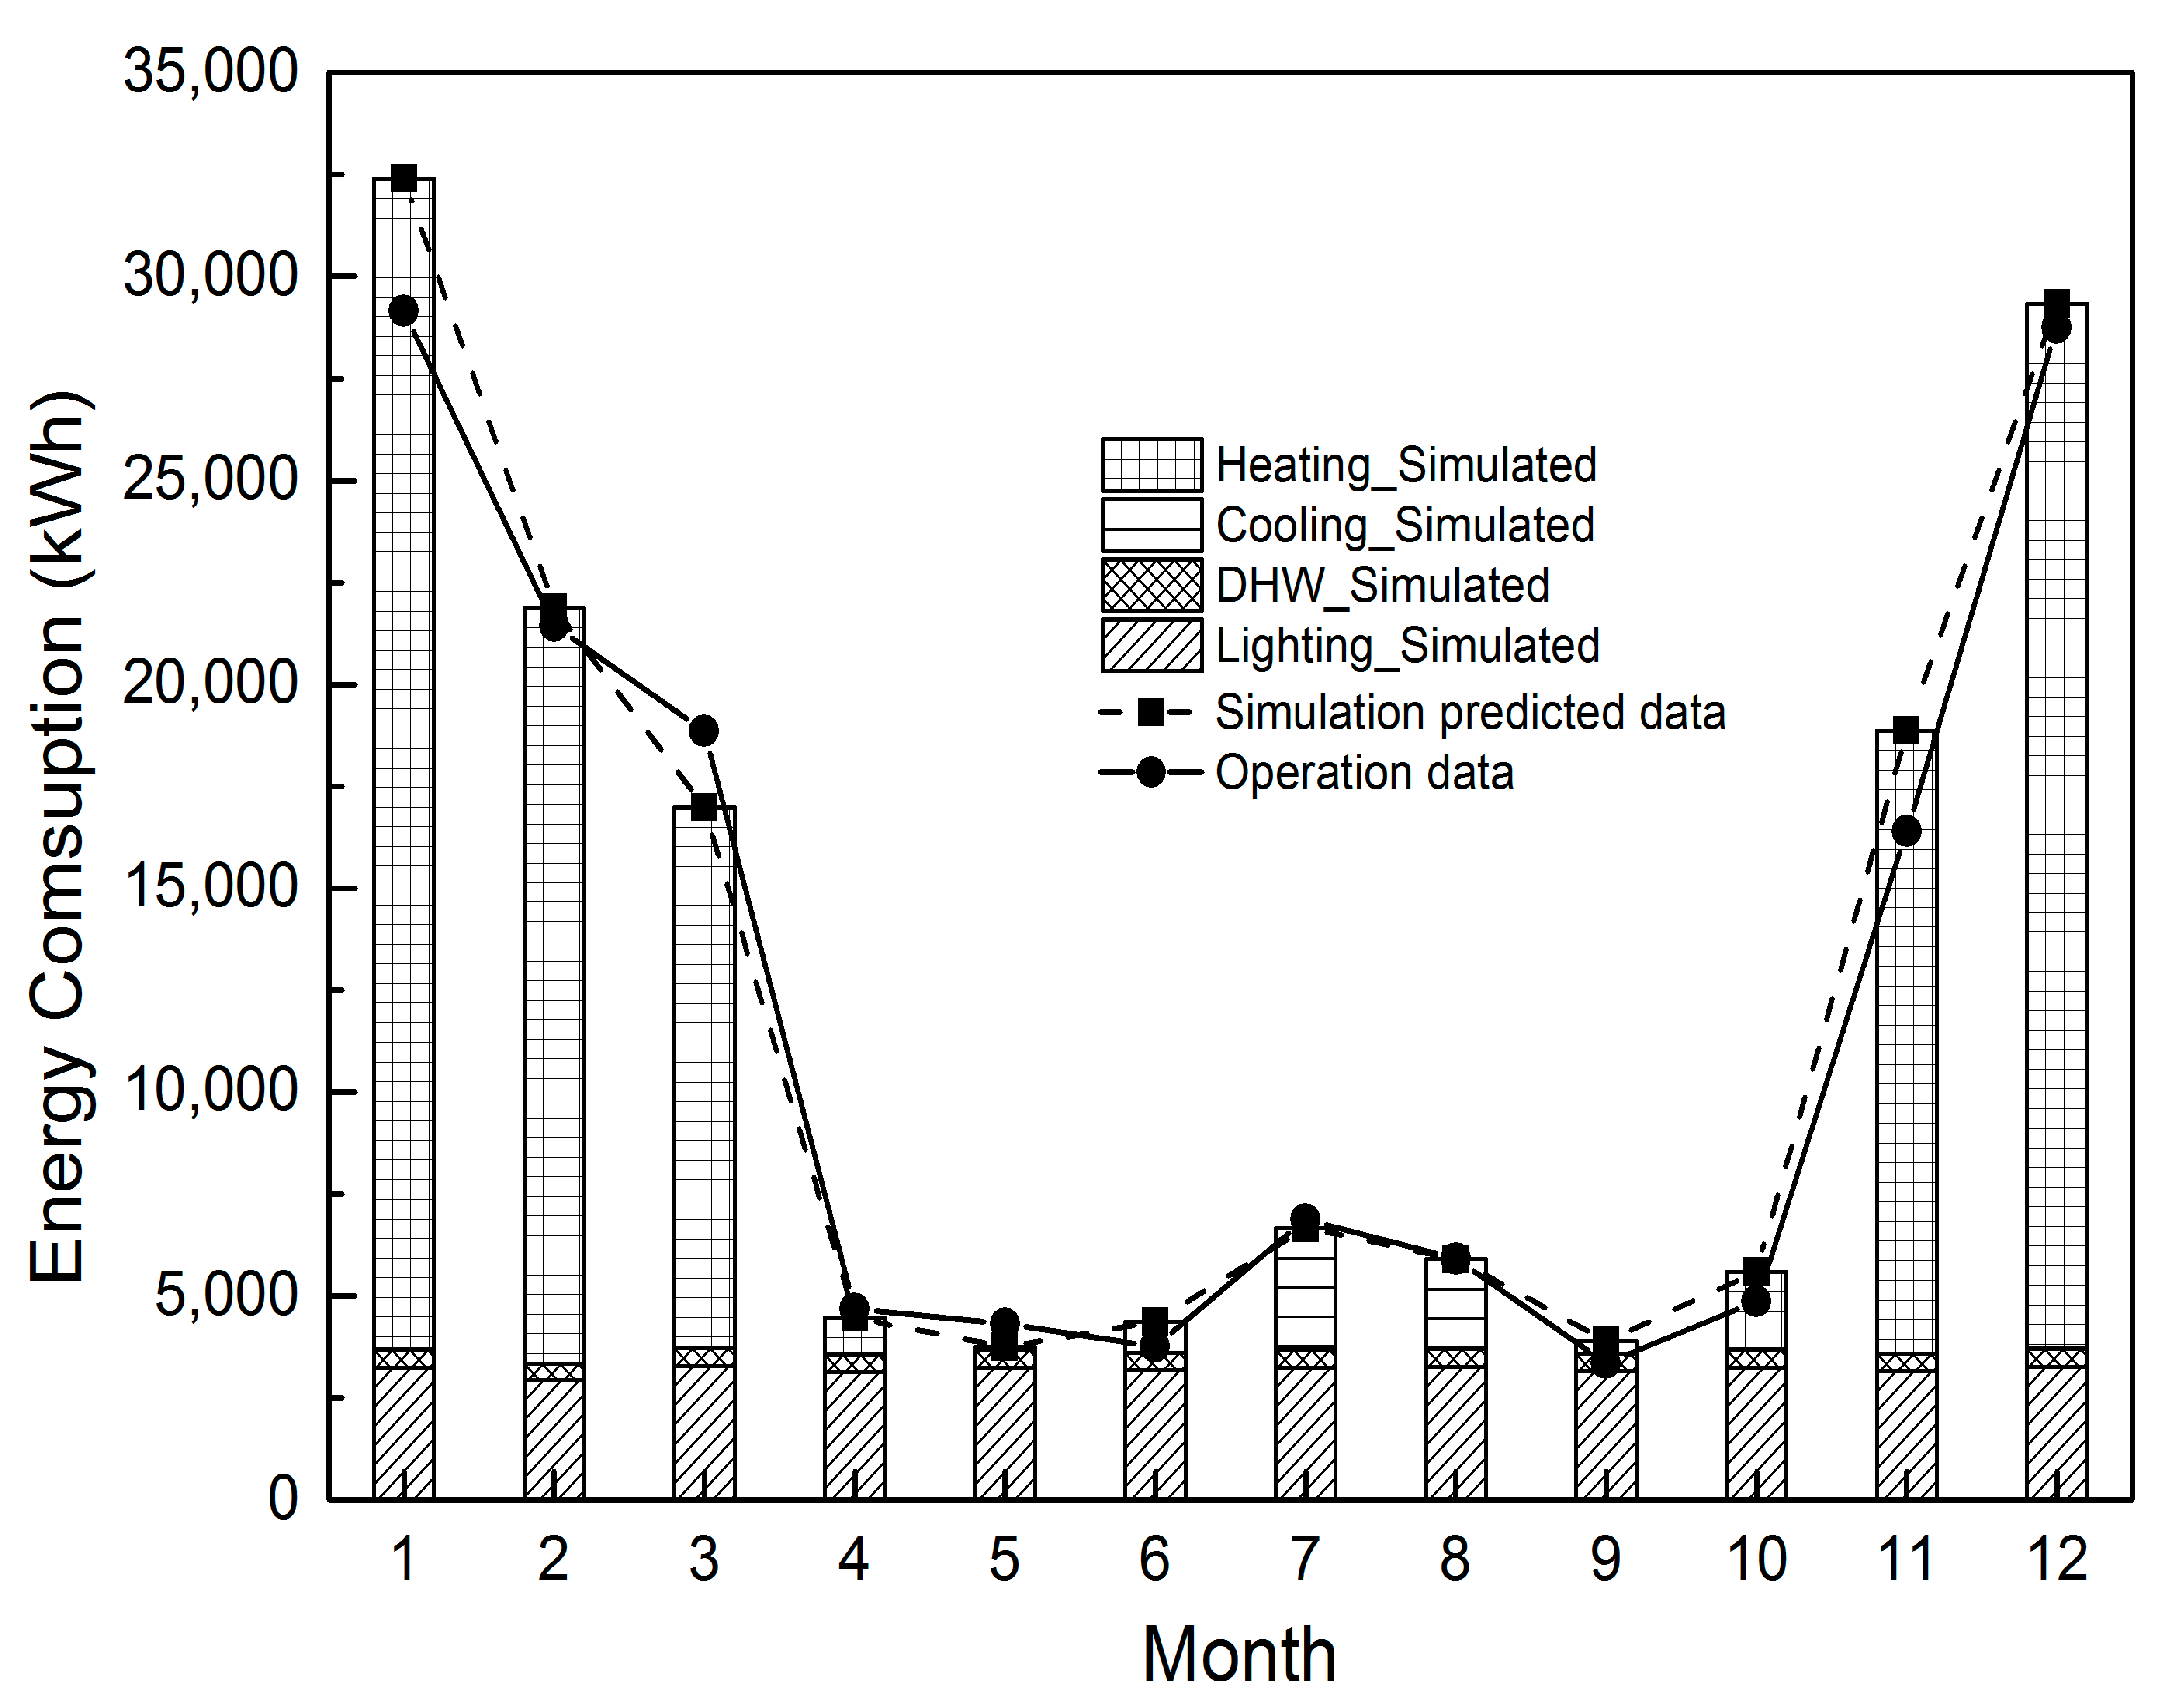
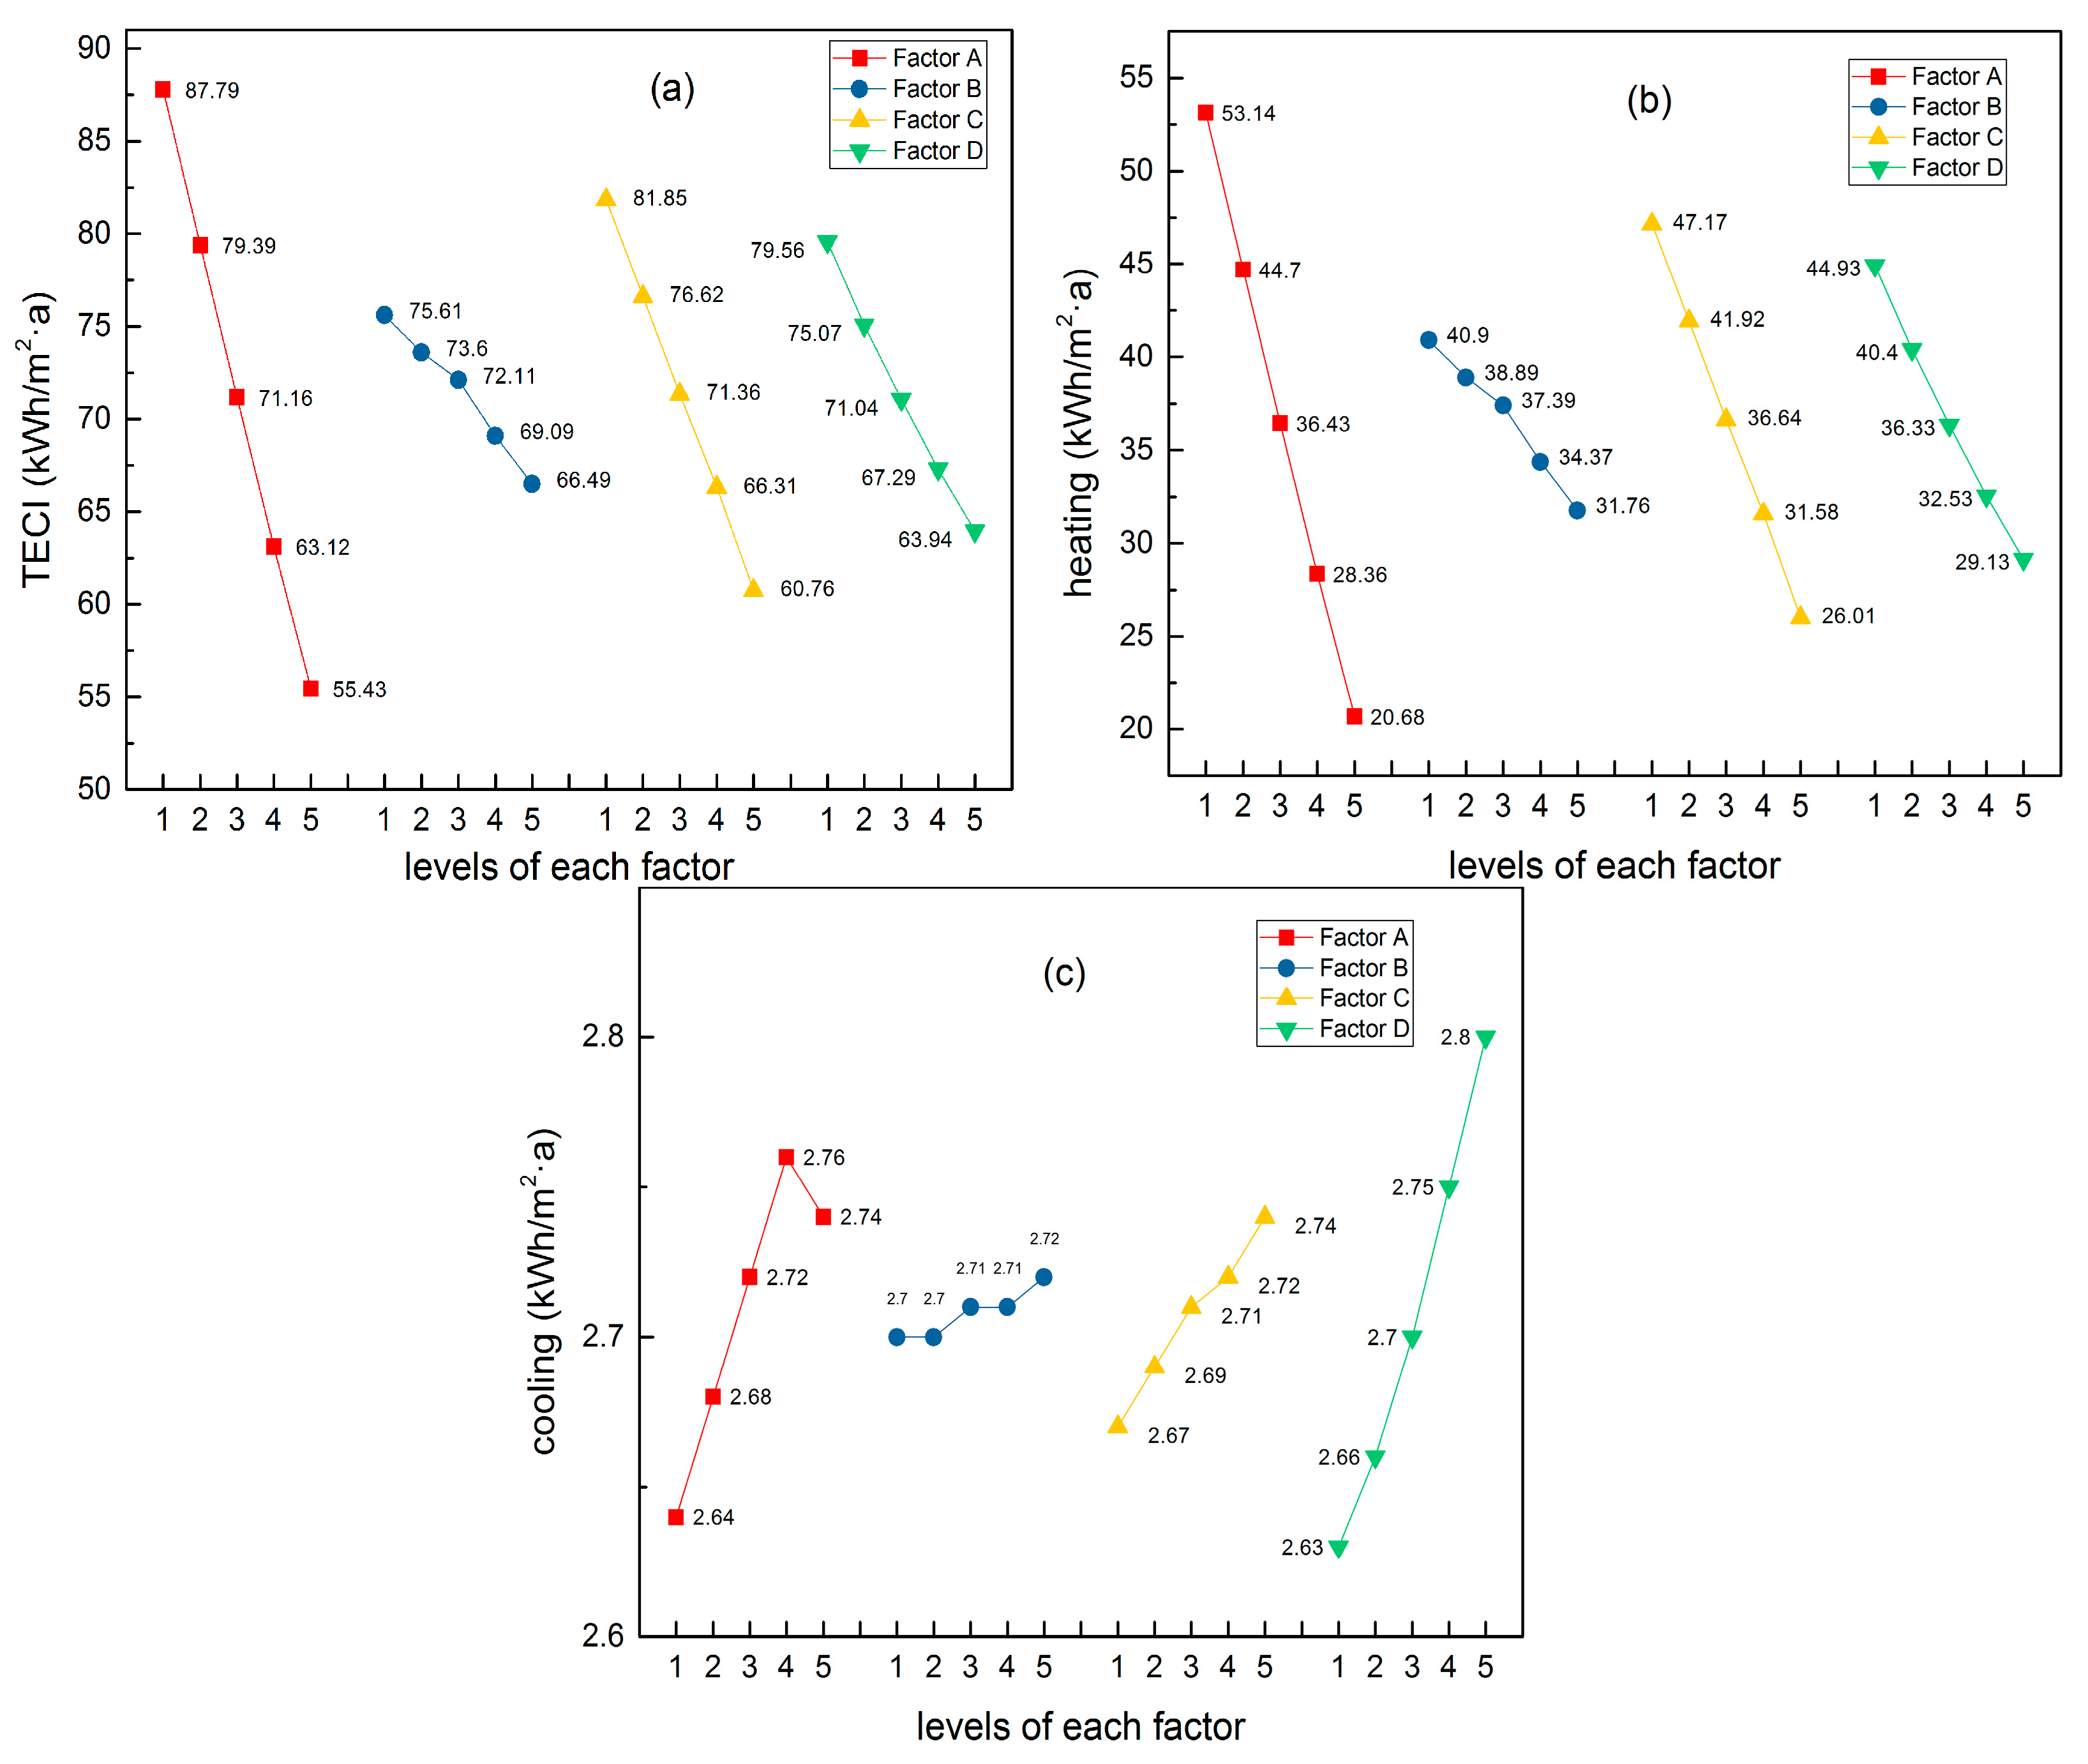
Retrofitting strategies are needed to convert existing buildings to nearly zero energy buildings (nZEB) through renovation. The present study introduces a hybrid approach to develop retrofitting strategies through building energy simulation based on orthogonal array testing (OAT). The case study modeled the energy consumption of a residential building in the severely cold region of China with DesignBuilder. Four architectural factors of the studied building are considered for retrofitting, namely (A) external wall heat transfer coefficient, (B) roof heat transfer coefficient, (C) infiltration N50, and (D) window heat transfer coefficient. The energy performance of different retrofitting strategies is assessed according to the ASHRAE Guideline 14-2014 after validating the energy consumption model.
Upon improvement in the four analyzed factors, the heating demand (DH) is readily reduced whereas the cooling demand (DC) escalated. Nevertheless, because DC contributes very little to the total energy consumption index (TECI) compared with DH, the total energy consumption is the least when all factors are improved to their fullest (i.e., level 5). According to variance analysis, the impact of the studied factors on DC ranks as window heat transfer coefficient > external wall heat transfer coefficient > infiltration N50, and factor B does not have a significant impact on DC. The impact of the studied factors on DH and TECI all falls in the order of external wall heat transfer coefficient > infiltration N50 > window heat transfer coefficient > roof heat transfer coefficient.
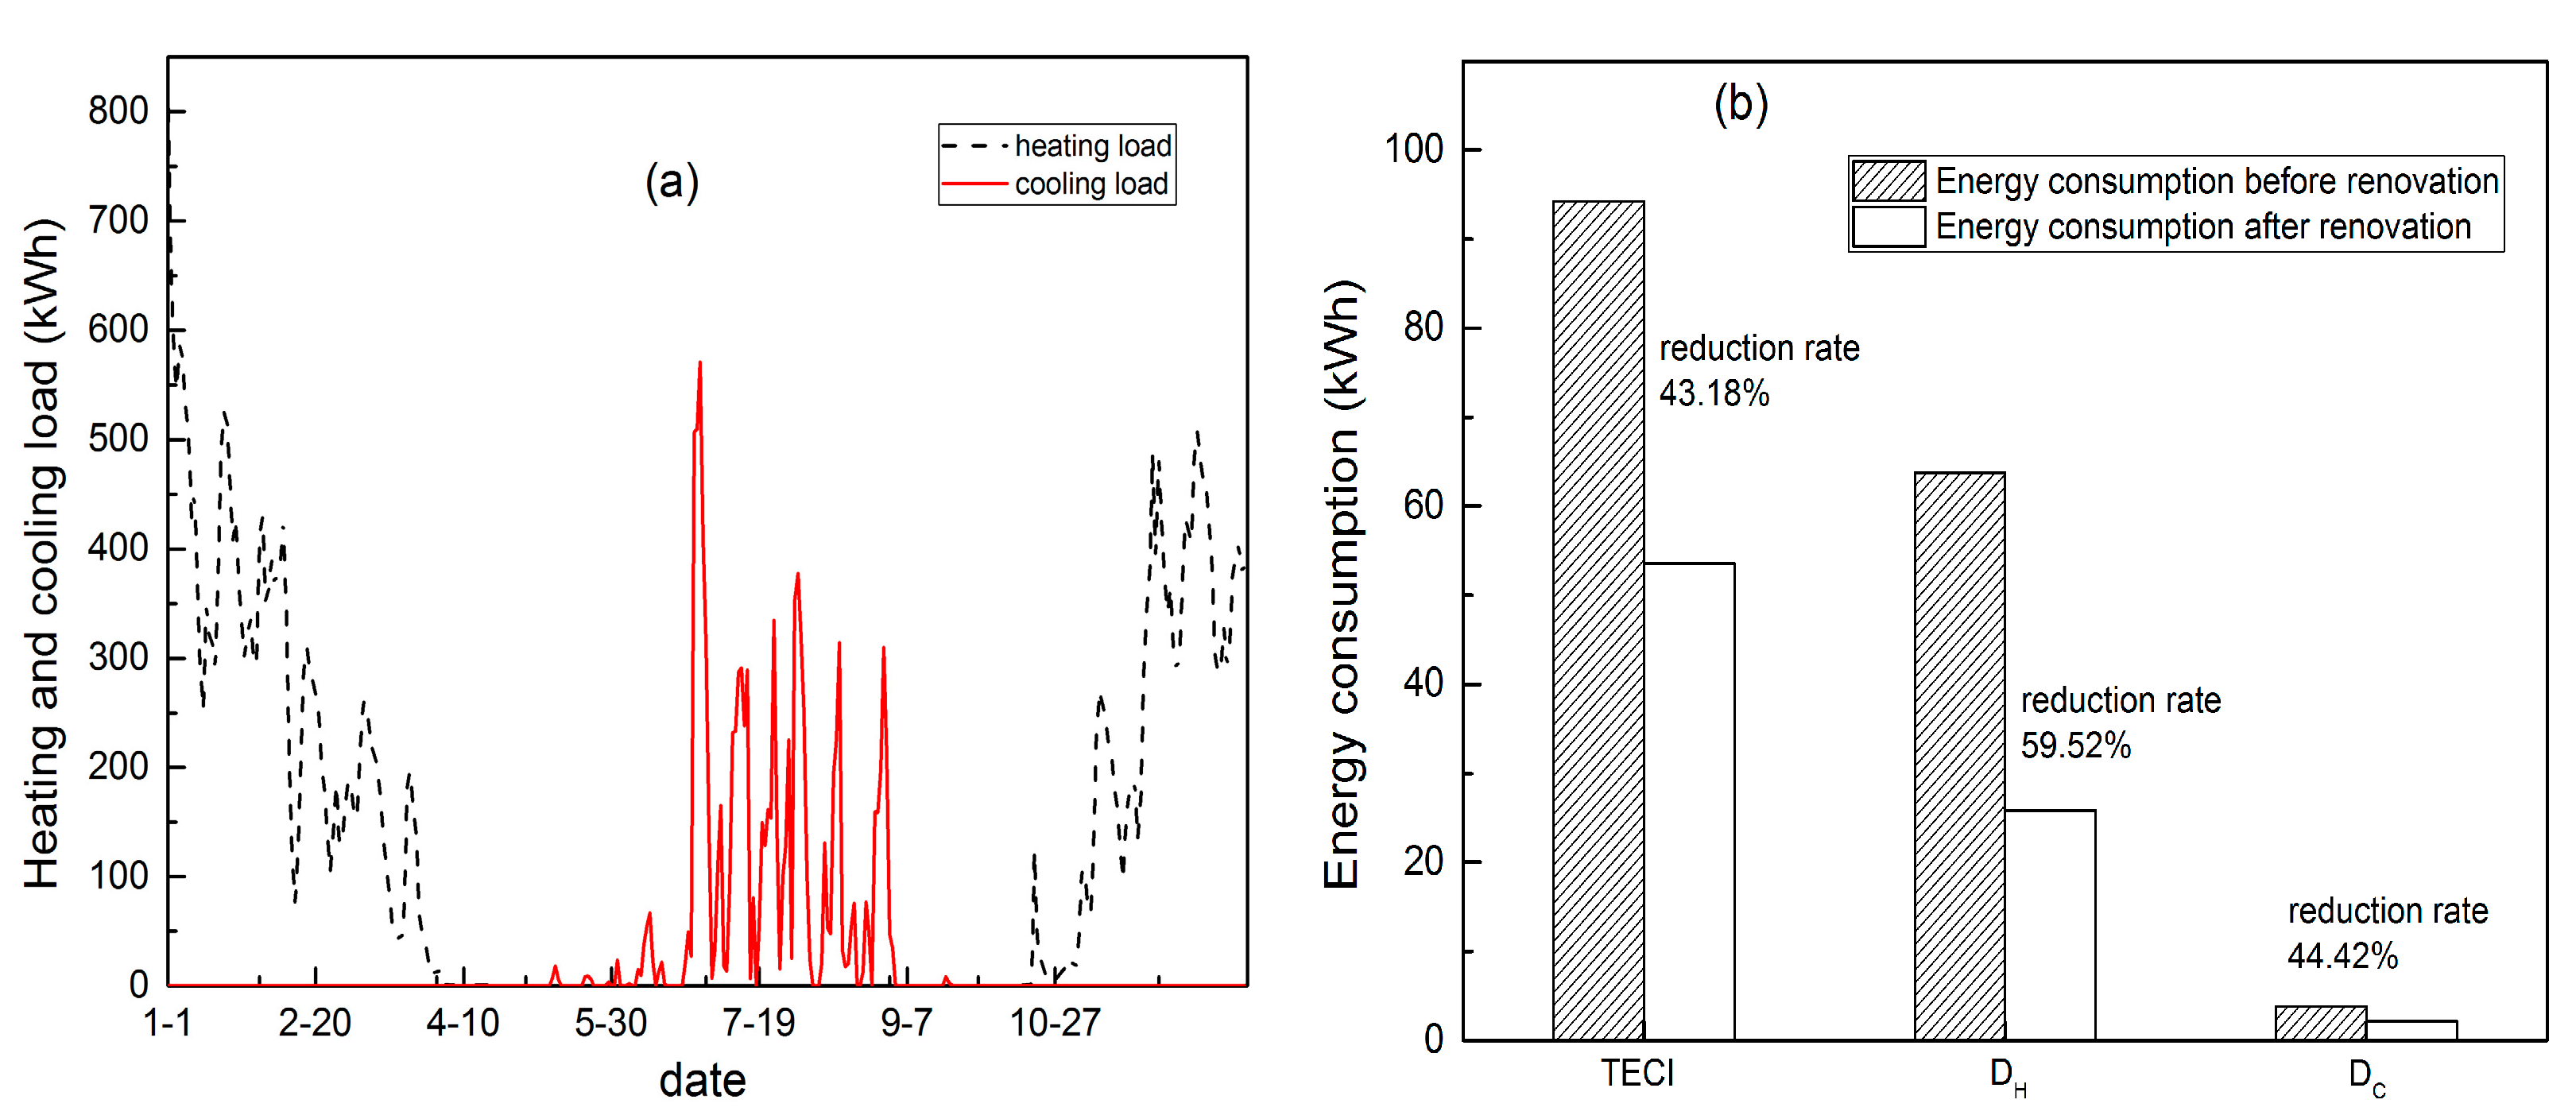
To minimize the necessary work in retrofitting while still attaining nZEB, the roof heat transfer coefficient (factor B) and window heat transfer coefficient (factor D) can be left unchanged at 0.4 and 2 W/m2·K respectively, while decreasing the external wall heat transfer coefficient (factor A) from 0.5 to 0.2 W/m2·K and infiltration N50 (factor C) from 3.6 to 0.4 ac/h. This strategy can reduce the TECI of the building from 94.24 to 51.54 kWh/m2·a, below the 55 kWh/m2·a cutoff defined by the nZEB standard.
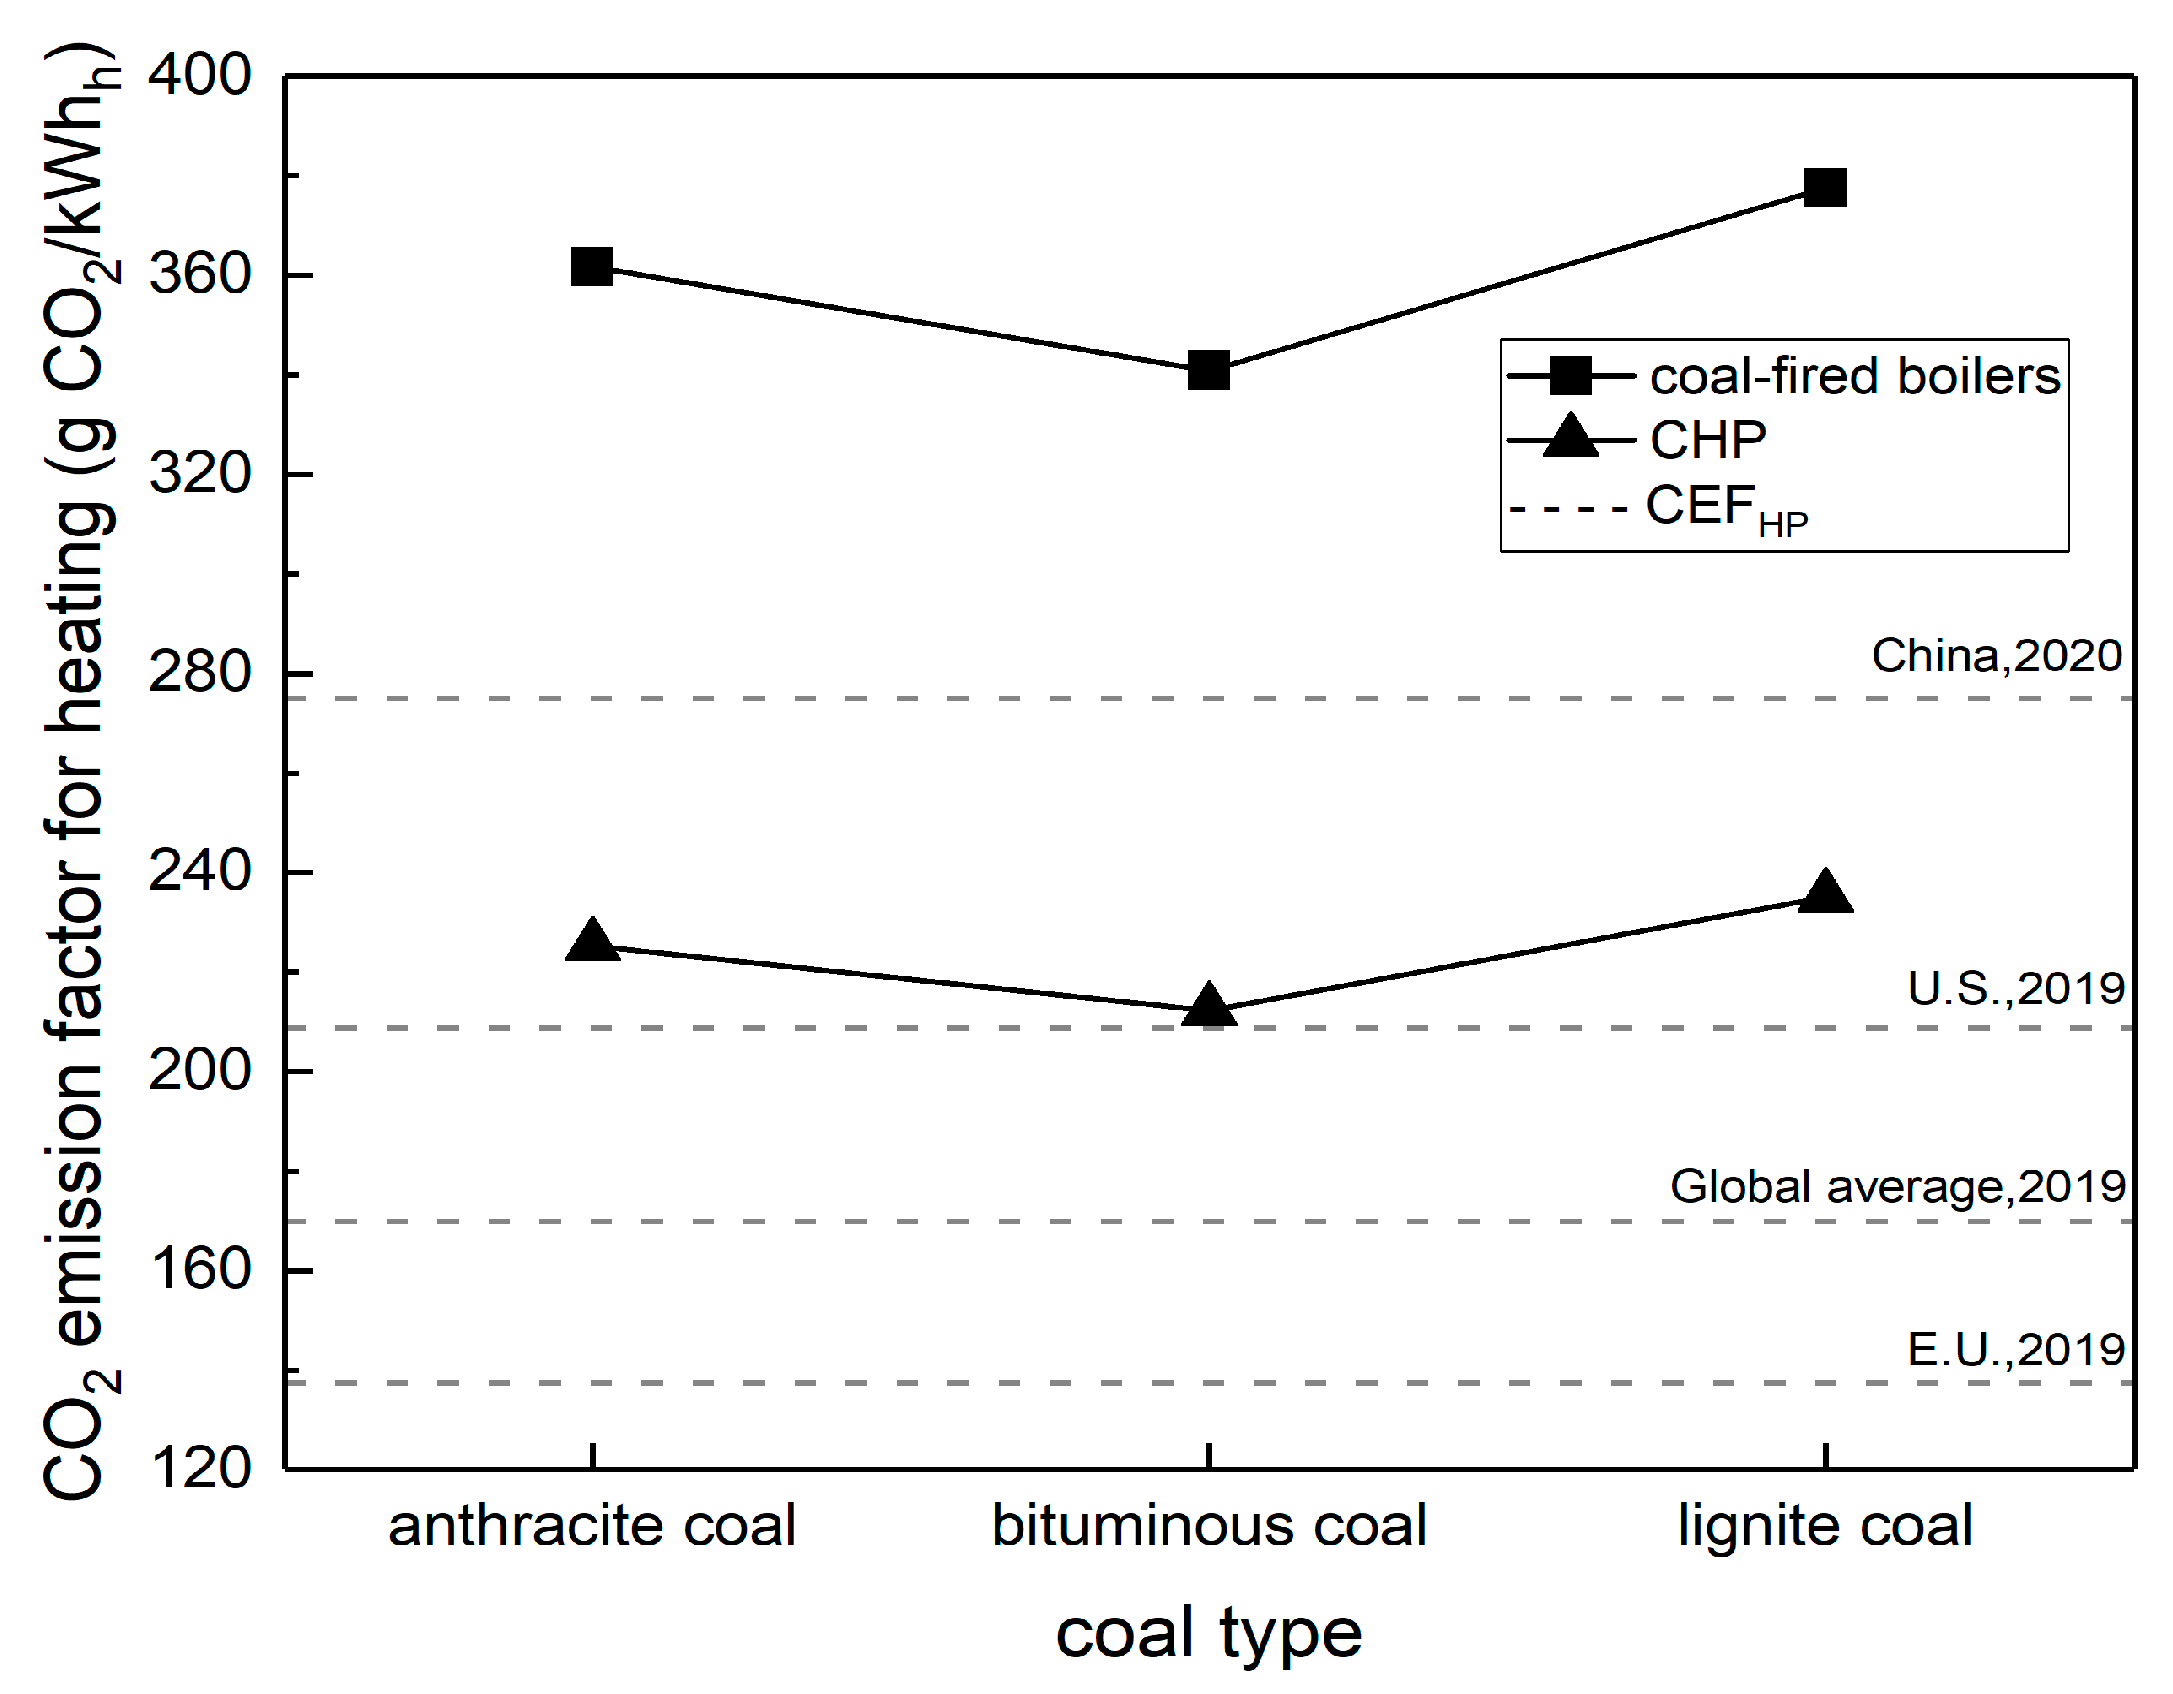
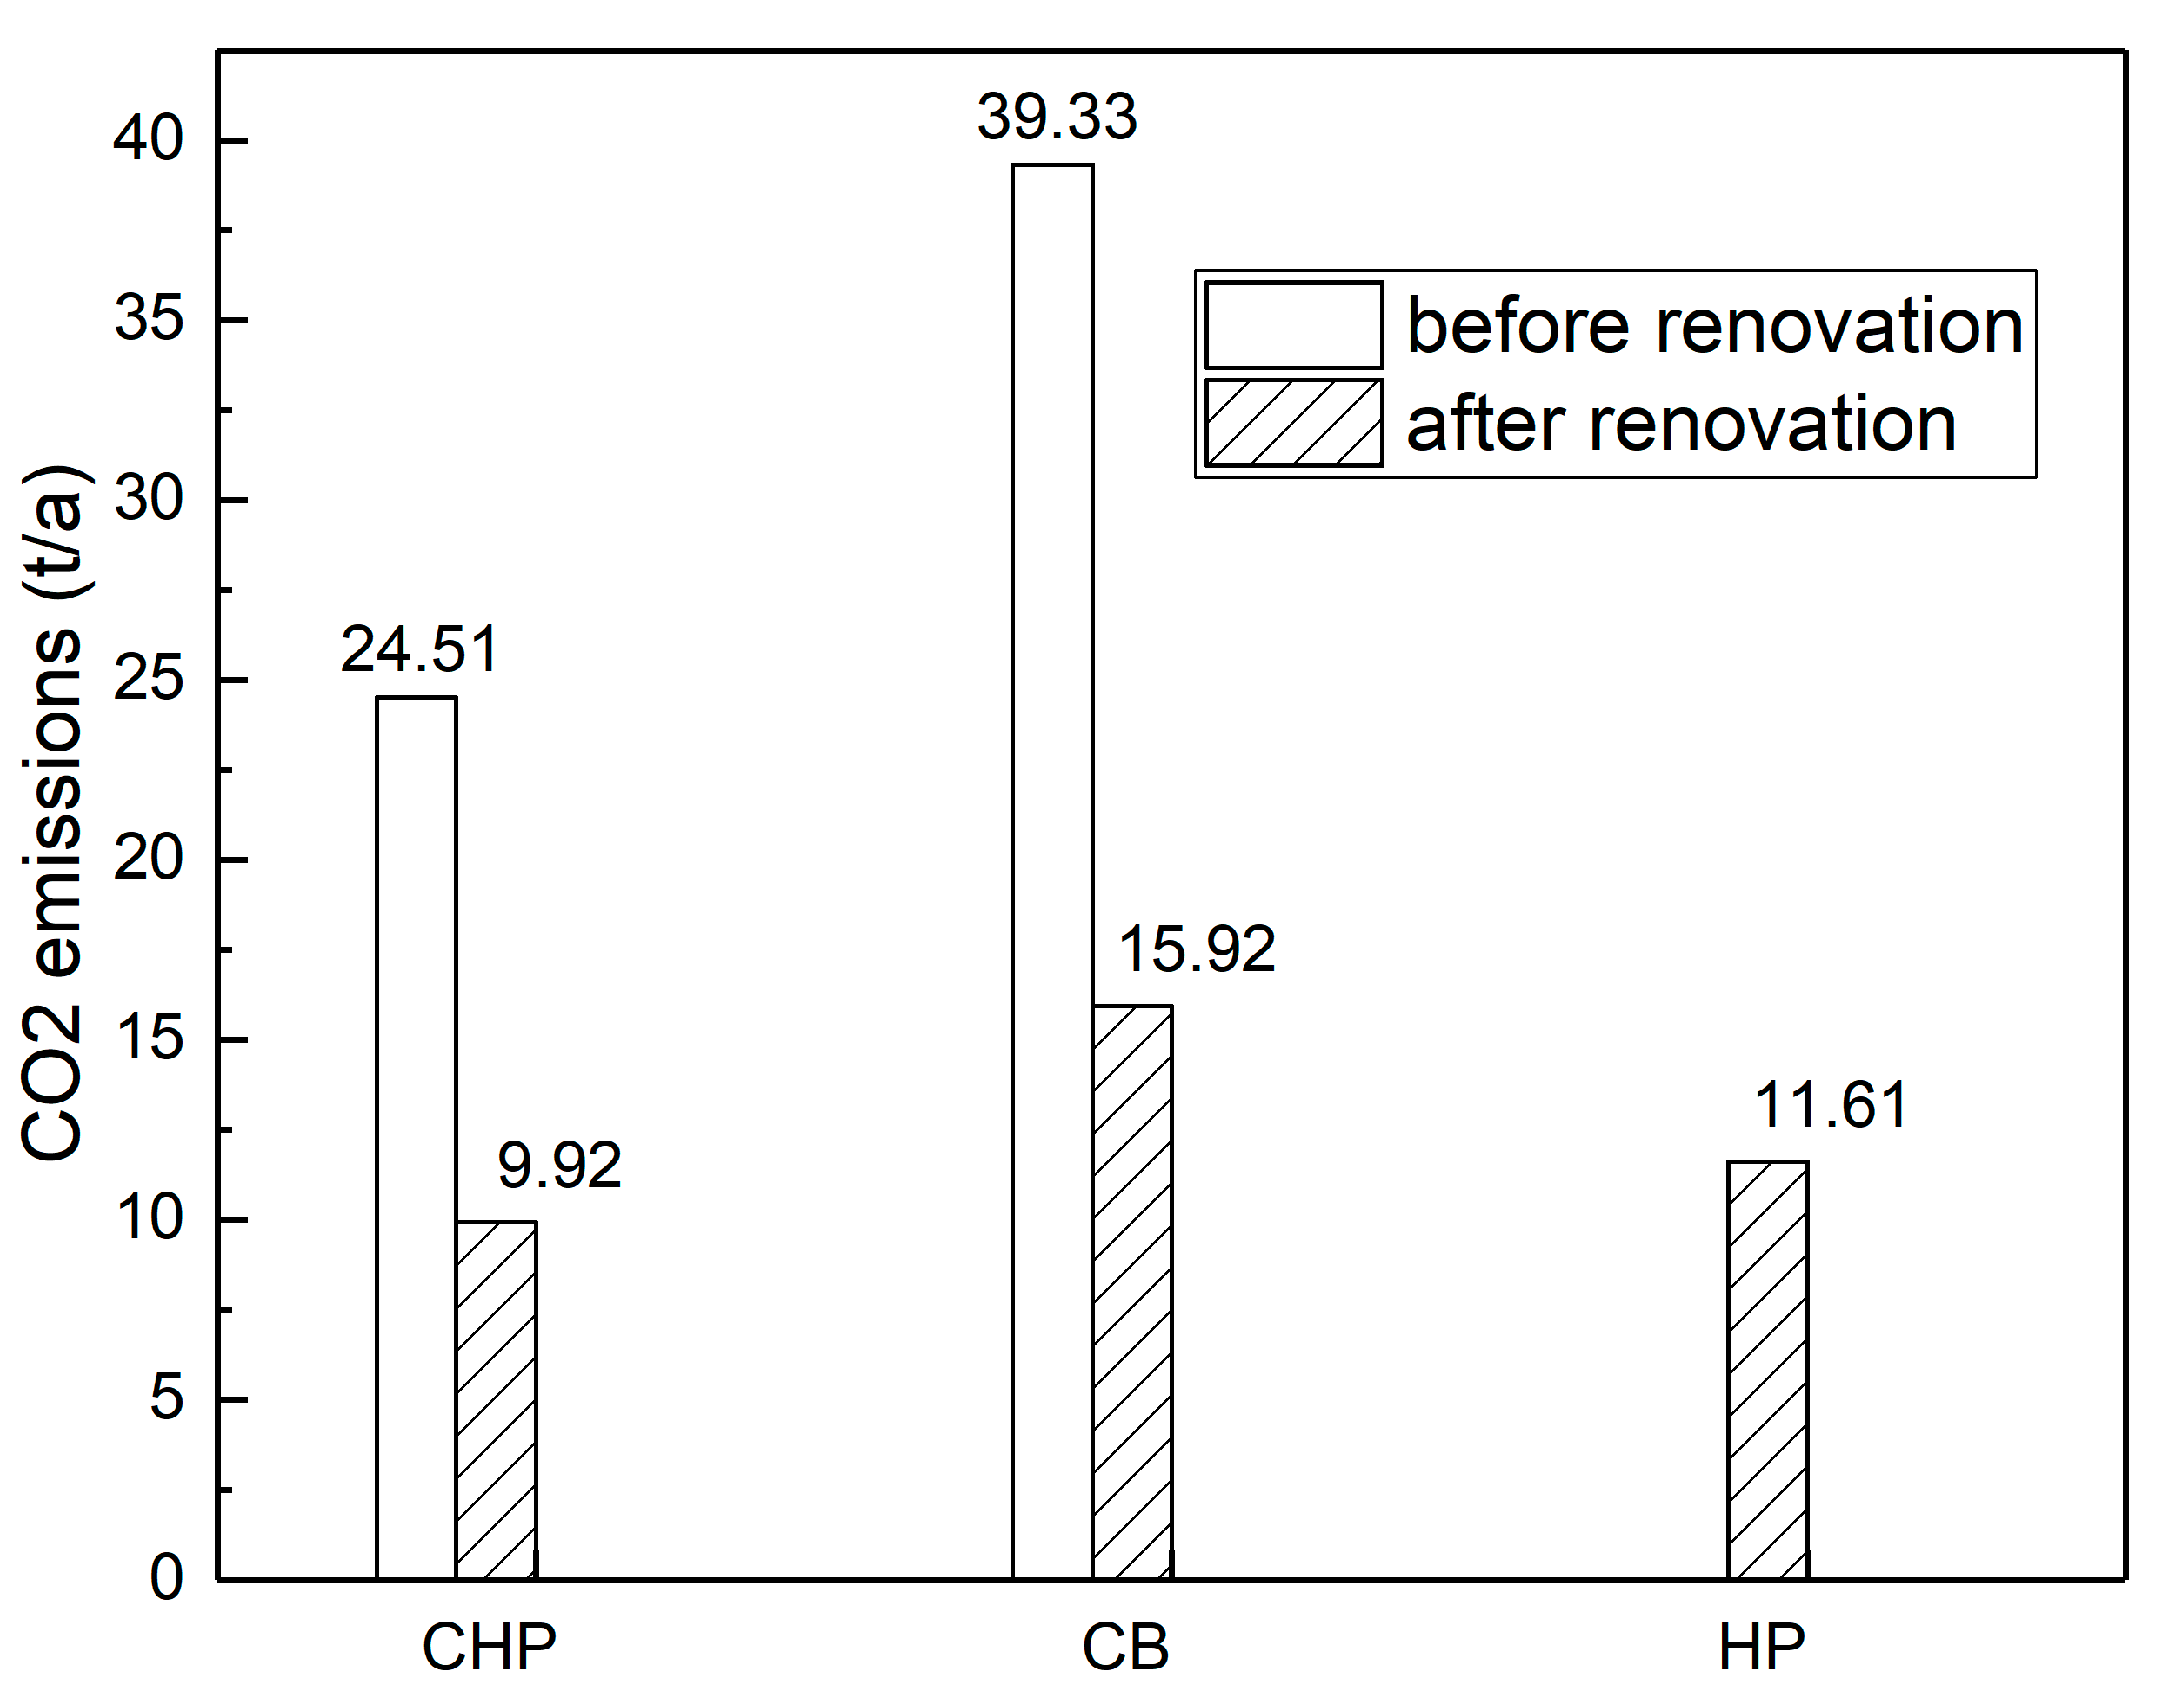
HP generates more greenhouse gases than CHP during the heating process under the current CO2 emission factor of the power grid in China. However, with the decarbonization of the power system and the increase of COP of the HP units, CB can be replaced by HP, and the carbon emissions of the district heating system will be effectively reduced.

Author Contributions

Formal analysis, methodology, writing—original draft preparation, P.W.; validation, writing—review and editing, S.Z. All authors have read and agreed to the published version of the manuscript.

Funding

This research received no external funding.

Institutional Review Board Statement

Not applicable.

Informed Consent Statement

Not applicable.

Data Availability Statement

Not applicable.

Conflicts of Interest

The authors declare no conflict of interest.

References

  1. Sesana, M.M.; Salvalai, G. Overview on life cycle methodologies and economic feasibility for nZEBs. Build. Environ. 2013, 67, 211–216. [Google Scholar] [CrossRef]
  2. Chastas, P.; Theodosiou, T.; Bikas, D. Embodied energy in residential buildings-towards the nearly zero energy building: A literature review. Build. Environ. 2016, 105, 267–282. [Google Scholar] [CrossRef]
  3. Becchio, C.; Corgnati, S.P.; Delmastro, C.; Fabi, V.; Lombardi, P. The role of nearly-zero energy buildings in the transition towards post-carbon cities. Sustain. Cities Soc. 2016, 27, 324–337. [Google Scholar] [CrossRef]
  4. Reda, F.; Fatima, Z. Northern European nearly zero energy building concepts for apartment buildings using integrated solar technologies and dynamic occupancy profile: Focus on Finland and other northern European countries. Appl. Energy 2019, 237, 598–617. [Google Scholar] [CrossRef]
  5. Muñoz, P.; Morales, P.; Letelier, V.; Muñoz, L.; Mora, D. Implications of life cycle energy assessment of a new school building, regarding the nearly zero energy buildings targets in EU: A case of study. Sustain. Cities Soc. 2017, 32, 142–152. [Google Scholar] [CrossRef]
  6. Attia, S.; Eleftheriou, P.; Xeni, F.; Morlot, R.; Ménézo, C.; Kostopoulos, V.; Betsi, M.; Kalaitzoglou, I.; Pagliano, L.; Cellura, M.; et al. Overview and future challenges of nearly zero energy buildings (nZEB) design in southern Europe. Energy Build. 2017, 155, 439–458. [Google Scholar] [CrossRef]
  7. Liu, Z.; Zhou, Q.; Tian, Z.; He, B.; Jin, G. A comprehensive analysis on definitions, development, and policies of nearly zero energy buildings in China. Renew. Sustain. Energy Rev. 2019, 114, 109314. [Google Scholar] [CrossRef]
  8. Liu, M.; Heiselberg, P. Energy flexibility of a nearly zero-energy building with weather predictive control on a convective building energy system and evaluated with different metrics. Appl. Energy 2019, 233–234, 764–775. [Google Scholar] [CrossRef]
  9. Yang, X.; Zhang, S.; Xu, W. Impact of zero energy buildings on medium-to-long term building energy consumption in China. Energy Policy 2019, 129, 574–586. [Google Scholar] [CrossRef]
  10. Li, H.; Xu, W.; Yu, Z.; Wu, J.; Sun, Z. Application analyze of a ground source heat pump system in a nearly zero energy building in China. Energy 2017, 125, 140–151. [Google Scholar] [CrossRef]
  11. Tsioumas, E.; Jabbour, N.; Koseoglou, M.; Mademlis, C. A novel control strategy for improving the performance of a nearly zero energy building. IEEE Trans. Power Electron. 2020, 35, 1513–1524. [Google Scholar] [CrossRef]
  12. Huang, P.; Sun, Y. A collaborative demand control of nearly zero energy buildings in response to dynamic pricing for performance improvements at cluster level. Energy 2019, 174, 911–921. [Google Scholar] [CrossRef]
  13. Martinez, A.; De Garayo, S.D.; Aranguren, P.; Astrain, D. Assessing the reliability of current simulation of thermoelectric heat pumps for nearly zero energy buildings: Expected deviations and general guidelines. Energy Convers. Manag. 2019, 198, 111834. [Google Scholar] [CrossRef]
  14. Esbensen, T.V.; Korsgaard, K.V. Dimensioning of the solar heating system in the zero energy house in Denmark. Sol. Energy 1977, 19, 195–199. [Google Scholar] [CrossRef]
  15. Passive House Institute. About Passive House-What Is a Passive House? Available online: https://passivehouse.com/02_informations/01_whatisapassivehouse/01_whatisapassivehouse.htm (accessed on 29 July 2021).
  16. The Government of the Korea. 2050 Carbon Neutral Strategy. Available online: https://unfccc.int/sites/default/files/resource/LTS1_RKorea.pdf (accessed on 29 July 2021).
  17. United States President Bush. Strengthening federal environmental, energy, and transportation management. U.S. Natl. Arch. Rec. Adm. 2007, 72, 3919–3923. [Google Scholar]
  18. Cassidy, R.; Schneider, J.W. Zero and Net-Zero Energy Buildings + Homes. 2011. Available online: www.bdcnetwork.com/sites/default/files/Zero%20and20Net-Zero%20Energy%20Buildings%20%2B%20Homes.pdf (accessed on 29 July 2021).
  19. GB/T 51350-2019; Technical Standard for Nearly Zero Energy Buildings. China Architecture Publishing & Media Co., Ltd.: Beijing, China, 2019.
  20. Petidis, I.; Aryblia, M.; Daras, T.; Tsoutsos, T. Energy saving and thermal comfort interventions based on occupants’ needs: A students’ residence building case. Energy Build. 2018, 174, 347–364. [Google Scholar] [CrossRef]
  21. Energy Performance of Buildings Directive. Available online: https://ec.europa.eu/energy/topics/energy-efficiency/energy-efficient-buildings/energy-performance-buildings-directive_en (accessed on 29 July 2021).
  22. Certification Criteria for the Passive House, EnerPHit and PHI Low Energy Building Standard. Available online: https://passiv.de/downloads/03_building_criteria_en.pdf (accessed on 29 July 2021).
  23. Moran, P.; O’Connell, J.; Goggins, J. Sustainable energy efficiency retrofits as residential buildings move towards nearly zero energy building (nZEB) standards. Energy Build. 2020, 211, 109816. [Google Scholar] [CrossRef]
  24. Hamburg, A.; Kuusk, K.; Mikola, A.; Kalamees, T. Realisation of energy performance targets of an old apartment building renovated to nZEB. Energy 2020, 194, 116874. [Google Scholar] [CrossRef]
  25. Asdrubali, F.; Baggio, P.; Prada, A.; Grazieschi, G.; Guattari, C. Dynamic life cycle assessment modelling of a nZEB building. Energy 2020, 191, 116489. [Google Scholar] [CrossRef]
  26. Attia, S.; Shadmanfar, N.; Ricci, F. Developing two benchmark models for nearly zero energy schools. Appl. Energy 2020, 263, 114614. [Google Scholar] [CrossRef] [Green Version]
  27. Yang, D.; Wei, H.; Shi, R.; Wang, J. A demand-oriented approach for integrating earth-to-air heat exchangers into buildings for achieving year-round indoor thermal comfort. Energy Convers. Manag. 2019, 182, 95–107. [Google Scholar] [CrossRef]
  28. Mateus, R.; Silva, S.M.; de Almeida, M.G. Environmental and cost life cycle analysis of the impact of using solar systems in energy renovation of southern European single-family buildings. Renew. Energy 2019, 137, 82–92. [Google Scholar] [CrossRef]
  29. Ferrari, S.; Beccali, M. Energy-environmental and cost assessment of a set of strategies for retrofitting a public building toward nearly zero-energy building target. Sustain. Cities Soc. 2017, 32, 226–234. [Google Scholar] [CrossRef]
  30. National Bureau of Statistics of China. China Statictical Yearbook 2020. Available online: http://www.stats.gov.cn/tjsj/ndsj/2020/indexch.htm (accessed on 29 July 2021).
  31. Tsinghua University Building Energy Conservation Research Center. 2019 Annual Report on China Building Energy Efficiency; China Architecture Publishing & Media Co., Ltd.: Beijing, China, 2019. [Google Scholar]
  32. China Electricity Council. List of Statistical Data of the Power Industry in 2020. Available online: https://www.cec.org.cn/upload/1/editor/1611623903447.pdf (accessed on 29 July 2021).
  33. Ascione, F.; Bianco, N.; Mauro, G.M.; Napolitano, D.F. Building envelope design: Multi-objective optimization to minimize energy consumption, global cost and thermal discomfort. Application to different Italian climatic zones. Energy 2019, 174, 359–374. [Google Scholar] [CrossRef]
  34. O’Donovan, A.; O’Sullivan, P.D.; Murphy, M.D. Predicting air temperatures in a naturally ventilated nearly zero energy building: Calibration, validation, analysis and approaches. Appl. Energy 2019, 250, 991–1010. [Google Scholar] [CrossRef]
  35. Song, J.; Oh, S.; Song, S.J. Effect of increased building-integrated renewable energy on building energy portfolio and energy flows in an urban district of Korea. Energy 2019, 189, 116132. [Google Scholar] [CrossRef]
  36. Shen, P.; Braham, W.; Yi, Y.; Eaton, E. Rapid multi-objective optimization with multi-year future weather condition and decision-making support for building retrofit. Energy 2019, 172, 892–912. [Google Scholar] [CrossRef]
  37. Jafari, A.; Valentin, V. An optimization framework for building energy retrofits decision-making. Build. Environ. 2017, 115, 118–129. [Google Scholar] [CrossRef]
  38. Asadi, E.; Silva, M.G.D.; Antunes, C.H.; Dias, L.; Glicksman, L. Multi-objective optimization for building retrofit: A model using genetic algorithm and artificial neural network and an application. Energy Build. 2014, 81, 444–456. [Google Scholar] [CrossRef]
  39. Li, H.X.; Li, Y.; Jiang, B.; Zhang, L.; Wu, X.; Lin, J. Energy performance optimisation of building envelope retrofit through integrated orthogonal arrays with data envelopment analysis. Renew. Energy 2020, 149, 1414–1423. [Google Scholar] [CrossRef]
  40. Feng, J.; Yin, G.; Tuo, H.; Niu, Z. Parameter optimization and regression analysis for multi-index of hybrid fiber-reinforced recycled coarse aggregate concrete using orthogonal experimental design. Constr. Build. Mater. 2021, 267, 121013. [Google Scholar] [CrossRef]
  41. Zhu, J.; Chew, D.A.S.; Lv, S.; Wu, W. Optimization method for building envelope design to minimize carbon emissions of building operational energy consumption using orthogonal experimental design (OED). Habitat Int. 2013, 37, 148–154. [Google Scholar] [CrossRef]
  42. Dumarey, M.; Wikström, H.; Fransson, M.; Sparén, A.; Tajarobi, P.; Josefson, M.; Trygg, J. Combining experimental design and orthogonal projections to latent structures to study the influence of microcrystalline cellulose properties on roll compaction. Int. J. Pharm. 2011, 416, 110–119. [Google Scholar] [CrossRef] [PubMed]
  43. DesignBuilder. An Integrated Set of In-Depth, High-Productivity Tools to Assist with Sustainable Building Design and Assessment. Available online: https://designbuilder.co.uk/software/product-overview (accessed on 29 July 2021).
  44. JGJ26-2010; Design Standard for Energy Efficiency of Residential Buildings in Severe Cold and Cold Zones. China Architecture Publishing & Media Co., Ltd.: Beijing, China, 2010.
  45. ASHRAE Guideline 14-2014: Measurement of Energy, Demand and Water Savings. Available online: https://upgreengrade.ir/admin_panel/assets/images/books/ASHRAE%20Guideline%2014-2014.pdf (accessed on 29 July 2021).
  46. Datsiou, K.C. Bioinspired improvement of laminated glass. Science 2019, 364, 1232–1233. [Google Scholar] [CrossRef]
  47. Huang, P.; Huang, G.; Sun, Y. A robust design of nearly zero energy building systems considering performance degradation and maintenance. Energy 2018, 163, 905–919. [Google Scholar] [CrossRef]
  48. Valančius, K.; Vilutienė, T.; Rogoža, A. Analysis of the payback of primary energy and CO2 emissions in relation to the increase of thermal resistance of a building. Energy Build. 2018, 179, 39–48. [Google Scholar] [CrossRef]
  49. Becchio, C.; Bottero, M.C.; Corgnati, S.P.; Dell Anna, F. Decision making for sustainable urban energy planning: An integrated evaluation framework of alternative solutions for a NZED (net zero-energy district) in Turin. Land Use Policy 2018, 78, 803–817. [Google Scholar] [CrossRef]
  50. 2019 Refinement to the 2006 IPCC Guidelines for National Greenhouse Gas Inventories. Available online: https://www.ipcc-nggip.iges.or.jp/public/2019rf/index.html (accessed on 29 July 2021).
  51. The State Council of the People’s Republic of China. Notice of the “Thirteenth Five-Year Plan” for the Control of Greenhouse Gas Emissions. Available online: http://www.gov.cn/zhengce/content/2016-11/04/content_5128619.htm (accessed on 29 July 2021).
  52. International Energy Agency. Global CO2 Emissions in 2019. Available online: https://www.iea.org/articles/global-co2-emissions-in-2019 (accessed on 29 July 2021).
  53. U.S. Energy Information Agency. How Much Carbon Dioxide Is Produced per Kilowatthour of U.S. Electricity Generation? Available online: https://www.eia.gov/tools/faqs/faq.php?id=74&t=11 (accessed on 29 July 2021).
  54. European Environmental Agency. Greenhouse Gas Emission Intensity of Electricity Generation. Available online: https://www.eea.europa.eu/data-and-maps/daviz/co2-emission-intensity-6#tab-googlechartid_googlechartid_googlechartid_googlechartid_chart_11111 (accessed on 29 July 2021).
Figure 1. Building model created in Designbuilder. (a) architectural appearance, (b) first-floor layout.
Sustainability 14 04451 g001aSustainability 14 04451 g001b
Figure 2. Energy distribution of coal in the CHP process.
Sustainability 14 04451 g002
Figure 3. Comparison between the simulated and monitored monthly energy consumption data.
Sustainability 14 04451 g003
Figure 4. Range analysis of the impact of each factor on (a) TECI, (b) DH, and (c) DC.
Sustainability 14 04451 g004
Figure 5. Daily building energy consumption curve and energy reduction rates of test No. 3 in Table 8. (a) heating and cooling load, (b) energy reduction rates.
Sustainability 14 04451 g005
Figure 6. Heat balance of a typical 50MW CHP unit.
Sustainability 14 04451 g006
Figure 7. CO2 emission factor for heating of different technologies.
Sustainability 14 04451 g007
Figure 8. The carbon emissions of CHP, CB and HP for heating before and after renovation.
Sustainability 14 04451 g008
Table 1. Basic parameters of the studied building.
Common ComponentDensitySpecific Heat
Cement mortar1650 kg/m3920 J/kg·K
EPS15 kg/m31400 J/kg·K
Concrete2300 kg/m31000 J/kg·K
Waterproof material2100 kg/m31000 J/kg·K
Structural elementHeat transfer coefficientComponent *Thickness
External wall0.5 W/m2·KCement mortar25 mm
EPS expended polystyrene50 mm
Concrete200 mm
Cement mortar25 mm
Flat roof0.4 W/m2·KConcrete30 mm
Waterproof material4 mm
EPS expended polystyrene84 mm
Concrete100 mm
Cement mortar25 mm
Window §2.0 W/m2·KGlass3 mm
Air13 mm
Glass3 mm
Note: * From the outermost layer to innermost layer in descending order. § Double glazed aluminum window frame.
Table 2. Indoor settings of different rooms.
FunctionOccupant Density (People/m2)Illumination (lux)Lighting Density (W/m2)DHW (l/People·Day)
Bedroom0.0229756NA *
Bathroom0.0187100640
Lounge0.01881506NA
Kitchen0.02372006NA
Balcony0.01881004NA
Circulation **0.01551004.5NA
Note: * NA—not applicable, ** circulation area is separated from the outdoor environment by the external wall but not cooled nor heated. Occupant density data are obtained from field investigations, and other data are extracted from national standards [44].
Table 3. Selected factors and values of each level.
FactorDescriptionUnitLevel
12345
AExternal wall heat transfer coefficientW/m2·k0.50.40.30.20.1
BRoof heat transfer coefficientW/m2·k0.40.3250.250.1750.1
CInfiltration N50ac/h3.62.821.20.4
DWindow heat transfer coefficientW/m2·k21.751.51.251
EBlankN/A12345
Table 4. Orthogonal experimental results.
Test No.Factor Level *TECI §DH §DC §
ABCDE
11 (0.5)1 (0.4)1 (3.6)1 (2)189.49 61.85 2.03
212 (0.325)2 (2.8)2 (1.75)579.71 52.05 2.05
313 (0.25)3 (2)3 (1.5)470.02 42.31 2.1
414 (0.175)4 (1.2)4 (1.25)360.51 32.75 2.15
515 (0.1)5 (0.4)5 (1)251.43 23.61 2.21
62 (0.4)154555.01 27.21 2.19
72215467.45 39.66 2.18
82321374.45 46.78 2.06
92432264.94 37.22 2.11
102543155.70 27.93 2.16
113 (0.3)142459.12 31.37 2.14
123253350.32 22.51 2.2
133314262.43 34.64 2.18
143425153.10 25.25 2.24
153531559.68 31.95 2.12
164 (0.2)135347.78 19.90 2.27
174241253.91 26.16 2.14
184352145.55 17.74 2.2
194413557.07 29.29 2.17
204524448.18 20.33 2.24
215 (0.1)123251.03 23.27 2.15
225234143.01 15.18 2.22
235345536.00 8.09 2.3
245451440.72 12.96 2.15
255512350.96 23.22 2.13
Note: * See Table 3 for specific values of individual factor at prescribed level. § Unit: kWh/m2·a.
Table 5. Variance analysis of the impact of the factors on TECI.
SourcedfMean SquareFSig.
Corrected Model16227.398288.5320.000
Intercept181,518.244103,433.6660.000
Factor A4524.835665.9330.000
Factor B442.03253.3320.000
Factor C4220.476279.7490.000
Factor D4122.249155.1140.000
Error80.788
Total25
Corrected Total24
Table 6. Variance analysis of the impact of the factors on DH.
SourcedfMean SquareFSig.
Corrected Model16229.406298.7770.000
Intercept121,505.04928,008.0770.000
Factor A4528.561688.3950.000
Factor B442.19954.9600.000
Factor C4221.885288.9820.000
Factor D4124.980162.7730.000
Error80.768
Total25
Corrected Total24
Table 7. Variance analysis of the impact of the factors on DC.
SourcedfMean SquareFSig.
Corrected Model160.00636.8480.000
Intercept1117.029672,581.1720.000
Factor A40.00844.0460.000
Factor B40.0001.2870.352
Factor C40.00212.9540.001
Factor D40.01689.1030.000
Error80.000
Total25
Corrected Total24
Table 8. Renovation schemes.
Test No.Factor Level *TECI §DH §DC §
ABCD
1315157.85 30.12 2.12
2414155.5927.85 2.13
3415151.5423.792.15
Note: * See Table 3 for specific values of individual factor at prescribed level. § Unit: kWh/m2·a. TECI: total energy consumption index, DH, Heating demand, DC, cooling demand.
Table 9. Coal characteristics and CO2 emission factors of coal-fired boiler and CHP.
LHVCEFcoalCEFBCEFCHP
(MJ/kg)(t CO2/TJ *)(g CO2/kWhh)(g CO2/kWhh)
anthracite coal2794.44361.69225.3
bituminous coal2489340.85212.3
lignite coal1998.56377.46235.1
Note: * t CO2 = tonne CO2, TJ = 1012 J.
Table 10. CO2 emission factors of grid and heat pump.
ItemUnitsChina, 2020U.S., 2019E.U., 2019Global Average, 2019
CEFgrid g CO2/kWhe550417.68275340
COPN/A2222
CEFHPg CO2/kWhh275208.84137.5170
Publisher’s Note: MDPI stays neutral with regard to jurisdictional claims in published maps and institutional affiliations.

