Article

Development of Bioclimatic Passive Designs for Office Building in Burkina Faso

by
Abraham Nathan Zoure
1 and
Paolo Vincenzo Genovese
2,*
1
School of Architecture, Tianjin University, Tianjin 300072, China
2
College of Civil Engineering and Architecture, Zhejiang University, Hangzhou 310058, China
*
Author to whom correspondence should be addressed.
Sustainability 2022, 14(7), 4332; https://doi.org/10.3390/su14074332
Submission received: 11 February 2022 / Revised: 28 March 2022 / Accepted: 29 March 2022 / Published: 6 April 2022
(This article belongs to the Topic Architectures, Materials and Urban Design)

Abstract

:
This article focuses on adopting effective and affordable bioclimatic building design strategies in Ouagadougou, in the Sudano-Sahelian zone of Burkina Faso. A model representing a standard office building and relevant parameters were input in EnergyPlus, and scenarios were analyzed to evaluate the effect of natural ventilation, window shading, dehumidification with night ventilation, and evaporative cooling with night ventilation on thermal comfort and energy consumption. First, the American Society of Heating, Refrigerating, and Air-conditioning Engineers (ASHRAE) Standard 55 adaptive comfort model was used to compare discomfort hours and interior temperatures between a conventional office design and improved models using passive approaches. The simulations further tested the reduction in energy cooling demand and energy consumption. The results demonstrated that natural ventilation was the most effective passive cooling technique, helping to reduce the annual discomfort hours by 40% and the annual energy consumption by 30%. Combining passive strategies is the best scenario, with a year of office occupancy resulting in just 617 h of discomfort, a 42% reduction in the annual energy cooling demand, and a 43% reduction in the annual energy consumption. The simulations demonstrated the effectiveness of affordable passive design solutions applicable even in existing office buildings and their significance for the sustainable development of fast-urbanizing Sub-Saharan countries.

1. Introduction

Global warming is now widely acknowledged as being caused by an increase in atmospheric concentrations of greenhouse gases. Climate change is real and will impact every country. Due to their lack of financial and technological resources to cope with global warming repercussions, as well as their population growth, emerging nations will be the most impacted [1], particularly in Sub-Saharan African communities that depend heavily or entirely on rain-fed agriculture or pastoralism [2].
As with the rest of the Sub-Saharan countries, Burkina Faso is experiencing rapid demographic growth, implying a high demand for decent and sustainable housing. Indeed, Burkina Faso’s total population was estimated to be 20 million in 2020, with an estimated 3 million living in Ouagadougou’s administrative and political capital. Moreover, the estimated urbanization rate of 32% (2016) was expected to reach 34% in 2020 and 40% by 2025 [3]. This urbanization has raised household and commercial buildings’ energy usage. Furthermore, this country has a changing climate. The country’s eastern and southern regions, which used to enjoy favorable climatic conditions, are increasingly troubled by high temperatures and dry spells. Climate models predict a 3–4 °C warming in Ouagadougou and the central part of the country between 2080 and 2099, and Burkina Faso’s building cooling demands will grow by up to 99% by 2080 [4]. This is substantially hotter than the global average. A focus on the built environment of Ouagadougou (buildings, cities) shows a general application of inappropriate standards that were originally developed to serve the needs of other (Western) environments. The result is the intensive use of air conditioning to compensate for the high temperatures. Around 45% of the energy spent in buildings is used to maintain interior thermal comfort [5].
When designing energy management plans, buildings significantly affect greenhouse gas pollution by reducing them substantially and contributing to reaching energy-saving targets [6]. To overcome this challenge, local architects (e.g., Pritzker laureate Diébédo Francis Kéré), academics, and experts are concentrating their efforts on the design of energy-efficient buildings. Energy-efficient buildings strive to provide a sustainable environment through passive design adjustments and low-energy technology. Passive cooling is a cost-effective passive design method that is gaining popularity due to the increased interest in energy conservation and environmental preservation. However, this is not always a viable choice. It is possible, although it is primarily dependent on climate circumstances. Thus, designers must have a thorough awareness of the building environment and its climatic conditions to implement appropriate passive cooling solutions. A bioclimatic approach is used when constructing a building with passive cooling measures. It enables the estimation of the comfort-improving potential of various passive cooling solutions and optimizes building comfort and energy efficiency. In summary, the bioclimatic method assures climate-sensitive building design to optimize building comfort and energy efficiency.
The purpose of this research is to identify passive and low-energy strategies that may be used to enhance thermal comfort in office buildings throughout climate change and significantly reduce the energy cooling demand. It is intended to foster the development of creative and design solutions among building design experts. Previous research has been conducted on passive and low-energy cooling systems in Sub-Saharan Africa, especially notable in the Burkina Faso environment. However, this research is especially interested in promoting a viable, affordable, and likely easier method of enhancing thermal comfort in new, as well as existing, office buildings in Ouagadougou, the capital of Burkina Faso.

2. Literature Review of Bioclimatic Approach

The bioclimatic technique is used to forecast the potential of various passive tactics via the development of a bioclimatic chart, which covers the zone of comfort and the limits of passive cooling solutions. The psychometric chart displays a projection of meteorological data, such as temperature and humidity, at any point in time. It is often used to examine climatic variables from a human thermal comfort perspective. Olgyay [7] pioneered the use of bioclimatic charts to construct environmentally sensitive buildings. With the use of an ambient temperature and relative humidity line, he depicted the human thermal comfort zone in the center of his bioclimatic chart. However, the chart’s initial design was developed without considering the building’s indoor setting. Later, Givoni introduced his bioclimatic chart for buildings [8]. Apart from identifying the comfort zone, several passive design concepts were shown in his research. These passive measures aided in attaining human thermal comfort inside the building during times when environmental conditions were unfavorable to human comfort. Milne and Givoni [9] improved and enlarged the building bioclimatic chart, creating additional zones for human thermal comfort. Dekay and Brown created a chart combining Olgyay’s and Givoni’s [10]. On Olgyay’s graphic, the authors had drawn Givoni’s passive design zones. Szokolay [11] improved Givoni’s bioclimatic chart for buildings once more by introducing control potential zones. He emphasized a thorough examination of local climatic variables while designing passive design techniques. The zones for passive methods were set using ASHRAE’s standard effective temperature boundaries. ANSI/ASHRAE 55: Thermal environmental conditions for human occupation is an American national standard published by ASHRAE that establishes the inner environmental conditions ranges to obtain acceptable thermal comfort for the occupants of the buildings. In recent years, researchers use a variety of comfort models to push the limits of a variety of passive methods. Different research [12,13,14] relied heavily on ASHRAE Standard 55, whereas some still [15,16,17,18,19,20] relied heavily on Givoni’s technique. Studies [21,22] were based on Szokolay’s control potential zone strategy. Studies [23,24], based on Tropical Summer Index comfort model illustrated some bioclimatic approaches for indian cities.
Numerous strategies were investigated worldwide to increase indoor spaces’ thermal comfort to adapt to and prevent climate change. Methods are used to analyze the geometry, orientation, roof, and landscape of a structure [25,26,27]. Ghada Elshafei and colleagues [28] investigated the influence of various climatic conditions on passive design measures and their correlation to building designs in order to increase interior thermal comfort in Egypt’s diverse temperature zones. Different forms were examined against the impact of orientation, temperature, and air velocity using computer simulations to determine the most appropriate environmentally sensitive model of urban geometry for a significant national residential building. Their findings demonstrated that the layout of buildings, wind direction, and wind speed all have a significant role in defining natural ventilation within these domains, supporting the green building idea and sustainable design for a better way of life. Ying, X., and Li, W. [29] examined the impacts of the side percentage of a building’s floor design on energy consumption and construction costs in their research using regression analysis. Emmerich, S. J., Polidoro, B.m, and Axley, J. W. [30] developed a climate suitability analysis method for determining a location’s potential for direct ventilative cooling and night-time ventilative cooling and demonstrated that the adaptive thermal comfort option has the potential to significantly increase the effectiveness of natural ventilation cooling in several U.S. cities.
According to Dnyandip K. Bhamare, Manish K. Rathod, and Jyotirmay Banerjee [31], the efficient use of various passive techniques in buildings is gaining attention due to the increased interest in energy conservation and environmental preservation since it is mostly dependent on climatic conditions. Thus, in order to suggest an appropriate passive strategy for a specific climatic condition in a building, the creation of a bioclimatic analysis tool is required to prove its feasibility.
According to Derrick Kajjobat and colleagues [32], the results of questionnaire surveys used to obtain occupant subjective thermal sensation votes indicated that the majority of occupants preferred cooler temperatures during the day, which is supported by the use of adaptive measures to obtain thermal comfort and air quality measurements in naturally ventilated residential buildings in Kampala, Uganda. Although the authors of the research [33] lacked data on comfort in residential environments in intertropical sub-Saharan Africa, they defined principles for developing more comfortable structures in Cameroon based on data from three climatic areas in the country.
T. Dorcas Mobolade and P. Pourvahidi [34] established a bioclimatic-based method for architecture in Nigeria by analyzing climatic data from thirty-six Nigerian meteorological stations on the peculiarities of each area in their research. They identified the most appropriate and effective design strategies, quantitatively and qualitatively, for the preliminary stage of buildings from various Nigerian vernacular architecture typologies and demonstrated numerous techniques and concepts that vernacular architects have used for years to design buildings that could be revived. B. Widera [35] conducted a comparative investigation of user comfort and thermal performance in case studies typical of each vernacular housing type in western sub-Saharan Africa to determine thermal comfort conditions. The study’s conclusion set the groundwork for developing a sustainable, bioclimatic, and economical housing model for western Sub-Saharan Africa.
There are relatively few scientific articles on Ouagadougou’s bioclimatic charts, especially when it comes to office buildings. On the other hand, specific papers establish particular ways of increasing thermal comfort. In their study [36], L. Rincón, A. Carrobé, I. Martorell, and M. Medrano showed how passive design might improve thermal comfort in clay houses in sub-Saharan nations, most notably Ouagadougou, Burkina Faso. Their research focuses on promoting earthbag building as a realistic, economical, and pleasant technique for increasing thermal comfort in Burkina Faso’s houses. María Lidón de Miguel and colleagues [37] investigated the reasons behind the existing local perspective of traditional construction methods in Burkina Faso to evaluate how the country’s architecture may be developed sustainably. Their analysis demonstrated how the earth’s value has eroded as it has been more connected to “non-definitive constructs”; this impression results from narratives advanced by foreign actors from the late nineteenth century. Césaire Makiètyn Hema and colleagues [38] suggested a classification of vernacular building methods based on the wall material utilized and investigated the hygrothermal behavior of different wall compositions. Bachir Ismaël Ouédraogo and colleagues [39] addressed the twin dilemma of Burkina Faso engineers: Designing sustainable low-energy public buildings while maintaining essential thermal comfort in the face of rising temperatures induced by climate change.
This study follows the same concept of passive and low-energy cooling by using building material selection to provide effective cooling and eliminate or significantly reduce the need for conventional cooling systems such as air conditioning that rely on motorized mechanical components to transfer fluids and air. The significance of this study is that it demonstrates how, by using bioclimatic solutions that are simple to apply even in existing structures, it is possible to drastically reduce the energy consumption of office buildings situated in Ouagadougou or climates similar to it.

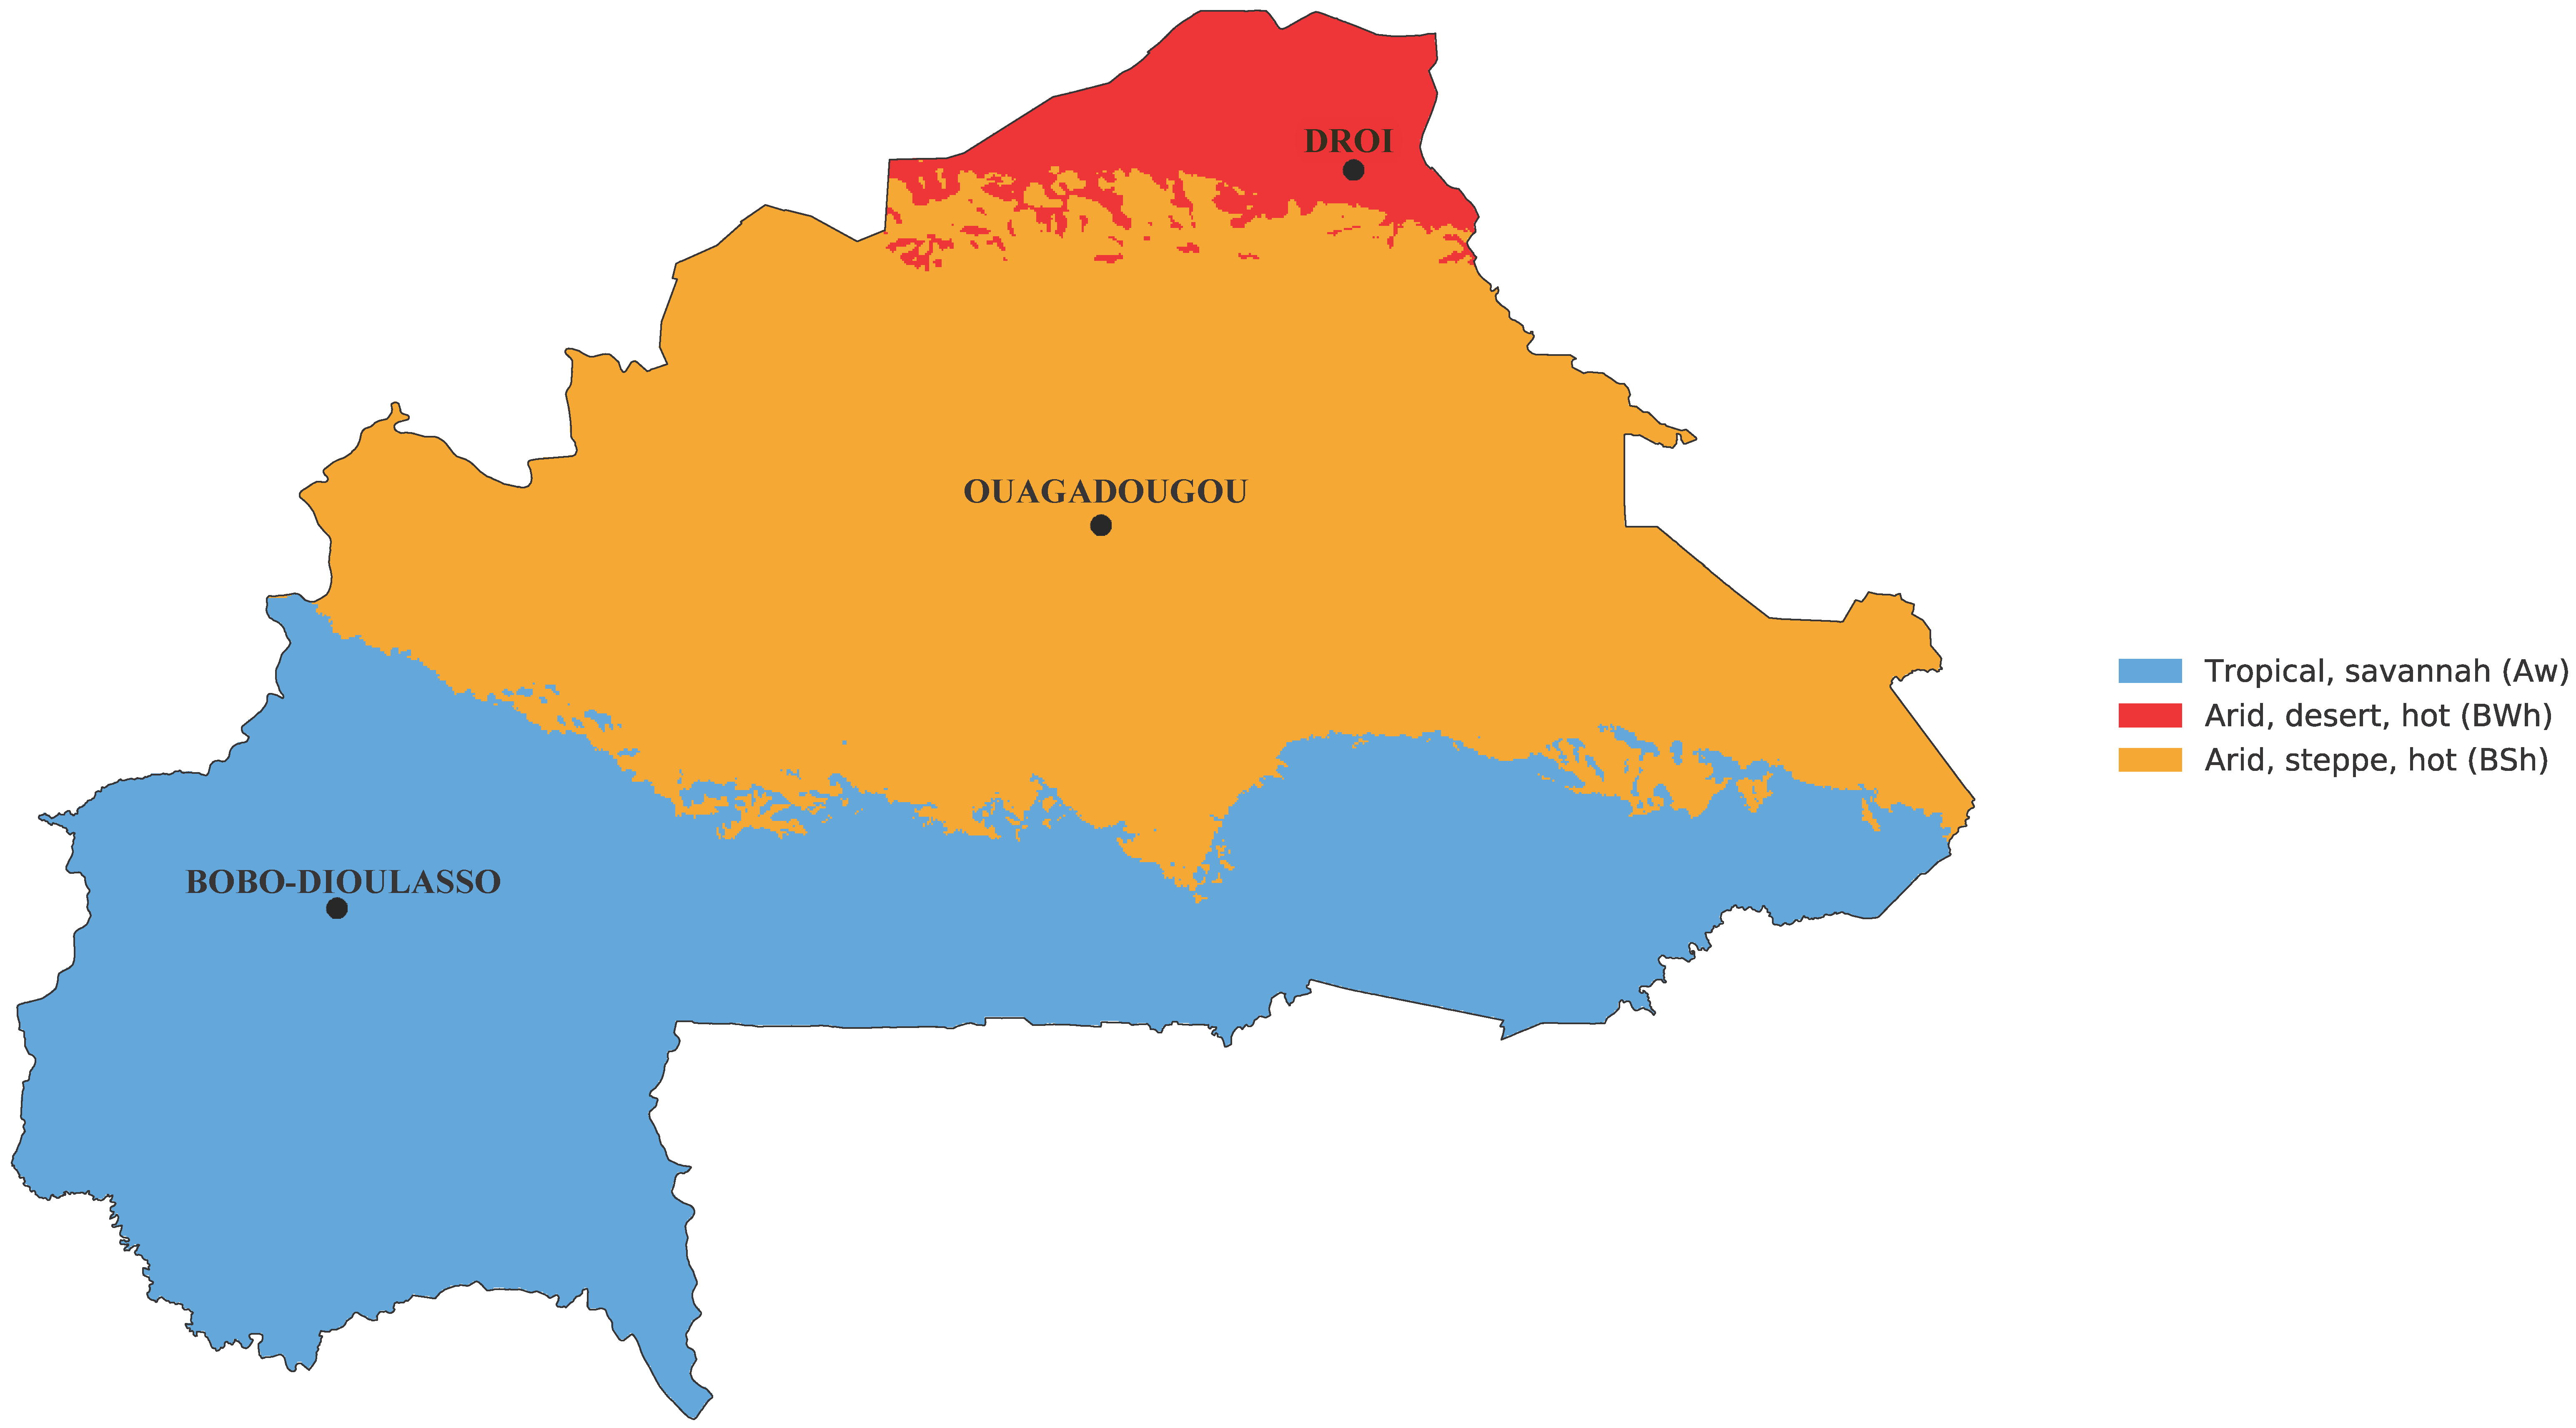
3. Climate and Different Typology of Urban Architecture of Ouagadougou

3.1. Climate of Ouagadougou

Ouagadougou is precisely located at latitude 12.353° N, longitude 1.512° W, 316 m above sea level [40]. In the Köppen–Geiger climate classification, its climate is equivalent to the Arid, Steppe, Hot (BSh) zone [41] as seen in Figure 1. This climate features an eight-month hot and dry season and a four-month rainy season with 600–900 mm/year of rainfall and slightly cooler temperatures in a transitional zone in terms of rainfall and temperature [42]. During the warmest months, March through May, daytime temperatures exceed 40 °C. The number of hours of solar energy received each day is extremely consistent throughout the year, around 10 h. The sun’s zenith is 55° at its lowest point during the December solstice, and 101° degrees at the June solstice, reaching a perpendicular position to the horizontal in the months between the equinox and the June solstice [43]. The weather data collected represent the climatic data from 2004 to 2018. Table 1 summarizes the important data calculated for the city of Ouagadougou.

3.2. Typology of Urban Architecture of Ouagadougou

As in other nations in Sub-Saharan Africa, Burkina Faso is undergoing rapid population expansion, which implies a strong need for housing and office space as small and medium-sized firms (SMEs) increase [44]. Due to the availability of imported resources, the usage of concrete, steel, and bricks in urban environments has increased. The use of these non-traditional materials would compound the adverse effect on the environment and existing infrastructure since more people are expected to reside in cities by 2050 [45]. Based on field observations and the literature, three distinct styles of building construction may be identified in the city of Ouagadougou [46,47,48].

3.2.1. Type 1: Modern Cement Block Buildings

This is the predominant architectural style of Ouagadougou [44]. The envelopes of these structures are constructed of cement as seen in Figure 2. Typically, the envelopes consist of a 2 cm cement outside coating, a 15 or 20 cm hollow concrete block wall, and a 2 cm cement inner covering. A coat of paint may be applied to both the interior and exterior coatings to give them an aesthetic touch. The bricks are constructed with a vertical thickness of 3 to 10 cm of cement mortar. The roof might be substantial or small. It is made of reinforced concrete in the first instance. When a light roof is used, the structure is constructed entirely of hardwood rafters or metal tubes that are directly supported by the walls or reinforced concrete beams. A sheet of metal is used to cover the whole structure. When load-bearing walls are used, cement concrete or cement cyclopean concrete is used to construct the foundations. When the walls are not load-bearing, stability is achieved by the use of beams, poles, or reinforced concrete soles [46]. Offerle et al. [49] established Burkina Faso’s urban office development trend toward one- to four-story structures with wide glass windows, a style influenced by North America and Western Europe. The focus is on outward design and aesthetics rather than energy efficiency [39].

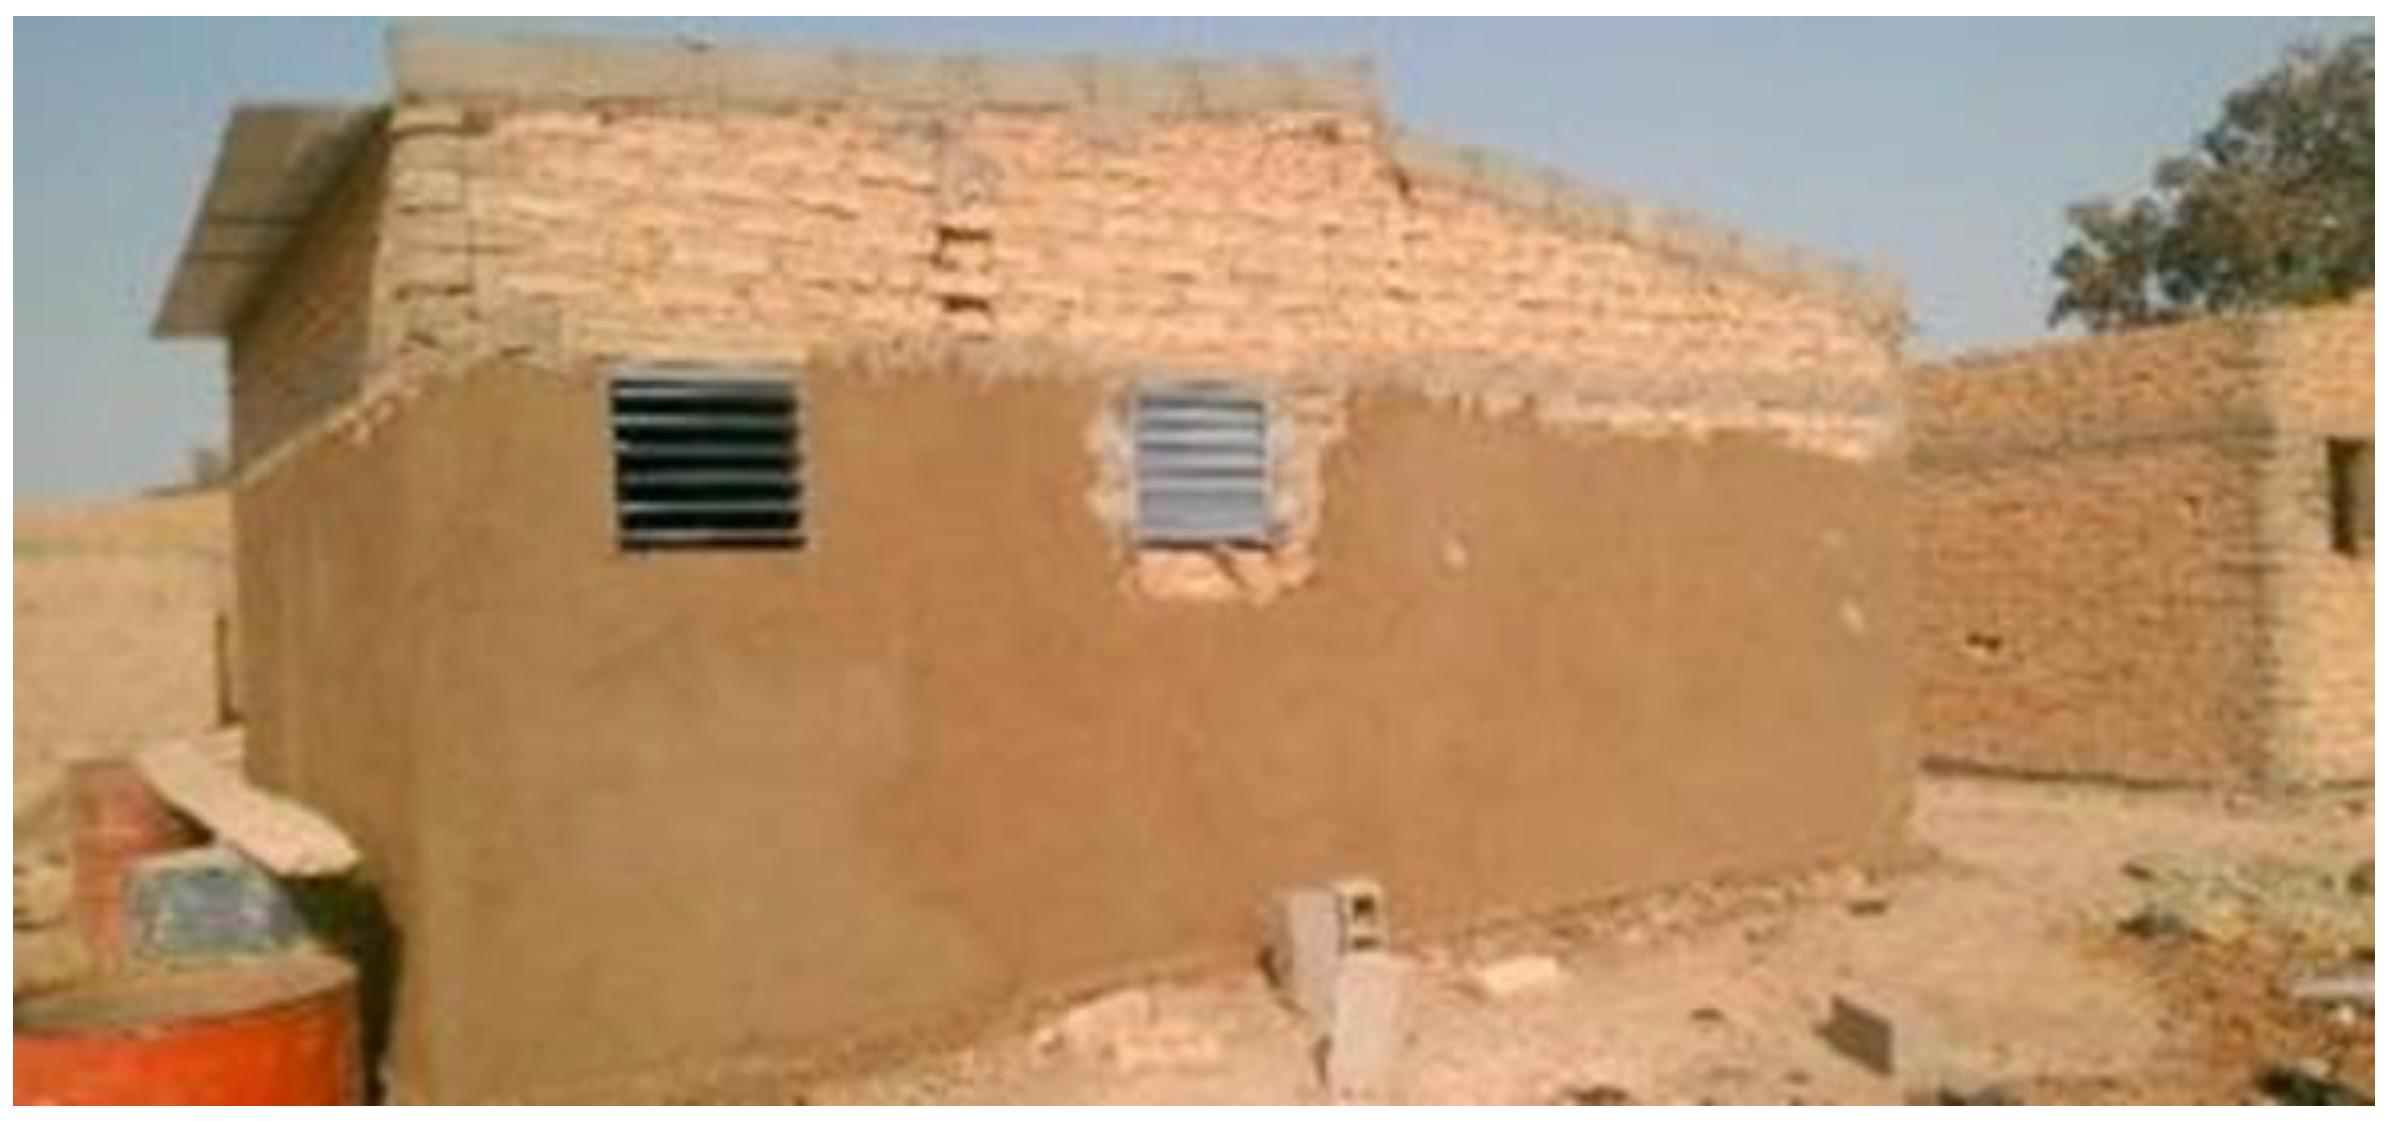
3.2.2. Type 2: Low-Buildings from Molded Earth Blocks or Adobe

This kind of building is often seen in low-income working-class areas, either inside existing subdivisions or as part of spontaneous unplanned non-parceled “neighborhoods” [45]. This building method is derived from classical architecture but has been modified by modern materials such as steel sheets, as seen in Figure 3. The percentage of clay on the ground used to make adobe varies between 10% and 40% [50]. Occasionally, walls were coated with a combination of dirt, straw, and cow dung or with cement. The earth mortar used to bind these bricks is between 2 and 5 cm thick [46]. Either a thatch roof or a sheet metal roof is used. Thatch roofs are currently quite rare in the city. When thatch is used to cover the roof, the shape of the roof might be conical, pyramidal, or two-sloped, depending on the design of the building. When the roof is made of metal sheets, the construction is a summation of hardwood rafters with a section ranging from 8 × 15 cm to 6 × 8 cm, depending on the range to be spanned [46].

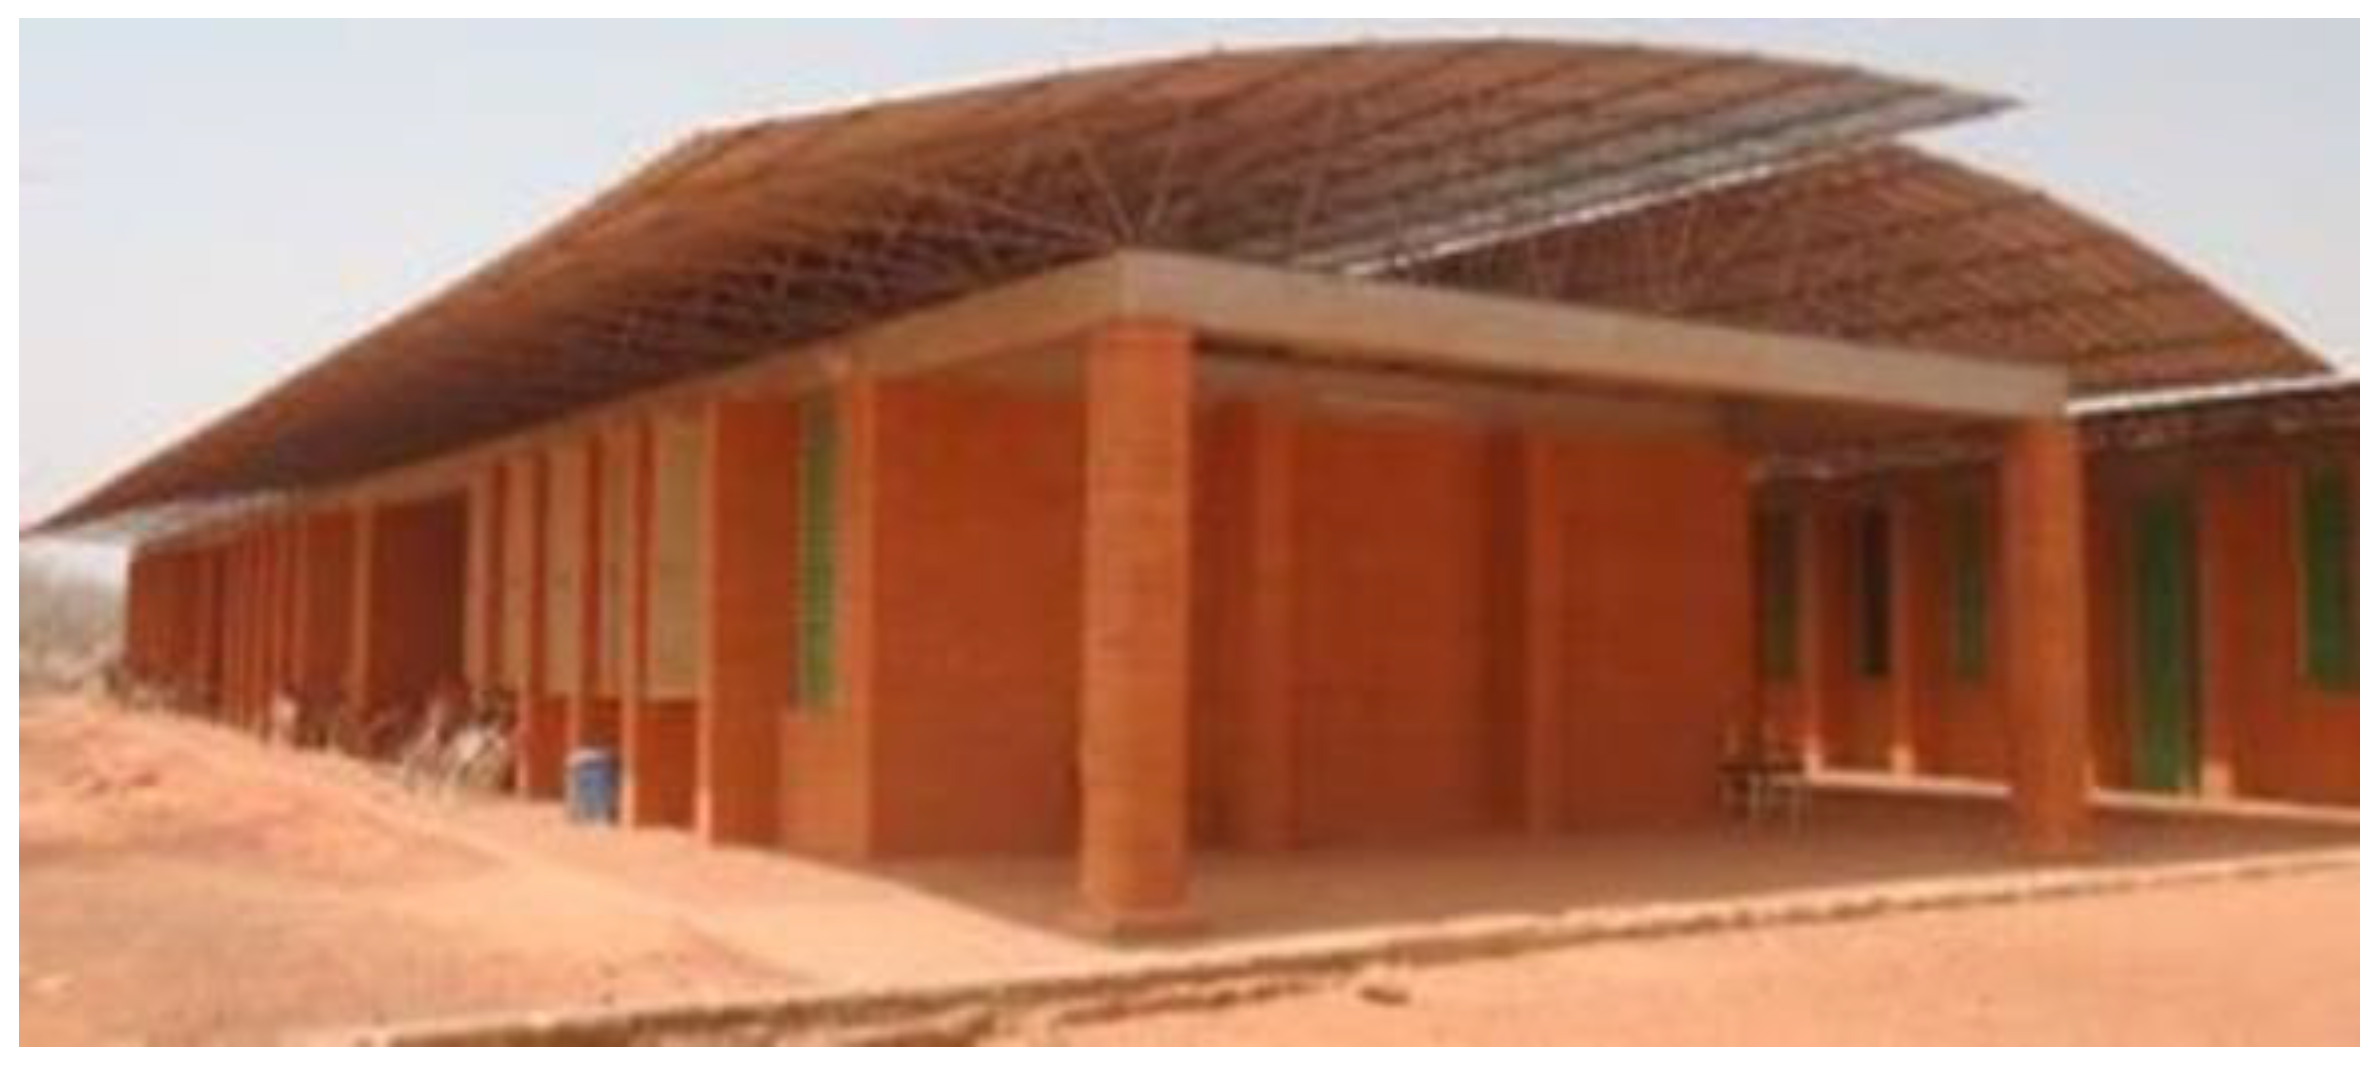
3.2.3. Type 3: Buildings Made with Compressed Earth Blocks

Compressed earth blocks (CEB) are the contemporary descendants of molded earth blocks, most generally referred to as adobe blocks as seen in Figure 4. The concept is to compress the soil using a press in order to increase the material’s quality [51]. The blocks may be assembled with or without cement mortar. The blocks are typically 29.5 × 14 × 9 cm or 22 × 14 × 11.5 cm [52]. The size of these blocks allows for a range of wall thicknesses depending on the equipment used: 14, 22, or 29.5 cm. Generally, the walls are uncoated. The roofing technology is identical to that utilized in contemporary buildings (a heavy or light roof). Typically, the walls are not load-bearing, and the structure is stabilized by a reinforced concrete frame.

4. Materials and Methods

This article details the different steps of developing passive cooling techniques for office buildings in Ouagadougou that satisfy both thermal comfort and energy efficiency requirements. Based on ASHRAE Standard 55 and different weather data of Ouagadougou, the efficiency of passive cooling solutions in a case study of conventional office buildings in Ouagadougou was evaluated in this research using the Energyplus software.
This study method started with the establishment of the thermal comfort model for the research. Weather data for the whole year collected from 2004 to 2018 for the city of Ouagadougou (Table 1) were considered as input data for the simulation. Parameters such as building materials’ thermo-physical characteristics, daily occupancy patterns, internal and exterior heat gains generated by users, airflow, and temperature were detailed and considered as input data for Energyplus.
The simulation was applied to the case study representing an office building in Ouagadougou and served as the base model. This base model was then compared to specific scenarios to analyze their effectiveness in reducing the energy cooling demand and improving thermal comfort. These scenarios are based on passive cooling strategies that have been studied in previous research, such as window shading, roof shading, natural ventilation, evaporative cooling, and night ventilation and dehumidification. Each scenario was analyzed to enlighten the worst and best scenarios that correspond to the least and most effective passive cooling techniques for the office building in Ouagadougou. Finally, a combination of all passive cooling methods representing an optimal case was considered to illustrate the difference in energy cooling demand and thermal comfort compared to the basic case without any passive cooling strategies. The method proposed in our research is shown in Figure 5.

4.1. Thermal Comfort Zone

According to the ASHRAE, thermal comfort is “that state of mind that conveys happiness with the thermal environment” [6]. The comfort zone is described as the range of climatic conditions that prevent the majority of individuals from experiencing thermal discomfort, either hot or cold. Thermal comfort requires consideration of six key factors: Metabolic rate, garment insulation, ambient air temperature, radiant temperature, airspeed, and humidity. A comfort zone may be established for a certain metabolic rate, garment insulation, airspeed, and humidity. This comfort zone is often specified in terms of a range of operating temperatures or the combinations of air temperature and the mean radiant temperature that produces thermal conditions that are acceptable to the majority of individuals.
For this research, the two comfort zones described in ASHRAE Standard 55 [16] were used: One for 0.5 clo (e.g., short-sleeved shirt and pants) and one for 1.0 clo (e.g., winter business suit), where (1 clo = 0.155 m 2 °C/W). These insulation values are typical for garments worn indoors in warm/hot and cool/cold environments, respectively. Each zone’s operating temperature range is set to achieve 80% occupant acceptance. This is based on a 10% dissatisfaction threshold for overall thermal comfort, as determined by the PMV-PPD index [17,18], plus an extra 10% discontent due to local thermal discomfort. These zones apply to the aforementioned clothing levels when the airspeed is less than 0.2 m/s and the activity level is sedentary. To keep things simple, we considered a single combined “annual” comfort zone that included both the 0.5 clo and 1.0 clo comfort zones. The maximum relative humidity is set to 0.012 kg/m3, which corresponds to a water vapor pressure of 1.91 kPa at standard pressure or a dew-point temperature of 16.8 °C. There is no specified minimum level of humidity.

4.2. Adaptive Comfort Model

The adaptive model is predicated on the premise that the external environment affects inside comfort since people can adapt to varying temperatures throughout the year. According to the adaptive hypothesis, contextual variables such as access to environmental controls and previous thermal history might affect building occupants’ thermal expectations and preferences [53]. This concept is particularly applicable to occupant-controlled, naturally ventilated rooms, where the external environment may affect the internal circumstances and hence the comfort zone. Certainly, de Dear and Brager’s tests demonstrated that inhabitants of naturally ventilated buildings had a greater tolerance for a variety of temperatures [30]. This is related to behavioral and physiological adaptations since adaptive processes come in a variety of forms. According to ASHRAE Standard 55, variances in recent thermal experiences, changes in apparel, control choices available, and adjustments in occupant expectations may all affect people’s thermal reactions [6]. The temperature of a building that is free-running (the comfort temperature Tc) may be determined using the following Equation (1) [53]:
Tc = 17.8 + 0.31 × To
To: Outdoor Running mean temperature (°C).
Tc: Operative temperature (°C).

4.3. Data Weather File Used in Simulation Packages

For years, dynamic thermal simulation has been used to simulate the performance of buildings and their thermal systems, enabling a more profound knowledge of their behavior than what is achievable using simpler methods [54]. To mimic the long-term average or typical performance of buildings, it is crucial to simulate the system’s behavior using several years of real-world weather data or a typical year’s worth of weather data. Weather characteristics such as dry bulb and wet bulb temperatures, atmospheric pressure, global sun irradiation, wind velocity, and wind direction were taken into account as data input for the simulation. Therefore, a weather file format that allows the integration of sub-hourly data EnergyPlus/ESP-r Weather’ (EPW) will be used. This study used weather data collected representing the climatic data of Ouagadougou from 2004 to 2018 provided by the UCLA Energy Design Tools Group, © Regents of the University of California.

4.4. Occupancy

The office building is configured for twelve workers. The metabolic rate (met) was utilized to determine the heat loads associated with human activities. Internal heat loads are defined as the equivalent of twelve individuals occupying the building exclusively during working hours (from 7:30 am to 4:30 pm every Monday to Saturday for a whole year) as illustrated in Table 2. According to the ASHRAE Handbook of Fundamentals, 1 met = 55.5 W/m2/person for moderately active office work [6]. Internal loads caused by electrical equipment or illumination are not taken into account. The electrical appliances that the tenant commonly uses and the time required for the simulation are also listed in Table 2.

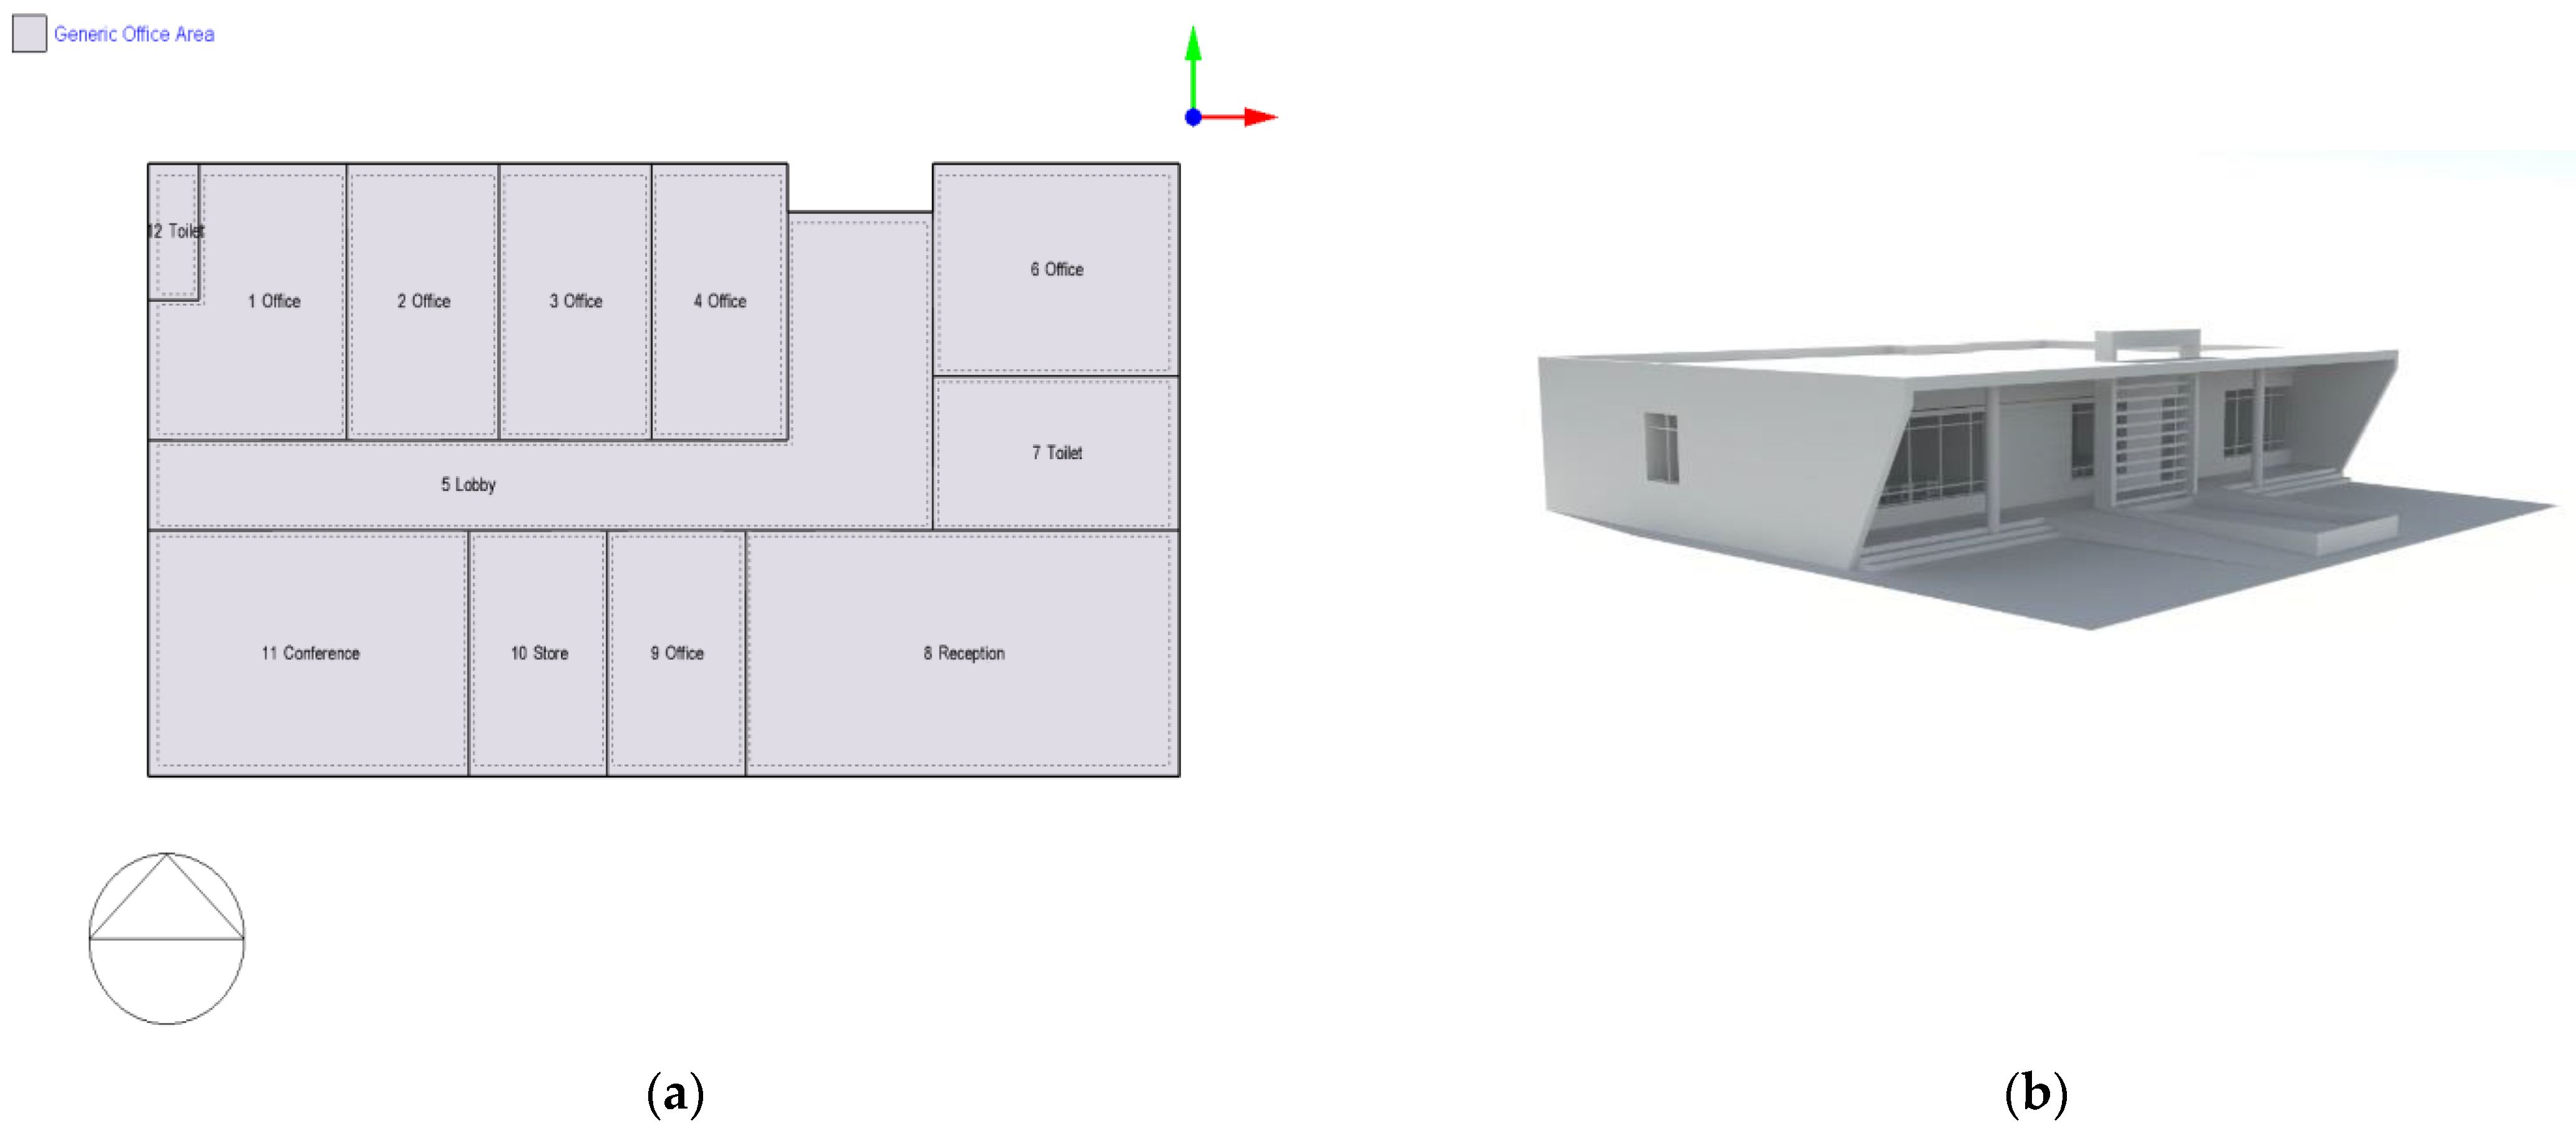
4.5. Building Simulation Base Model Description

The architecture and operating circumstances of local office buildings might differ significantly. However, energy simulations of a case study representing a typical office building operating under realistic operating circumstances may help us better understand the average energy performance of Ouagadougou’s office buildings. Offerle et al. (2005) established that the trend in Burkina Faso’s urban public building development is toward concrete structures with wide glass windows, a style influenced by North America and Western Europe. The focus is on outward design and aesthetics rather than energy efficiency [49]. As a result, a single-floor typical office building, with a width of 21.6 m, a depth of 13.61, and a height of 3.6 m, was designed for this paper based on current trends in public building construction, as shown in Figure 6. Located in Ouagadougou (latitude 12.353° N, longitude 1.512° W, 316 m above sea level), the case study, serving as the base model, has its main façade oriented in the south direction. It comprises six offices, one lobby, one storage room, one conference room, and two toilets, covering 216.42 m2. Concrete walls join the rooms with door apertures that allow access and ventilation. The windows’ lowest border is 0.9 m above the floor, 2.5 m in width and 1.8 in height, except for the conference room (6 m wide and 2.2 m high) and the lobby (4 m wide and 2.2 m high), whose windows’ bottom edge is 0.5 m above the floor. Table 3 contains the materials and features of the office building envelopes. The air-conditioning system chosen has a cooling set-point temperature of 22 °C and a cooling set-back temperature of 28 °C. The air conditioning system has a coefficient of performance (COP) of 3.5, which means that a high-efficiency system was considered for the simulation as shown in Table 4.

4.6. Building Optimized Model Description

There are several different passive cooling techniques available, but in this study, the idea was to keep the modifications as simple as possible so that even an existing building based on the base model can be easily modified to improve the thermal comfort performance, as seen in Figure 7. Table 3 summarizes the new building materials added for the improvement. In this simulation study, the effect of using materials with high thermal inertia in walls is compared to the base model. The optimized model keeps the same hollow concrete blocks, but the change was conducted on the coating to provide better isolation to the walls. The building materials were also chosen to prove the effectiveness of the evaporative cooling (with the presence of well-watered plants all over the model) and thermal mass with night ventilation and dehumidification. All these strategies concern the change of the building material’s thermo-physical characteristics.
The benefit of cooling down the office building by taking advantage of natural ventilation is analyzed and compared with the base case with no natural ventilation. The simulation considered the ventilation as 5 ac/h (standard provided by the software) as if it was produced throughout the windows with infiltration of 0.7 ac/h (Table 4). The air-conditioning system chosen has a cooling set-point temperature of 22 °C and a cooling set-back temperature of 28 °C. The air-conditioning system has a coefficient of performance (COP) of 3.5, which means that a high-efficiency system was considered for the simulation as shown in Table 4. The shadow effect of the shading roof and windows is analyzed for comparison. This simulation served to assess the benefit of the construction of a double roof and window shading. The window shading had a length of one meter (1.5 m) and the same width of each window. The extra roof is built from a galvanized iron sheet and is designed to protect the previous concrete slab roof from the sun, as this is the surface that receives the most solar radiation in these latitudes near the equator.

4.7. Energy Simulation

Energy simulation is used to analyze the building’s energy performance. There are various energy performance certification schemes for buildings, including Energyplus, Equest, and Ecotect. Indoor thermal conditions, such as temperature, were investigated using data from the building’s design, construction materials and qualities, occupancy, internal heat gains inside the building, weather data, and other elements. The building energy simulation was carried out using EnergyPlus 9.3 where five passive design strategies were compared to quantify the impact of the strategy in terms of indoor comfort and energy consumption. The different matrices used to compare the impact of strategies were annual discomfort hours, average indoor temperatures, annual energy consumption, and annual cooling energy demand. Seven different case scenarios were analyzed and simulated. The input parameters for each case scenario are depicted in Table 4.

5. Results

The simulation was carried out to measure and compare the impact of different passive strategies using two parameters: Indoor comfort and energy consumption.

5.1. Indoor Comfort

The indoor comfort is measured through the indicator amount of discomfort hours and indoor/outdoor air temperature after switching off the air conditioning. The discomfort hours were calculated based on the total number of hours where the building will be occupied, which is 2808 h in total for a whole year. Figure 8 summarizes the effect of each passive cooling technique on the annual discomfort hours.
It appeared that the base model had a total of 1985 h of discomfort, representing an average of 70% indoor temperature discomfort hours a year.

5.1.1. Case 1: Window Shading

The impact of closed-window shading devices on discomfort hours was investigated in this situation. The outcomes obtained show that window shading reduced the annual discomfort hours by 1% from the base case for a total of 1968 h. Two factors may explain why this strategy was the least effective regarding the reduction in discomfort hours. Firstly, the inside surface temperature of the windows is heavily influenced by the exterior conditions of Ouagadougou located very close to the equator line, so the solar radiation significantly affects the building’s indoor temperature through the windows. The windows are 3-mm-width tinted single-glazed windows, with SHGC and VLT values of 0.635 and 0.201, respectively, meaning these parameters are not enough to prevent heat gain through window glazing. Secondly, using 1.5 m of fixed overhang as a shading device is clearly insufficient regarding the sizes of the windows used in this case study as mentioned previously.

5.1.2. Case 2: Roof Shading

Case 2 depicts the effect of a galvanized iron sheet of the existing concrete slab roof used as shading. The findings indicate an average of 1435 h of discomfort every year. The roof shading helps to reduce the annual discomfort hours by 28% from the base case, meaning that there is a strong correlation between the roof and the thermal comfort of a building, especially a single-storey building. The effectiveness of roof shading is explained by the fact that the roofs of buildings in Ouagadougou receive an enormous quantity of solar radiation. A galvanized iron sheet used as roof shading protects against direct solar radiation and strongly influences the indoor temperature. Additionally, the second roof allows for airflow between the two roofs and enables the heat to escape from the existing concrete slab roof, contributing to reducing the heat gain through the roof and the total annual discomfort hours.

5.1.3. Case 3: Natural Ventilation

Case 3 demonstrates an adaptive and proactive response on the part of building users by opening windows and allowing airflow inside with 5 ac/h. It is the most effective passive cooling technique to reduce the number of discomfort hours. The results show that the use of natural ventilation during working hours (from 7:30 am to 4:30 pm) helps to reduce the discomfort hours by 40% from the base case with an average of 1186 h of annual discomfort.

5.1.4. Case 4: Evaporative Cooling and Night Ventilation

This scenario points out the direct effect of the hygro-thermal building materials on discomfort hours. The outcomes reveal a total of 1875 h in yearly discomfort hours when 1 cm of exterior and internal clay is used as wall coating material, and 1 cm of XPS extruded polystyrene contributes to reducing the wall U-Value from 2.89 W/m2K to 1.559 W/m2K. Overall, a 53% reduction in the wall U-value reduces the annual discomfort hours by 5% compared to the base case, asserting a correlation between wall U-value and discomfort hours. The wall’s thermal inertia enables rapid cooling, provides a greater sense of thermal comfort to users, providing a cooler environment during the warmest hours of the day and a warmer environment during the coldest hours of the night, resulting in a decrease in discomfort hours.

5.1.5. Case 5: Dehumidification

This scenario depicts the situation where a dehumidification HVAC with 3.5 cop was used. The findings show that with a cooling set-point temperature of 22 °C, a cooling set-back temperature of 28 °C, and a supply air condition of 12 °C, the dehumidification function of the HVAC helps to decrease the annual discomfort hours to 1898 h, representing a 4% reduction.

5.1.6. Case 6: Optimized Case

This is the scenario where all the passive cooling techniques are used simultaneously in the office building. The optimized case is uncomfortable for only 617 h during the whole year, or just 22%/year. A decrease in annual discomfort of 69% is seen compared to the base case due to implementing the methods. Figure 9 shows the monthly average indoor/outdoor air temperature. The results indicate that, except for the month of April, the indoor temperature of the base model is hotter than the outdoor temperature of the city of Ouagadougou, which is located in an Arid, Steppe, Hot (BSh). On the other side, the optimized case has a lower interior air temperature than the external temperature for the full year. The indoor air temperature in the optimized case ranges between 24.7 °C in August and 27 °C in April (a monthly average difference of 2.3 °C) while the base case indoor temperature ranges from 26.2 °C in September to 28.8 °C in June (a monthly average difference of 2.6 °C). The combination of the previous passive cooling techniques slightly reduces the diurnal indoor temperature variation in the optimized case.

5.2. Energy Consumption

To measure the annual energy consumption (demand/use), air conditioning was switched on for each case. The size and input parameters of an air conditioning system were kept constant throughout all the cases to measure the change in energy demand as a product of each passive strategy and the strategies combined. An annual comparison of the energy cooling demand and energy used was carried out on the difference in each scenario, as seen in Figure 10. The base case used to make the comparisons has an annual energy cooling demand of 23,575 KWh and annual energy consumption of 28,555 KWh.

5.2.1. Case 1: Window Shading

The results demonstrate that during a whole year, case 1 has 19,431 KWh of annual cooling energy demand and 24,410 KWh of annual energy consumption. The window shading reduces the cooling energy demand and energy consumption up to 17% and 14.5%, respectively, on average, when compared to the base case.

5.2.2. Case 2: Roof Shading

The outcomes of case 2 show 19,390 KWh of annual cooling energy demand and 24,370 KWh of annual energy consumption. The roof shading helps to reduce the energy cooling demand and energy consumption by 18% and 14%, respectively, compared to the base case. The metal sheet roof facilitated night radiative cooling, which resulted in a drop in the night internal air temperature and protected the second roof from direct sun radiation.

5.2.3. Case 3: Natural Ventilation

This scenario is the application of the ASHRAE adaptive comfort model where the office building’s users open the windows. The results indicate 14,907 KWh of annual cooling energy demand and 19,887 KWh of annual energy consumption. The outcomes illustrate that natural ventilation reduces the energy cooling demand and energy consumption by 31% and 30%, respectively, compared to the base case. It is the most effective passive cooling technique to reduce the energy cooling demand. This technique takes advantage of cool winds to keep the office building interior cool.

5.2.4. Case 4: Evaporative Cooling and Night Ventilation

The annual cooling energy demand of case 4 is 21,206 KWh of annual cooling demand and 26,186 KWh of annual energy consumption. The evaporative cooling and night ventilation help to reduce the energy cooling demand and energy consumption by 10% and 8%, respectively, compared to the base case. Although proven to be an effective passive cooling technique in hot and dry climates with low relative humidity, the office buildings are designed in Ouagadougou without the presence of water bodies such as fountains or swimming pools, explaining why this passive cooling technique is not as effective.

5.2.5. Case 5: Dehumidification

This case shows 23,085 KWh of annual cooling energy demand and 28,065 KWh of annual energy consumption. The effectiveness of this technique is very low, helping to reduce the energy cooling demand and energy consumption by just 2% compared to the base case. It is, therefore, not suggested as a passive cooling technique for new construction or existing construction to improve the thermal comfort of office buildings.

5.2.6. Case 6: Optimized Case

This is the scenario where all the passive cooling techniques are used at the same time in the office building. The optimized case has an annual energy cooling demand of 11,235 KWh. The optimized case has an energy cooling demand reduction of 42% compared to the base case. This implies a reduction in the annual energy consumption of 43% compared to the base case (from 28,555KWh to 16,215 KWh). Figure 11, Figure 12 and Figure 13 illustrate the solar heat/gain in KWh through the glazing, roof, and wall, respectively. The optimized case has a significant reduction in the solar heat gain in all the parts of the building. These figures demonstrate why the cooling energy demand has this significant reduction in the optimized case scenario. The roof is the part with the most solar heat reduction due to the roof shading. The new hygro-thermal material wall material is less effective, but the results are still interesting considering the slight modifications on the wall from the base case to the optimized case.

6. Discussion

6.1. Window Shading

The simulations demonstrated that the window shading strategy used in case 1 has a negligible effect on indoor temperature comfort in Ouagadougou. This result may be explained by two factors. Firstly, the window glass thermal properties and glazing type used in this study were not enough to reduce the heat radiation inside the building through the window glass. These window properties may have a significant impact on building thermal comfort, especially in the Sub-Saharan climate type. The explanation for the impact of SHGC VLT and the window U-value is that, as shown in [55,56], the direct solar load has a significant influence on windows, thereby affecting thermal comfort. Secondly, a 1.5 m fixed overhang shading device may not be appropriate to protect the windows from solar radiation. The effect of the window shading strategy on thermal comfort in this study agrees with the findings in [57], which depict that the discomfort hours of a 1.5 m fixed overhang window shading are slightly less than the no-shading scenario in Australian educational buildings. Researchers in [39] studied different window-shading scenarios in public buildings in Ouagadougou but focused their simulations on the energy consumption, showing that when considering this aspect, overhang window shading is effective in reducing cooling energy demand but slightly increase the electric light consumption. Window shading had a reverse effect on the office building’s energy consumption and discomfort hours. Case 1 had lower energy consumption but approximately the same discomfort hours compared to the base case.

6.2. Roof Shading

The results of this study confirm the outcomes in [36], which pointed out the great effectiveness of roof shading in reducing the discomfort hours of a building in Burkina Faso. Case 2 was also effective when it came to reducing energy consumption, mainly due to two main reasons. Firstly, roofs affect the indoor temperature conditions of buildings, hence affecting energy consumption, since the roof directly encounters solar radiation, particularly in countries with a high solar incidence [57]. Secondly, roofs account for a significant portion of heat gain/loss, especially in buildings with vast roof areas [58].

6.3. Natural Ventilation

Natural ventilation, rather than other parameters, is the most efficient passive cooling approach regarding the reduction in discomfort hours and energy consumption in this study, with a hot and dry environment confirming the results in [28,30]. The orientation component, on the other hand, affects the wind ventilation parameter, which impacts the resident’s comfort and satisfaction by increasing the air change rate within an acceptable velocity range [32]. A long, narrow building layout may aid or enhance ventilation [29]. To promote cross-ventilation, door and window openings should be on opposing sides of the structure, preferably with the bigger openings facing upwind. Open-plan interiors with significant space may encourage natural cross ventilation [34].

6.4. Evaporative Cooling and Night Ventilation

The results regarding the reduction in discomfort hours and energy consumption reduction when using just 1 cm of external and internal clay as wall coating material and 1 cm of XPS extruded for insulation confirm that the Ouagadougou climate promotes the use of building materials with high thermal inertia [36,38]. The thermal storage capacity of the building can allow for a reduction in cooling demand [39]. This might be because the heat-release mechanism of thermal mass slows down at night, mainly due to the extremely large time constant but comparatively smaller night ventilation, resulting in thermal mass being held at a high temperature at night and therefore somewhat increased cooling load the next day. With enough night-time cold storage, the comparatively low minimum (night) outside air temperature may be exploited to generate a low inside air temperature [39]. Researchers in [36] recommended building constructions to integrate a large mass envelope with a high thermal capacity to sustain generally moderate temperatures throughout the day. However, regarding the findings in this study, the focus should first be on the hygro-thermal properties of the wall materials to find the most suitable one and then find efficient ways to use it to keep it sustainable for future generations and constructions.

6.5. Dehumidification

The HVAC dehumidification strategy is the overall least effective strategy considering the discomfort hours and energy consumption, justifying the findings in [59]. The most popular method of dehumidifying is to chill the air to condensate the moisture using chilled water or a refrigerant. Dual wheel/wrap-around coil-based techniques are especially pertinent in hot areas, since buildings in these conditions are not meant for heating, and the fundamental advantage of these systems is that they completely remove heat.

6.6. Optimized Case

According to the national society of electricity of Burkina Faso SONABEL, for 2022, the price of electricity is 0.464 USD per kWh. That means the base case, with a total annual energy consumption of 28,555 Kwh, has an annual electricity bill of 13,278.075 USD, which is huge for a developing country considering the size of the building model. The research conclusions in [39] demonstrated that climate change would increase the demand for energy for cooling in the built environment in Ouagadougou. Adding the fact that the country has serious problems in satisfying its own national energy demand, it is important to find cost-effective solutions to reduce the buildings’ (existing and new) energy consumption. The optimized case of this study has an annual electricity bill of 7523.76 USD a reduction of 5754.315 USD per year (43% reduction compared to the base case). This reduction may even be possible in existing office buildings just by implementing these passive cooling techniques. This money might be utilized to enhance another aspect of the workplace.

6.7. Future Research

The research also looked at passive and low-energy cooling solutions, whose applicability is the easiest and most cost-effective, with fewer modifications needed to make it easier to adapt existing office buildings that were designed without them. It is thus suggested that research into the application of alternative strategies such as radiative cooling and ground cooling be carried out. Commercial building studies are highly advised since energy savings are likely to be substantially larger.
This study established the critical relevance of building materials with good hygro-thermal properties, with most field investigations in Sub-Saharan Africa pointing to adobe, compressed earth block, stone, or cob. However, wood reveals itself to be a material with high thermal inertia that deserves more investigation in order to develop solutions for its effective application in Sub-Saharan Africa.

7. Conclusions

In this study, different scenarios representing each passive cooling technique have been simulated and compared to evaluate the thermal comfort and the energy consumption technique of a conventional office building in Ouagadougou using EnergyPlus to conduct the simulations. The following conclusions may be taken from the findings and analysis:
i.
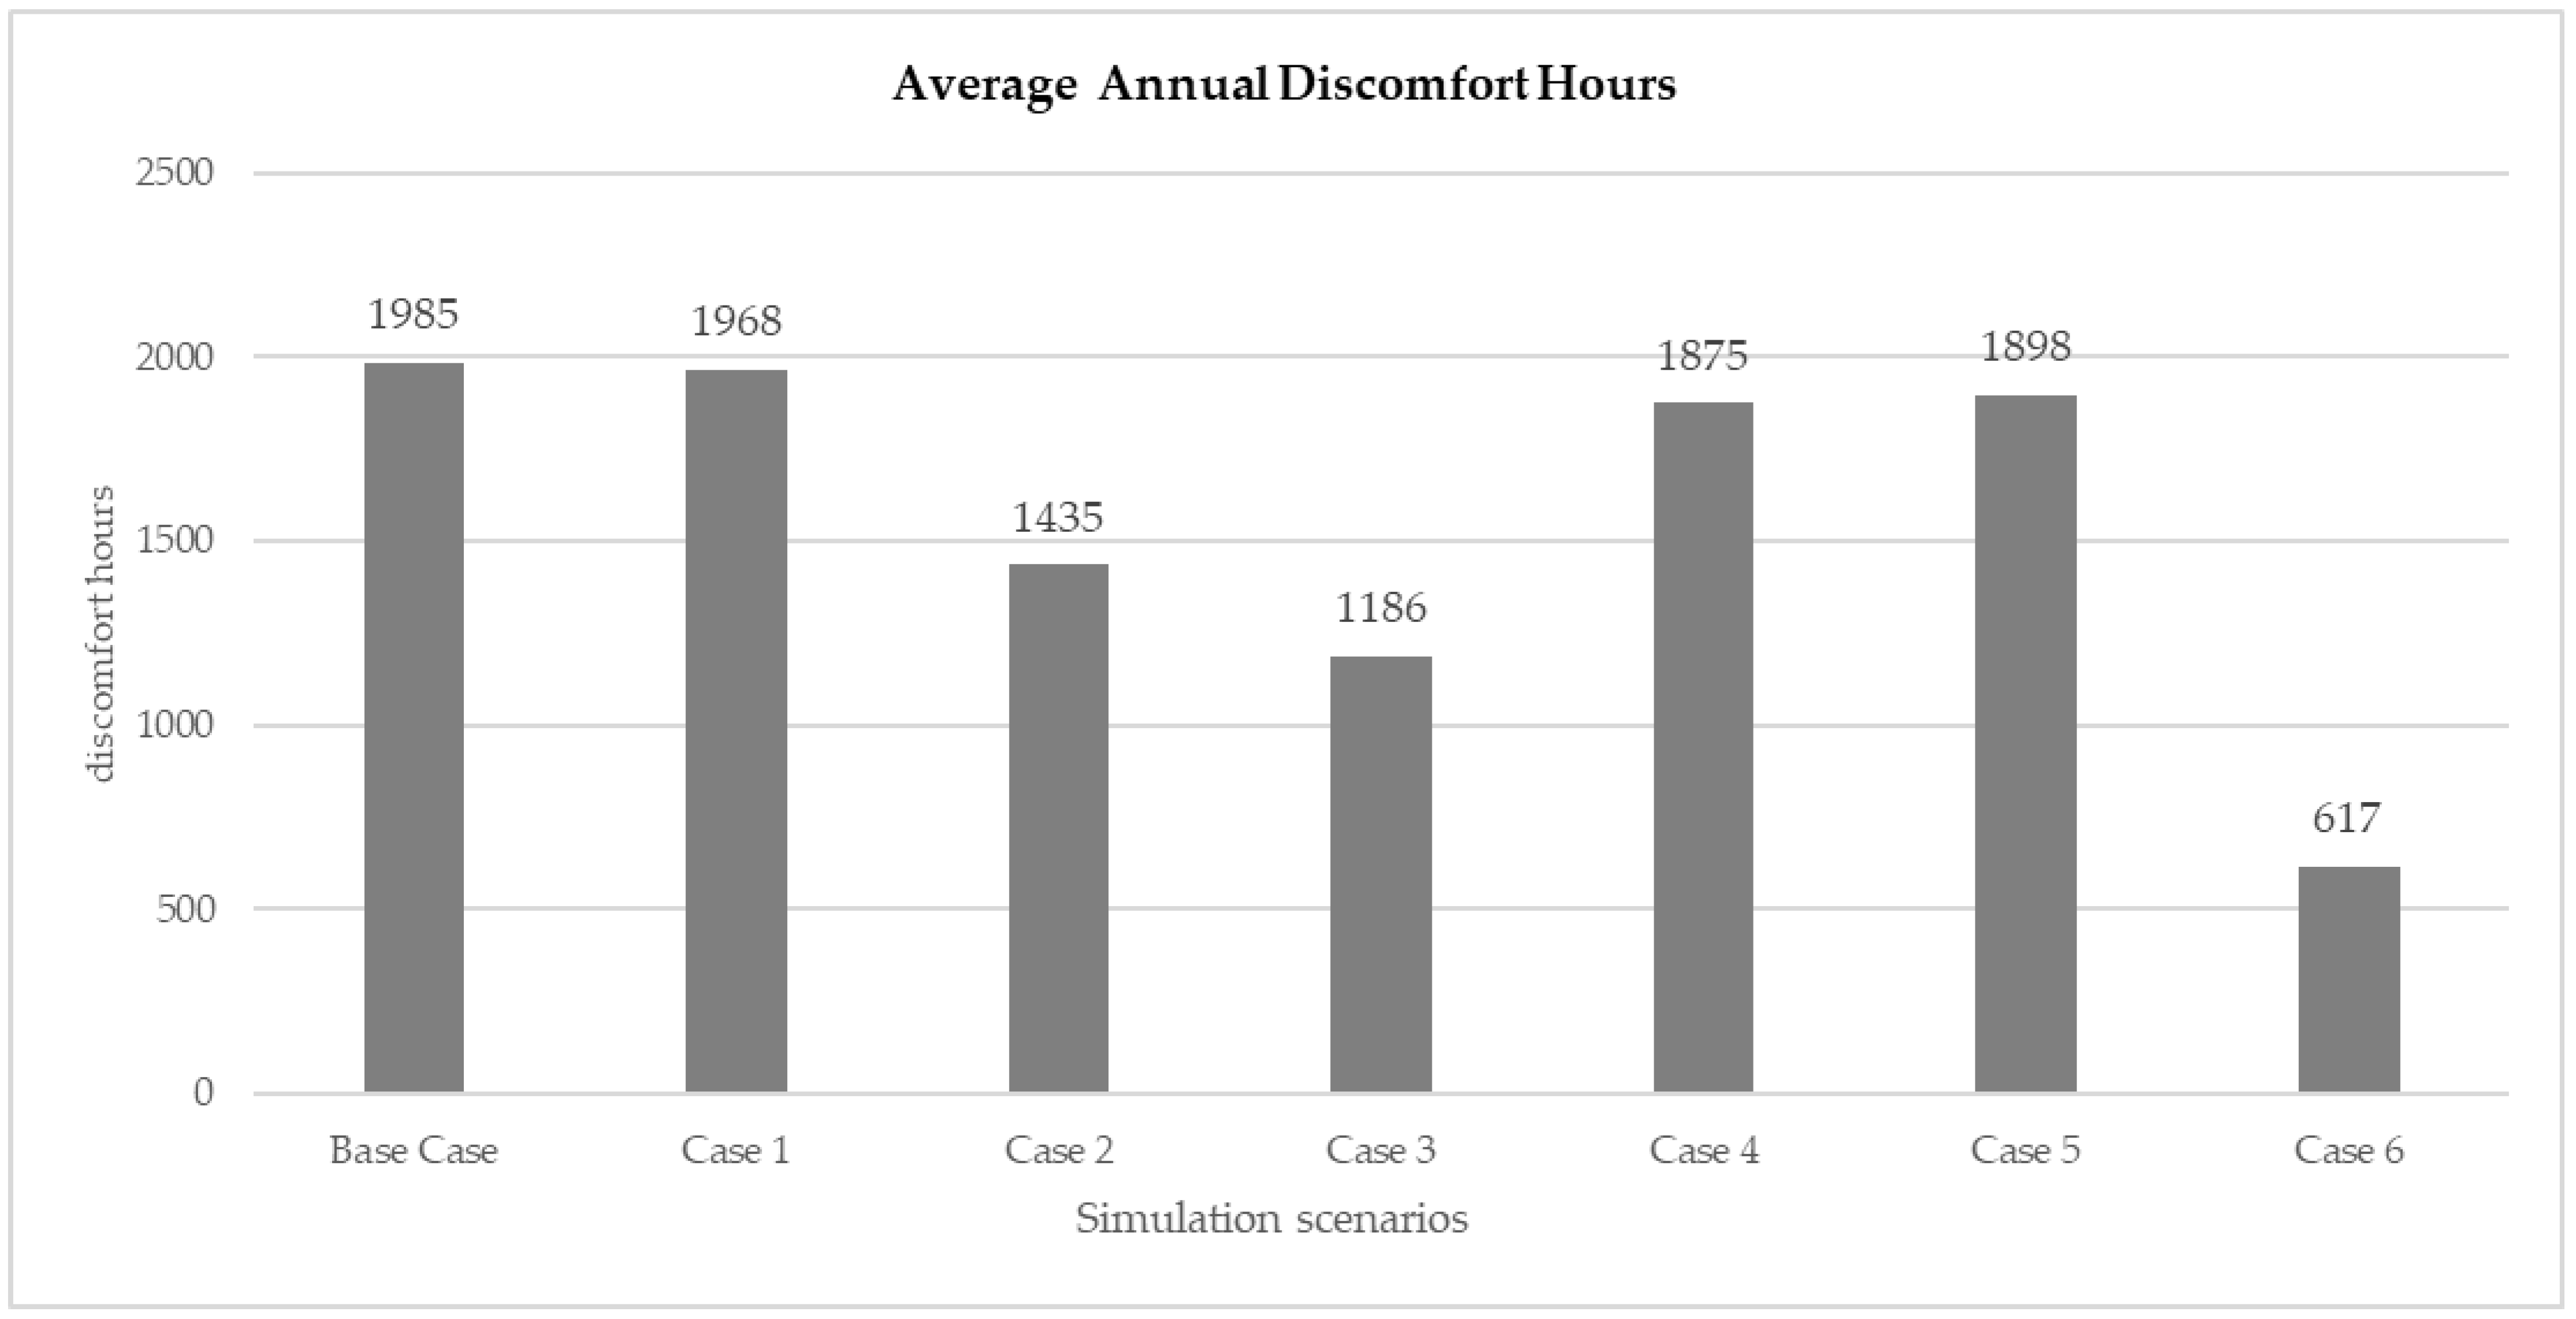
The simulations showed massive potential for reducing the discomfort hours with the use of roof shading and natural ventilation, which are the most effective passive techniques, reducing the annual discomfort hours by up to 40%.
ii.
Window shading has a reverse effect on energy consumption and discomfort hours.
iii.
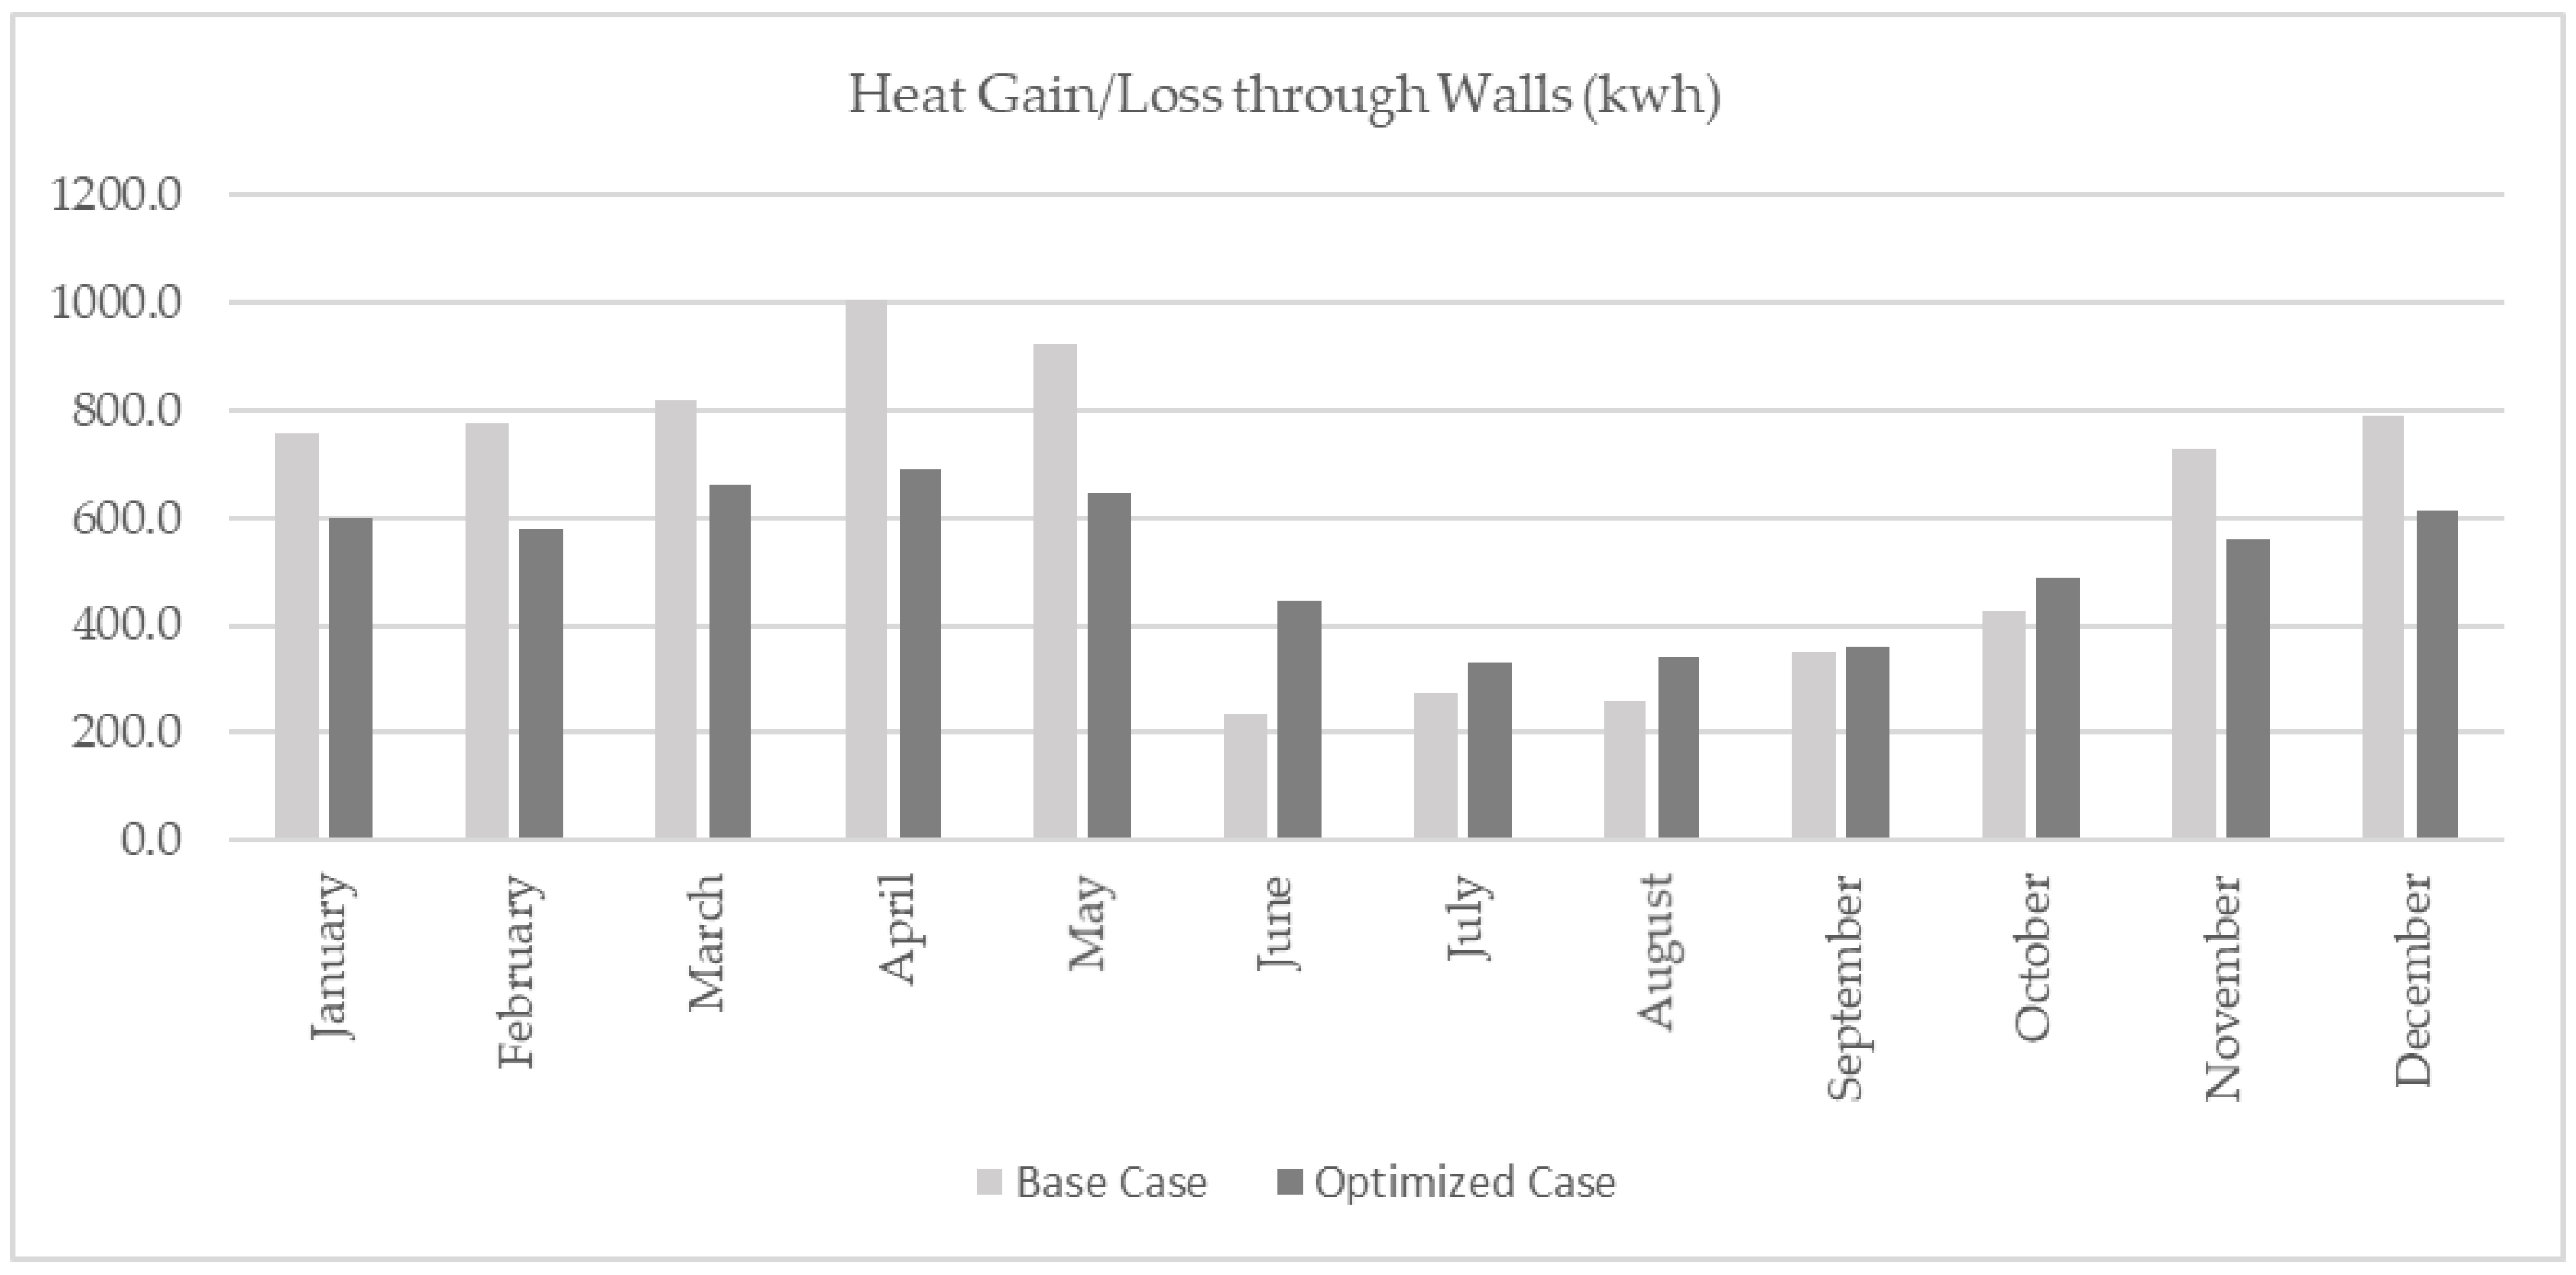
A 53% reduction in the wall U-value reduces the annual discomfort hours by 5% and the annual energy consumption by 8%.
iv.
Using a single passive technique cannot guarantee optimal thermal comfort and energy reduction throughout a full year.
v.
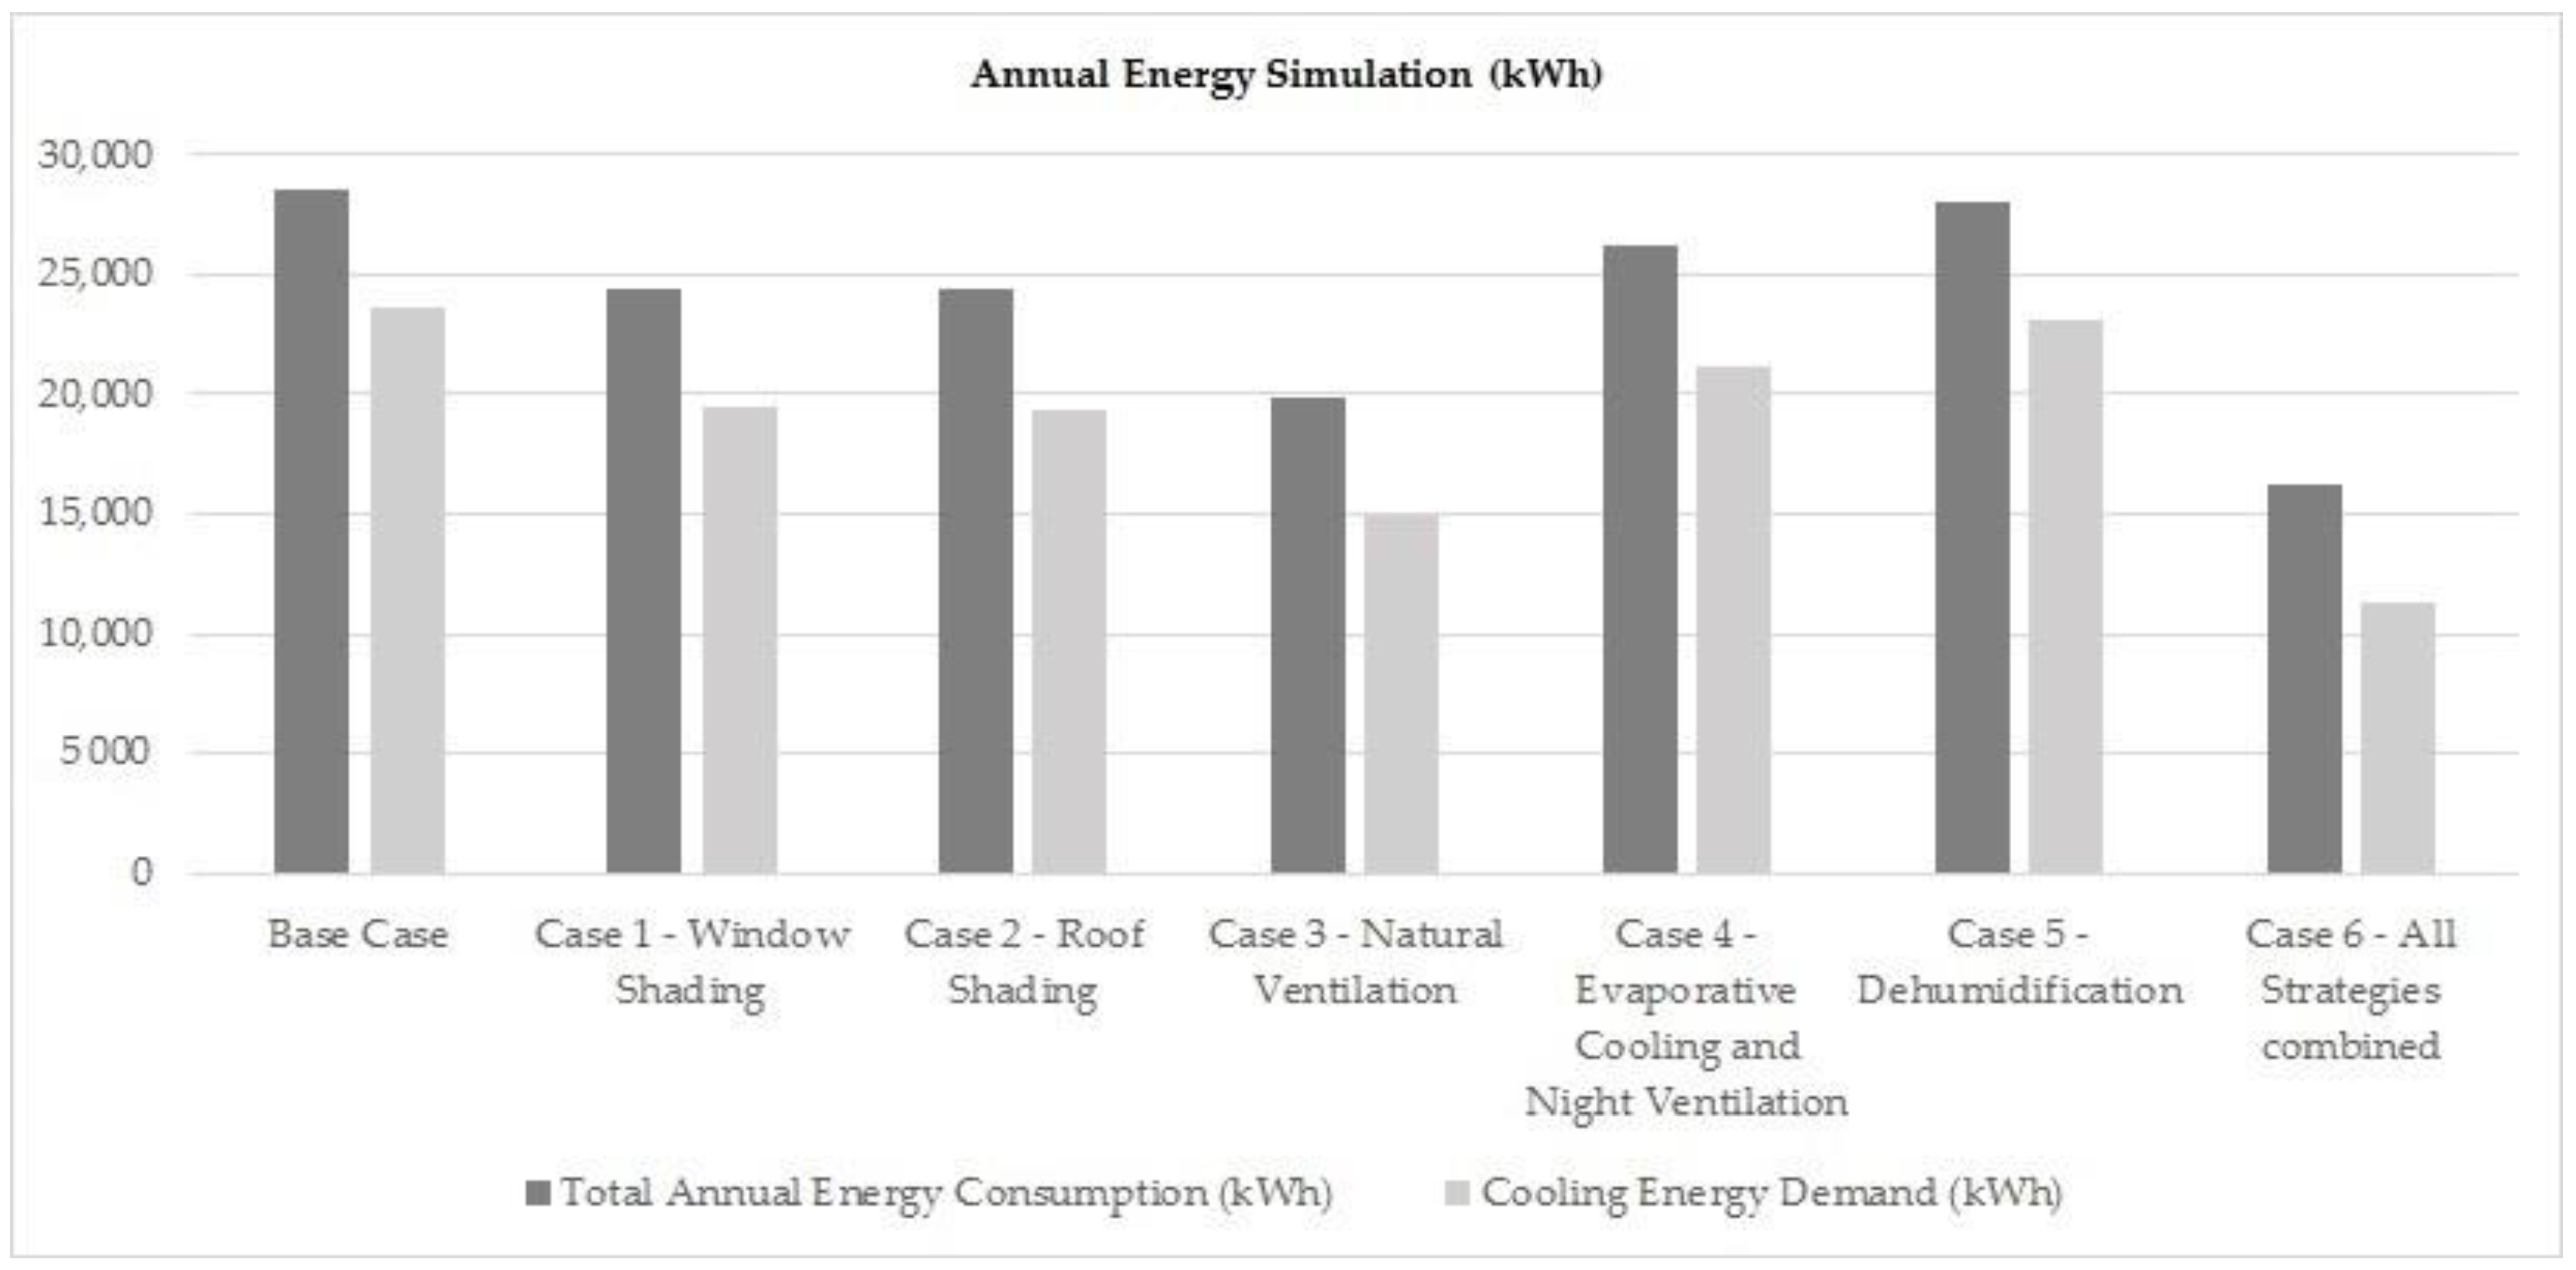
Overall, the combined use of the strategies decreases the discomfort hours by 69% and the annual energy consumption by 43%.
This study intends to enhance the energy efficiency of office buildings in Ouagadougou by assisting architects and policymakers in determining the optimal and cost-effective passive cooling techniques at the early stages of the building design process or while transforming or refurbishing an existing building. The experts should focus first on how to integrate natural ventilation with shading devices, and evaporative cooling with thermal mass (which are cost-effective and easy to implement) in all their new buildings projects, and even in existing buildings, instead of heavily relying on HVAC, especially in a developing country such as Burkina Faso, which lacks energy.
This research only used Ouagadougou to represent the whole Sudano-Sahelian climatic zone of Burkina Faso. However, even within the same regional boundary, there may be locations with many local variances in climatic conditions. Burkina Faso, on the other hand, is a nation with three distinct climatic zones. Even within the same geographical boundary, there may be regions with considerable local variances in climatic conditions. As a result, investigations should be conducted to identify locations with different microclimatic conditions and suitable comfort boundaries.

Author Contributions

Conceptualization, A.N.Z.; methodology, A.N.Z.; software, A.N.Z.; validation, A.N.Z. and P.V.G.; formal analysis, A.N.Z.; investigation, A.N.Z.; data curation, A.N.Z.; writing—original draft preparation, A.N.Z.; writing—review and editing, P.V.G.; supervision, P.V.G.; funding acquisition, P.V.G. All authors have read and agreed to the published version of the manuscript.

Funding

This research is funded by Zhejiang University: 876-211 Class Project, funding project code: 113000*1942221R1/007, and the scientific research start-up fund of Qiushi Distinguished Professor of Zhejiang University School of Construction Engineering.

Institutional Review Board Statement

Not applicable.

Informed Consent Statement

Not applicable.

Data Availability Statement

No applicable.

Acknowledgments

The authors would like to express sincere thanks to everyone who contributed to this work.

Conflicts of Interest

The authors declare no conflict of interest.

References

  1. International Monetary Fund. World Global Report; SRO-Kundig: Versoix, Switzerland, 2000. [Google Scholar] [CrossRef]
  2. Cooper, P.J.M.; Dimes, J.; Rao, K.P.C.; Shiferaw, B.; Twomlow, S. Coping better with current climatic variability in the rain-fed farming systems of sub-Saharan Africa: A dress rehearsal for adapting to future climate change. Agric. Ecosyst. Environ. 2008, 126, 24–35. [Google Scholar] [CrossRef] [Green Version]
  3. UN Habitat. L’état des Villes Africaines: Réinventer la Transition Urbaine; UN Habitat: Nairobi, Kenya, 2014. [Google Scholar]
  4. Dalton, G.; Lockington, D.; Baldock, T. Case study feasibility analysis of renewable energy supply options for small to medium-sized tourist accommodations. Renew. Energy 2009, 34, 1134–1144. [Google Scholar] [CrossRef]
  5. Mazria, E. The 2010 Imperative: A Global Emergency Teach-In. Architecture 2030, 20 February 2007; Presentation. [Google Scholar]
  6. ANSI/ASHRAE Standard 55-2017; Thermal Environmental Conditions for Human Occupancy. American Society of Heating, Refrigerating and Air-Conditioning Engineers, Inc.: Atlanta, GA, USA, 2004. Available online: http://arco-hvac.ir/wp-content/uploads/2015/11/ASHRAE_Thermal_Comfort_Standard.pdf (accessed on 20 November 2021).
  7. Sobin, H.J.; Olgyay, V. Design with Climate: Bioclimatic Approach to Architectural Regionalism. J. Arch. Educ. 1963, 18, 43. [Google Scholar] [CrossRef]
  8. Man, B.G. Climate and Architecture; Applied Science Publishers Limited: London, UK, 1976. [Google Scholar]
  9. Milne, M.; Givoni, B. Architectural design based on climate. In Energy Conservation through Building Design; Watson, D., Ed.; McGraw Hill Book Company: New York, NY, USA, 1979; pp. 96–113. [Google Scholar]
  10. Dekay, M.; Brown, G.B. Sun, Wind & Light: Architectural Design Strategies, 3rd ed.; Wiley: New York, NY, USA, 2014. [Google Scholar]
  11. Szokolay, S. Introduction to Architectural Science: The Basis of Sustainable Design; Routledge: London, UK, 2014. [Google Scholar] [CrossRef]
  12. Lam, J.C.; Yang, L.; Liu, J. Development of passive design zones in China using bioclimatic approach. Energy Convers. Manag. 2006, 47, 746–762. [Google Scholar] [CrossRef]
  13. Bodach, S. Developing bio-climatic zones and passive solar design strategies for Nepal. In Proceedings of the 30th International PLEA Conference, CEPT University, Ahmedabad, India, 16–18 December 2014. [Google Scholar]
  14. Rakoto-Joseph, O.; Garde, F.; David, M.; Adelard, L.; Randriamanantany, Z. Development of climatic zones and passive solar design in Madagascar. Energy Convers. Manag. 2009, 50, 1004–1010. [Google Scholar] [CrossRef]
  15. De Assis, E.; Frota, H. Urban bioclimatic design strategies for a tropical city. Atmos. Environ. 1999, 33, 4135–4142. [Google Scholar] [CrossRef]
  16. Al-Azri, N.A. Development of a typical meteorological year based on dry bulb temperature and dew point for passive cooling applications. Energy Sustain. Dev. 2016, 33, 61–74. [Google Scholar] [CrossRef]
  17. Papparelli, A.; Cdnsulo, M. Strategies for bioclimatic design in an urban area of an arid zone: San Juan (Argentina). Landsc. Urban Plan. 1996, 34, 19–25. [Google Scholar] [CrossRef]
  18. Al-Zuhair, M.; Sayigh, A. Designing for comfort in Iraq. Sol. Wind Technol. 1989, 6, 369–382. [Google Scholar] [CrossRef]
  19. Al-Jamal, K.H.; Sayigh, A.A. Design for Comfort in Gaza Strip and the West Bank. Sol. Wind. Technol. 1989, 6, 6203–6211. [Google Scholar] [CrossRef]
  20. Singh, M.K.; Mahapatra, S.; Atreya, S. Development of bio-climatic zones in north-east India. Energy Build. 2007, 39, 1250–1257. [Google Scholar] [CrossRef]
  21. Alajlan, S.; Smiai, M.; Elani, U. Effective tools toward electrical energy conservation in Saudi Arabia. Energy Convers. Manag. 1998, 39, 1337–1349. [Google Scholar] [CrossRef]
  22. Ajibola, K. Design for comfort in Nigeria—A bioclimatic approach. Renew. Energy 2001, 23, 57–76. [Google Scholar] [CrossRef]
  23. Khambadkone, N.; Jain, R. A bioclimatic approach to develop spatial zoning maps for comfort, passive heating and cooling strategies within a composite zone of India. Build. Environ. 2018, 128, 190–215. [Google Scholar]
  24. Khambadkone, N.K.; Jain, R. A bioclimatic analysis tool for investigation of the potential of passive cooling and heating strategies in a composite Indian climate. Build. Environ. 2017, 123, 469–493. [Google Scholar] [CrossRef]
  25. Srivanit, M.; Hokao, K. Evaluating the cooling effects of greening for improving the outdoor thermal environment at an institutional campus in the summer. Build. Environ. 2013, 66, 158–172. [Google Scholar] [CrossRef]
  26. Ratti, C.; Raydan, D.; Steemers, K. Building form and environmental performance: Archetypes, analysis and an arid climate. Energy Build. 2003, 35, 49–59. [Google Scholar] [CrossRef]
  27. Bernard, J.; Bocher, E.; Petit, G.; Palominos, S. Sky View Factor Calculation in Urban Context: Computational Performance and Accuracy Analysis of Two Open and Free GIS Tools. Climate 2018, 6, 60. [Google Scholar] [CrossRef] [Green Version]
  28. Elshafei, G.; Vilcekova, S.; Zelenakova, M.; Negm, A.M. Towards an Adaptation of Efficient Passive Design for Thermal Comfort Buildings. Sustainability 2021, 13, 9570. [Google Scholar] [CrossRef]
  29. Ying, X.; Li, W. Effect of Floor Shape Optimization on Energy Consumption for U-Shaped Office Buildings in the Hot-Summer and Cold-Winter Area of China. Sustainability 2020, 12, 2079. [Google Scholar] [CrossRef] [Green Version]
  30. Emmerich, S.J.; Polidoro, B.; Axley, J.W. Impact of adaptive thermal comfort on climatic suitability of natural ventilation in office buildings. Energy Build. 2011, 43, 2101–2107. [Google Scholar] [CrossRef]
  31. Bhamare, D.K.; Rathod, M.K.; Banerjee, J. Evaluation of cooling potential of passive strategies using bioclimatic approach for different Indian climatic zones. J. Build. Eng. 2020, 31, 101356. [Google Scholar] [CrossRef]
  32. Kajjoba, D.; Kasedde, H.; Olupot, P.W.; Lwanyaga, J.D. Evaluation of thermal comfort and air quality of low-income housing in Kampala City, Uganda. Energy Built Environ. 2021. [Google Scholar] [CrossRef]
  33. Nematchoua, M.K.; Tchinda, R.; Ricciardi, P.; Djongyang, N. A field study on thermal comfort in naturally-ventilated buildings located in the equatorial climatic region of Cameroon. Renew. Sustain. Energy Rev. 2014, 39, 381–393. [Google Scholar] [CrossRef] [Green Version]
  34. Dorcas Mobolade, T.; Pourvahidi, P. Bioclimatic Approach for Climate Classification of Nigeria. Sustainability 2020, 12, 4192. [Google Scholar] [CrossRef]
  35. Widera, B. Comparative analysis of user comfort and thermal performance of six types of vernacular dwellings as the first step towards climate resilient, sustainable and bioclimatic architecture in western sub-Saharan Africa. Renew. Sustain. Energy Rev. 2021, 140, 110736. [Google Scholar] [CrossRef]
  36. Rincón, L.; Carrobé, A.; Martorell, I.; Medrano, M. Improving thermal comfort of earthen dwellings in sub-Saharan Africa with passive design. J. Build. Eng. 2019, 24, 100732. [Google Scholar] [CrossRef]
  37. de Miguel, M.L.; Vegas, F.; Mileto, C.; García-Soriano, L. Return to the Native Earth: Historical Analysis of Foreign Influences on Traditional Architecture in Burkina Faso. Sustainability 2021, 13, 757. [Google Scholar] [CrossRef]
  38. Hema, C.; Van Moeseke, G.; Evrad, A.; Courard, L.; Messan, A. Vernacular housing practices in Burkina Faso: Representative models of construction in Ouagadougou and walls hygrothermal efficiency. Energy Procedia 2017, 122, 535–540. [Google Scholar] [CrossRef]
  39. Ouedraogo, B.; Levermore, G.; Parkinson, J. Future energy demand for public buildings in the context of climate change for Burkina Faso. Build. Environ. 2012, 49, 270–282. [Google Scholar] [CrossRef]
  40. Climate Change Overview. Available online: https://climateknowledgeportal.worldbank.org/country/burkina-faso (accessed on 20 November 2021).
  41. Köppen–Geiger Climate Classification Map for Burkina Faso. Available online: https://en.m.wikipedia.org/wiki/File:Koppen-Geiger_Map_BFA_present.svg (accessed on 20 November 2021).
  42. World Economic Forum. The Global Risks Report 2021, 16th ed.; World Economic Forum: Cologny, Switzerland, 2021; ISBN 9782940631247. Available online: https://www3.weforum.org/docs/WEF_The_Global_Risks_Report_2021.pdf (accessed on 20 November 2021).
  43. Geography of Burkina Faso. Available online: https://www.worlddata.info/africa/burkina-faso/index.php (accessed on 20 November 2021).
  44. Ouattara, A.; Somé, L. La Croissance Urbaine au Burkina Faso. Rapport d’analyse des Données du Recencement Général de la Population et de L’habitat de; Ministere de l’Economie et des Finances: Burkina Faso, 2006; Available online: http://web.insd.bf/contenu/enquetes_recensements/rgph-bf/themes_en_demographie/Theme9-Croissance_urbaine.pdf (accessed on 20 November 2021).
  45. Nikyema, G.A.; Blouin, V.Y. Barriers to the adoption of green building materials and technologies in developing countries: The case of Burkina Faso. IOP Conf. Series Earth Environ. Sci. 2020, 410, 012079. [Google Scholar] [CrossRef]
  46. Kéré, B. Architecture et Cultures Constructives du Burkina Faso; CRATerre-EAG: Burkina Faso, 1995; Available online: https://craterre.hypotheses.org/233 (accessed on 20 November 2021).
  47. Wyss, U. Direction du Développement et de la Cooperation. In La construction en “matériaux locaux”: État d’un secteur à Potentiel Multiple; EPFL: Ouagadougou, Burkina Faso, 2005; Available online: https://docplayer.fr/16169319-La-construction-en-materiaux-locaux-etat-d-un-secteur-a-potentiel-multiple.html (accessed on 20 November 2021).
  48. Gana, A.L. Caractèrisation des Matériaux Latéritiques Indurés Pour une Meilleure Utilisation dans L’habitat en Afrique. Ph.D. Thesis, Institut International d’Ingénierie de l’Eau et de l’Environnement (2iE) co-tutelle Université du Havre, Le Havre, France, 2014. [Google Scholar]
  49. Offerle, B.; Jonsson, P.; Eliasson, I.; Grimmond, C.S. Urban modification of the surface energy balance in the West African Sahel: Ouagadougou, Burkina Faso. J. Clim. 2005, 18, 3983–3995. [Google Scholar] [CrossRef]
  50. Delgado, M.C.J.; Guerrero, I.C. The selection of soils for unstabilised earth building: A normative review. Constr. Build. Mater. 2005, 21, 237–251. [Google Scholar] [CrossRef]
  51. Guillaud, H. Compressed Earth Blocks: A Publication of Deutsches Zentrum für Entwicklungstechnologien—GATE, a Division of the Deutsche Gesellschaft für Technische Zusammenarbeit (GTZ) GmbH in Coordination with the Building Advisory Service and Information Network—BASIN. 2: Manual of Design and Construction; Vieweg: Braunschweig, Germany, 1995; p. 148. [Google Scholar]
  52. Craterre, H.H.; Guillaud, H. Traité de Construction en Terre; Parenthèses: Marseille, France, 1995. [Google Scholar]
  53. De Dear, R.; Brager, G.S. Developing an adaptive model of thermal comfort and preference. ASHRAE Trans. 1998, 104, 145–167. [Google Scholar]
  54. Chartered Institution of Building Services Engineers. Building Energy and Environmental Modelling; CIBSE: London, UK, 1998; Available online: https://vdoc.pub/documents/building-energy-and-environmental-modelling-7mompni85b90 (accessed on 20 November 2021).
  55. Lyons, P.R.; Arasteh, D.; Huizenga, C. Window performance for human thermal comfort. Trans. Am. Soc. Heat. Refrig. Air Cond. Eng. 2000, 106, 594–604. [Google Scholar]
  56. Mirrahimi, S.; Mohamed, M.F.; Haw, L.C.; Ibrahim, N.L.N.; Yusoff, W.F.M.; Aflaki, A. The effect of building envelope on the thermal comfort and energy saving for high-rise buildings in hot–humid climate. Renew. Sustain. Energy Rev. 2016, 53, 1508–1519. [Google Scholar] [CrossRef]
  57. Alghamdi, S.; Tang, W.; Kanjanabootra, S.; Alterman, D. Effect of Architectural Building Design Parameters on Thermal Comfort and Energy Consumption in Higher Education Buildings. Buildings 2022, 12, 329. [Google Scholar] [CrossRef]
  58. Sadineni, S.B.; Madala, S.; Boehm, R.F. Passive building energy savings: A review of building envelope components. Renew. Sustain. Energy Rev. 2011, 15, 3617–3631. [Google Scholar] [CrossRef]
  59. Jagan Pillai, P.E. BEMP and Rushil Desai Dehumidification Strategies and Their Applicability Based on Climate and Building Typology. In Proceedings of the 2018 Building Performance Analysis Conference and SimBuild Co-Organized by ASHRAE and IBPSA-USA, Chicago, IL, USA, 26–28 September 2018. [Google Scholar]
Figure 1. Köppen–Geiger climate classification map for Burkina Faso (1980–2016) [41].
Sustainability 14 04332 g001
Figure 2. High-rise buildings Ouagadougou downtown [45].
Sustainability 14 04332 g002
Figure 3. Dwelling made of molded earth blocks in Ouagadougou [38].
Sustainability 14 04332 g003
Figure 4. Construction based on CEBs in Ouagadougou [38].
Sustainability 14 04332 g004
Figure 5. Proposed study method.
Sustainability 14 04332 g005
Figure 6. Base model of the case study representing a typical office building in Ouagadougou: (a) Plan view; (b) 3D view.
Sustainability 14 04332 g006
Figure 7. Optimized model of the case study representing a typical office building in Ouagadougou: (a) Plan view; (b) 3D view.
Sustainability 14 04332 g007
Figure 8. Average discomfort hours.
Sustainability 14 04332 g008
Figure 9. Indoor/outdoor temperature of the base case and the optimized case.
Sustainability 14 04332 g009
Figure 10. Annual energy cooling demand/used based on each scenario.
Sustainability 14 04332 g010
Figure 11. Solar heat gain/loss through glazing.
Sustainability 14 04332 g011
Figure 12. Solar heat gain/loss through the roof.
Sustainability 14 04332 g012
Figure 13. Solar heat gain/loss through walls.
Sustainability 14 04332 g013
Table 1. Weather data summary of Ouagadougou, Burkina Faso. Source: Climate Consultant (developed by UCLA Energy Design Tools Group, © Regents of the University of California).
Monthly MeansJanuaryFebruaryMarchAprilMayJuneJulyAugustSeptemberOctoberNovemberDecember
Global horiz radiation 520565580522480436386392424453508503
(avg hourly) wh/sq.m
Direct normal radiation 572588545388351279186174225335529574
(avg hourly) wh/sq.m
Diffuse radiation 161171185228211216240253247209163149
(avg hourly) wh/sq.m
Global horiz radiation 96010191079108410509999859561001980960895
(max hourly) wh/sq.m
Direct normal radiation 891875882871847845718785797875881889
(max hourly) wh/sq.m
Diffuse radiation 387424476488471460464506508456409379
(max hourly) wh/sq.m
Global horiz radiation 591665556932641360395547489348595121530258125679
(avg daily total) wh/sq.m
Direct normal radiation 649768116517476844163558236121682717391260556479
(avg daily total) wh/sq.m
Diffuse radiation 182919832220281026582746303731362991245918671683
(avg daily total) wh/sq.m
Global horiz illumination 61,68461,68461,68461,68461,68461,68461,68461,68461,68461,68461,68461,684
(avg hourly) lux
Direct normal illumination 39,57239,61237,64927,93322,83217,18612,23911,41514,51121,68034,84838,572
(avg hourly) lux
Dry bulb temperature 252831333229272627292825
(avg monthly) °C
Dew point temperature 0458182222222218103
(avg monthly) °C
Relative humidity (avg monthly) % 202623274963748077573525
Wind direction (monthly mode) ° 2040402402202002002202201806040
Wind speed (avg monthly) m/s 322333322222
Ground temperature (monthly) °C 262625262829303130302827
Table 2. People’s internal heat gain and building operation schedule.
DesignationNumberInternal Heat Load/Worker (W)Power (W)Time
People12140-9 h/day
Lighting25-409 h/day
Fan10-1009 h/day
Laptop10-1009 h/day
Handphone8-209 h/day
Table 3. Case study building material properties.
Office Building PartLayer NameWidthDensitySpecific HeatThermal ConductivityU-Value (W/m2K)
(mm)(kg/m3)(J/KgK)(W/mK)
Base model
Roof1. Concrete slab200240010001.132.295
Ceiling2. Gypsum plasterboard1980010900.16-
WallExterior coating: Cement and plaster10185810000.92.89
Hollow concrete block200220010081.3
Interior coating: Cement and plaster10185810000.9
Floor6. Ceramic tile1023907301.50.695
7. Cement screed202000656.90.753
8. Soil1000130010460.837
WindowTinted Single Glazing3 0.96.014
DoorWood400.615000.147-
Optimized model
Roof shadingSolid galvanized iron sheet5780045050-
Roof 2Concrete slab200240010001.132.295
CeilingGypsum plasterboard1980010900.16-
WallExterior coating: Clay10160010000.81.559
Hollow concrete block200220010081.3
XPS extruded polystyrene103514000.034
Interior coating: Clay10160010000.8
FloorCeramic tile1023907301.50.695
Cement screed202000656.90.753
Soil1000130010460.837
WindowTinted Single Glazing3 0.96.014
DoorWood400.615000.147-
Table 4. Input parameters for the energy simulation of the base model.
Input ParametersBase CaseCase 1Case 2Case 3Case 4Case 5Optimized Case
Windows ShadingRoof ShadingNaturalEvaporative Cooling and Night VentilationDehumidification
Ventilation
Building EnvelopeWall U-Value (W/m2K)2.892.892.892.891.5592.891.559
Roof U-Value (W/m2K)2.2952.2952.2952.2952.2952.2952.295
Floor U-Value (W/m2K)0.6950.6950.6950.6950.6950.6950.695
Glazing U-Value (W/m2K)6.0146.0146.0146.0146.0146.0146.014
Glazing SHGC0.6350.6350.6350.6350.6350.6350.635
Glazing VLT0.2010.2010.2010.2010.2010.2010.201
Window Shading (m)no 1.5 m fixed overhangno nono no 1.5 m fixed overhang
Roof Shadingno no roof shadedno no no roof shaded
External Shading (Trees)no no no no tree shadingno tree shading
Natural ventilationNatural ventilationoffoffoffonoffoffon
Natural ventilation (ac/h)0005005
Infiltration (ac/h)0.70.70.70.70.70.70.7
HVACSystem Typesplit systemsplit systemsplit systemsplit systemsplit systemsplit systemsplit system
System CoP3.53.53.53.53.53.53.5
Cooling set point temperature (°C)2222222222°2222
Cooling set back temperature (°C)28282828282828
Supply Air Condition (°C)12121212121212
Dehumidificationoffoffoffoffoffonon
Publisher’s Note: MDPI stays neutral with regard to jurisdictional claims in published maps and institutional affiliations.

