Article

Excessive Nitrogen Fertilization Is a Limitation to Herbage Yield and Nitrogen Use Efficiency of Dairy Pastures in South Africa

by
Motsedisi P. Phohlo
1,2,*,
Pieter A. Swanepoel
1 and
Stefan Hinck
3
1
Department of Agronomy, Stellenbosch University, Stellenbosch 7602, South Africa
2
Agricultural Sustainability, Trace & Save (PTY) Ltd., Jeffreys Bay 6330, South Africa
3
FARMsystem Hinck, Nelson-Mandela Strasse 1, 49076 Osnabrueck, Germany
*
Author to whom correspondence should be addressed.
Sustainability 2022, 14(7), 4322; https://doi.org/10.3390/su14074322
Submission received: 24 February 2022 / Revised: 17 March 2022 / Accepted: 23 March 2022 / Published: 6 April 2022

Abstract

:
The response of crop yields to fertilizers is a long-standing topic of agricultural production. Currently, in dairy-pasture systems, nitrogen (N) fertilizer is used as a management tool that is said to be directly proportional to pasture yield. We evaluated a large dataset consisting of data from 153 fields over five years to examine the effects of N fertilization on pasture yield and nitrogen use efficiency in the Eastern Cape province of South Africa. Fertilizer application rates were grouped into three treatments viz., <200, 200–350, and >350 kg N ha−1, and herbage yield response over the years was analyzed with mixed models. There were no differences found between treatments for total annual herbage yield over the years. High N fertilizer rates did not translate to a higher herbage yield of pastures. The N rate had a weak but significant negative correlation with the total annual yield and only accounted for 6% of the yield variation. The N use efficiency of pastures improved with reduced N application rates. Pasture yield varies through different seasons. Spring and summer account for the highest yield, coinciding with warm and moist conditions favorable for N mineralization in the soil. Farmers need to consider the time of the year and plan their monthly or seasonal fertilizer application accordingly to account for peak N mineralization rates.

1. Introduction

Dairy-pasture producers in South Africa are accustomed to nitrogen (N) fertilizer application rates as high as 600 to 1000 kg of N ha−1 to achieve herbage yields of 12 to 16 t ha−1 [1,2]. As a result, N utilization was poor with nitrogen use efficiencies (NUE) of 60–65 kg N ton−1 of pasture produced. In dairy-pasture systems, nutrient inputs are not only limited to fertilizers but also include cycling through animal excreta and N fixation by legumes. Animal excreta can supply as much as 1000 kg N ha−1 year−1 [3,4,5]. Fixed N from legume crops such as lucerne (Medicago sativa) and clovers (Trifolium spp.) have been reported to fix around 380 and 250 kg of N ha−1 year−1, respectively [6,7]. Even with these multiple inputs of N, farmers are reluctant to reduce N fertilizer rates. Fertilizer N is often seen as a quick fix to remediate slow pasture growth, although the reason for the slow growth rates is not necessarily an N limitation.
Considering the many avenues of nutrient inputs in dairy pasture systems, over-fertilization is likely [8,9]. Pasture productivity deteriorates when fertilizer is applied in excess [10]. Furthermore, over-fertilization results in losses through leaching and run-off of nutrients, which impairs water quality at the ground and surface water levels [11,12]. Over-fertilizing with N also increases greenhouse gas emissions, particularly nitrous oxide [9]. It is thus important that producers refine fertilizer programs to match crop requirements and consider the amount of soil N that could be mineralized from organic matter [8].
In the Eastern Cape province of South Africa, where dairy-pastures are common, the application of fertilizer N, phosphorus (P), and potassium (K) is mostly based on fertilizer recommendation guidelines that are meant for conventional systems [2]. The guidelines are still followed even though dairy pastures were converted to minimum-tillage systems with multispecies pastures. The adapted systems improved soil health by increasing the soil organic matter content, and in turn, the potential of the soil to mineralize N [13]. Improving soil health is a mechanism to improve pasture yield, fertilizer use efficiency, and farm productivity.
There have been numerous studies that have documented the response of pasture yield to N fertilizer application rates [8,14,15]. The commonality in the studies is that the effects of fertilization are observed through systems that observe the response in small plot experiments that attempt to mimic the real production systems. Additionally, other fertilization trends, such as that of P and K, are often not considered and can be limiting. This approach is therefore likely to miss the influence of different pasture and soil management systems, which are usually not uniform. Therefore, we evaluated a large dataset consisting of data from 153 fields over five years to examine the effects of N fertilization on pasture herbage yield and nitrogen use efficiency in the Eastern Cape province of South Africa.

2. Materials and Methods

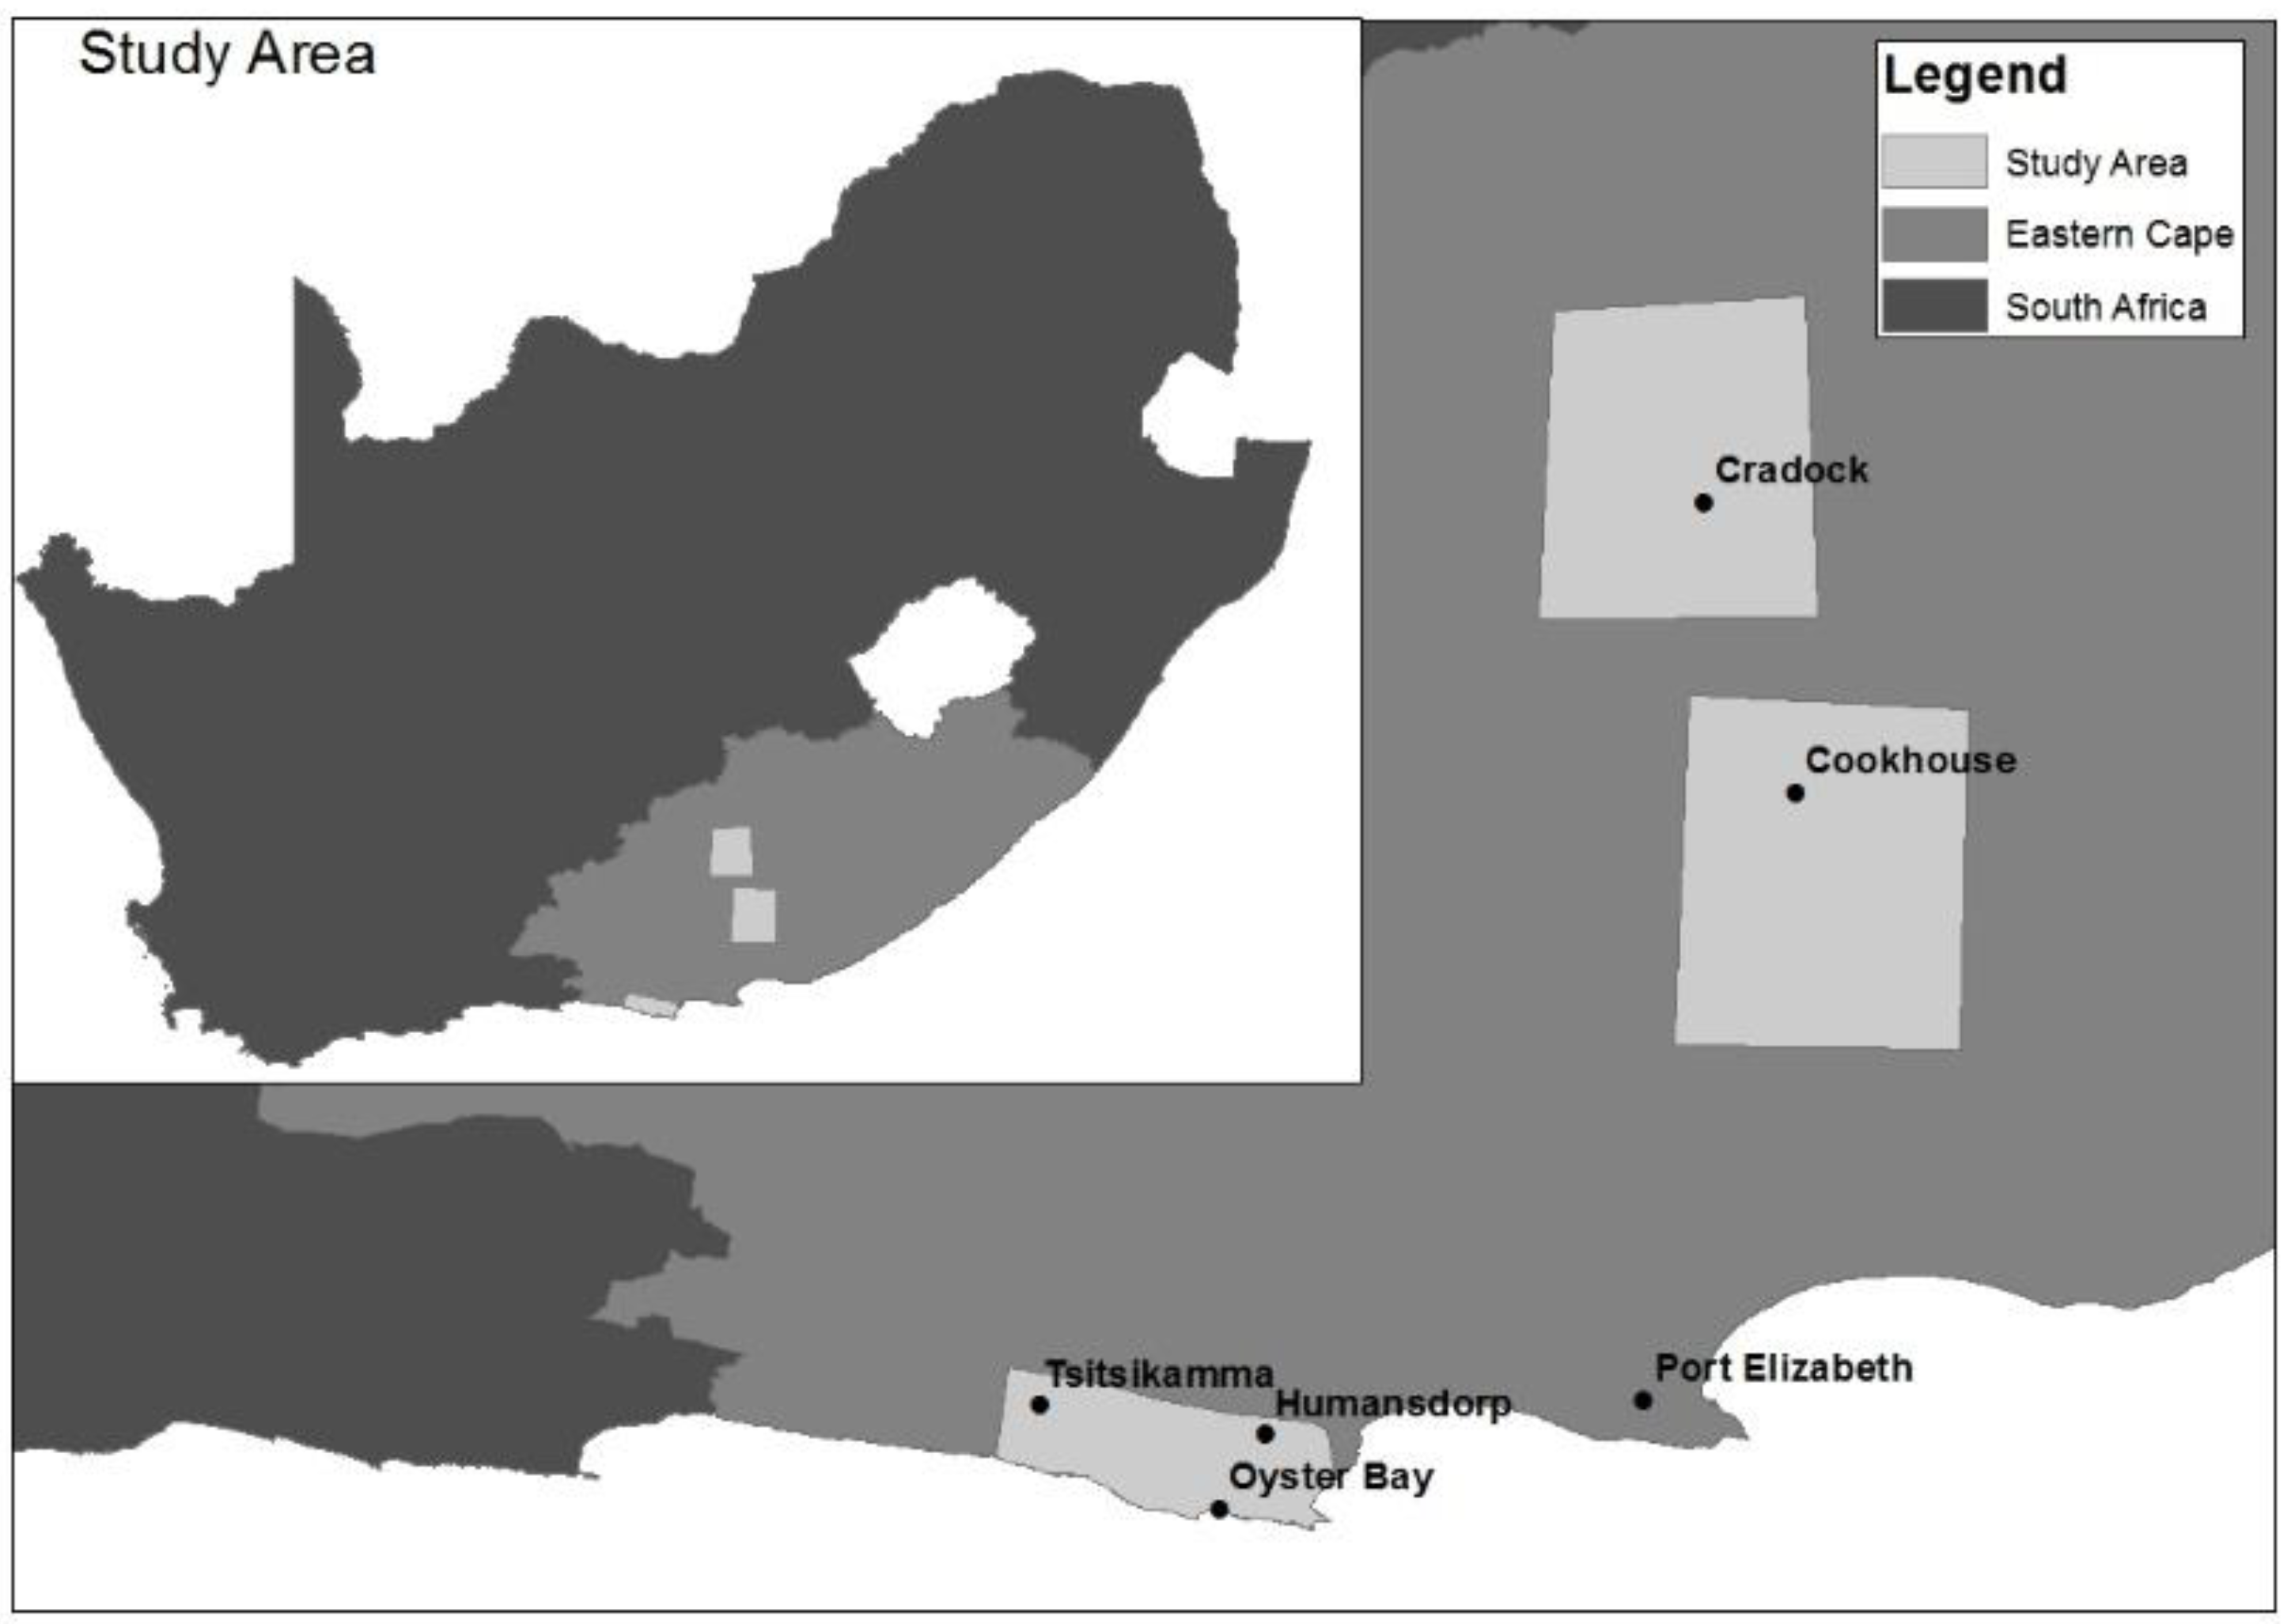
2.1. Study Area and Research Design

A study was laid out as an unbalanced completely randomized design with two treatment factors, namely the N fertilizer rate and year. A total of 153 irrigated fields ranging from 5 to 10 ha in size were evaluated in the Tsitsikamma Cradock/Cookhouse regions, which fall in the south-western and mid-western parts of the Eastern Cape province of South Africa (Figure 1). Although these regions differed in terms of temperature, rainfall, as well as irrigation management (Table A1), all are classified as a warm temperate climate, fully humid with a warm summer (Cfb) according to the Köppen–Geiger climate classification [16]. These fields, which have been under no-till for at least 15 years, were grouped into three N fertilizer rate treatments, namely, <200 kg N ha−1, 200–350 kg N ha−1, and >350 kg N ha−1 (Table 1). Fields were monitored over five years (2015–2019).
The fields had been planted with mixtures of kikuyu (Cenchrus clandestinus), annual and perennial ryegrass (Lolium spp.), red clover (Trifolium pratense) and/or white clover (T. repens), lucerne (Medicago sativa), and chicory (Cichorium intybus).
Farmers generally irrigated every second week, with irrigation amounts ranging from 15 to 25 mm in the Tsitsikamma and more regularly in the Cradock/Cookhouse region, but this depended on rain, water availability, soil moisture status, and evapotranspiration. The Tsitsikamma area receives its predominant rainfall in the winter and spring season, while the Cookhouse and Cradock area receives the most rainfall in the spring and summer seasons. The three areas are different in soil texture. The Tsitsikamma area has sandy soils while soils in the Cookhouse and Cradock areas are classified as sandy clay-loam soils.

2.2. Data Collection

The data used in this study were collected from a program called Fourth Quadrant (http://fourthquadrant.co.za accessed on 28 March 2020). Fourth Quadrant is a comprehensive program that allows the farmer to record the farms’ physical data, which includes daily, monthly, or annual milk produced, cow numbers and movement, and budget reported on a daily, monthly, or annual scale. Pasture management data include, among other parameters, monthly herbage yield, grazing cycles, and daily pasture operations such as planting, irrigation, mulching, fertilization, and weekly pasture growth. For this study, fertilizer data viz., N, P, and K were collated along with pasture growth rates that correspond to fields for which fertilizer data were captured. NUE was expressed as N applied (kg) per ton of pasture produced [17]. The data were captured by the farmer into the Fourth Quadrant. Before analysis, the data were scanned for accuracy, and where discrepancies surfaced, the data were verified with the farmer through personal communication between the first author and the farmer.
The pasture yield was measured with a disc pasture meter, also known as a rising plate meter (RPM) [18,19]. The pastures were measured across the fields taking multiple RPM readings. Areas of unevenness were avoided, such as around gateways, water troughs, pugged areas, and near fence lines. This was performed in order to obtain a representative and accurate pasture growth measurement. When taking pasture readings, the RPM was pressed down to the canopy of the pasture. The RPM then measured the height and density of the pasture. These readings were then converted into herbage yield (t DM ha−1).

2.3. Data Analyses

Mixed models were employed to evaluate the data using the restricted maximum likelihood (REML) procedure [20]. Fixed-effect factors included N treatment, year, and the interaction of year and N treatment. Dependent variables included annual herbage yield, monthly herbage yield, NUE, and P and K fertilizer rates. Fisher’s protected least-significant-difference test, with the standardized range [21], was used to compare means at the 5% level. The Kenward–Roger estimation procedure was used to account for the unbalanced data and heteroskedasticity [22]. The data were analyzed using Statistica.

3. Results

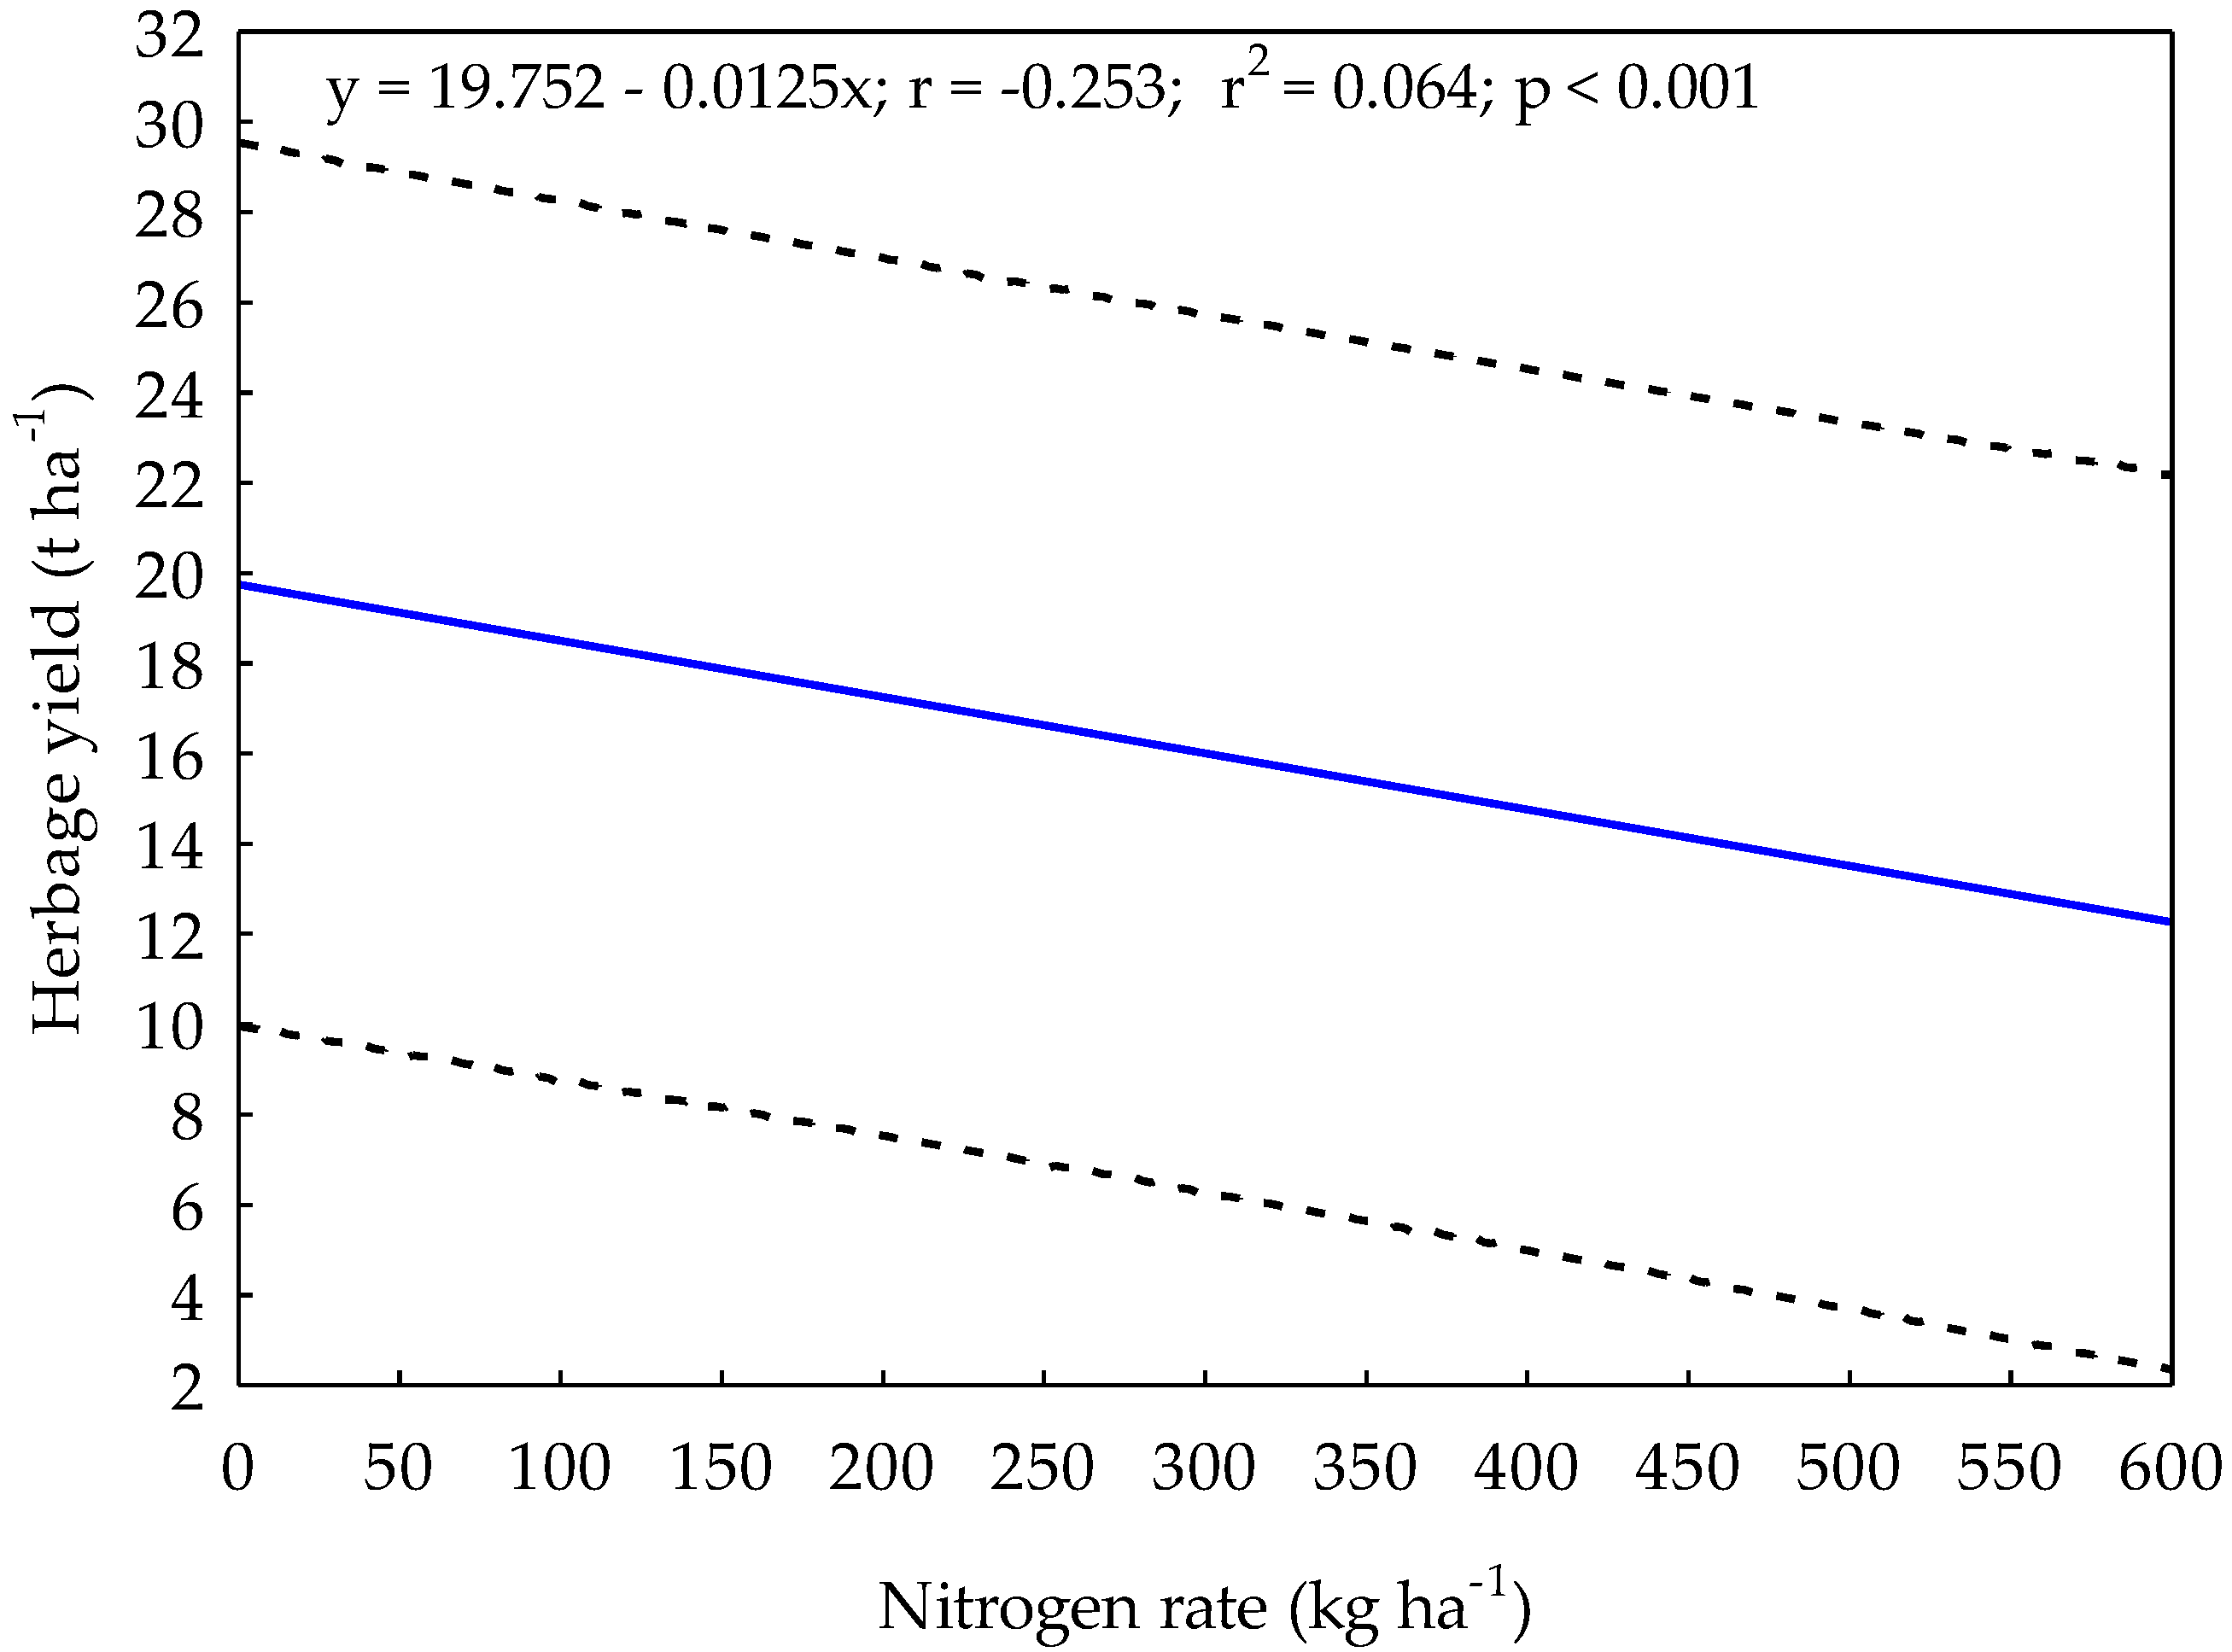
3.1. Annual Herbage Yield

The interaction and main effects of N treatment and year did not affect (p > 0.05) annual herbage yield (Table 2). The annual herbage yield was 16.1 ± 1.8 t ha−1 across all treatments. However, there was a weak but significant negative correlation between the annual herbage yield and N rate (Figure 2). The regression explained 6.4% of the yield variation.

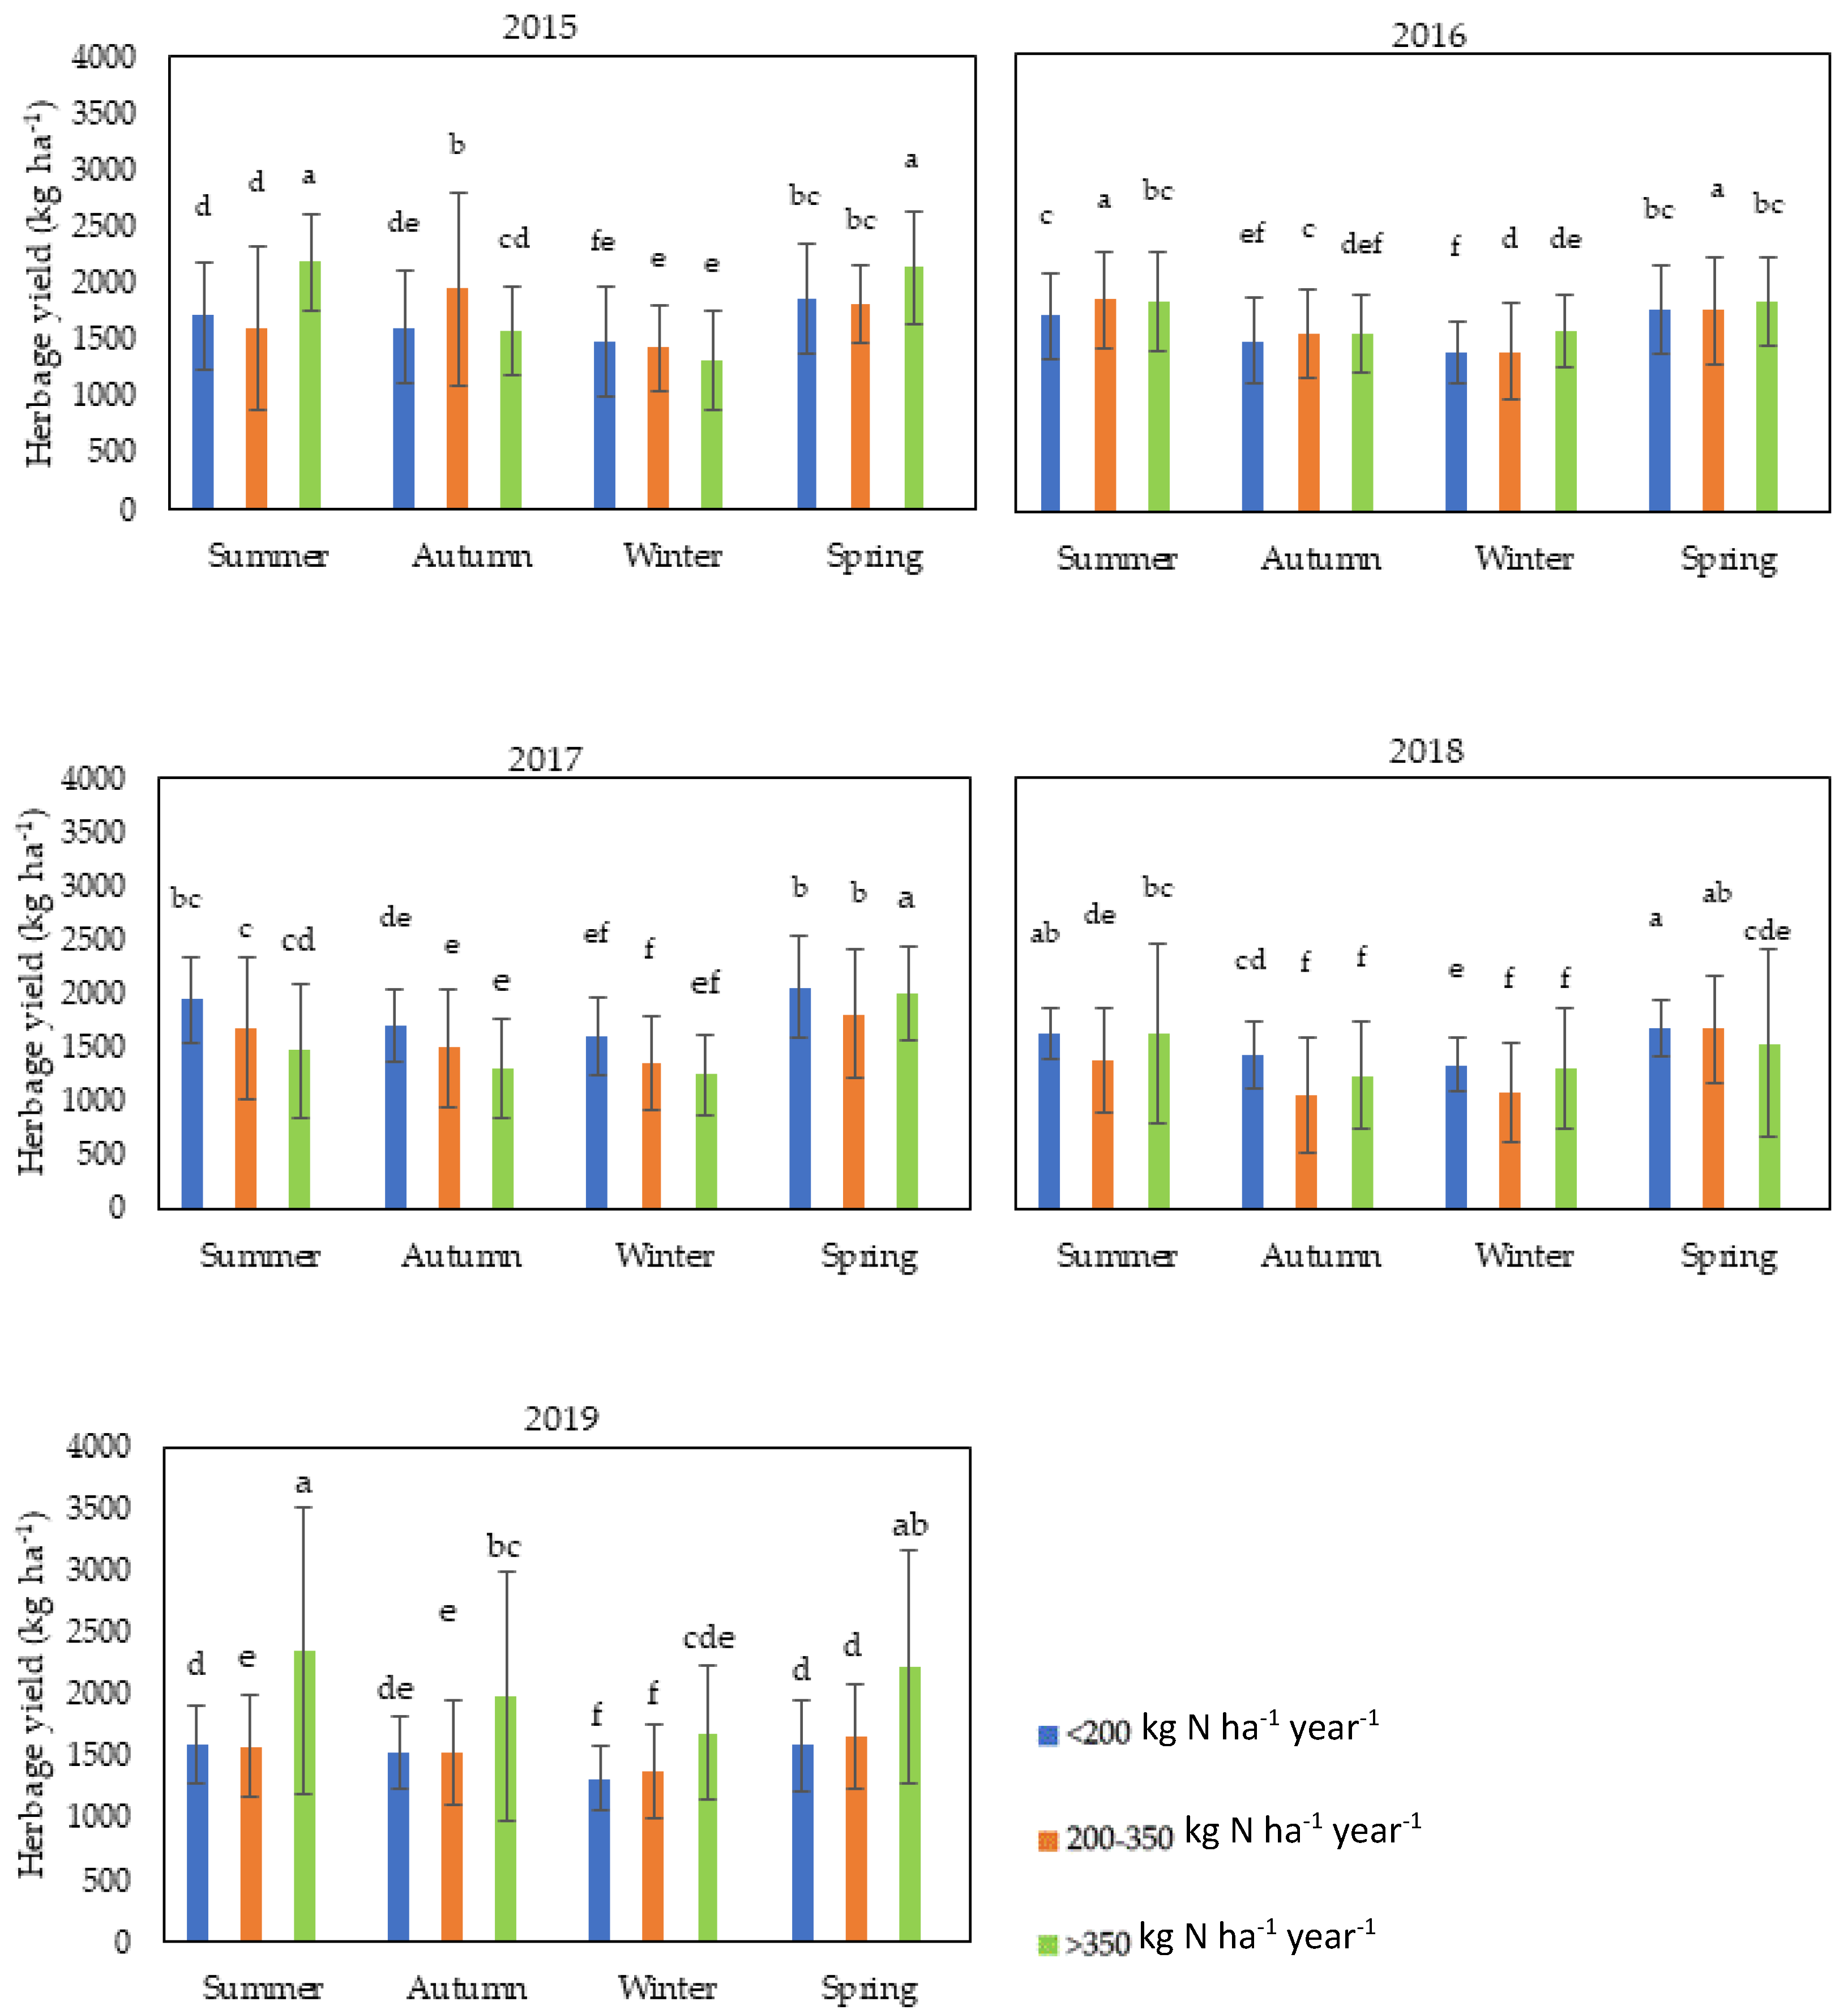
3.2. Seasonal Response of Herbage Yield to N Rate

The interactions and main effects of N treatment and season-affected (p < 0.01) herbage yield (Table 3).
The yield response to the N rate varied between seasons. A higher herbage yield was noted in 2015 and 20192 for the summer and spring seasons of fields that were receiving >350 N ha−1 compared to yields achieved with lower N rates (Figure 3). It is also important to note that, in 2019, only 15 fields were receiving >350 N ha−1 as denoted in (Table 1).

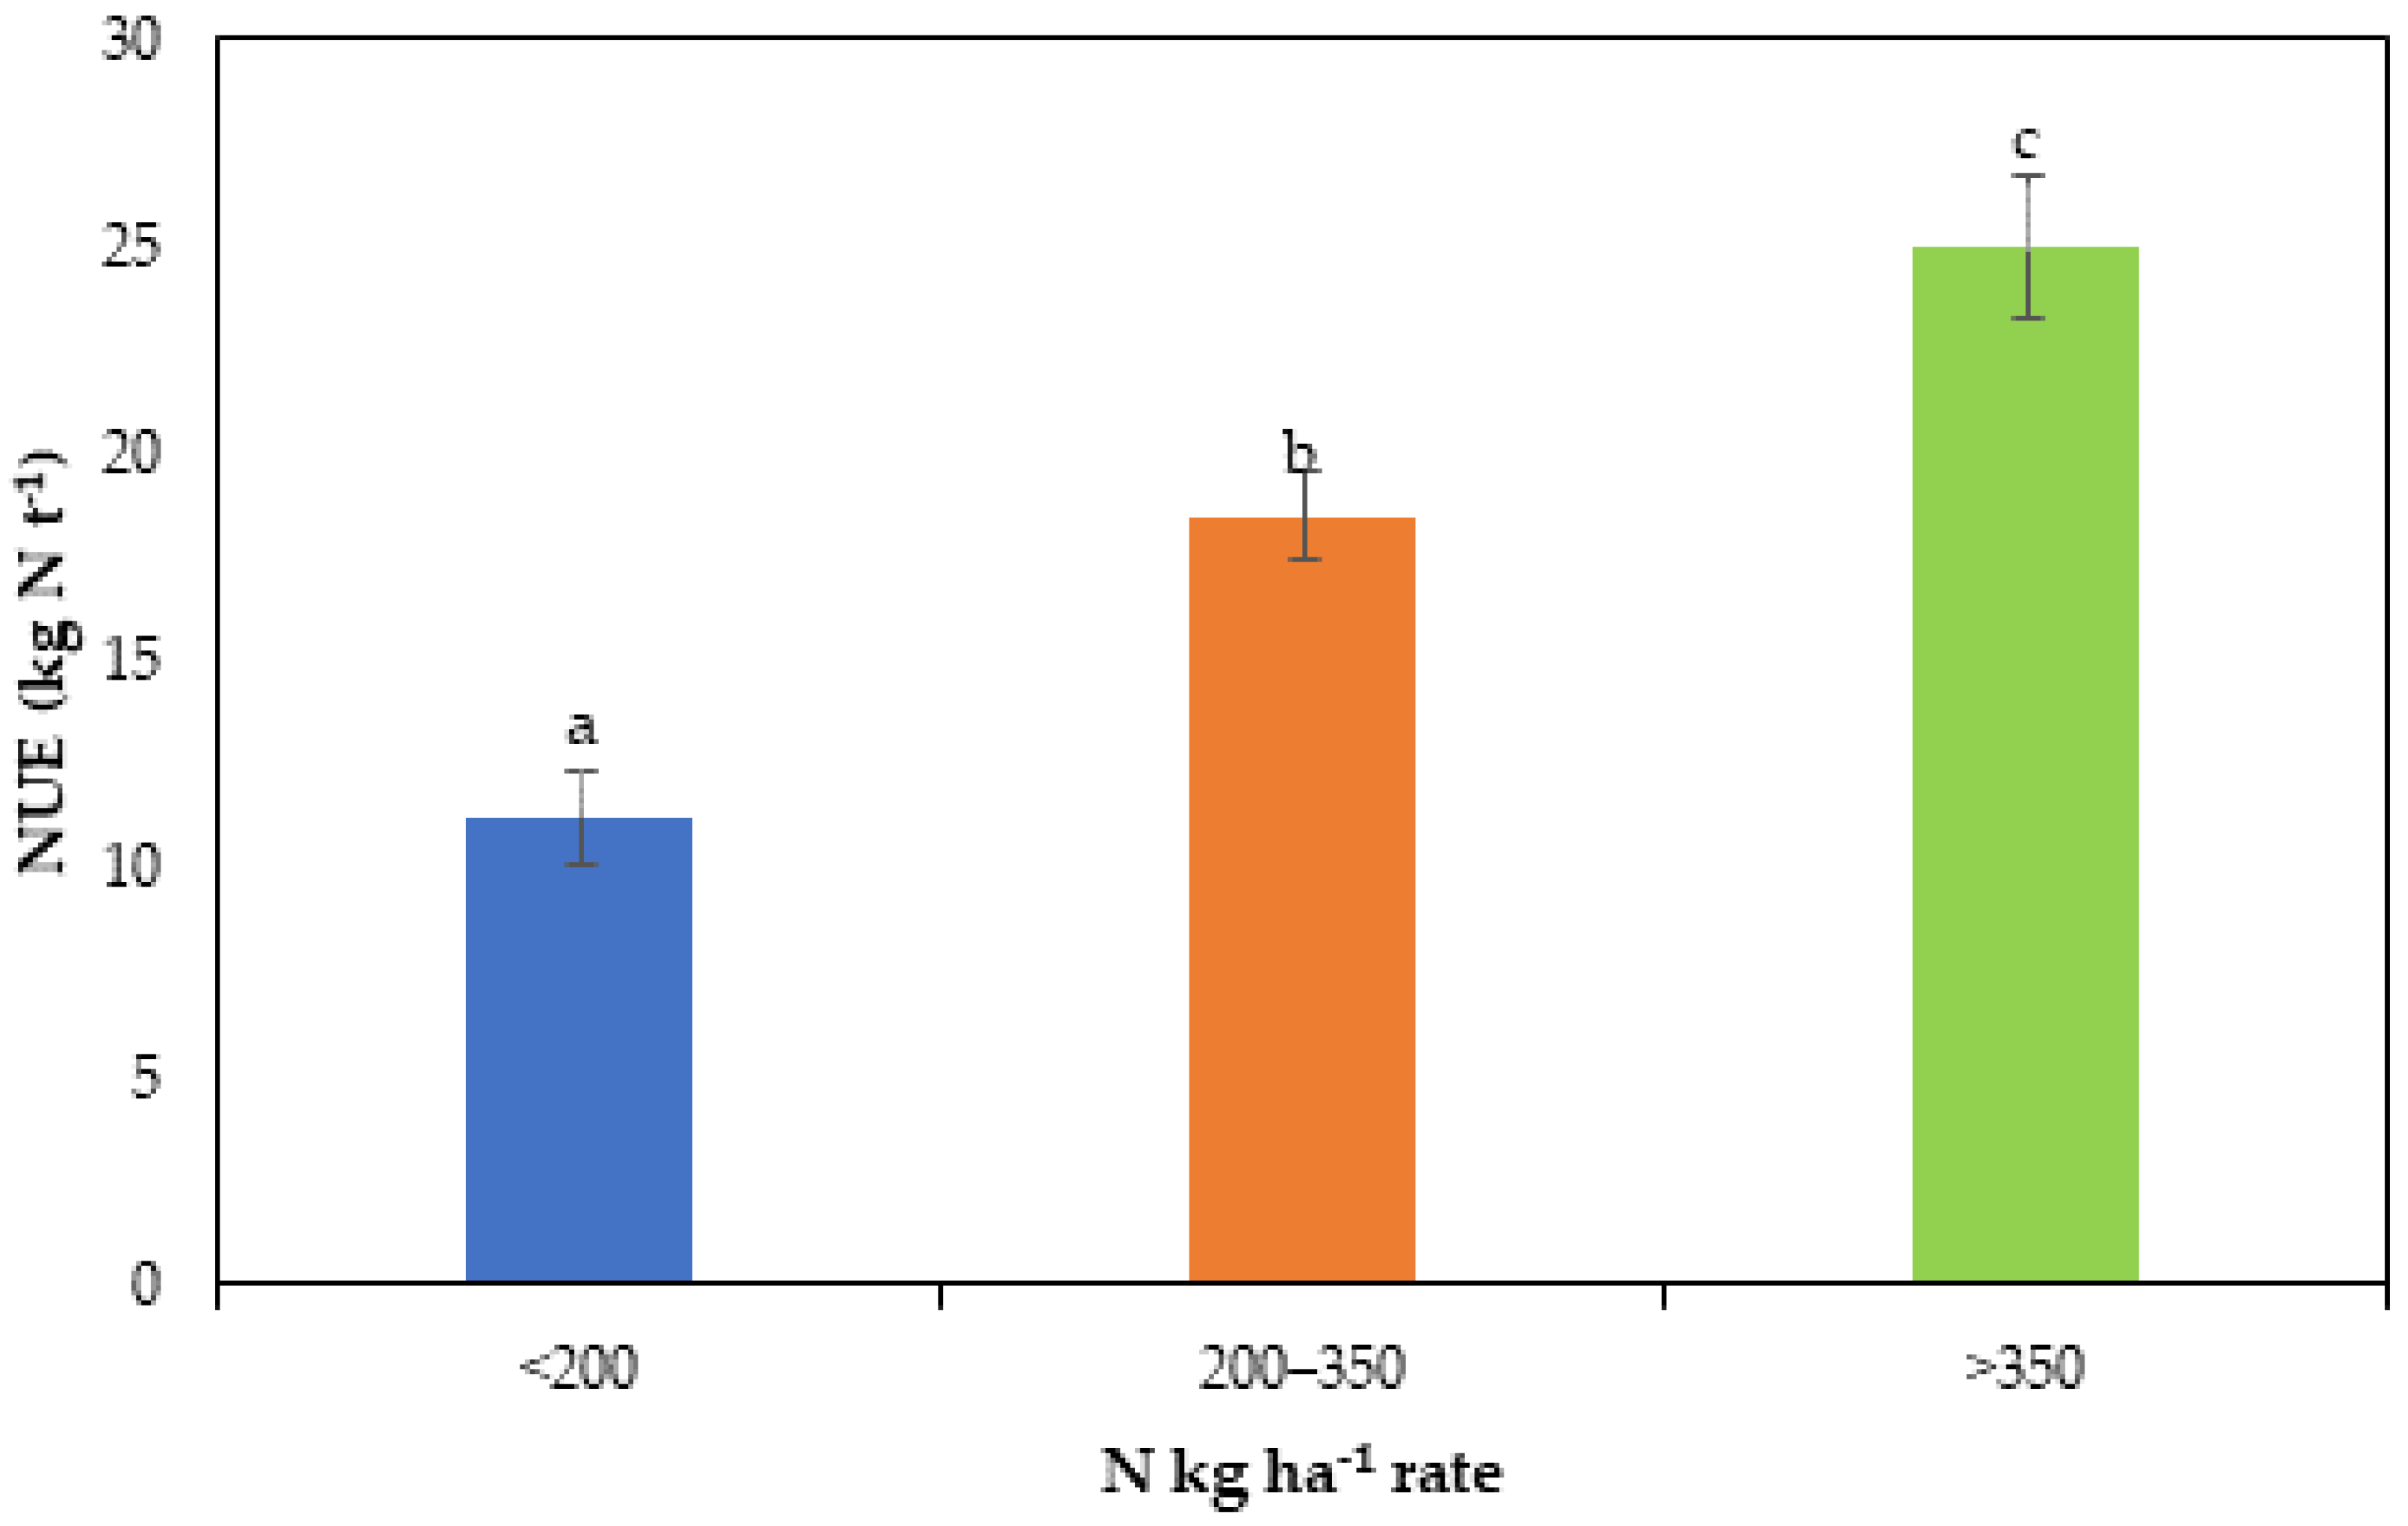
3.3. Nitrogen Use Efficiency

The NUE was affected by the main effect of the N rate, and not by the main effect of the year or the interaction between the N rate and year (Table 4).
When less than 200 kg N ha−1 was applied, the NUE was most efficient, as only 11.3 kg N was required to produce 1 ton of herbage (Figure 4). When more than 350 kg N ha−1 was applied, 25 kg N was required to produce 1 ton of herbage. This response was stable over the years, so no improvement or degradation in the NUE was observed over time (p > 0.05).

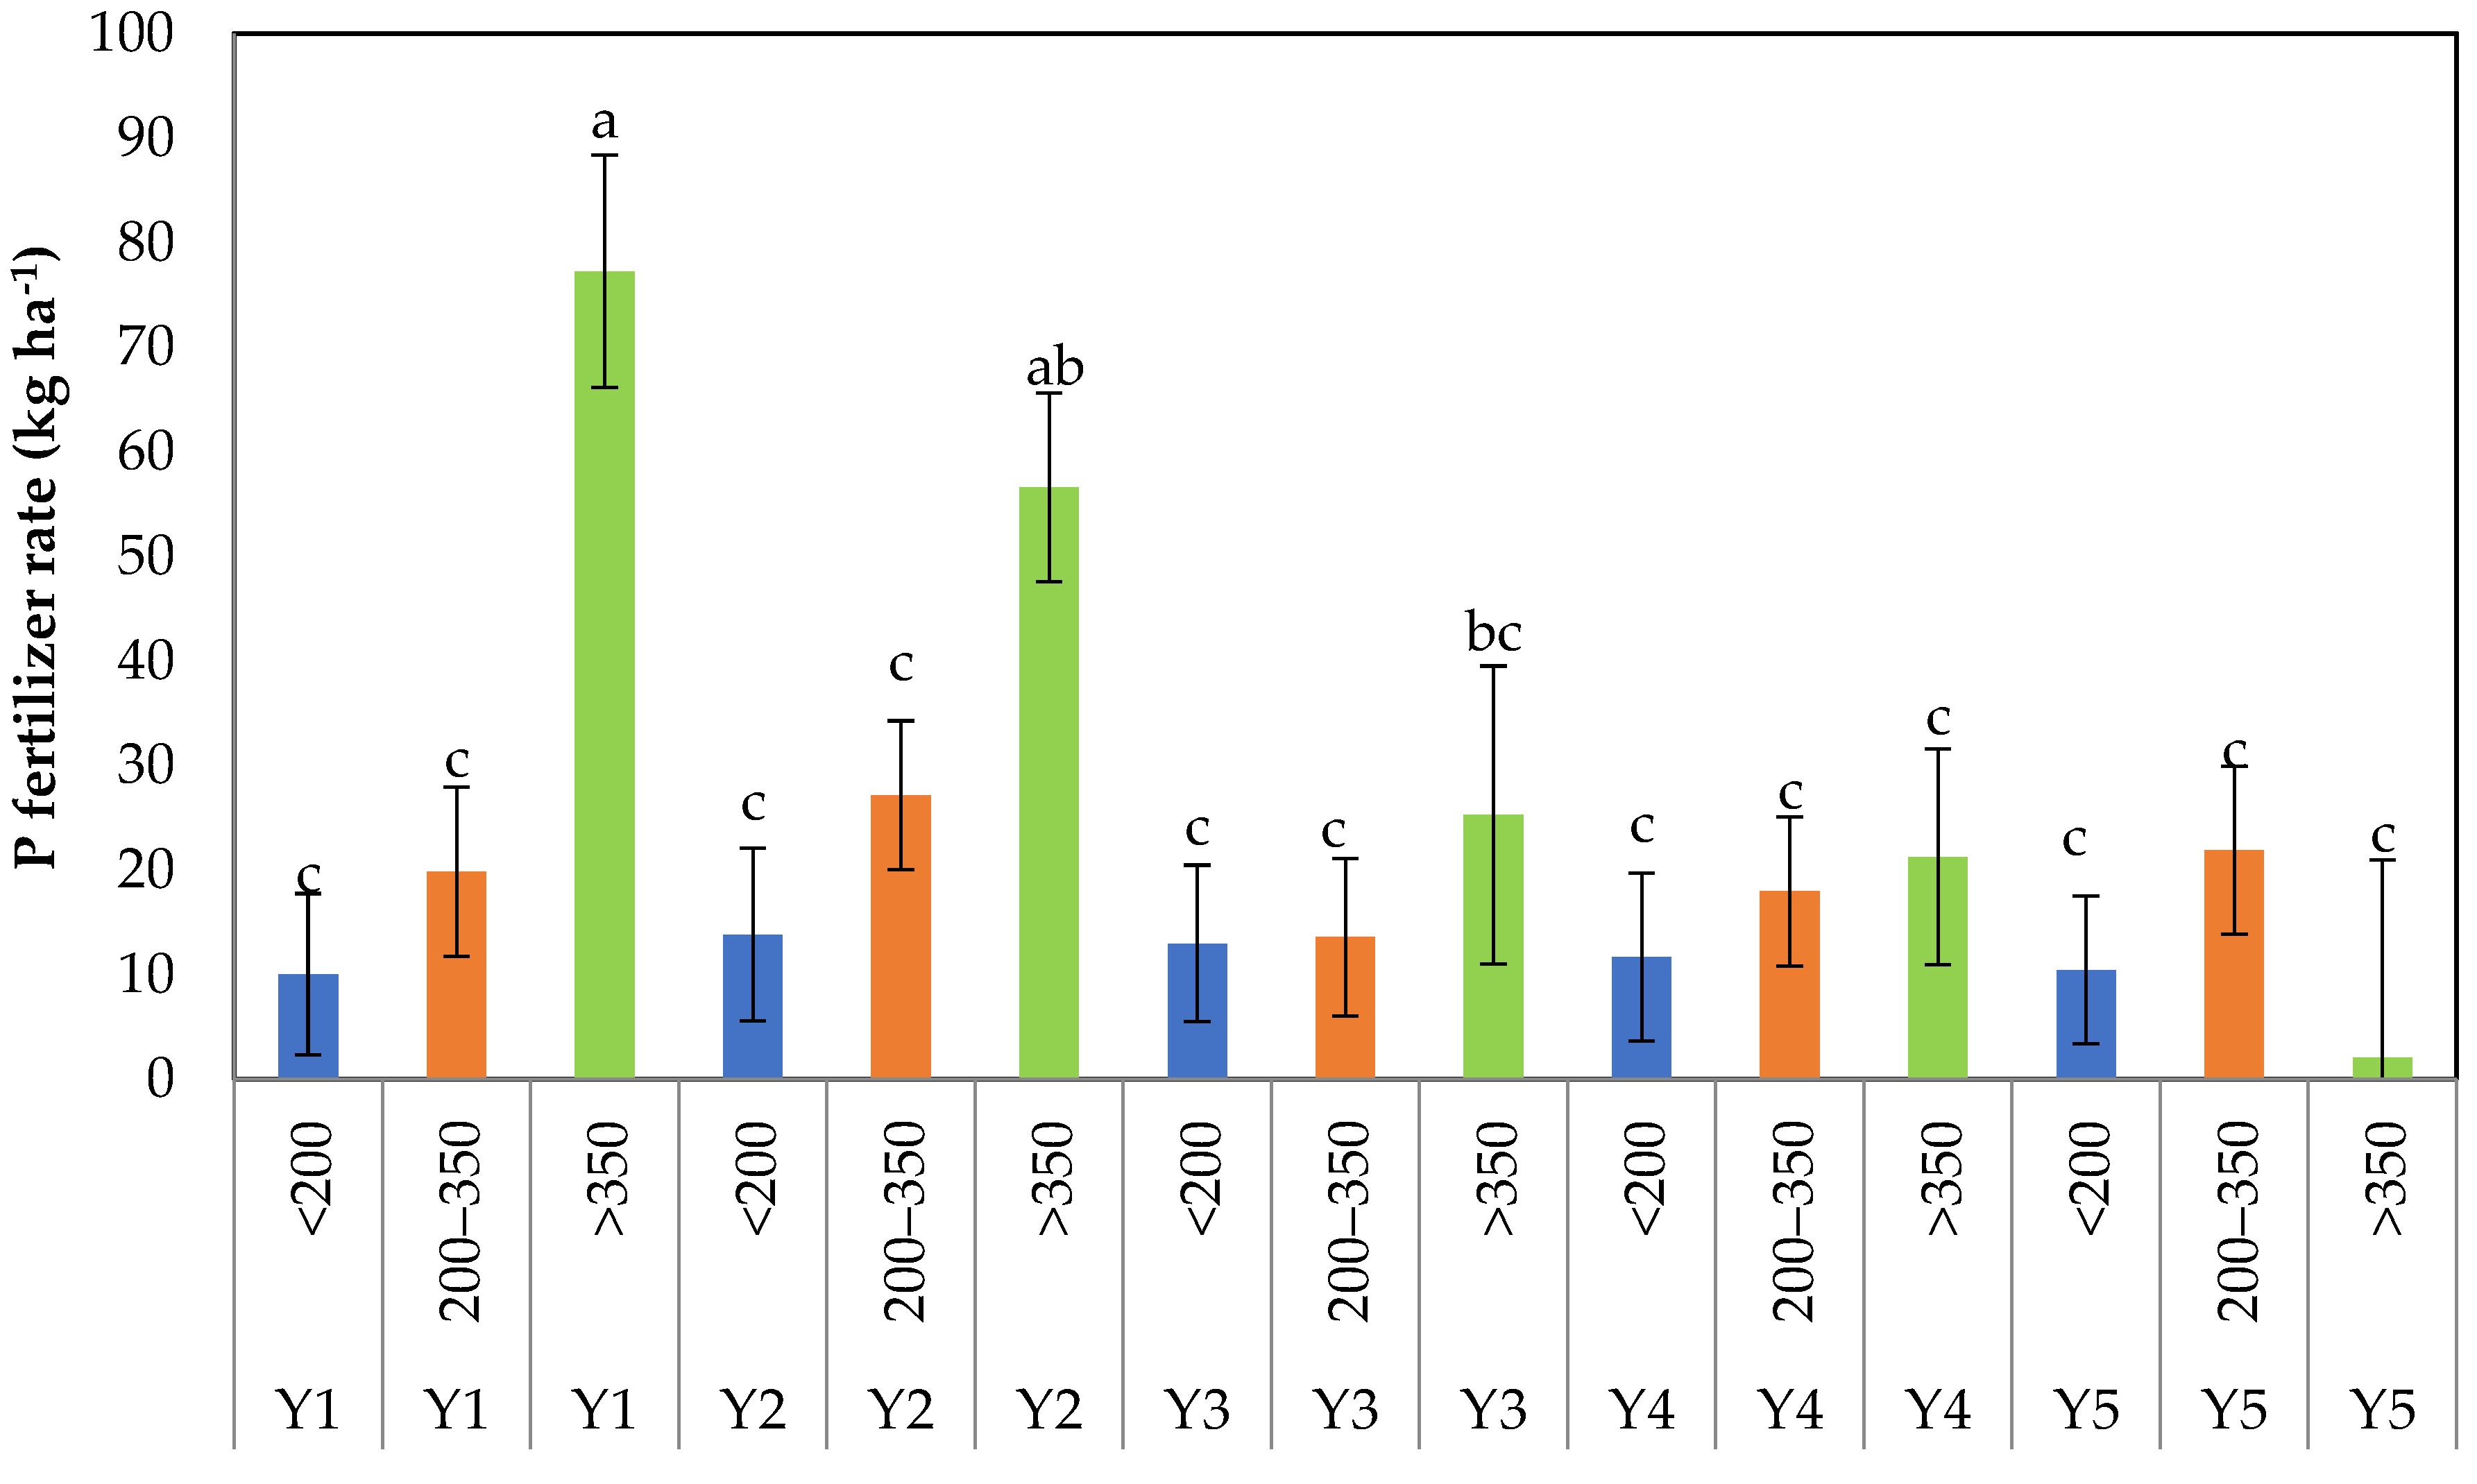
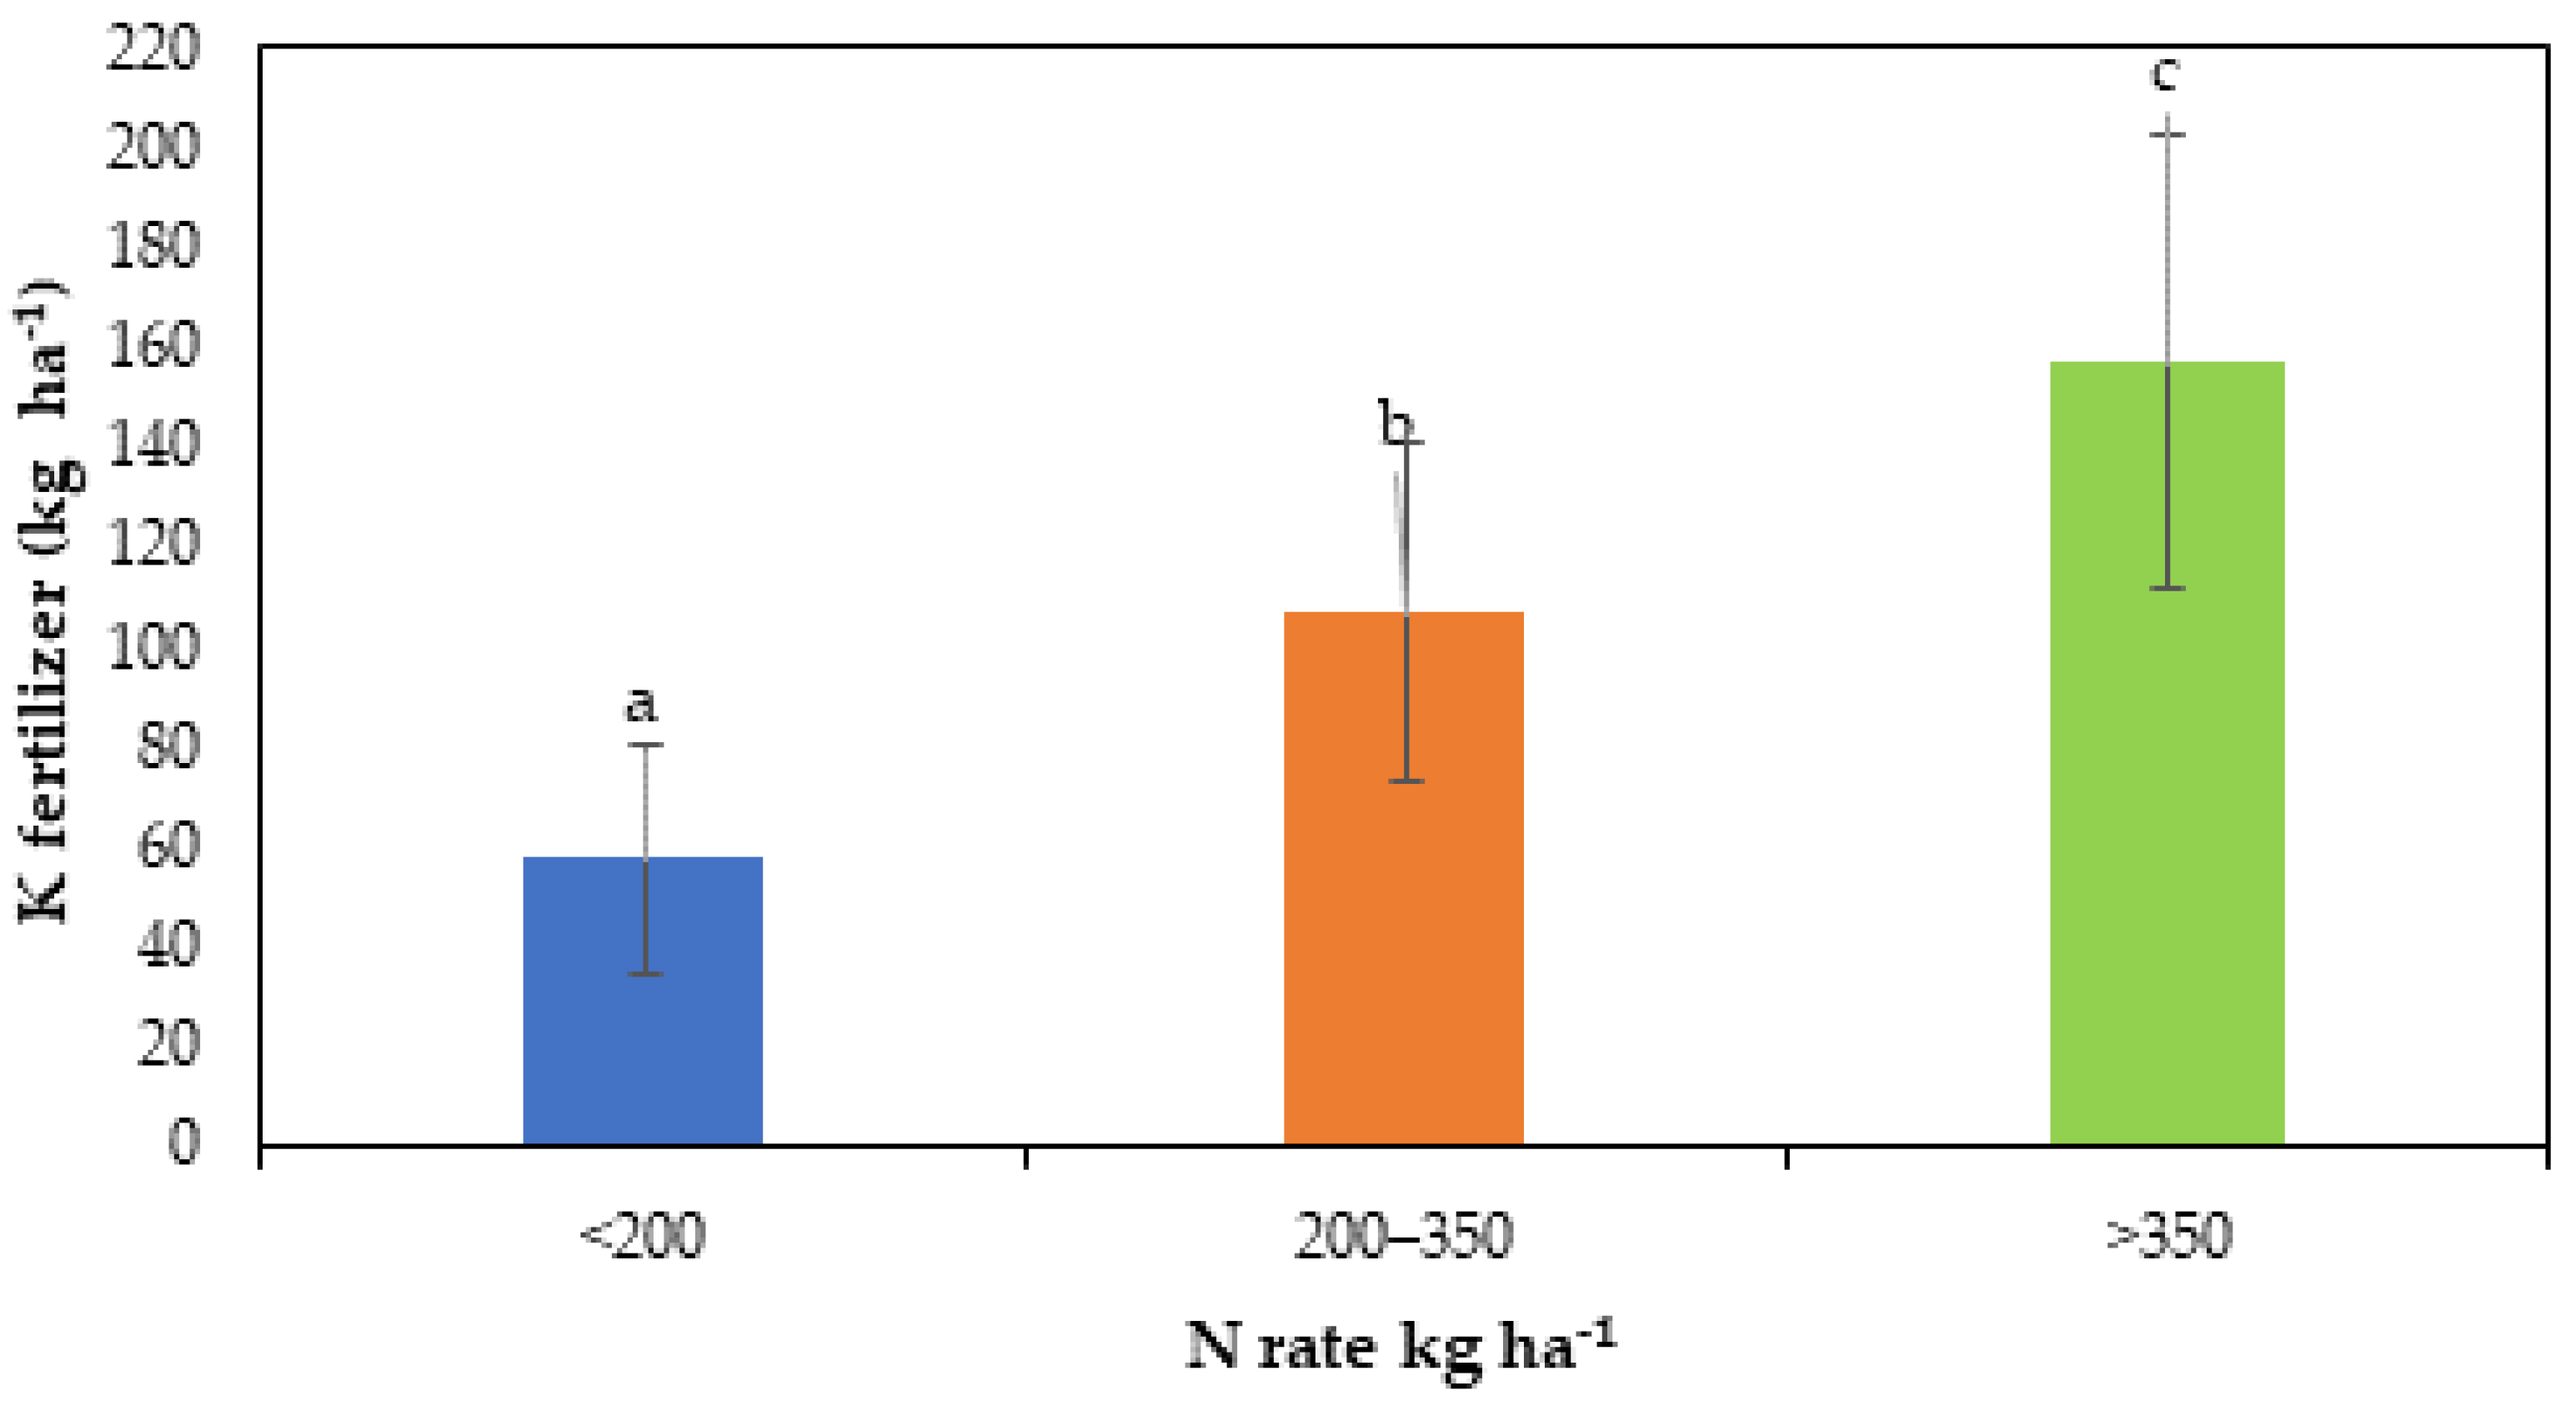
3.4. Association of P and K Fertilization with N Treatments and Herbage Yield

The P and K rates did not affect herbage yield (p > 0.05; results not shown). The supply of P and K to ensure optimal growth was therefore sufficient. However, to investigate the inclination of farmers to apply high rates of other fertilizers when the N rate is high, P and K fertilizer rates were also investigated.
There was an interaction (p < 0.05) between the P fertilizer rate in response to the N fertilizer rate and year (Table 5). There was more P fertilizer applied in the fields that received >350 kg N ha−1, while fields that received <200 kg N ha−1 received the lowest P rates. No responses (p < 0.05) in the P rate were noted in any year in fields that received less than 350 kg N ha−1 (Figure 5). Although years 1 to 3 received the highest P application rates (Figure 5), there was no response in yield observed when comparing yields between treatments (Table 2). In years 4 and 5, the P fertilizer rate in fields that received >350 kg N ha−1 did not differ from the P rates in fields that received <350 N kg ha−1 (Figure 5).
The response of the K fertilizer rate was consistent across the years for all N rate treatments (p < 0.05) as no interaction effect was noted, but the main effect of the N rate was significant (Table 4). Fields that received less than 200 kg N ha−1 also received the lowest rates of K, and fields that received >350 kg N ha−1 received the highest rates of K (Figure 6). Fields that received more N also received more K, but without an improvement in herbage yield (Figure 2).

4. Discussion

4.1. Herbage Yield and Nitrogen Use Efficiency

Despite the dry conditions that prevailed during the study years, the fields that received less than 200 kg N ha−1 were able to attain competitive herbage yields (15.9 t ha−1 year−1). Evidence from this study showed that high N fertilizer rates do not necessarily translate to higher herbage yield of pastures that have been managed under minimum tillage for at least 15 years. This is confirmed by the lack of significant differences in annual yield produced between the N fertilizer rates under investigation. A weak but significant negative correlation of the N rate with annual herbage yield points to adverse effects of N fertilization at high N rates. The findings of this study are similar to that of Viljoen et al. [8] and Johnson et al. [19] who found that there are limited benefits for pasture and tropical grasses yield in high N input systems. Viljoen et al. [8] found that pasture yield is maximized at 200 kg−1 ha−1, while. Johnson et al. [19] reported that N fertilizer application rates greater than 78 kg−1 ha−1 did not result in further increases of forage mass. Some studies have found opposite responses, i.e., higher N rates resulting in higher yields. However, the response is expected to be context-specific. It is not unusual to achieve higher crop yields with a high N fertilization rate, particularly in soils that have a poor soil biological profile or low soil organic matter content. These soils are likely to have low soil mineral N contents due to the soil’s poor natural ability to mineralize N [23]. However, pasture soils in the Eastern Cape Province generally have high soil organic C contents of more than 3% in the 0–150 mm soil layer [2].
In the current study, N fertilizer rates that surpassed 200 kg ha−1 did not contribute towards annual yield any more than when less than 200 kg N ha−1 was applied. Risk factors associated with high fertilizer rates include increased economic and environmental costs. The high herbage yields in fields where less than 200 kg of N ha−1 were applied can be attributed to mineral N released into the soil solution during organic matter decomposition and mineralization of N [8]. Thus, the N from the fertilizer serves as supplementary N to the soil solution, additionally to what is naturally available in the soil. In soils that do not have the ability to release natural N from organic matter, high N application rates may be expected to be beneficial until the biological activity of the soil has been improved [23].
However, the relationship between the N applied and yield showed that N fertilization accounted for only 6% of the yield variations. This finding indicated that other parameters not investigated by this study probably contributed to yield response. Although the role of N is understood to be primary in plant growth, it is important that farmers do not view fertilizer N as the only solution to optimizing yield.
In the study, it was found that there is variation in pasture yield through different seasons. The highest yield was achieved during spring and summer provided there was sufficient moisture, which will enhance organic matter decomposition leading to an increase in mineral N availability (Figure 3). The lowest production occurred in winter, which reflected colder conditions and low N mineralization rates. Thus, applying high N amounts when temperature and moisture is limiting does not lead to higher yields. The study also showed that fields receiving less than 200 N ha−1 had a more consistent growth throughout the years except for the winter months (Figure 3). Interestingly even though the winter months had a low herbage yield, they were still higher than the herbage yields of fields receiving >200 N ha−1 for the same months except for the summer and spring of year 1 and year 5. The study illustrated that winter, and sometimes autumn, are the most critical seasons; thus, farmers need to pay careful attention to them since growth is severely compromised (Figure 3). Sun et al. [14] also found similar findings in New Zealand where seasonal differences were observed in yield. Less herbage yield was produced between June and October, and it is between these months that N fertilization was mostly concentrated. This information supports the suggestion by Viljoen et al. [8] to follow a variable rate of N fertilizer according to the time of year. Failure to account for mineralization from organic matter to determine optimal N fertilizer rates is a serious shortcoming both in South Africa and elsewhere in the world. Recommendations for N fertilizer application rates should be based on the age of the pasture and organic C content, as well as the time of the year to consider N mineralization. Although there are opportunities for farmers to reduce the rate of N application and thus reduce their input costs, more research is needed to understand how accounting for N mineralization should be conducted for different contexts.
There is potential to improve NUE of the pasture-based dairy farms in South Africa by opting for lower N fertilizer rates. The average N requirement per ton of herbage for fields receiving less than 200 kg N ha−1 was 11 kg, while fields that received more than 200 kg N ha−1 ranged from 18 to 24 kg N ton−1 herbage produced (Figure 4). This means that for a similar yield, the input cost of N fertilization per hectare was twice as high in the latter fields. Varvel and Peterson [23] reported that N removed by crops is 50% of the applied N at low N rates and at least 20–30% at high N rates. The implication is that high-N systems are inefficient, and this is also demonstrated in this study. Recent studies show that soil mineral N has a big influence on N optimization [24]; thus, future research needs to look at the soil dynamics that influence mineral N content and link them to the NUE of pastures.
Conventional fertilizer strategies are based on a practice where N fertilizer is applied at a set rate following grazing [2,25]. This practice needs to be reviewed as this study demonstrated that excessive N fertilization does not increase yield.

4.2. Influence of P and K Fertilization over N Use Efficiency of Pasture

During the study years, fields were also dosed with varying amounts of P and K in each N treatment. Table 1 showed that different N treatments differed in their P and K applications. It is not clear whether these rates were applied according to soil requirements or because of farmer habits. What is clear, though, is that large responses to tactical application of N fertilizer can be obtained without the need for additional P and K fertilizer, especially if the soil analysis indicates that there is sufficient P and K in the soil.
Fields that received >350 N ha−1 are an expensive system due to their high application rates of not only N, but P and K as well. Although K fertilization differed between treatments, it did not differ in terms of rates applied within years of the same treatment. This means that the field was receiving similar amounts of K fertilizer each year (Figure 6). Swanepoel et al. [2] reported nutrient loading of cultivated pasture soils in South Africa, which is likely because of practices noted in the current study.
Fertilization of pastures irrespective of nutrients being applied must be performed with insight from the soils’ biological, chemical, and physical characteristics. The measurement of these components provides inferences about the amounts of nutrients needed to be applied to top up the removal by pasture and correct a specific deficiency or conform to the demand from pasture crops. The measurement of the soil’s biological perspective is especially important for determining the soils’ ability to supply its own N. This will help in reducing the amount of applied N.
It is important to note that soil analyses play a central role in determining fertilizer requirements. Therefore, future research needs to establish the role soils play in the efficient use of N. Soil biological analyses that are linked to soil N mineralization are critical analyses that ought to be considered when making recommendations on N fertilization.
The South African dairy industry is faced with the challenge of rising input costs such as feed, fertilizer, fuel, and electricity. An increase in these input costs means a higher cost of production per liter of milk, and this results in deteriorating profit margins for dairy farmers. A reduction in fertilizer costs while maintaining or increasing pasture yield will assist in improving farm productivity. These results show that there is an opportunity to reduce input costs, particularly those associated with N fertilization.

5. Conclusions

High N fertilizer rates do not necessarily translate to a higher herbage yield of pastures. In fact, high N fertilizer rates may have a negative effect on the herbage yield and NUE. The results suggest that it is more efficient to fertilize at lower N rates provided that other essential elements are not limited in pastures that have a high potential to mineralize N from soil organic matter. Additionally, other essential nutrients such as P and K only need to be applied if they are deficient in the soil based on soil analysis. The application of these nutrients unnecessarily may lead to contamination of ground and surface water sources, which, in turn, affect water quality. Farmers also need to consider the time of year and plan their monthly or seasonal fertilizer application accordingly to account for peak N mineralization rates.

Author Contributions

Conceptualization, P.A.S. and M.P.P.; methodology, M.P.P.; software, P.A.S.; validation, P.A.S., S.H. and M.P.P.; formal analysis, M.P.P., P.A.S., and S.H.; investigation, M.P.P.; resources, P.A.S. and M.P.P.; data curation, M.P.P. and P.A.S.; writing—original draft preparation, M.P.P.; writing—review and editing, M.P.P., P.A.S., and S.H.; visualization, M.P.P.; supervision, P.A.S. and S.H.; funding acquisition, P.A.S. and M.P.P. All authors have read and agreed to the published version of the manuscript.

Funding

This research was funded by Trace & Save, Woodlands Dairy (PTY) LTD, Fourth Quadrant, as well as Milk SA (PRJ-0302-2021).

Institutional Review Board Statement

Not applicable.

Informed Consent Statement

Not applicable.

Data Availability Statement

The data will be reposited in the Trace & Save and Fourth Quadrant databases.

Acknowledgments

Stellenbosch University, Trace & Save, Woodlands Dairy (PTY) LTD, Fourth Quadrant, and Milk SA are all thanked for financial assistance and access to data. Producers forming part of the Trace & Save and Fourth Quadrant database are acknowledged for sharing data. Thank you to DG Nel for assisting with the statistical analysis of data. Ethical clearance was granted by the Social, Behavioural, and Education Research Ethics Committee of Stellenbosch University (project number 23163).

Conflicts of Interest

The authors declare no conflict of interest.

Appendix A

Table A1. Mean temperature (°C) and total annual rainfall (mm) and irrigation (mm) in the Tsitsikamma, Cookhouse, and Cradock areas between 2015 and 2018 (ARC-ISCW, 2020).
AreaLong-Term RainfallRainfallIrrigationMinimum TemperatureMaximum Temperature
mm year−1°C
Tsitsikamma 76225111.422.5
Cradock 21012317.726.7
Cookhouse 22411579.825.6

References

  1. Fourth Quadrant. Fourth Quadrant Data; Fourth Quadrant: Jeffreys Bay, South Africa, 2015. [Google Scholar]
  2. Swanepoel, P.A.; du Preez, C.C.; Botha, P.R.; Snyman, H.A.; Habig, J. Assessment of tillage effects on soil quality of pastures in South Africa with indexing methods. Soil Res. 2015, 53, 274–285. [Google Scholar] [CrossRef]
  3. Cameron, K.C.; Di, H.J. Nitrate leaching in temperate agroecosystems: Sources, factors and mitigating strategies. Nutr. Cycl. Agroecosyst. 2002, 64, 237–256. [Google Scholar]
  4. Menneer, J.C.; Ledgard, S.F.; Gillingham, A.G. Land Use Impacts on Nitrogen and Phosphorus Loss and Management Options for Intervention; Environment Bay of Plenty: Whakatane, New Zealand, 2004. [Google Scholar]
  5. Cameron, K.C.; Di, H.J.; Moir, J.L. Nitrogen losses from the soil/plant system: A review. Ann. Appl. Biol. 2013, 162, 145–173. [Google Scholar] [CrossRef]
  6. Shepherd, T.G. Visual Soil Assessment: Field Guides for Pastoral Grazing and Cropping on Flat to Rolling Country, 2nd ed.; Horizons Regional Council, Landcare Research: Palmerston North, New Zealand, 2009; Volume 1, p. 119. [Google Scholar]
  7. Frankow-Lindberg, B.E.; Dahlin, A.S. N2 fixation, N transfer, and yield in grassland communities including a deep-rooted legume or non-legume species. Plant Soil 2013, 370, 567–581. [Google Scholar] [CrossRef]
  8. Viljoen, C.; van der Colf, J.; Swanepoel, P.A. Benefits are limited with high nitrogen fertilizer rates in kikuyu-ryegrass pasture systems. Land 2020, 9, 173. [Google Scholar] [CrossRef]
  9. Smit, H.P.; Reinsch, T.; Swanepoel, P.A.; Loges, R.; Kluß, C.; Taube, F. Environmental impact of rotationally grazed pastures at different management intensities in South Africa. Animals 2021, 11, 1214. [Google Scholar] [CrossRef] [PubMed]
  10. Eickhout, B.; Bouwman, A.F.; Zeijts, H.V. The role of nitrogen in world food production and environmental sustainability. Agric. Ecosys. Environ. 2006, 116, 4–14. [Google Scholar] [CrossRef]
  11. Buczko, U.; Kuchenbuch, R.O. Environmental indicators to assess the risk of diffuse nitrogen losses from agriculture. Environ. Manag. 2010, 45, 1201–1222. [Google Scholar] [CrossRef] [PubMed]
  12. Innes, R. Economics of Agricultural Residuals and Overfertilization: Chemical Fertilizer Use, Livestock Waste, Manure Management, and Environmental Impacts; Elsevier: Amsterdam, The Netherlands, 2013; pp. 50–57. [Google Scholar]
  13. Swanepoel, P.A.; du Preez, C.C.; Botha, P.R.; Snyman, H.A.; Habig, J. Tillage effects, soil quality and production potential of kikuyu–ryegrass pastures in South Africa. Grass Forage Sci. 2017, 72, 308–321. [Google Scholar] [CrossRef]
  14. Sun, X.; Longhurst, B.; Luo, J.; Luo, N. Fertilizer nitrogen and factors affecting pasture responses. Open Agric. J. 2008, 2, 35–42. [Google Scholar] [CrossRef]
  15. Williams, P.H.; Paterson, D.J. Response of pastures to nitrogen fertiliser applied in autumn and spring on the West Coast of South Island, New Zealand. NZ J. Exp. Agric. 1983, 11, 247–250. [Google Scholar] [CrossRef]
  16. Kottek, M.; Grieser, J.; Beck, C.; Rudolf, B.; Rubel, F. World map of the Köppen-Geiger climate classification updated. Meteorologische Zeitschrift 2006, 15, 259–263. [Google Scholar] [CrossRef]
  17. Dobermann, A.R. Nitrogen Use Efficiency—State of the Art; Agronomy and Horticulture Faculty Publication; University of Nebraska: Lincoln, NE, USA, 2005; p. 316. [Google Scholar]
  18. Dennis, W.; Hancock, D.; Tucker, J.; Stewart, R.; Baxter, L. Using a Rising Plate Meter to Measure Pasture Mass; University of Georgia Extension Service: Athens, GA, USA, 2020. [Google Scholar]
  19. Johnson, C.R.; Reiling, B.A.; Mislevy, P.; Hall, M.B. Effects of nitrogen fertilization and harvest date on yield, digestibility, fiber, and protein fractions of tropical grasses. J. Anim. Sci. 2001, 79, 2439–2448. [Google Scholar] [CrossRef] [PubMed]
  20. Payne, R.W. Introduction to GenStat® for Windows™, 17th ed.; VSN International: Hemel Hempstead, UK, 2014; Available online: http://www.genstat.co.uk/ (accessed on 23 February 2022).
  21. Snedecor, G.W.; Cochran, W.G. Statistical Methods, 7th ed.; Iowa State University Press: Ames, IA, USA, 1980; p. 507. [Google Scholar]
  22. Glass, G.V.; Peckham, P.D.; Sanders, J.R. Consequences of failure to meet assumptions underlying the fixed effects analyses of variance and covariance. Rev. Educ. Res. 1972, 42, 237–288. [Google Scholar] [CrossRef]
  23. Halvorson, A.D.; Reule, C.A. Irrigated, no-till corn and barley response to nitrogen in northern Colorado. J. Agron. 2007, 99, 1521–1529. [Google Scholar] [CrossRef]
  24. Varvel, G.E.; Peterson, T.A. Nitrogen fertilizer recovery by corn in monoculture and rotation systems. J. Agron. 1990, 82, 935–938. [Google Scholar] [CrossRef]
  25. Fertasa. Fertilization Handbook; Fertilizer Association of Southern Africa: Pretoria, South Africa, 2016. [Google Scholar]
Figure 1. The study area included the Tsitsikamma and Cradock/Cookhouse regions of the Eastern Cape Province, South Africa.
Sustainability 14 04322 g001
Figure 2. The relationship between herbage yield (t ha−1) and N application rate (kg ha−1). The solid line and dotted ribbon indicate the regression coefficient and 95% confidence interval, respectively.
Sustainability 14 04322 g002
Figure 3. Monthly herbage yield response per season to N rate treatments of the dairy-pastures in the Eastern Cape, South Africa from 2015 to 2019. Error bars denote standard error of the mean. No common letter above bars denotes a significant difference (p < 0.05) within a year.
Sustainability 14 04322 g003
Figure 4. The effect of N treatment (kg N ha−1) on nitrogen use efficiency (NUE). Main effects of N treatment are shown for 153 fields observed from 2015 and 2019. Error bars denote standard error of the mean. No common letter above bars denotes a significant difference (p < 0.05).
Sustainability 14 04322 g004
Figure 5. Phosphorus fertilizer application rate in response to N rates between 2015 and 2019 (Y1–Y5) in the dairy-pastures in the Eastern Cape Province, South Africa. Error bars denote standard error of the mean. No common letter above bars denotes a significant difference (p < 0.05).
Sustainability 14 04322 g005
Figure 6. Potassium fertilizer application rate in response to N rates between 2015 and 2019 in the dairy-pastures in the Eastern Cape Province, South Africa. Error bars denote standard error of the mean. No common letter above bars denotes a significant difference (p < 0.05).
Sustainability 14 04322 g006
Table 1. A description of the N fertilizer treatments (i.e., application rate), five-year mean N, P, and K rate of each treatment, and the number of fields included each year (Y1 = 2015, Y2 = 2016, Y3 = 2017, Y4 = 2018, and Y5 = 2019).
Application Rate (kg ha−1)Mean N Rate ± SD (kg ha−1)Mean P Rate ± SD (kg ha−1)Mean K Rate ± SD (kg ha−1)Y1Y2Y3Y4Y5
<200158 ± 9.713 ± 3.468 ± 5.6 3028685669
200–350270 ± 9.525 ± 2.391 ± 4.24773536969
>350410 ± 9.437 ± 4.2121 ± 5.67652322815
Table 2. The ANOVA F-statistic and p-values for the interaction between years and nitrogen applied. Bold is used to illustrate the p-values < 0.05.
Annual Yield (t ha−1)
F-Statisticp-Value
Year 1.540.208
N rate0.2540.781
Year × N rate0.8330.586
Table 3. The ANOVA F-statistic and p-values for the N treatments, season, year, and their interactions.
F Statisticp-Value
Year60.96<0.001
Season218.63<0.001
N rate28.46<0.001
Year × Season6.9<0.001
Year × N rate40.12<0.001
Season × N rate5.33<0.001
Year × Season × N rate6.85<0.001
Table 4. The ANOVA F-statistic and p-values for the interaction between years and nitrogen use efficiency. Bold is used to illustrate the p-values < 0.05.
NUE (N t−1)
F-Statisticp-Value
Year 1.170.334
N rate35.27<0.001
Year × N rate0.6520.733
Table 5. The ANOVA F-statistic and p-values for the interaction of N treatments and years responding to applied P and K. Bold is used to illustrate the p-values <0.05.
Phosphorus Fertilizer Rate
(kg ha−1)
Potassium Fertilizer Rate
(kg ha−1)
F-Statisticp-ValueF-Statisticp-Value
Year3.880.0102.230.084
N rate6.81<0.0015.420.016
Year × N rate2.320.0320.5620.813
Publisher’s Note: MDPI stays neutral with regard to jurisdictional claims in published maps and institutional affiliations.

