1. Introduction
Forests globally sequester and store the majority of living terrestrial biomass and therefore play an important role in mitigating climate change [
1]. Forests also play a key role in the future transition towards a bioeconomy by providing biomass to substitute for fossil-based materials and energy-intensive materials as well as increasing the storage of carbon in harvested wood products [
2,
3,
4]. However, increased extraction rates of woody biomass from
forest ecosystems to meet the needs of the bioeconomy may conflict with biodiversity protection and other ecosystem services provided by forests [
5,
6]. Land use changes are a leading threat to global biodiversity, and forestry is a major contributor to such land use changes in some regions [
7].
Life-cycle assessments (LCAs) are widely used to provide a scientific measure of a product’s overall environmental performance [
8]. LCAs can be used for a wide range of applications, from hot spot identification and environmental design to comparative purposes and market communication. There are two main forms of LCA: attributional LCA (ALCA) and consequential LCA (CLCA). ALCA aims to describe a production system as it is, typically using average data. CLCA can also use average data but compared to ALCA it expands the system boundaries by including marginal or avoided impacts on other economic sectors induced by a change in the product system [
9].
Over the past 20 years, there has been a growing interest in including land use impacts on biodiversity in LCAs. A multitude of indicators and methods have been developed to include different characteristics of biodiversity for general use in LCAs [
10,
11,
12,
13,
14,
15,
16]. Despite the significant advances that have been made in this research field, these approaches are still under development, and it is still difficult to include land use change and impacts on biodiversity in LCAs due to methodological limitations and data scarcity [
12,
17]. As a result, there is a lack of consensus on which model to use, and many LCA studies therefore do not consider impacts on biodiversity [
18,
19].
Forest biomass is produced in dynamic ecosystems. In the short term and at the individual forest stand level, the harvesting, use, and combustion of biomass results in direct emissions of some biogenic carbon to the atmosphere, which are slowly compensated for by uptake through forest regrowth. However, rather than being managed on the single stand level, forests are managed and therefore also assessed on the landscape scale across a mosaic of forest stands in different states of the rotation cycle in order to supply a continuous flow of forest wood materials [
20,
21]. For example, final felling occurs once only for each rotation period in the whole area considered as a single stand; however, within the same time span, final felling occurs consecutively on a small fraction of the total area in a landscape. Here, we use the term
landscape to describe several managed, even-aged, forest stands that differ mainly in stand age. The actual frequency and ratio of the land area affected each year by final felling depend on the age distribution and rotation age of all stands present in the landscape; however, the proportion of land area affected by final felling in Sweden is only a few percent each year [
21].
The overall purpose of LCAs of the production of forest wood materials, with regard to impacts on biodiversity, is to influence individual forest owners to adopt forest management practices that are compatible with current conservation strategies and policies as far as possible in a manner that can enable long-term human occupancy [
19]. An important aspect is to provide the consumers of forest-based products with a basis of scientifically correct information that allows them to make informed choices regarding which products to buy. Within the context of legal forest acts, individual forest owners in the Nordic countries have a relatively large degree of freedom regarding which forest management option to apply. Hence, LCA assessments should ideally target the performance of the individual forest owner. General forest management is important too in order to be able to transfer good practices or avoid less sustainable options and is the most common approach for LCIA currently developed for biodiversity.
The potential environmental impact of a forest product can be expressed at the midpoint or endpoint level. A midpoint impact assessment indicator is defined by the UN Environment Life Cycle Initiative as a link in the cause–effect chain (environmental mechanism) of an impact category prior to the endpoints, at which characterization factors (CFs) can be derived to reflect the relative importance of emissions, extraction, or land use [
22]. Endpoints are located beyond midpoints and characterize quality changes aggregated in three main areas of protection: human health, ecosystem quality, and natural resources [
23]. In this paper, the selection of a midpoint or endpoint is related to the setting of reference situations used for the implementation of the suggested methodology, as described further below.
The inclusion of biodiversity approaches in LCAs that cover important aspects of forest management could result in a more complete understanding of the environmental sustainability of a wood-based bioeconomy [
24]. Many studies have recently emphasized that it can be challenging to capture the impacts of the production of specific forest products on biodiversity [
25,
26,
27,
28] and current LCA methods do not capture important aspects of sustainable forest management typical of northern European forests. Managed forests are dynamic systems that are affected by many environmental and management factors over time. These factors differ between geographical regions and depend upon underlying abiotic factors [
29]. It is therefore difficult to summarize biodiversity changes using a single numerical value.
Impacts on biodiversity can be measured by a range of different indicators. Global approaches such as those developed and recommended by the UN Environment Life Cycle Initiative, formerly known as the UNEP-SETAC Life Cycle Initiative, often assess biodiversity impacts at the ecoregion level and therefore do not generally have a sufficiently fine geographical resolution to capture aspects of management by individual forest owners [
29]. Furthermore, assessments of biodiversity indicators require a reference situation, or baseline, in order to separate out specific anthropogenic activities from natural or non-anthropogenic processes [
30,
31]. The choice of reference situation has a decisive impact on how the impact of forestry on the quality of biodiversity is assessed [
19]. In this paper, we assess two reference situations, the
business-as-usual (BAU) baseline and the
target reference baseline. In the BAU reference situation, the ecosystem quality of the current regional forest management practice is applied as a baseline. It is relatively straightforward to determine a BAU baseline since the current regional forest land use practice in many cases is known and the future development of the forest can be predicted based on anticipated trends [
30]. The
target reference baseline is a desired direction for ecosystem management, improvement, or restoration and is used to facilitate a distance to a targeted measure. It corresponds to a preference state, such as a desired state of biodiversity, and includes biodiversity that requires a certain level of management [
19,
30]. However, few studies have thoroughly elaborated on reference situations with regard to forest management and in many cases the potential natural vegetation without anthropogenic intervention is regarded as the reference situation.
Finding suitable methods, indicators, and pathways that consider biodiversity impacts in Northern European managed forests is important, since a significant fraction of the wood available on the global market is produced in the Nordic countries [
32]. It is therefore of interest to analyze how the available approaches to life-cycle impact assessments (LCIAs) for biodiversity consider the special features of these managed boreal forests as a complement to approaches on the ecoregion level. Sweden and Finland were ranked as the third and fifth largest sawn-wood exporters in the world in 2019, respectively [
32]. In Sweden, approximately 81% of productive forest land is privately owned, with around 60% of the private owners being smallholders and 40% being forestry companies [
33]. This ownership structure contrasts sharply with the ownership structure of forests in continental Europe.
In this study, we suggest a conceptual approach for assessing biodiversity impacts in LCAs that could be used at the landscape level for individual forest owners, with a focus on Nordic managed forests. Our methodology provides an operational impact assessment model on biodiversity, inspired by the reference situation approach used for international climate reporting. In addition, complementary reference situation approaches applicable to attributional LCAs are evaluated. The two reference situation approaches developed in this paper make use of consensus work and approaches that have already been established [
34]. We build on experience from the conceptual framework for land use impact assessment developed by the UN Environment Life Cycle Initiative [
35,
36]. We also evaluate how the choice of reference situation and impact assessment methodology provide different options, pathways, and incentives for forest management options that may improve biodiversity.
This paper proceeds as follows. First, we describe a conceptual approach that considers important aspects of biodiversity in Nordic managed forests at the landscape level, with implications for forest management choices made by individual forest owners. Secondly, we illustrate our approach with case study examples. Finally, we conclude with a discussion and suggestions for further work.
2. Materials and Methods
We describe two conceptual models for biodiversity impact assessment based on the same conceptual methodology approach. The implementations of these approaches are generally applicable and include important aspects of biodiversity for forest management at the landscape or forest owner level in Nordic countries.
2.1. Description of Impact Assessment Models
When setting up an impact assessment model on biodiversity, we are aware that there are limited inventory data currently available for operationalizing such a model. It is difficult to find comprehensive and representative information about species diversity in forests. Information about the presence or absence of vascular plant species in selected plots from the Swedish National Forest Inventory (NFI) can be used [
37]. However, the variation is very large, and it is debatable to what extent this information represents the species diversity across all organism taxa. It is also very costly to conduct specific species diversity inventories for LCIA purposes due to the time-consuming inventory work, especially for individual forest owners. Instead, the focus should likely be on indicators that reflect forest stand structures that are regarded as favorable for biodiversity with some degree of consensus. Such aspects are used within national Environmental Quality Objectives (EQOs), such as the ‘Living Forests’ standard in Sweden. For monitoring changes over time, several different structural biodiversity indicators can be used. In our approach, we suggest using four of the biodiversity indicators that are used in the Swedish
Environmental Quality Objective ‘Living Forests’, which are listed below [
38]. These four indicators can be regarded as having been established to assess the status of Swedish forests in terms of their structure in order to promote the positive development of biodiversity. Our suggestion is to summarize the areas of forest stands that comply with each of the four indicators and to relate these summarized areas to the total areas of productive forest, either in a certain geographical region or in the total productive forest under the control of an individual forest owner. The four assessed biodiversity indicators are:
- (1)
Stands with old trees. The average tree age in the stand should be above 140 years in northern Sweden and above 120 years in southern Sweden.
- (2)
Stands with dead wood. There should be more than 20 m3 of dead wood per hectare, including only dead wood with a diameter greater than 20 cm.
- (3)
Stands with large trees. There should be more than 60 trees per hectare with a diameter greater than 45 cm for Norway spruce, Scots pine, and ‘noble broadleaves’ and a diameter greater than 35 cm for other tree species.
- (4)
Mixed deciduous and coniferous tree species. The average tree age in the stand should be above 80 years, and more than 3/10 of the basal area should be deciduous tree species.
The development of digital solutions to manage forests efficiently and remotely makes it possible to consider the grid size used for assessment models. At present, data is generally available either on the regional (county) or landscape level or for the individual forest stands within the property of a forest landowner. For this reason, at least two approaches can be used in the future to define the reference situation for biodiversity assessment, as illustrated in
Figure 1.
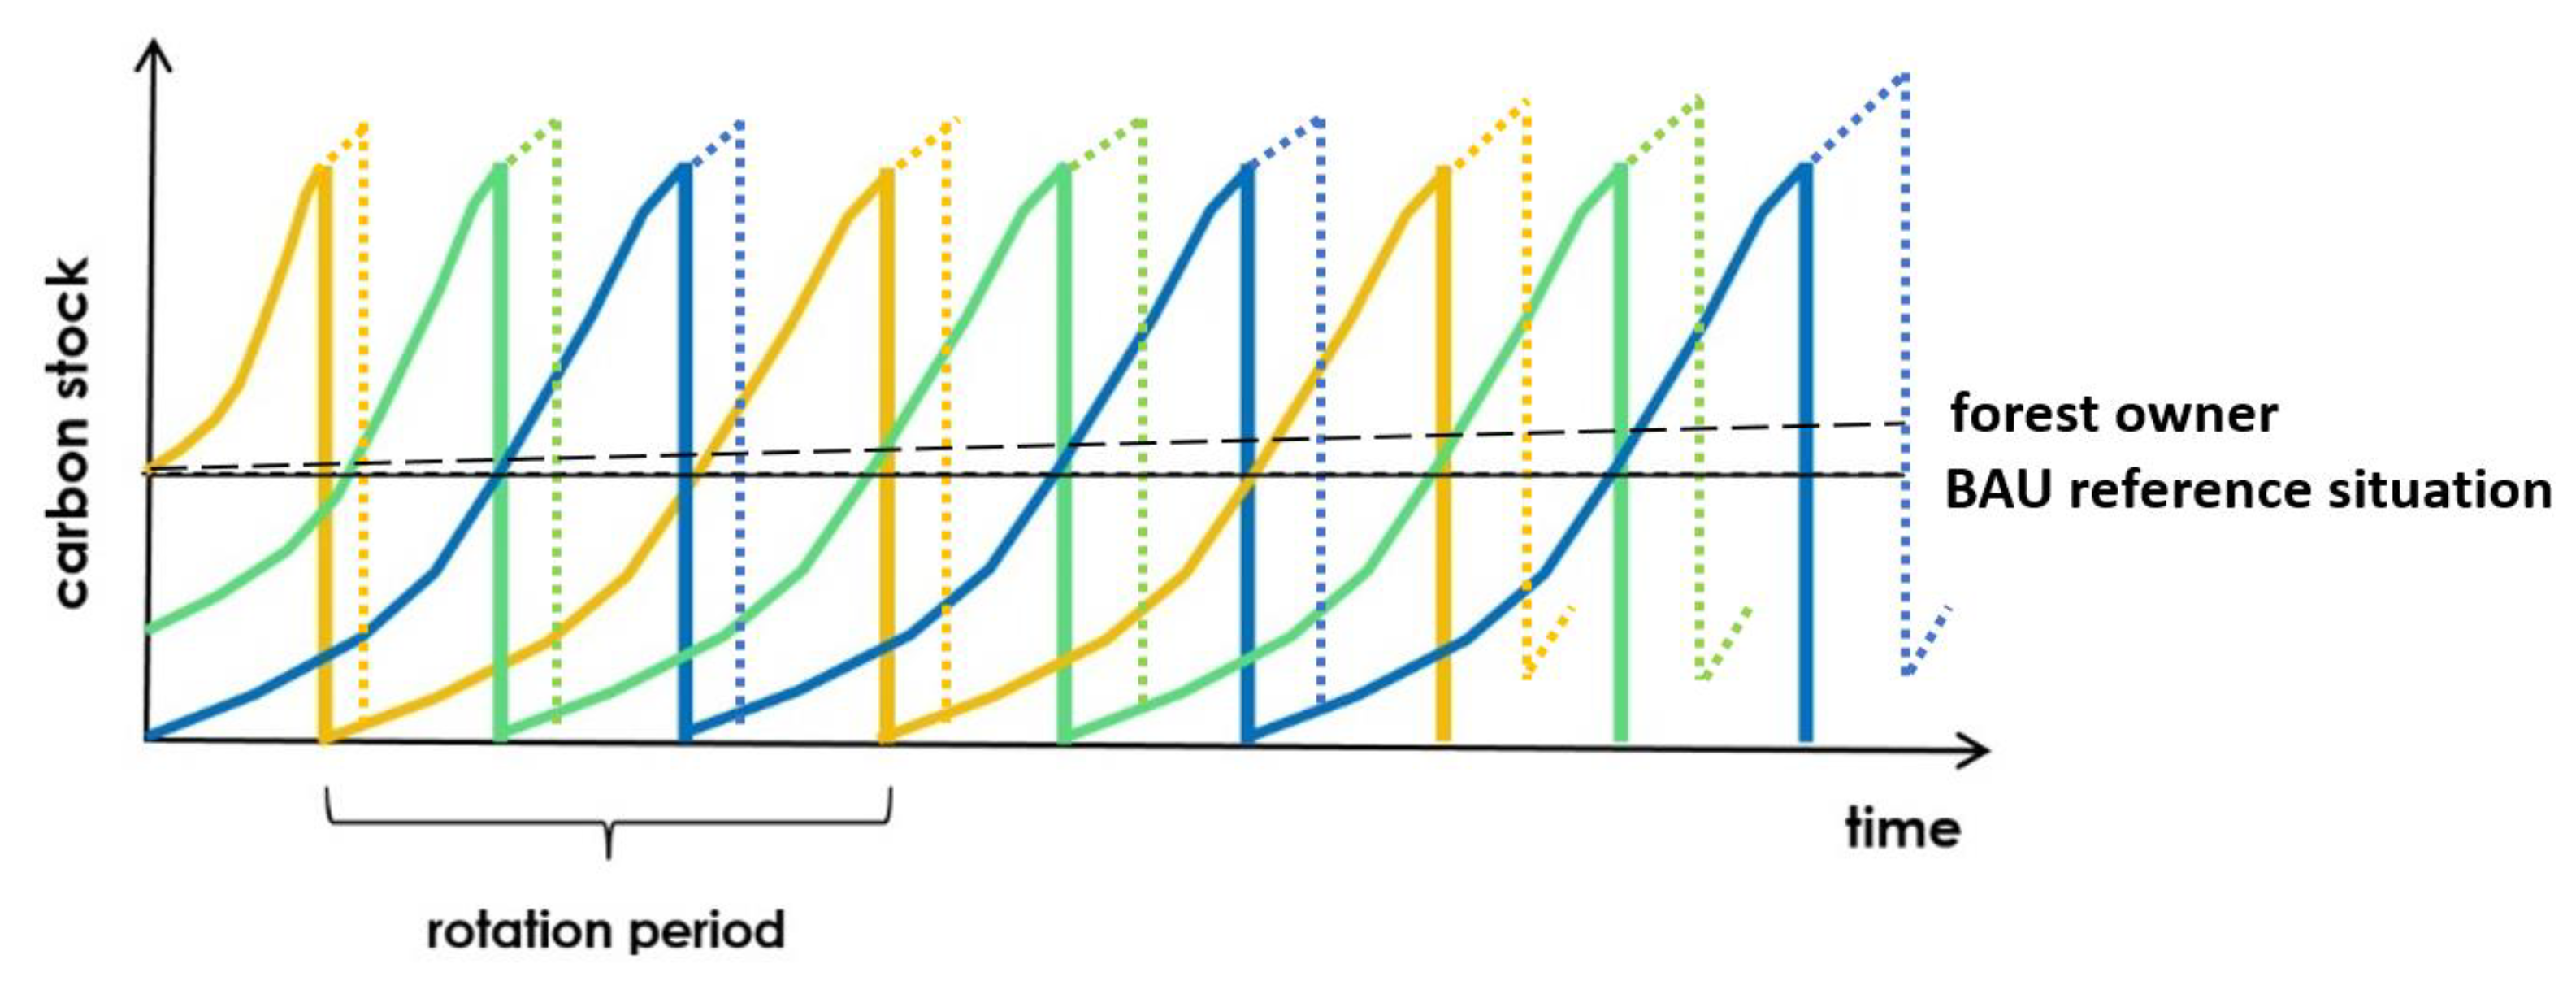
We suggest that positive or negative changes to the biodiversity, relative to the BAU reference situation, caused by the forest owners’ production of woody biomass should be used according to our suggested methodology, which is further described below. Since the ‘BAU baseline’ approach implemented in this paper aligns with the baseline approach that is used to report forest carbon emissions in general in the LULUCF sector under the UN Climate Change Convention (UNFCCC), this approach is named the ‘UNFCCC baseline’.
Figure 2 depicts a conceptual example of this reference situation for a managed forest at the landscape level while accounting for changes in the forest carbon stocks. An alternative to this midpoint indicator approach is also suggested based on a ‘target reference situation’. The target reference situation defines the baseline based on Environmental Quality Objectives (EQOs), which describe the desired quality of the environment to safeguard species habitats and ecosystems, as well as their functions and processes. Such a baseline must be defined by setting a goal-oriented numerical threshold value to address the issue of biodiversity. This is typically based on agreed targets under EQOs and generally requires a set of indicators. This approach is named the ‘EQO baseline’ approach. In our suggested approach, this is referred to as an endpoint reference situation. Both approaches are applicable as impact assessment models for LCAs.
When the reference situation is defined, it is possible to calculate local forest owner-based CFs that are applicable to LCAs for the production of forest wood materials according to a midpoint and endpoint approach as follows:
The biodiversity index, BDi, is calculated as a fraction of the summed areas that fulfil certain biodiversity criteria, i.e., forest stands with old and large trees or dead wood and tree species diversity, evaluated in relation to the total area of productive forests.
The BD
i is calculated as:
where A
i refers to areas under the control of the forest owner fulfilling any of the different criteria
i (ha) and A
tot is the total area of productive forest under the control of the forest owner (ha).
Next, the characterization factor, NCFi, can be calculated using one of the following two approaches (where N = R or E):
- -
The UNFCCC baseline midpoint approach, which is calculated as follows:
where RCF
i is the reference-based biodiversity CF for a range of biodiversity aspects,
i, valid for all the wood materials produced by a given forest owner in a given year and BD
i, county is the proportion of the area of productive forest that complies with the given criteria for biodiversity within the total area of productive forest land in the region where the forest owner is located (0–1). In this case, the regional reference value is estimated at the county level as an example; however, it could also be estimated based on other large-scale geographical criteria. BD
i, owner is the proportion of the area of productive forest that complies with given criteria for biodiversity within the total area of productive forest land under the control of the forest owner.
- -
The EQO baseline endpoint approach, which is calculated as follows:
where ECF
i is the EQO-based biodiversity CF for a range of biodiversity aspects,
i, valid for all the wood materials produced by a given landowner in a given year; BD
i, EQO is the proportion of the area of productive forest that complies with the given criteria for biodiversity within the total area of productive forest land stated in the EQO (0–1); and BD
i, owner is the proportion of the area of productive forest that complies with the given criteria for biodiversity within the total area of productive forest land under the control of the forest owner. For each biodiversity aspect that is assessed, it is necessary for an EQO level to be defined; these must then be summed in order to compare with the corresponding summed areas of the forest owner.
Independent of the approach used, each criterion concerning biodiversity and the defined EQO levels is to be regarded as equal with respect to maintaining the overall forestry quality. Thus, it is possible to generate an aggregated CF when the default approach is to regard all indicator criteria as equal. The aggregated CF will then constitute a normalization of all EQOs and their indicators when the model is implemented. Furthermore, there is a possibility for double accounting; that is, it is possible for one specific forest stand to comply with several of the different criteria that are used in order to define the stand in a way that can be seen as positive for biodiversity. We suggest that double accounting can be accepted in this case, since these stands will contribute to increased biodiversity based on several different aspects.
In addition, when the impact assessment method is used in LCAs, it is necessary to attribute the indicator result to a mass flow. This allows the life-cycle inventory to calculate the overall contribution to biodiversity attributed to the harvested products from that forest as follows:
where I
BD is the contribution to the biodiversity impact category in the unit ha/m
3 over bark (o.b.); NCF
i could be either RCF
i or ECF
i.; and Prod
owner is the productivity of the harvested products from the owner’s properties given in m
3 o.b./ha.
2.2. Adding Data to the Impact Assessment Model
We illustrate our UNFCCC baseline midpoint approach in combination with the four biodiversity indicators. We only exemplify our UNFCCC baseline midpoint approach and not the EQO baseline approach, since we are not aware of any quantitative EQOs for the lowest level of forest areas that fulfil the positive criteria suggested here, to ensure that biodiversity is maintained or further developed. We use the four biodiversity indicators listed above that are used in the Swedish
Environmental Quality Objective ‘Living Forest’ as established indicators to assess the status of Swedish forests in terms of their structure in order to promote the positive development of biodiversity [
38].
When the UNFCCC Baseline LCIA model is applied (see Equation (2) above), the forest area that fulfils any of the four biodiversity criteria is aggregated and is thus included in the calculations of BDi and expressed as the proportion, 0–1, of the total area of productive forest under the management of the forest owner. When the proportion of the forest area of the forest owner is identical with that of the county, then RCFi will be 0. When the reference situation for a biodiversity aspect of the forest owner is lower than that of the county in general then RCFi becomes negative, and vice versa. Hence, positive values for RCFi represent conditions for the forest owner that are less favorable for biodiversity as compared to the reference situation.
3. Results
Two case studies are described as examples in order to illustrate the suggested methodology. The first example is based in the county of Kronoberg in southern Sweden (the boreonemoral zone), where wood is produced by two different forest owners and all the wood is then transported and used by just one industry in the county. The second is a corresponding example located in the county of Västernorrland in northern Sweden (boreal zone). The geographical locations of the case study areas are shown in
Figure 3. For simplicity, all forest owners are assumed to have 500 ha of productive forests. According to the reference situations, BD
i, county, we use the indicator values calculated for each county in its entirety.
The assessments are based on all forest stands within the total area of productive forest under the management control of the forest owner. The status of the different forest stands is assessed based on the four different forest structure quality criteria for promoting biodiversity, which are described above. The areas of all forest stands that comply with any of these four criteria are summed and related as a fraction to the total area of productive forest under the control of the forest owner. Double accounting of stands that comply with any of the four criteria is accepted, as discussed above. The statistics that are applied for the two counties probably include some double accounting, but the extent is not known. Statistical information for the two counties was collected from the official forestry statistics for Sweden [
39] and were valid for the 5-year period 2015–2019. It was assumed that the forests of the individual forest owners have the same overall properties as the forests in that county as a whole in terms of growth rates.
Statistical information on the different forest land areas that comply with the four biodiversity criteria was collected from the website of the Swedish Forest Agency. This information is presented for two different areas, southern and northern Sweden, and hence had to be scaled to the county level based on the areas of productive forest. For the different forest owners, arbitrary values for the areas complying with the four biodiversity criteria were selected as examples. However, the two forest owners within each county are assumed to have different fractions of forest areas that comply with the four criteria in relation to the total area of productive forest. Furthermore, the annual productivity (m3 o.b. annual harvest/total area productive forest) is assumed to be somewhat lower for the forest owner with the largest fraction of forest area complying with the criteria.
The statistical information and the results from the calculations are shown in
Table 1. Forest owner 1 in Kronoberg has 500 ha of productive forest and produces 2821 m
3 o.b. annually with a reference-based biodiversity characterization factor, RCF
i, of 0.29, while Forest owner 2 in Kronoberg also has 500 ha of forest and produces 2308 m
3 o.b. with an RCF
i of −0.41. Together, the forest owners in Kronoberg have 1000 ha of productive forest and deliver 5128 m
3 o.b. to the industry with a mean RCF
i of −0.06 when corrected for the different deliveries from the different owners. The corresponding values for the county of Västernorrland, with the same area of productive forest, are: for forest owner 1, a production of 2333 m
3 o.b. with an RCF
i of 0.71; and for forest owner 2, a production of 1909 m
3 o.b. with an RCF
i of −0.23. Together, the forest owners in Västernorrland, again based on 1000 ha of productive forest, deliver 4242 m
3 o.b. to the industry with a weighted mean RBD
i of 0.24. The contribution to the biodiversity impact category, I
BD, is −5.0 × 10
−3 ha/m
3 o.b. for the wood delivered to the forest industry in Kronoberg and 67 × 10
−3 ha/m
3 o.b. for the wood delivered to the forest industry in Västernorrland. Hence, the joint performance of the forest owners in Kronoberg is more positive (i.e., has a more negative value for I
BD), from a biodiversity point of view, than the performance of the forest owners in Västernorrland. The implications of these results are described in the discussion section.
4. Discussion
A major focus of this study was to develop methods for assessing the LCAs of the production of forest wood materials with regards to impacts on biodiversity that would influence individual forest owners to change their forest management practices to be more compatible with current conservation strategies and policies as far as possible in a manner that can account for long-term human occupancy [
19]. This required a dynamic method of calculating CFs. As suggested in this study, CFs have to be, as far as possible, adapted to the forest owner’s current management practice. Of course, this has to be implemented in a practical way based on assessments of the forest owner’s management practice at regular intervals, such as for example every fifth year. Such regular revisions of the forest owner’s management practices are applied for certification purposes, for example, by FSC and PEFC.
The consequences of different properties of forest management under different forest owners is illustrated in
Table 1. Forest owners with lower motivation regarding managing their forests to comply with the suggested four biodiversity criteria (forest owner 1 in Kronoberg and forest owner 1 in Västernorrland) had lower estimated values in terms of the biodiversity index, BD
i, and consequently had less favorable values for the characterization factors (RCF
i, note that positive values represent more negative impacts on biodiversity, i.e., are less favorable) compared to the more motivated forest owners (forest owner 2 in Kronoberg and forest owner 2 in Västernorrland). Due to the differences between the counties regarding the historic forest management as well as differences in the climate (e.g., slower forest growth rates and hence longer rotation periods in the more northern county Västernorrland), the mean BD
i was higher in Västernorrland compared to Kronoberg. Hence, even though the BD
is for the forest owners were higher in Västernorrland compared to Kronoberg, the forest owners in Västernorrland had higher values for RCF
i (i.e., less favourable values). The weighted mean values for the RCF
i were −0.03 for Kronoberg and 0.28 for Västernorrland. This reflects the consequences of using the situation in the county as the reference situation. Hence, the forest owners cannot rely on the mean given conditions in the county to obtain a favorable value for the characterization of biodiversity impact. The generally lower productivity for the forests in Västernorrland resulted in even larger relative differences in the impact factor for biodiversity, I
BD, with values of −5.0 ha/m
3 o.b for Kronoberg and 66.8 ha/m
3 o.b for Västernorrland (again, note that a positive value represents a more negative impact on biodiversity). This example represents differences between two forest owners in the respective county, but it might as well represent differences between two points in time for the same forest owner.
In a previous Swedish study [
37], two case studies were performed in managed forests in the nemoral vegetation zone in southern Sweden. The analysis was intended to represent managed forests in the temperate broadleaf and mixed forests biome in southernmost Sweden, which might then be regarded as the system boundaries of this study. In a Finnish study [
24], two case studies examined two different regions in the boreal coniferous forest zone, separated into southern and northern Finland. In the Swedish study, the CFs were not related to the land area occupied in order to produce a certain amount of wood. In the Finnish study, the CFs were related to the production of wood material based on the harvest rates per area of productive forests.
The basic approach in both the Swedish and Finnish studies was the UN Environment Life Cycle Initiative assessment model for biodiversity in combination with two different biodiversity assessment approaches that were used to quantify CFs. The UN Environment Life Cycle Initiative approaches evaluated in these two Nordic case studies included both the ‘species richness’ method suggested by [
10] and the ‘ecosystem indicator’ method suggested by [
40]. These two approaches resulted in CFs that were multiplied with the quantified environmental load (e.g., the amount of land used to produce a certain amount of wood) in order to assess the contribution from that load to the type of environmental impact in question (e.g., the impact on biodiversity). Both these studies resulted in CFs that are applicable for general forest management in large geographical regions and do not take into account forest management practices that are applied by individual forest owners.
Furthermore, as illustrated in the Swedish and Finnish studies described above, it is very difficult to find comprehensive and representative information about species diversity in forests. In the Swedish study, information about the presence or absence of vascular plant species in selected plots from the Swedish National Forest Inventory (NFI) was used. Obviously the variation was very large, and it is debatable to what extent this information represents the species diversity across all organism taxa. In the Finnish study, on the other hand, information from different assessments of endangered species was used on a large geographical scale. It was assumed that there would be no endangered forest species in the reference situation and that all currently endangered species could be assumed to be the result of current forest management. These assumptions are questionable.
Overall, the species richness method would be difficult to apply comprehensively in LCIAs for managed forests in the Nordic countries since it would be very costly to conduct specific species diversity inventories for LCIA purposes due to time-consuming inventory work, especially for individual forest owners. Others have also reported that species richness only considers one component of biodiversity and that the species richness in one multiple-species group seldom relates to the richness in other groups [
41,
42].
The ecosystem indicator approach is based on relations between different forest structures and on the potential for these Nordic forests to host a high level of forest species diversity. However, the exact relations are less well known and are subject to ongoing research activities [
43,
44]. Consequently, there may be different opinions on these issues among expert scientists active in the area. Hence, relying on the opinions of an individual or of a few scientists should be avoided. Instead, the focus should probably be on indicators that reflect forest stand structures, as suggested in this study, that are established and have been discussed for a long time and on which there is some degree of consensus.
The suggested method used in this study for the specification of business-as-usual (BAU) or environmental quality objectives (EQO) baselines encourages forest owners to choose forest management options that increase the proportion of productive forest land with properties that are more favorable for biodiversity over time. If a historical reference situation for impact assessment is used (i.e., the situation as it would be in the absence of current forestry measures and without human intervention in the past), it would generate a result that does not take the current situation into account, and thereby continuously attribute forgone impacts to all future harvested products. If the baseline instead follows the same approach as that used for international climate reporting, the historical forgone impact will be treated as the consequences of a land use change (LUC), and the baseline will change to a managed forest after taking this impact into account and attributing it to the harvest products. In international climate reporting, the baseline approach is dynamic; any change in carbon stocks and its impact will be accounted for once, while simultaneously generating a new baseline state. Such a baseline approach will remove the double accounting in a historical reference baseline, which appears when the historical baseline or a potential future state as defined by a re-naturalization baseline is used [
31]. The BAU baseline and the target reference situation are the baseline approaches for an attributional LCA that avoids double accounting problems.
The conceptual approach that is suggested in this study is a hybrid solution in which (1) the indicators of biodiversity are the same for all the wood biomass produced within the entire land area of productive forest under the control of an individual forest owner; and (2) the CFs are given per area of productive forest land, meaning that the productivity will be accounted for, since the impacts in the inventory will be allocated to all the biomass produced in that area. In other words, the entire land of productive forest under the control of the forest owner is regarded as a single homogeneous production unit. Our approach follows the traditional LCA impact assessment methods, including the biodiversity model framework suggested by the UN Environment Life Cycle Initiative [
36]; however, it requires the forest owner to compensate for inadequate silvicultural practices on parts of the land and to take on the overall responsibility of the whole property. When the impact is aggregated across different forest owners, it should be noted that an overall impact will reflect the biodiversity impact on the entire area and will reflect the entire standing forest landscape rather than the individual stand. This approach is therefore equivalent to a dynamic approach for the assessment of climate impact from forestry, which suggests that the entire forest’s carbon stock should be assessed at the landscape level [
20]. Since the aim here is to establish an impact assessment method and CFs that can be used at the landscape level for individual forest owners, available biodiversity indicators must reflect the spatial scale at the forest owner level.
Even if structural biodiversity indicators are used as in this study, the current statistical information is still incomplete due to limited data availability. Nevertheless, the technical development and digital transformation of forestry operations and forest inventories is becoming evident, including access to remote-sensing techniques and applications such as airborne laser scanning (LiDAR) and other forest monitoring activities [
45,
46]. Therefore, it is likely that combing high-resolution remotely sensed and in situ data with existing structural indicators will be a powerful tool to aid in the development of forest biodiversity monitoring and impact assessment for forestry systems and products.
5. Conclusions and Future Research
In this study, we proposed and discussed a conceptual approach that assesses biodiversity impacts at the forest landscape level, with a focus on management options for individual forest owners. The proposed method can be expected to encourage individual forest owners to choose forest management options that increase the fraction of productive forest land with properties that are favorable for biodiversity over time. Our approach illustrates positive or negative changes in biodiversity by taking as a starting point a BAU baseline similar to international climate reporting guidelines.
We defined a site-specific reference situation to account for changes in biodiversity on a landscape level, including individual forest owners, and took into account the surrounding land use. We tested our BAU baseline approach with two examples at the county level in Sweden in order to calculate the biodiversity impact of wood production by individual forest owners using already-established nationally agreed-upon biodiversity indicators used within the Swedish national EQO—‘Living Forests’. Making use of available indicators is straightforward and cost-effective, as no field inventories are needed to assess the biodiversity impact of forest management. The proposed approach to assessing biodiversity impacts can be applied not only to LCAs but also to provide input values to assess sustainability aspects across entire forest value chains at different spatial and temporal levels. Compared to other LCA-based approaches, this assessment methodology reflects different management practices carried out by different forest owners. The approach defined in this study is at this stage only applicable to forestry assessments. This approach could, however, be adapted to other countries and landscapes by considering similar indictors from official forestry statistics reflecting specific forestry management practices relevant to those landscapes. The EQO baseline approach requires established threshold values for each indicator assessed. At present, we are not aware of any quantitative environmental targets for the lowest level of forest area. For this reason, this approach is not exemplified with data in this study and is left as a subject for future research.
As digitalization transforms the forestry industry, we foresee the use of high-resolution remote-sensing techniques such as airborne laser scanning and LiDAR as powerful tools to develop impact assessment models and further associated biodiversity indicators.


