Article

The Use of a Non-Invasive Electrical Method to Assess the Chemical Composition, Hardness, and Color of Durum Wheat Grain Cultivated in an Integrated System

by
Joanna Katarzyna Banach
1,*,
Katarzyna Majewska
2,
Małgorzata Grzywińska-Rąpca
3 and
Krystyna Żuk-Gołaszewska
4
1
Institute of Management and Quality Sciences, Faculty of Economics, University of Warmia and Mazury in Olsztyn, 10-720 Olsztyn, Poland
2
Department of Food Plant Chemistry and Processing, Faculty of Food Science, University of Warmia and Mazury in Olsztyn, 10-726 Olsztyn, Poland
3
Department of Market and Consumption, Institute of Economics and Finance, Faculty of Economics, University of Warmia and Mazury in Olsztyn, 10-720 Olsztyn, Poland
4
Department of Agrotechnology and Agribusiness, Faculty of Agriculture and Forestry, University of Warmia and Mazury in Olsztyn, 10-719 Olsztyn, Poland
*
Author to whom correspondence should be addressed.
Sustainability 2022, 14(7), 3834; https://doi.org/10.3390/su14073834
Submission received: 12 January 2022 / Revised: 18 March 2022 / Accepted: 22 March 2022 / Published: 24 March 2022

Abstract

:
Electrical properties are the least known and described among the physical properties of food products. The most widespread practical directions of their use include moisture measurements as well as dielectric and microwave heating. Less frequently, they are used to assess the physicochemical parameters of food products, including the technological features of cereal grains. Earlier research by the authors of this paper demonstrated the possibility of using an RCC substitute model of food products (conductivity and capacitance parameters) to identify the grain variety, geometric features, level of grain damage as well as grain moisture content. This model can also be used to distinguish cereal species as well as to assess the proximate chemical composition of their grain. The promising results obtained in this area encouraged us to expand the research with a material important from the food market perspective—durum wheat, obtained in the conditions of sustainable cultivation in north-eastern Europe (temperate climate). The study material was obtained from a proprietary sustainable production technology designed in a strict field experiment. The aim of this research was: (1) to assess the effect of an integrated cultivation system of native durum wheat (six variants), differentiated by a nitrogen fertilization dose (0, 80, 120 kg·ha−1) and with and without growth regulator (GR, WGR) on changes in selected quality parameters (protein, lipid, and starch contents; hardness; color) and electrical parameters (Z, Cp, Cs) of the grain; and (2) to determine the correlations between the examined quality traits and electrical properties of the grain to indicate the possibility of using a non-invasive electrical method to assess grain quality. The highest contents of starch and total lipids and the highest grain hardness were obtained in the cultivation variants GR + 0N and WGR + 0N, whereas the highest protein content—upon wheat fertilization with 120N. The study demonstrated a different strength of the correlations between the tested parameters depending on the cultivation method. In the WGR + 0N variant (environmentally friendly), the strongest correlation between grain quality traits and electrical properties was obtained for both the conductive (Z) and capacitive (Cp, Cs) parameters in the entire analyzed range of current frequencies. The cultivation of durum wheat in the integrated system, especially in the WGR variant, facilitates grain quality modeling and enables using a non-invasive electrical method for a rapid assessment of the quality traits of the grain while raising no concerns over natural environment safety. The growth regulator (GR) application during native durum wheat cultivation hampers the use of the analyzed electrical method to assess its grain quality.

1. Introduction

Durum wheat (Triticum durum Desf.) occupies about 8% of the global acreage intended for wheat cultivation, and its production accounts for approximately 5% of the global wheat harvest [1]. It is cultivated in a dry and hot climate, where its grain yield is diminished by water shortage. Spring durum wheat is mainly grown worldwide, as it is the oldest form of this cereal. Winter forms that had been developed from the spring forms are cultivated in south-eastern Europe. After 1960, durum wheat cultivation shifted from the Mediterranean region to the north of Europe. This was due to significant breeding progress and registration of varieties in such countries as Austria, Germany, Hungary, the Czech Republic, and Poland [2,3,4].
Due to its exceptional technological properties (hard endosperm and high contents of gluten protein and carotenoids) and nutritional value, durum wheat grain is used to make top-quality pasta [1,5,6].
Durum wheat species may gain in importance in Poland due to the ongoing climate changes coupled with breeding progress in its cultivation and growing interest expressed by the food industry [7]. The cultivation of this demanding wheat species and its grain yield are largely affected by weather conditions [8]. Despite these impediments, breeding and agro-engineering works are undertaken regarding different varieties of durum wheat to produce the most optimal ones for north-eastern Europe [7,8]. So far, a few winter and spring durum wheat varieties have been introduced into the Polish National List of Agricultural Plant Varieties, these being: Komnata, Ceres, SM Metis, SM Eris, SM Tetyda as well as SMH 87, respectively [9,10,11]. An additional course of action is the production of plants in an integrated system, the aim of which is to draw from the potential of sustainable economic, ecological, and social development. The exploitation of the first two potentials is feasible through the conscious use of innovative technologies and manufacturing techniques, continuous improvement of environmentally friendly management practices, as well as the implementation of biological progress. The production of high-quality cereal grains and grain yield size is expected to be ensured by, among others, agro-engineering factors, including the level of nitrogen fertilization and the use of growth regulators [2].
The development of automation in integrated agricultural production has spurred the interest in the electrical properties of grain and cereal products. In addition to using them in electro-engineering as an alternative to the conventional methods for process monitoring and analysis in storage and processing practice [12,13,14], research is also carried out on the possibility of replacing analytical methods of grain quality assessment with electrical methods. However, the complex morphological structure of kernels, chemical composition (protein, lipids, starch, minerals), water content (in cells, intercellular spaces, and membranes), and the lack of repeatability of dimensions and other physical features require in-depth research in this area. Our previous research addressing the use of an RCC substitute model of food products showed that the electrical parameters, i.e., impedance and admittance, can be used to identify the variety, geometric features, and grain moisture content [15]; and to determine the extent of barley grain damage [16]. In the course of further research, we have found that the conductivity properties can also be used to distinguish cereal species and varieties as well as to assess the proximate chemical composition of their grain. Significant correlations found between impedance and admittance parameters of cereal grains (common wheat, barley, rye, triticale, oat) and their chemical composition (contents of lipids and starch in particular) point to the feasibility of applying conductivity properties for discriminating cereal species and cultivars of the same cereal species, in a frequency range from 100 kHz to 2 MHz [17]. Promising results concerning the use of electrical features of grain/seed products for their quality assessment were also achieved in the case of soybean [18], maize [19], and wheat flours [20]. A novelty in these studies is the determination of the possibility of using a non-invasive electrical method to assess the quality of native durum wheat grain obtained from sustainable cultivation in a temperate climate.
Summing up, it needs to be stated that a global trend can be observed regarding the increasing consumption of products made of durum wheat grain, and also that the use of integrated agricultural practices of cereal grain cultivation is conducive to modeling the quality of their production, and finally that the need to develop a quick method for assessing the quality characteristics of grain using environmentally friendly electrical methods is a current challenge for scientists. Therefore, a research hypothesis was formulated assuming that the non-invasive electrical method can be used to assess selected parameters of the quality of durum wheat grain from integrated cultivation and that the applied agrotechnical factors do not hinder the use of electrical parameters–conductivity and capacitance, in this assessment.
Relating to the above, research was undertaken with the aim to:
  • Evaluate the effect of an integrated cultivation system, differing in a nitrogen fertilizer dose and growth regulator use (with/without, GR/WGR) on changes in the selected quality traits (protein, lipid, and starch contents; hardness; color) and electrical properties (conductive and capacitive) of the grain of native durum wheat;
  • Determine correlations between the analyzed quality traits and electrical properties of durum wheat grain to identify the feasibility of employing a non-invasive electrical method for grain quality assessment.

2. Materials and Methods

2.1. Cultivation of Durum Wheat in an Integrated System

The experimental material was hard (durum) spring wheat var. SMH 87 derived from a field experiment established in north-eastern Poland (53°40′ N, 19°50′ E)—harvest 2016. Durum wheat cultivation in an integrated system (6 variants) was differentiated by a nitrogen fertilization rate and use of a growth regulator Medax 350 S.C. (with/without growth regulator; GR/WGR) in BBCH 37–39 expected to prevent lodging (preventive action). Nitrogen was applied in three doses: no fertilization (0N), 80 kg·ha−1 (80N), and 120 kg·ha−1 (120N). A detailed description of the fertilization scheme was provided in our previous research [2,21]. After harvest, grain was cleaned of physical impurities and seed coat residues. Ca. 500 g of the grain were collected to glass bottles from each cultivation variant, and the bottles were stored in the climatic chamber (Memmert, Schwabach, Germany) at air temperature of 20 ± 0.1 °C. The grain intended for research had a standardized moisture content of 14 ± 0.5% [22]. The range and values of such quality features such as: 1000 kernel weight (51–54 g); protein content (15.8%); hardness (188 BU), and content of pigments (5.7 ppm) proved the high technological quality of the grain (durum wheat var. SMH 87 was cultivated in 3-year field experiment: 2015–2017) [21]. This allowed us to use grain samples from one cultivation year (2016) to achieve the assumed aims of the work.

2.2. Determination of the Selected Chemical Components of the Grain

The grain comminuted with a WZ-1 laboratory grinder (Sadkiewicz Instruments, Poland). The particle size of the crushed grain was 250 µm. The ground grain was determined for the contents of: total protein—with Kjeldahl’s method [23], total lipids—with the Soxhlet method, and total starch—with the polarimetric method acc. to the methodology described by Krełowska-Kułas [24]. Determinations were performed in 6 replications for each component, and the results were expressed per % of dry matter (d.m.).

2.3. Hardness Measurements

Hardness of single kernels placed furrow-down on a table was measured using a Universal Testing Device (Instron 5942; Instron Corp., Norwood, MA, USA). A uniaxial compression test (flat-truncated cone, Ø = 12.6 mm; speed of the working head, 10 mm/min) was performed to measure the maximum compression force (Fmax) needed to reach 50% grain deformation in 16 replications for each of the 6 grain samples from cultivation variants tested. The results of the tests were analyzed using the computer software Bluehill II.

2.4. Color Measurements

Color measurements of the grain were made using a Hunter Miniscan XE Plus colorimeter (HunterLab, Reston, VA, USA), set to collect spectral data with illuminant A/observer D65/10°. Before the measurements, the colorimeter was calibrated using a black and white ceramic plate. Grain color was determined in the CIELab scale, measuring lightness (L*), redness (a*), and yellowness (b*), in 12 repetitions.

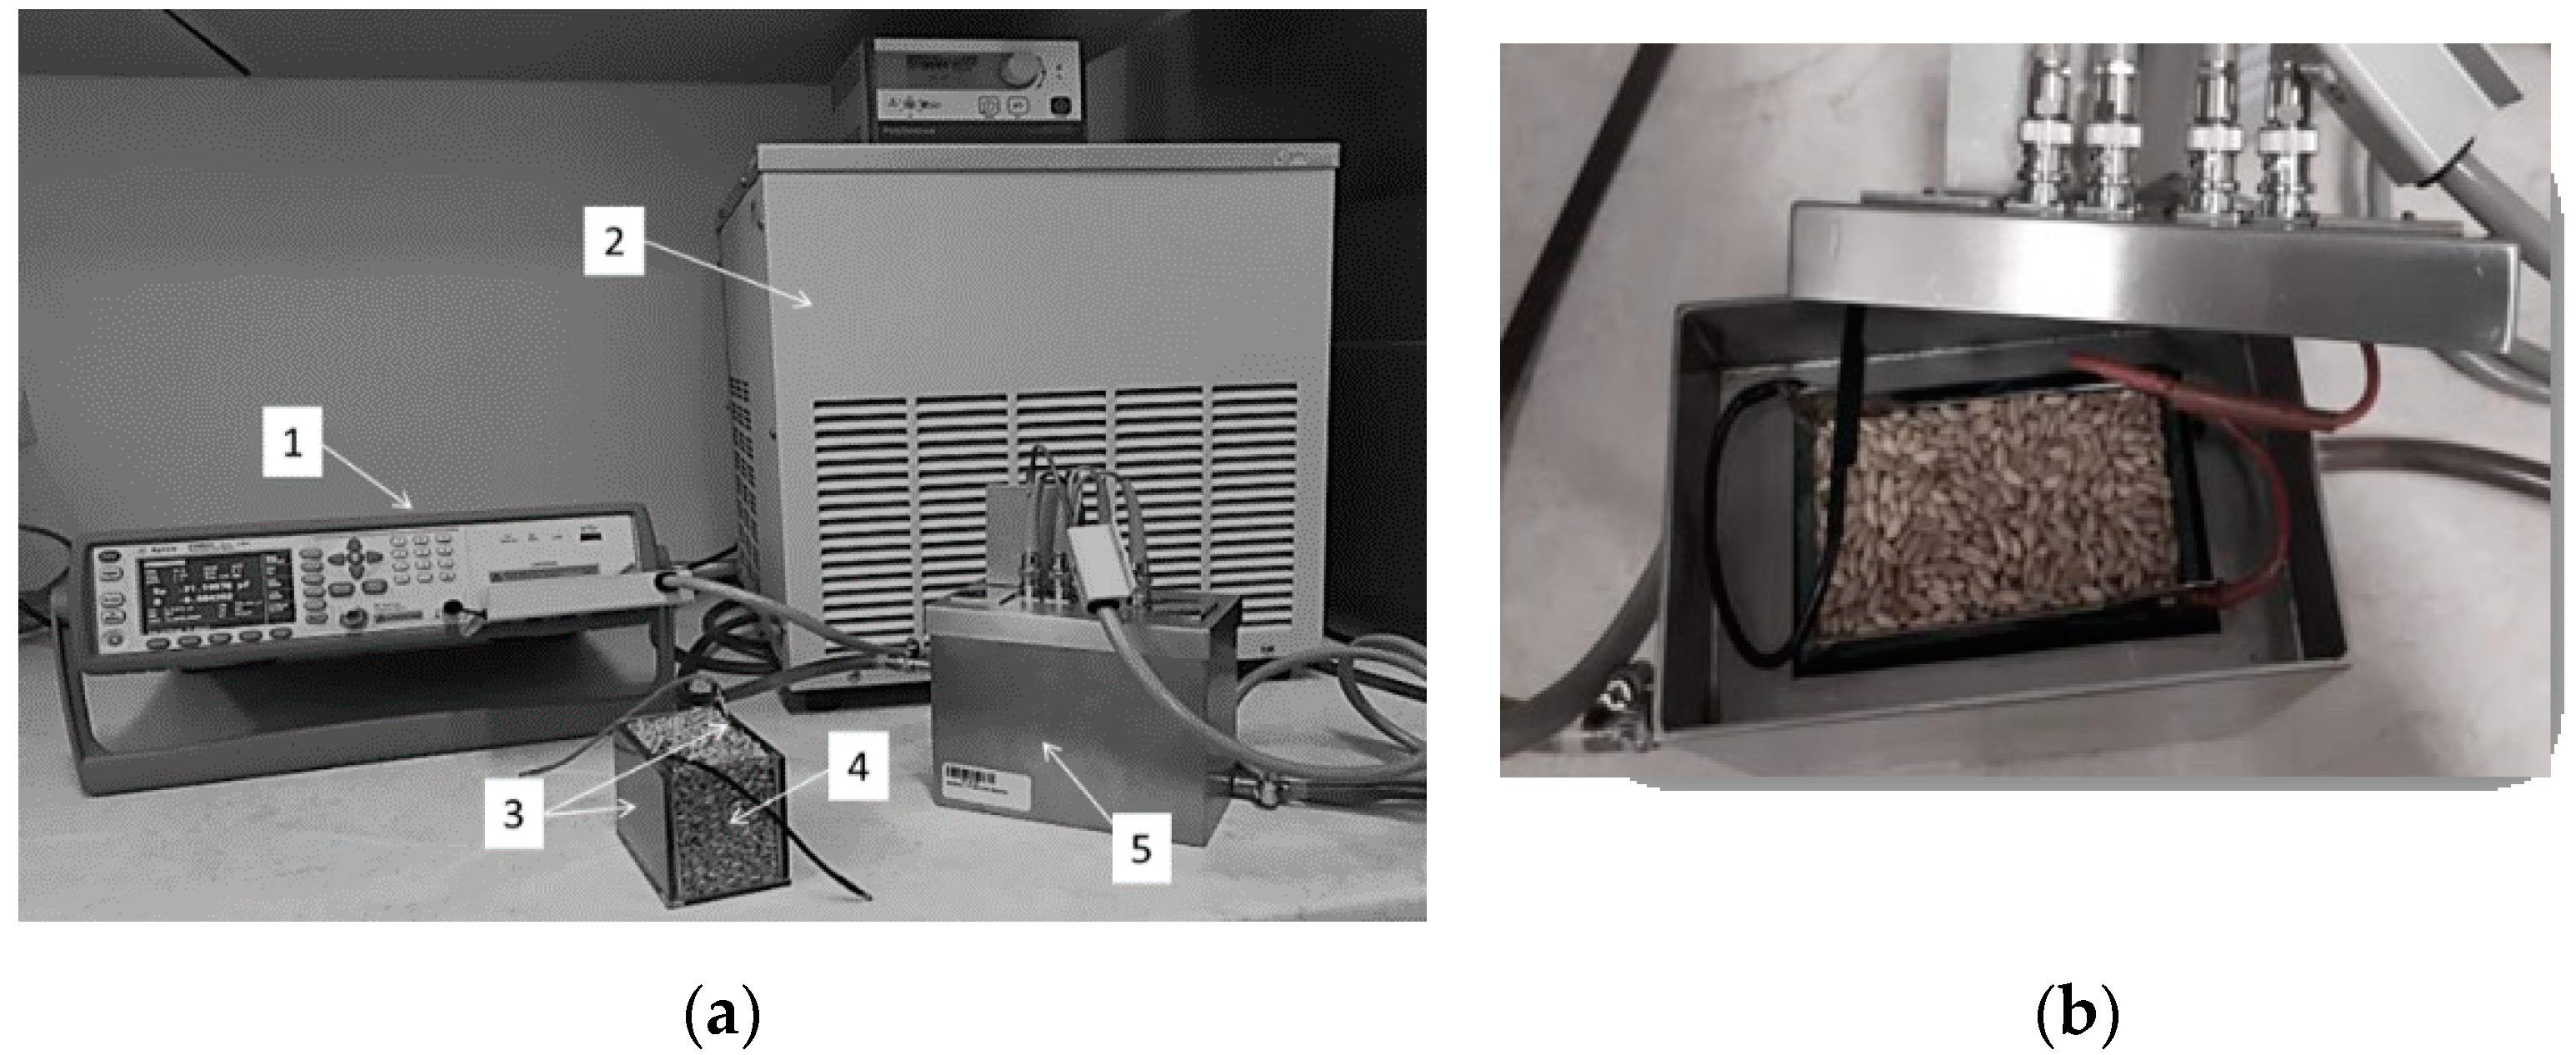
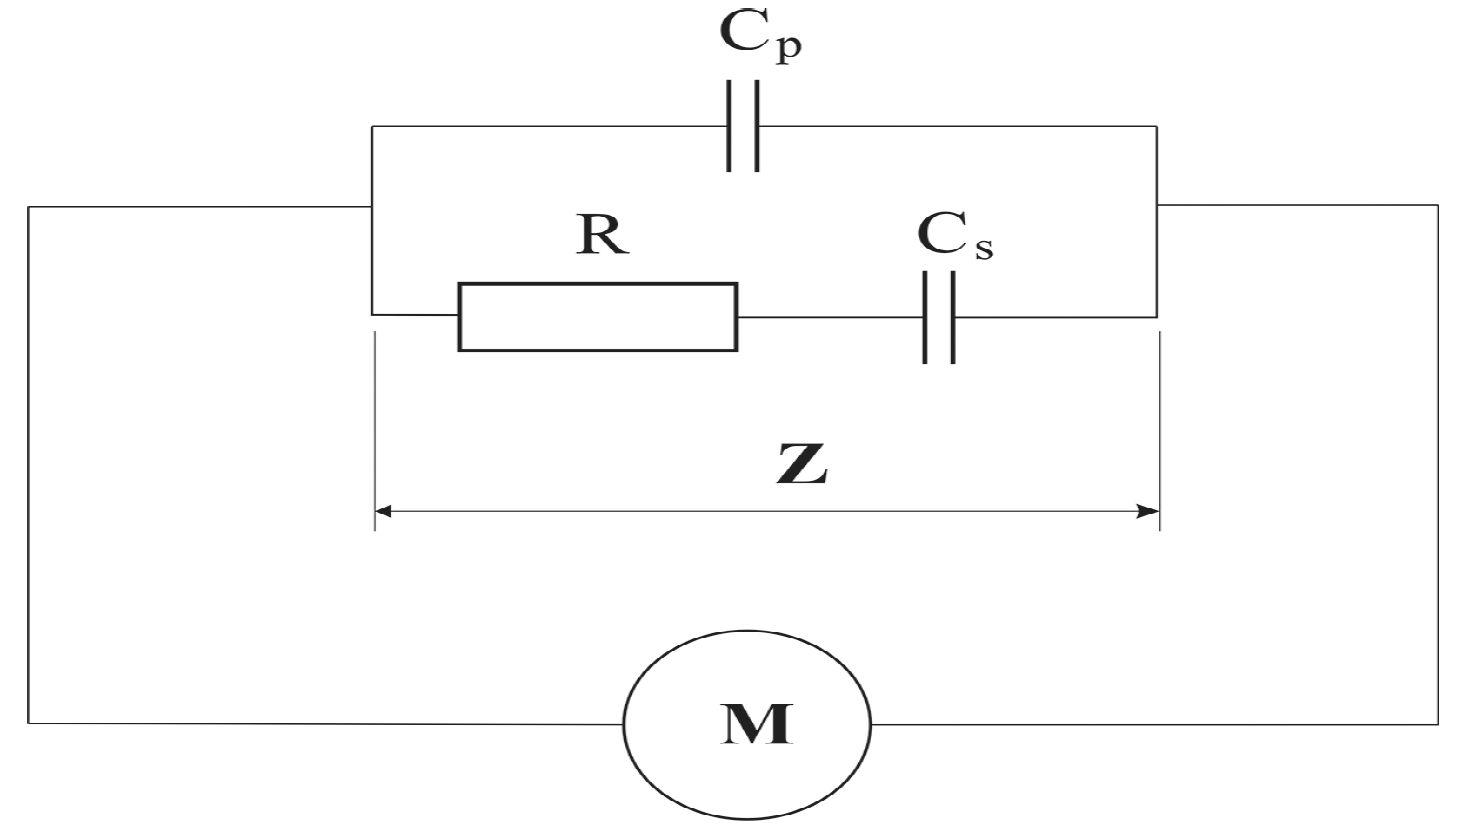
2.5. Electrical Measurements

Electrical measurements were performed using a measuring system composed of the following devices (Figure 1):
  • a measuring sensor—a glass container (internal dimensions: L: 88.80 × D: 49.20 × H: 76.20 mm) with flat electrodes made of acid-proof steel having the surface area of ca. 68 cm2, attached adjacent to two opposite longer container’s walls,
  • a metal container with a water jacket connected to a thermostat (PolyScience, Niles, IL, USA),
  • an LCR meter, type E4980a (Agilent, Santa Clara, CA USA) with a measuring attachment.
Before measurements, the experimental material with a standardized moisture content of 14 ± 0.5% was stored (temp. 20 ± 0.1 °C/24 h) in tightly closed glass bottles in a climatic chamber (Memmert ICP500, Schwabach, Germany). The LCR meter with wires was calibrated. The glass container was filled up with grain (ca. 250 g) and placed in the metal container with a water jacket that was next thermostated to a temperature of 20 ± 0.05 °C (Figure 1a). The wires fixed to the electrodes of the measuring sensor were connected to the wires of meter’s attachment, mounted in the upper section of the thermostated system (Figure 1b), and measurements were performed. The electrical properties of the grain were determined based on the measurements of conductive parameters (impedance—Z) and capacitive parameters (Cp and Cs), performed at frequencies (f) of 1 kHz, 100 kHz, and 1 MHz, and voltage of 200 mV. The measuring frequencies were selected based on the results of our previous investigations [15,16]. The electrical measurements were conducted in 12 replications for each of the 6 grain samples using an RCC substitute model of food products (serial-parallel resistance + capacitance)—Figure 2, which was also employed to determine change in the quality of animal and plant products in our earlier research [2,16,25,26], and results were registered in external memory of the meter.

2.6. Statistical Analysis

The results of measurements were processed statistically using Statistica 13.3 software (StatSoft Inc., Tulsa, OK, USA). Data were analyzed employing procedures which enabled: (1) determining basic statistical measures (mean values ± standard deviation), (2) comparing the values of the analyzed traits of the grain produced using different agro-engineering factors, and (3) determining correlations between the analyzed physicochemical and electrical properties of the grain. The computations were performed at significance levels of p < 0.05, p <0.01, and p < 0.001. Furthermore, the Principal Component Analysis (PCA) was conducted to identify correlations between the quality traits and electrical properties of the grain of durum wheat grown without (WGR) and with the application of a growth regulator (GR) on a two-dimensional plane [27,28].

3. Results and Discussion

3.1. Changes in the Physicochemical Properties (Technological) of the Grain

Starch is the major storage polysaccharide accumulated in wheat grain, composed of two fractions—linear amylose and branched-chain amylopectin. Starch granules are spherocrystalline, and their size is species-dependent (in wheat, it ranges from 10 to 24 μm), whereas their density depends on the hydration degree. They feature double refraction and are coated with a thin lipoprotein layer [29]. The starch of durum wheat grain is strongly bound to proteins of the endosperm, which results in its glassy and compact structure. In turn, a less compact structure with numerous open spaces and a physically discontinuous protein matrix is observed for starchy kernels [6].
The starch content of durum wheat grain from particular variants of integrated cultivation ranged from 60.9 to 65.1% d.m. (Table 1). It was lower from the average values reported by Lafiandra et al. [30] for ripe wheat grain, i.e., 65–75%, but fitted the range expected by Gąsiorowski [29], i.e., 55–70%. Wheat cultivation in the tested variants differentiated the starch content of the grain. The highest starch content was determined in the grain from the variant with the growth regulator and without nitrogen fertilization (GR + 0N). With nitrogen dose increase (N: 80 and 120 kg·ha−1), the starch content of the grain decreased significantly (p < 0.01). In turn, wheat cultivation in variants GR + 80N and GR + 120N resulted in a significant (p < 0.01) increase in the content of this chemical component (Table 1).
Lipids represent a large group of chemical compounds sharing the following common traits: solubility in organic solvents and insolubility in water. They are a quantitatively minor but crucial component of wheat grain. The total lipid content of wheat grain ranges from ca. 0.9 to 3.3%; however, the highest average content (2.8% d.m.) can be found in durum wheat grain. The lipid content is positively correlated with kernel hardness and color. Durum wheat varieties have higher contents of both total lipids and polar lipids (glycolipids and phospholipids) compared to soft wheat [29]. The total lipid content of the grain analyzed in the present study ranged from 2.1 to 2.5% d.m., with the highest content determined in the grain from the variant without nitrogen fertilization and with growth regulator (GR). The total content of lipids was more significantly affected by nitrogen fertilization. The analysis of the effect of growth regulator use (WGR–GR) showed that the cultivation variant had a significant (p < 0.01; p < 0.05) effect on the lipid content of the grain from the variants with nitrogen fertilization at 0 and 80 kg·ha1 (Table 1).
The total protein content of the grain (8–18%) defines the functionality and processing options of different wheat species and types. The main storage proteins of wheat grain, being at the same the key indicators of its technological quality, include gluten proteins originally divided into gliadins and glutenins (prolamines and glutelins). Durum wheat grain has a high total protein content (11.5–18.5% on average) and is characterized by different proportions of individual protein fractions compared to the common wheat grain. The content of the gliadin protein fraction is higher than that of the high-molecular fraction of glutenin proteins. Owing to this, dough made of semolina is more plastic than elastic, which determines the high usability of durum wheat grain in the pasta-making industry [29,31,32].
The total protein content of the analyzed grain ranged from ca. 11.5 to 15.8% d.m. It was most beneficially influenced by the cultivation variant GR+120N and the least beneficially by the GR+0N variant (Table 1). Furthermore, Obuchowski et al. [33] reported a beneficial effect of nitrogen fertilization (at 100–150 kg·ha−1) on the total protein content of the grain of four durum wheat varieties grown under Polish climate conditions. The contemporary durum wheat varieties require higher rates of nitrogen fertilization (up to 100–120 kg·ha−1) than the old varieties to reach their maximum grain yield. Certain cultivars need even higher fertilization doses to increase their grain protein percentages; however, these agricultural strategies are economically ineffective [34,35].
The hardness of wheat grain is the most important indicator of its structural and mechanical properties, including especially endosperm features [6]. This property defines the potential grain behavior during milling and affects such technological traits as: the extraction rate, fraction size, and water absorption of pasta flour/semolina, starch damage degree, and starch susceptibility to enzymatic processes. One of the measures of wheat kernel hardness is their resistance to compression to the assumed deformation.
Grain hardness, expressed as the maximum compression force (Fmax) required for its 50% deformation, ranged from 120.5 to 134.4N (Table 1). The analyzed durum wheat grain was harder than the grain of common wheat (68.0–109.5 N) and spelled grain (37.4–98.8 N) tested by Żuk-Gołaszewska et al. [36]. These differences point to the better cohesiveness of starch granules with protein and a lower number of free air compartments, which ultimately indicates potentially higher resistance of the analyzed durum wheat grain during milling [5,6]. Significant and beneficial changes in hardness values were noted in the cultivation variant GR + 120N (Table 1).
Grain color is another important technological trait of wheat. The yellow-amber color of semolina is caused by the carotenoid yellow pigment content in the entire grain. The high content of carotenoid pigments is especially valued in the case of durum wheat intended for top-quality semolina production as it determines pasta color. It is positively correlated with color parameter b* (yellowness) in the CIE system [1,36]. Grain color, expressed by color parameters L* (52.1–53.9), a* (8.7–8.9), and b* (27.4–28.4), did not change significantly across the wheat cultivation variants (Table 1). Similar results were obtained by Obuchowski et al. [34], who analyzed the effect of durum wheat fertilization with nitrogen on changes in color parameters (L*, a*, b*) of pasta flour produced from its grain. Low variation (less than 10%) of color parameters of common wheat and spelled grain, cultivated in an organic farming system for 3 years, was also reported by Żuk-Gołaszewska et al. [36].

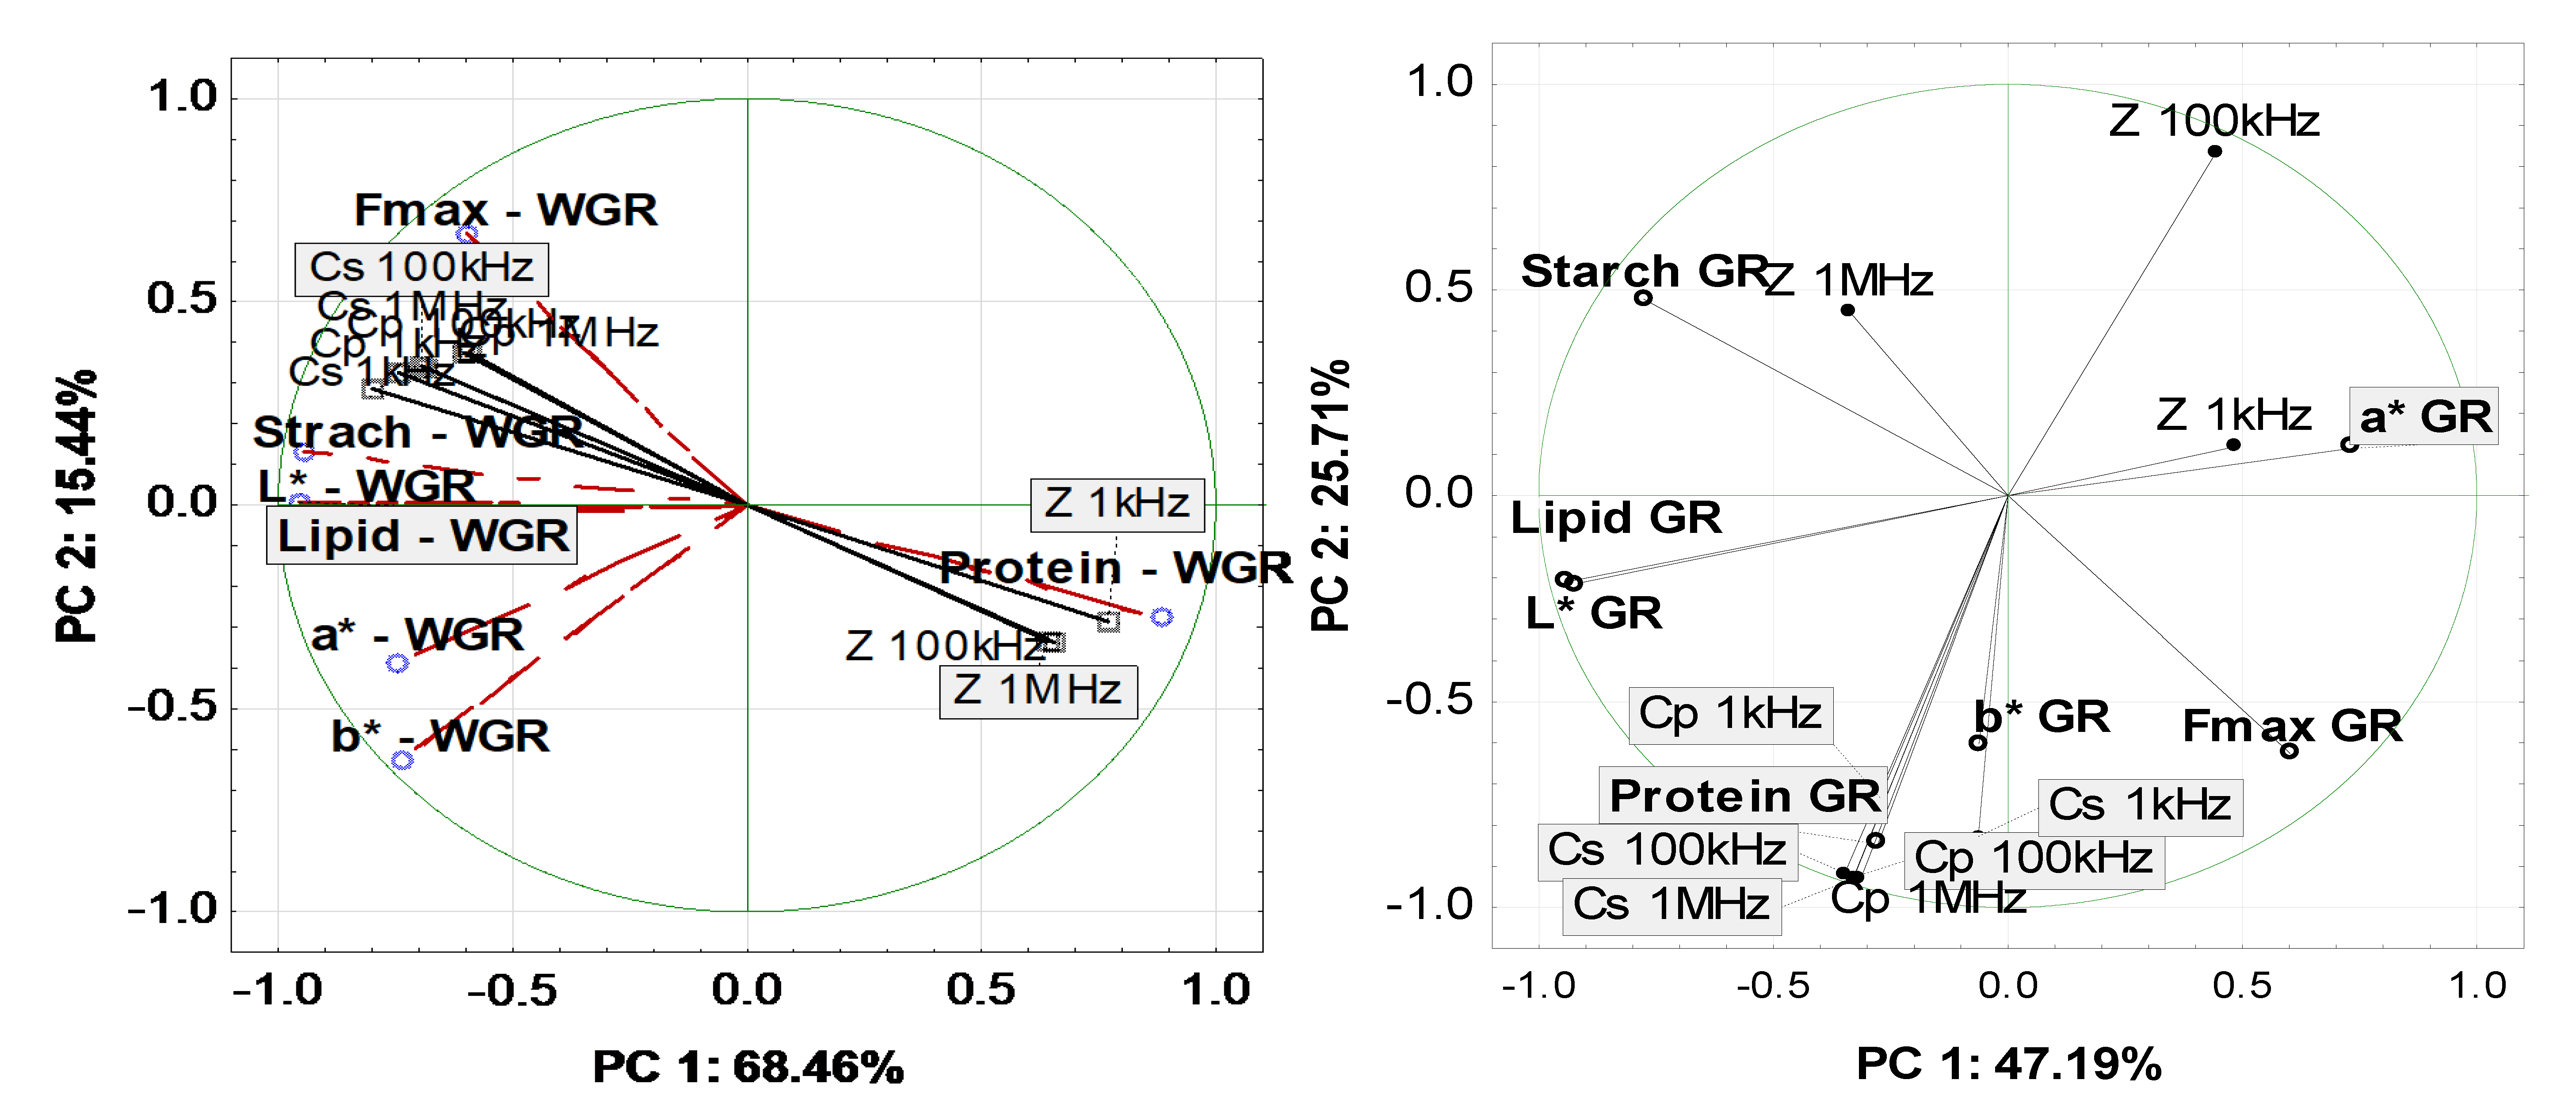
3.2. Changes in the Electrical Parameters of the Grain

Among the multiple physical properties, the electrical properties of cereal grain enable the non-invasive identification of its quality traits, including structural changes of the grain, such as, e.g., damage degree [16]. However, due to heterogeneity, cellular structure, chemical composition, and the shape of various biological materials testing, a specific measurement technique should be developed for each material type [12].
Like in the case of selected chemical components determined in this study, measurements of the electrical parameters (Z, Cp, and Cs) of durum wheat grain demonstrated a significant effect of agro-engineering factors (WGR-GR; N: 0–120 kg·ha−1) on changes in their values. These changes were additionally affected by the tested frequencies of the measuring current (1 kHz–1 MHz).
Due to its cellular structure and chemical composition, cereal grain exhibits conductive and dielectric (capacitive) properties. In the process of electric current conduction, the cytoplasm exhibits the characteristics of a complex electrolyte (suspension) composed of proteins and amino acids, nucleic acids, lipids, and carbohydrates, as well as low-molecular-weight organic compounds, mineral salts, and water. The electrical conductivity of the cytoplasm depends on the type, concentration, and mobility of ions [37]. Given the above, measurements were made for one of the conductive parameters—impedance (Z), which is defined as complex resistance ( Z 2 = R 2 + ( X l X c ) 2 ). The grain of wheat cultivated without the growth regulator and with nitrogen fertilization at 80 kg·ha−1 (WGR + 80N) had the highest impedance values significantly (Z100 kHz = 3.36·105 Ω; Z1 MHz = 3.81·104 Ω), whereas the grain from the WGR + 0N variant had the lowest Z values. The statistical analysis of the effect of the WHR-GR factor demonstrated significant (p < 0.01; p < 0.05) differences between Z values (measured at 1 kHz 100 kHz; 1 MHz) of the grain produced with 0N and also between Z100 kHz values of the grain from the 120N variant (Table 2).
These results point to a significant effect of protein content on the electrical conductivity and to the feasibility of producing grain with increased protein content in the WGR + 0N variant (environmentally-friendly, cost-effective) compared to the GR + 0N variant. Increasing nitrogen fertilization rates (80–120N) in both the WGR and the GR variant caused no differences in the protein content of the grain, which is the main positive driver of grain yield and technological quality [33,34,35]. When investigating the effect of fertilization type in durum wheat cultivation, also Rossini et al. [38] determined a lower protein content of the grain in the variant with organic fertilization compared to mineral fertilization; however, they did not notice a strong impact of this factor on protein and gluten percentage contents. Wheat grain yield and quality, as well as nitrogen utilization effectiveness, are influenced by environmental factors [39,40]. Our previous study [2] demonstrated that high-quality grain with desired flour quality parameters (flour extraction rate ≈ 64%; flour particle size ≈ 98%; L* ≈ 92) could be produced from spring durum wheat grown without the growth regulator and at 80 kg·ha−1 nitrogen fertilization. In addition, its results allowed concluding that this cultivation variant proved effective in reducing durum wheat production costs and diminishing natural environment pollution.
Solid-state biophysics classifies cereal grain into the group of heterogeneous (layered) and weakly polarizable dielectrics, differing in mass. This is directly due to the high content of lipids in the cell wall and membrane. The size of the electric charge accumulated in the grain or the dipole moment is the factor that determines the behavior of the grain in the electric field [15,17]. Therefore, the ability to accumulate an electric charge by durum wheat grains from the six cultivation variants was determined using capacitive parameters (strictly dependent on the geometric features, moisture content, chemical composition, and morphology of the grain).
The measurements of the capacitive parameters (Cp, Cs) of the grain showed different trends of changes than in the case of the Z values. In the WGR cultivation variant, significantly the highest Cp and Cs values were obtained at fertilization rates of 120N (f = 1 kHz, f = 100 kHz) and 0N (f = 1 MHz)—Table 2.
In turn, wheat cultivation with GR contributed to the highest Cp and Cs values in the 0N variant (regardless of the measuring frequency). However, the statistical analysis of the effect of the WGR-GR factor demonstrated significant (p < 0.05) differences only between the Cp1 kHz and Cs1 kHz and Cs100 kHz values of the grain from wheat fertilized with 120N (Table 2).
The analysis of correlations between the quality traits and electrical parameters of durum wheat grain produced without the growth regulator (WGR) showed that the nitrogen dose had a significant effect on the strength of these correlations (Table 3). Significant (p < 0.001; p < 0.01; p < 0.05) correlations were found for impedance (Z) and capacitance parameters (Cp, Cs) of the grain produced in the WGR+0N variant, regardless of the measuring frequency. Increasing the fertilization rate to 80N impaired the possibility of using electrical parameters (Z, Cp, Cs) for grain yield and quality assessment only to these measured at the higher frequencies tested (f = 100 kHz and f = 1 MHz). At the highest nitrogen fertilization dose used in the study (120N), the strongest correlation was noted between Z1 MHz and Cp100 kHz and Cs100 kHz (Table 3). The viability of capacitance parameters in grain yield and quality assessment was also demonstrated by Cseresnyés et al. [41] and Di Mola et al. [40]. The recommendations to use the electrical parameters only at higher frequencies of the measuring current (100 kHz, 1 MHz) may be due to the fact that the increasing frequency is accompanied by a successive decrease in the electric permeability value (current streams flow through the cell), that the capacitive resistance of the membrane practically contains the resistance of the lipid layer, and, finally, that the intracellular substance is involved in the conduction of electricity [37].
The statistical analysis of results from the wheat cultivation variant with GR demonstrated stronger correlations between quality traits and electrical parameters of the grain with increasing nitrogen rates, indicating especially the viability of Cp and Cs parameters in grain quality assessment (Table 4). In the case of wheat grown in the GR + 0N variant, the most significant (p < 0.001) correlation was demonstrated between grain chemical composition (protein, lipid, and starch contents) and impedance (Z) measured in the entire tested range of current frequencies. In turn, the values of Cp and Cs parameters were correlated only with lipid and starch contents. These correlations are also confirmed by the earlier described phenomena (WGR cultivation variant). The quality traits of the grain from wheat grown in the GR + 80N variant correlated with the values of electrical parameters measured at the higher frequencies tested (Z100 kHz, Cs and Cp100 kHz; Cs and Cp1 MHz). The correlations demonstrated in the GR + 120N variant were similar to those noted for the GR + 80N variant; however, they more strongly indicated the possibility of using the Cs parameter (Table 4) to evaluate all-grain quality traits tested in this study.
The Principal Component Analysis enabled discriminating a sub-set of electrical parameters (additional variables) from a large group of the evaluated physicochemical parameters and identifying the usability of the analyzed electrical parameters for quality assessment of the grain of durum wheat grown in Poland. In addition, only one agro-engineering factor (object) was considered, i.e., wheat cultivation with/without GR, to verify the versatility of the proposed electrical method—Figure 3a,b (with no account taken of the nitrogen fertilization factor/object).
The matrix correlation between the analyzed parameters of the grain produced in the WGR and GR variants enabled the discrimination of two Principal Components, explaining 83.90% (Figure 3a) and 72.90% (Figure 3b), of the total variance of the analyzed parameters. In the first wheat cultivation variant—WGR (Figure 3a), the visualization of the analyzed parameters (vector length, angle between vectors) onto a two-dimensional plane, defined by PC1 (68.46%) and PC2 (15.44%), demonstrated correlations between the chemical composition of the grain and its conductive (Z) and capacitive (Cp, Cs) parameters. Significant (p < 0.05) and the strongest positive correlations were found between: protein content and Z1 kHz–1 MHz (0.839 < r < 0.900); starch content and Cp1 kHz–1 MHz (0.807 < r < 0.912) and Cs1 kHz–1 MHz (0.874 < r < 0.946); as well as lipid content and Cp1 kHz–1 MHz (0.624 < r < 0.745) and Cs1 kHz–1 MHz (0.700 < r < 0.785).
In turn, significant (p < 0.05) and the strongest negative correlations were demonstrated between: protein content and Cp1 kHz–1 MHz (−0.817 < r <−0.897) and Cs1 kHz–1 MHz (−0.867 < r < −0.916); starch content an Z1 kHz–1 MHz (−0.846 < r <−0.930); as well as lipid content and Z1 kHz–1 MHz (−0.664 < r < −0.763). The positive correlations between protein content and Z values are most likely due to the generally higher protein content in the grain from wheat grown in the WGR variants (Table 3). Our previous study 17] demonstrated significant correlations between impedance and admittance values and the chemical composition (including especially lipid and starch contents) of the grain of various cereal species (wheat, barley, rye, triticale, oats) and indicated the viability of conductive parameters (measured in a frequency range of f = 100 kHz–2 MHz) in discriminating cereal species and cultivars.
In the second variant of wheat cultivation—GR (Figure 3b), the visualization of the analyzed parameters was not as explicit as in the WGR variant (Figure 3a). Significant (p < 0.05) and the strongest correlation was found only between Cp1 kHz–1 MHz (0.903 < r < 0.925) and Cs1 kHz–1 MHz (0.902 < r < 0.937) parameters and protein content. In contrast, significant (p < 0.05) negative correlations were determined only between impedance value and protein content, color (b* and L*), and hardness. The values of the correlation coefficient were as follows: protein—Z100 kHz (r = −0.933); b*—Z1 MHz (r = −0.801); L*—Z1 MHz (r = −0.688); and hardness—Z1 MHz (r = −0.609). Given the above, it was concluded that the electrical method could be employed to assess the quality of durum wheat grain produced in the WGR cultivation variant. A lack of explicit correlations between the analyzed traits of grain from the GR variant points to the limited applicability of this method. The administration of the growth regulator (GR variant) had a significant effect on differences in the chemical composition of the grain, including especially contents of starch and lipids (Table 1), which determine grain microstructure. According to Patel et al., [42]; Nilesh et al., [43]; and Ropelewska et al., [44], GR application elicits a positive effect on: thousand seed weight, bulking density, the width of common wheat grain, grain yield, and HI, and may improve technological processes in the cereal processing industry. The grain from the GR+0N variant had a significantly lower protein content than the WGR+0N grain. Contrary to the available literature data [12,15,16,38], no explicit correlations were found between the quality traits and electrical properties of the grain from wheat cultivated with GR. Presumably, the application of a growth regulator (Medax 350 S.C.) induces changes in the kernel structure. Therefore, it seems advisable to identify deeper mechanisms underlying the effects of this agro-engineering factor to elucidate trends of these changes.

4. Conclusions

The cultivation of durum wheat in different variants of agro-engineering factors (GR-WGR and nitrogen fertilization: 0, 80, 120 kg·ha−1) enables modifying grain quality, including especially starch and lipid contents. The highest contents of starch and lipids and the highest hardness of the grain can be achieved in wheat cultivation variants with or without growth regulator (GR of WGR) without nitrogen fertilization (0N). In turn, the highest protein content of the grain can be obtained upon nitrogen fertilization at 120 kg·ha−1. These results suggest the feasibility of tailored optimization of grain production in durum wheat processing.
The analysis of correlations between the quality traits and electrical parameters of the grain demonstrated cultivation variant-dependent differences in the strength of these correlations. In the grain from the WGR+0N variant (environmentally friendly), the strongest correlation was found between the conductive and capacitive parameters in the entire range of current frequencies. Coupling the WGR cultivation variant with higher nitrogen fertilization rates (80 and 120 kg·ha−1) caused strong correlations (p < 0.001), indicating the use of the studied electrical parameters for grain quality evaluation (chemical composition, hardness, and color). The cultivation of durum wheat in the integrated system, especially in the WGR variant, facilitates grain quality modeling and enables using a non-invasive electrical method for a rapid assessment of the quality traits of the grain while raising no concerns over natural environment safety. The growth regulator (GR) application during native durum wheat cultivation hampers the use of the analyzed electrical method to assess its grain quality. The assumed hypothesis was verified negatively in relation to the grain obtained from cultivation with GR application.

Author Contributions

Conceptualization, J.K.B. and K.M.; methodology, J.K.B., K.M. and K.Ż.-G.; validation, J.K.B. and M.G.-R.; formal analysis, J.K.B. and K.M.; investigation, J.K.B., K.M. and K.Ż.-G.; data curation, J.K.B. and M.G.-R.; writing—original, J.K.B., K.M., K.Ż.-G. and M.G.-R.; draft preparation, J.K.B., K.M., K.Ż.-G. and M.G.-R., funding acquisition, J.K.B., K.M., K.Ż.-G. and M.G.-R. All authors have read and agreed to the published version of the manuscript.

Funding

The research was financed by the “Project financially supported by Minister of Education and Science in the range of the program entitled “Regional Initiative of Excellence” for the years 2019–2022, Project No. 10/RID/2018/19, amount of funding 12.000.000 PLN” and the University of Warmia and Mazury in Olsztyn, Poland (projects: No. 22.610.100-110; No. 17.610.012-110; No. 30.610.013-110).

Institutional Review Board Statement

Not applicable.

Informed Consent Statement

Not applicable.

Data Availability Statement

Not applicable.

Conflicts of Interests

The authors have declared that no conflicts of interests exist.

References

  1. Colasuonno, P.; Marcotuli, I.; Blanco, A.; Maccaferri, M.; Condorelli, G.E.; Tuberosa, R.; Parada, R.; de Camargo, A.C.; Schwember, A.R.; Gadaleta, A. Carrotenoid pigment content in durum wheat (Triticum turgidum L. var durum): An overview of quantitative trait loci and candidate genes. Front. Plant Sci. 2019, 10, 1347. [Google Scholar] [CrossRef] [Green Version]
  2. Banach, J.K.; Majewska, K.; Żuk-Gołaszewska, K. Effect of cultivation system on quality changes in durum wheat grain and flour produced in North-Eastern Europe. PLoS ONE 2021, 16, e0236617. [Google Scholar] [CrossRef]
  3. Alemu, H. Review paper on breeding durum wheat (Triticum Turgidum L. var. Durum) for quality traits. Int. J. Adv. Res. Publ. 2017, 1, 448–455. [Google Scholar]
  4. Kabbaj, H.; Sall, A.T.; Al-Abdallat, A.; Geleta, M.; Amri, A.; Filali-Maltouf, A.; Belkadi, B.; Ortiz, R.; Bassi, F.M. Genetic diversity within a global panel of durum wheat (Triticum durum) landraces and modern germplasm reveals the history of alleles exchange. Front. Plant Sci. 2017, 8, 1277. [Google Scholar] [CrossRef] [Green Version]
  5. Morris, C.F.; Casper, J.; Kiszonas, A.M.; Fuerst, E.P.; Murray, J.; Simeone, M.C.; Lafiandra, D. Soft kernel durum wheat—A new bakery ingredient? Cereals Foods World 2015, 60, 76–83. [Google Scholar] [CrossRef]
  6. Xiao, F.B.; Wang, K.; Dupuis, B.; Taylor, D.; Nam, S. Kernel vitreousness and protein content: Relationship, interaction and synergistic effects on durum wheat quality. J. Cereal Sci. 2018, 79, 210–217. [Google Scholar] [CrossRef]
  7. Polish National List of the Research Center for Cultivar Testing. In Cereals; COBORU: Słupia Wielka, Poland, 2021; ISSN 1641-7003. (In Polish)
  8. Żuk-Gołaszewska, K.; Żerańska, A.; Krukowska, A.; Bojarczuk, J. Biofortification of the nutritional value of foods from the grain of Triticum durum Desf. by an agrotechnical method: A scientific review. J. Elem. 2016, 21, 963–975. [Google Scholar] [CrossRef]
  9. Polish National List of Agricultural Plant Varieties; COBORU: Słupia Wielka, Poland, 2018; ISSN 1231-8299. (In Polish)
  10. Polish National List of the Research Center for Cultivar Testing. In Cereals; COBORU: Słupia Wielka, Poland, 2019; ISSN 1641-7003. (In Polish)
  11. Polish National List of the Research Center for Cultivar Testing. In Cereals; COBORU: Słupia Wielka, Poland, 2020; ISSN 1641-7003. (In Polish)
  12. Łuczycka, D. Cechy Elektryczne Ziaren Pszenicy (Electrical Properties of Wheat Grains); Monographs LXXIII; UP Wrocław: Wrocław, Poland, 2009; pp. 5–90. (In Polish) [Google Scholar]
  13. Nelson, S.O.; Bartley, P.G., Jr. Measuring frequency-and temperature-dependent dielectric properties of food materials. Trans. ASAE 2000, 43, 1733–1736. [Google Scholar]
  14. Nelson, S.O.; Trabelsi, S. Principles of grain and seed moisture sensing through radio-frequency and microwave dielectric properties In 2017 ASABE annual international meeting (p.1). Am. Soc. Agric. Biol. Eng. 2017, 1, 1701422. [Google Scholar]
  15. Majewska, K.; Banach, J.K.; Żywica, R.; Białobrzewski, I. Influence of variety, moisture content, kernel size and applied current frequency on the electric properties of wheat grain. Int. J. Food Prop. 2008, 11, 392–406. [Google Scholar] [CrossRef]
  16. Banach, J.K.; Majewska, K.; Żywica, R. Applying conductivity parameters to assess the degree of barley grain destruction. Pol. J. Commod. Sci. 2020, 2, 50–60. [Google Scholar]
  17. Banach, J.K.; Majewska, K.; Ejsmont, A.; Żywica, R.; Grabowska, E. Effect of species, chemical composition and measurement frequency on conductance properties of cereal grains. Pol. J. Commod. Sci. 2017, 3, 49–58. [Google Scholar]
  18. Jha, S.N.; Narsaiah, K.; Basediya, A.L.; Sharma, R.; Jaiswal, P.; Kumar, R.; Bhardwaj, R. Measurement techniques and application of electrical properties for nondestructive quality evaluation of foods—A review. J. Food Sci. Technol. 2011, 48, 387–411. [Google Scholar] [CrossRef] [Green Version]
  19. Bansal, N.; Dhaliwal, A.; Mann, K.S. Dielectric properties of corn flour from 0.2 to 10 GHz. J. Food Eng. 2015, 166, 255–262. [Google Scholar] [CrossRef]
  20. Łuczycka, D.; Czubaszek, A.; Fujarczuk, M.; Pruski, K. Dielectric properties of wheat flour mixed with oat meal. Int. Agrophysics 2013, 27, 175–180. [Google Scholar]
  21. Bożek, K.S.; Żuk-Gołaszewska, K.; Bochenek, A.; Gołaszewski, J.; Kalaji, K.M. Modelling the growth, development and yield of Triticum durum Desf under the changes of climatic conditions in north-eastern Europe. Sci. Rep. 2021, 11, 21753. [Google Scholar] [CrossRef] [PubMed]
  22. PN-EN ISO 712; Ziarno Zbóż i Przetwory Zbożowe. Oznaczanie Wilgotności. Metoda Odwoławcza (Cereal Grains and Processed Cereals. Moisture Determination. Reference Method). PKN: Warszawa, Poland, 2012. (In Polish)
  23. PN-EN ISO 20483; Ziarno Zbóż i Nasiona Roślin Strączkowych. Oznaczanie Zawartości Azotu i Przeliczanie Na Zawartość Białka. Metoda Kjeldahla. (Cereal Grains and Legume Seeds. Determination of Nitrogen Content and Converting to Protein Content. Kjeldahl Method). PKN: Warszawa, Poland, 2014. (In Polish)
  24. Krełowska-Kułas, M. Badanie Jakości Produktów Spożywczych; PWE: Warszawa, Poland, 1993; Volume 61, pp. 61–62. ISBN 83-208-0902-9. (In Polish) [Google Scholar]
  25. Banach, J.K.; Żywica, R.; Nieradko, I.; Staniewski, B. Studies on determination of mathematical relationships between rapeseed oil content and electrical properties of butter and fat mixes. J. Food Eng. 2012, 112, 346–351. [Google Scholar] [CrossRef]
  26. Banach, J.K.; Żywica, R. A method of evaluating apple juice adulteration with sucrose based on its electrical properties and RCC model. Sustainability 2021, 13, 6716. [Google Scholar] [CrossRef]
  27. Abdi, H.; Williams, L.J. Principal component analysis. Wiley Interdiscip. Rev. Comput. Stat. 2010, 2, 433–459. [Google Scholar]
  28. Ringnér, M. What is principal component analysis? Nat. Biotechnol. 2008, 26, 303–304. [Google Scholar] [CrossRef]
  29. Gąsiorowski, H. (Ed.) Pszenica. Chemia i Technologia (Wheat. Chemistry and Technology); PWRiL: Poznań, Poland, 2004; ISBN 83-09-01787-1. (In Polish) [Google Scholar]
  30. Lafiandra, D.; Riccardi, G.; Shewry, P.R. Improving cereal carbohydrates for diet and health. J. Cereal Sci. 2014, 59, 312–326. [Google Scholar] [CrossRef] [PubMed] [Green Version]
  31. De Santis, M.A.; Giuliani, M.M.; Giuzio, L.; De Vita, P.; Lovegrove, A.; Shewry, P.R.; Flagella, Z. Differences in gluten protein composition between old and modern durum wheat genotypes in relation to 20th century breeding in Italy. Eur. J. Agron. 2017, 87, 19–29. [Google Scholar] [CrossRef] [PubMed]
  32. Dragov, R. Gene action for grain protein content in durum wheat. Acta Agric. Slov. 2021, 117, 1–8. [Google Scholar] [CrossRef]
  33. Obuchowski, W.; Makowska, A.; Łuczak, M.; Sulewska, H. Agrotechniczne i logistyczne aspekty uprawy pszenicy durum w Polsce (Agrotechnical and logistic aspects of durum wheat cultivation in Poland). Przegląd Zbożowo-Młynarski 2007, 10, 33–34. (In Polish) [Google Scholar]
  34. Giuliani, M.M.; Giuzio, L.; De Caro, A.; Flagella, Z. Relationships between nitrogen utilization and grain technological quality in durum wheat. II. Grain yield and quality. Agron. J. 2011, 103, 1668–1675. [Google Scholar]
  35. Mefleh, M.; Conte, P.; Fadda, C.; Giunta, F.; Piga, A.; Hassoun, G.; Motzo, R. From ancient to old and modern durum wheat varieties: Interaction among cultivar traits, management, and technological quality. J. Sci. Food Agric. 2018, 99, 2059–2067. [Google Scholar] [CrossRef] [PubMed]
  36. Żuk-Gołaszewska, K.; Majewska, K.; Tyburski, J.; Gołaszewski, J. Physical and technological properties of kernels and flour made from spelt grown in an organic farming system in north-eastern Poland. J. Cereal Sci. 2018, 79, 501–507. [Google Scholar] [CrossRef]
  37. Żywica, R. Zjawiska Elektryczne w Produkcji i Towaroznawczej Ocenie Jakości Mięsa (Electrical Phenomena in Production and Commodity Evaluation of Meat Quality); Universiti of Warmia and Mazury in Olsztyn: Olsztyn, Poland, 2010; pp. 9–248. (In Polish) [Google Scholar]
  38. Rossini, F.; Provenzano, M.E.; Sestili, F.; Ruggeri, R. Synergistic effect of sulphur and nitrogen in the organic and mineral fertilization of durum wheat: Grain yield and quality traits in the Mediterranean environment. Agronomy 2018, 8, 189. [Google Scholar] [CrossRef] [Green Version]
  39. Marinaccio, F.; Blandino, M.; Reyneri, A. Effect of nitrogen fertilization on yield and quality of durum wheat cultivated in Northern Italy and their interaction with different soils and growing seasons. J. Plant Nutr. 2016, 39, 643–654. [Google Scholar] [CrossRef]
  40. Di Mola, I.; Ottaiano, L.; Sacco, A.; Mauro Senatore, M.; Mori, M. Organic versus mineral fertilization: Assessing of yield and quality of durum wheat in marginal lands. Ital. J. Agron. 2021, 16, 1855. [Google Scholar] [CrossRef]
  41. Cseresnyés, I.; Mikó, P.; Kelemen, B.; Füzy, A.; Parádi, I.; Takács, T. Prediction of wheat grain yield by measuring root electrical capacitance at anthesis. Int. Agrophysics 2021, 35, 159–165. [Google Scholar] [CrossRef]
  42. Patel, M.M.; Patel, I.C.; Patel, P.H.; Bathar, V.M.; Tikka, S.B.S. Effect of thiourea on growth, yield and economics of clusterbean (Cyamopsis tetragonoloba (L.) Taub.) under rainfed conditions. J. Arid. Legumes 2006, 3, 22–24. [Google Scholar]
  43. Nilesh, G.; Chakrborti, P.; Rai, A.K.; Gupta, P.C. Effect of plant growth regulator on growth response and yield component in wheat (Triticum aestivum L.). Crop Res. J. Agric. Sci. 2012, 3, 204–208. [Google Scholar]
  44. Ropelewska, E.; Zapotoczny, P.; Bożek, K.S.; Żuk-Gołaszewska, K. Thermal, physical and morphological properties of durum wheat. J. Consum. Prot. Food Saf. 2019, 14, 131–137. [Google Scholar]
Figure 1. The measurement system used for electrical properties examination of the wheat grain (a): 1—LCR meter, type E4980a; 2—thermostat; 3—measuring glass cell with plate electrodes, 4—examined wheat grain; 5—water jacket; (b): the internal view of the measuring cell with sample, water jacket and connecting cables.
Sustainability 14 03834 g001
Figure 2. RCC equivalent model for measuring of electrical properties food products (Z—impedance; R—resistance; Cs—series equivalent capacitance; Cp—parallel equivalent capacitance; M—measuring device).
Sustainability 14 03834 g002
Figure 3. Visualization of correlations between quality traits and electrical properties of the grain of durum wheat cultivated WGR (a) and with the application of the GR (b).
Sustainability 14 03834 g003
Table 1. Changes in the physicochemical properties (starch, lipid and protein content; values Fmax—maximum compression force) of the durum wheat grain depending on growth regulator application (WGR, GR) and nitrogen fertilization (0, 80, 120 kg·ha−1).
ParametersWithout the Application of Growth Regulator (WGR) With the Application of Growth Regulator (GR)Significant Differences WGR–GR
Fertilization [kg·ha−1]
0N80N120N0N80N120N0N80N120N
Starch [%d.m.]64.62 ± 0.27 c62.01 ± 0.32 b60.90 ± 0.24 a65.12 ± 0.34 c63.44 ± 0.28 b61.85 ± 0.05 aNSp < 0.01p < 0.01
Lipid [%d.m.]2.43 ± 0.05 aA2.31 ± 0.01 b2.22 ± 0.09 bB2.51 ± 0.01 c2.11 ± 0.05 a2.24 ± 0.03 bp < 0.05p < 0.01NS
Protein [%d.m.]12.717 ± 0.530 a14.157 ± 0.388 b14.425 ± 0.382 b11.450 ± 0.418 a14.022 ± 0.504 bB15.825 ± 0.851 Cd0.01NSNS
Fmax [N]131.87 ± 17.98 a126.47 ± 10.66 a122.87 ± 19.88 a120.90 ± 9.08 a120.51 ± 14.22 a134.38 ± 9.57 bNSNSNS
L*53.92 ± 0.54 a53.27 ± 0.79 a52.11 ± 0.64 a53.49 ± 1.04 a52.93 ± 0.48 a52.84 ± 0.79 aNSNSNS
a*8.78 ± 0.72 a8.92 ± 0.55 a8.88 ± 0.21 a8.67 ± 0.71 a8.82 ± 0.60 a8.69 ± 0.64 aNSNSNS
b*28.42 ± 0.51 a28.39 ± 0.57 a27.91 ± 0.54 a28.14 ± 0.63 a27.35 ± 0.74 a27.87 ± 0.62 aNSNSNS
NS—no significant differences; a–d—mean values in rows indicated with various small letters are statistically significantly different at p < 0.01; A–B—mean values in rows indicated with various capital letter are statistically significantly different at p < 0.05; a–a—mean values in rows indicated with the same small letters are non-statistically different.
Table 2. Changes in the values (mean values ± standard deviation) of the electrical parameters (Z, Cp, Cs) durum wheat grain cultivated with the application (GR) and without application (WGR) of the growth regulator with different nitrogen fertilization (0, 80, 120 kg·ha−1).
FrequencyWithout the Application of Growth Regulator (WGR)With the Application of Growth Regulator (GR)Significant Differences WGR–GR
Fertilization [kg·ha−1]0N80N120N
0N80N120N0N80N120N
Z [Ω]
1 kHz16.00 ± 5.29×10⁶ b14.50 ± 1.09×10⁶ b11.50 ± 1.08×10⁶ a12.50 ± 1.76×10⁶ a14.30 ± 2.15×10⁶ Cc11.5 ± 3.74×10⁶ aBp < 0.05NSNS
100 kHz1.65 ± 0.15×10⁵ a3.36 ± 0.12×10⁵ c2.87 ± 0.05×10⁵ b2.92 ± 0.34×10⁵ a3.27 ± 0.12×10⁵ b2.97 ± 0.14×10⁵ cap < 0.01NSp < 0.05
1 MHz2.85 ± 0.50×10⁴ a3.81 ± 0.12×10⁴ c3.32 ± 0.12×10⁴ b3.30 ± 0.37×10⁴ a3.70 ± 0.15×10⁴ b3.37 ± 0.16×10⁴ cap < 0.05NSNS
Cp [F]
1 kHz1.19 ± 0.05×10⁻¹¹ b1.06 ± 0.09×10⁻¹¹ a1.32 ± 0.13×10⁻¹¹ c1.23 ± 0.19×10⁻¹¹ ca1.07 ± 0.17×10⁻¹¹ a1.21 ± 0.09×10⁻¹¹ bNSNSp < 0.05
100 kHz5.42 ± 0.26×10⁻¹² b4.71 ± 0.16×10⁻¹² a5.46 ± 0.11×10⁻¹² cb5.47 ± 0.68×10⁻¹² ca4.84 ± 0.19×10⁻¹² a5.33 ± 0.26×10⁻¹² bNSNSNS
1 MHz4.83 ± 0.23×10⁻¹² cb4.18 ± 0.12×10⁻¹² a4.78 ± 0.17×10⁻¹² b4.87 ± 0.58×10⁻¹² a4.29 ± 0.18×10⁻¹² a4.71 ± 0.23×10⁻¹² bNSNSNS
Cs [F]
1 kHz1.32 ± 0.06×10⁻¹¹ a1.15 ± 0.09×10⁻¹¹ b1.46 ± 0.15×10⁻¹¹ c1.37 ± 0.21×10⁻¹¹ a1.17 ± 0.02×10⁻¹¹ b1.33 ± 0.11×10⁻¹¹ caNSNSp < 0.05
100 kHz5.52 ± 0.26×10⁻¹² a4.80 ± 0.17×10⁻¹² b5.61 ± 0.08×10⁻¹² ca5.57 ± 0.71×10⁻¹² a4.93 ± 0.18×10⁻¹² b5.41 ± 0.26×10⁻¹² caNSNSp < 0.05
1 MHz4.86 ± 0.24×10⁻¹² a4.19 ± 0.13×10⁻¹² b4.82 ± 0.16×10⁻¹² ca4.90 ± 0.58×10⁻¹² a4.32 ± 0.18×10⁻¹² b4.71 ± 0.21×10⁻¹² caNSNSNS
NS—no significant differences; a–c—mean values in rows indicated with various small letters are statistically significantly different at p < 0.01; a–a—mean values in rows indicated with the same small letters non-statistically different.
Table 3. Analysis of the correlation between quality—technological (lipid, protein, starch, hardness) and electrical (Z, Cs, Cp) parameters of hard wheat grain cultivated without retardant (WGR) and at different nitrogen dose (0, 80, 120 kg·ha−1).
Quality ParametersZ1 kHzZ100 kHzZ1 MHzCs1 kHzCs100 kHzCs1 MHzCp1 kHzCp100 kHzCp1 MHz
WGR + 0N
Lipid [%d.m.]***************************
Protein [%d.m.]*************0.129******
Starch [%d.m.]***************************
Hardness [N]**********************
L*******0.7340.9430.763******
a*0.7380.8640.8980.8420.9160.9620.7740.9200.935
b****0.2180.2350.249***
WGR + 80N
Lipid [%d.m.]0.515******0.945*****0.462******
Protein [%d.m.]0.319******0.994******0.953******
Starch [%d.m.]0.138******0.914******0.165******
Hardness [N]0.349**0.457******
L*0.3670.0890.0750.4360.0830.0770.6900.8300.686
a*0.2890.7180.7270.2570.7290.7140.8710.9960.960
b*0.0920.1170.1260.1000.1220.1230.2480.3400.369
WGR + 120N
Lipid [%d.m.]0.9920.435***0.691******0.983*****
Protein [%d.m.]0.8950.929***0.777***0.5700.865*0.793
Starch [%d.m.]0.9890.953***0.957***0.1140.983***0.537
Hardness [N]0.591**********************
L*0.7700.9650.6510.1710.8450.8540.3010.1450.089
a*0.6050.5490.4110.3800.5780.3050.779****
b*0.7000.9160.7960.9880.9750.9740.9280.7800.819
***—significance level p < 0.001; **—significance level p < 0.01; *—significance level p < 0.05.
Table 4. Analysis of the correlation between quality—technological and electrical parameters (Z, Cs, Cp, measured at the frequency of 1 kHz, 100 kHz, 1 MHz) of hard wheat grain grown with retardant (GR) and differentiated nitrogen dose (0, 80, 120 kg·ha−1).
Quality ParametersZ1 kHzZ100 kHzZ1 MHzCs1 kHzCs100 kHzCs1 MHzCp1 kHzCp100 kHzCp1 MHz
GR + 0N
Lipid [%d.m.]***************************
Protein [%d.m.]*******0.2420.3610.4370.1230.725**
Starch [%d.m.]**************************
Hardness [N]0.7620.9390.6490.7220.7570.7110.9730.7420.699
L**0.132**0.2060.1850.2020.1430.1900.196
a*0.4990.5480.4180.5800.5700.5770.5150.5720.577
b*0.4790.2500.4470.9770.9110.9650.6780.9280.993
GR + 80N
Lipid [%d.m.]*****0.086***************
Protein [%d.m.]0.201***0.084***0.774****
Starch [%d.m.]0.073***0.356************
Hardness [N]0.312***0.096*****0.091*****
L*0.263*0.761*0.0710.191*0.1090.233
a*0.431*0.0930.095**0.092**
b**0.5860.0990.5840.7670.7560.6660.7870.780
GR + 120N
Lipid [%d.m.]0.484**************0.627*****
Protein [%d.m.]************0.439*****
Starch [%d.m.]0.642************0.962*****
Hardness [N]0.2620.1230.128*******0.2390.1370.122
L********0.060**************
a*0.9000.6410.8430.267**0.9060.8230.850
b**********0.708************
***—significance level p < 0.001; **—significance level p < 0.01; *—significance level p < 0.05.
Publisher’s Note: MDPI stays neutral with regard to jurisdictional claims in published maps and institutional affiliations.

