1. Introduction
Polymers are important materials in the global economy, and modern daily life is unthinkable without them. They are widely used in packaging films, plastics, structural composites, textiles, protective coatings and adhesives. All technological indicators show a progressively increasing use of polymers in a variety of applications, where they can effectively replace, for example, metals saving weight and cost. At the same time, however, the management of end-of-life (EoL) plastics is still problematic for its impact on the environment. Action on plastics was already identified as a priority in the 2015 Circular Economy Action Plan, to help European businesses and consumers to use resources more sustainably. The first-ever European Strategy for Plastics in a Circular Economy was adopted on 16 January 2018. Better design of plastic products, higher plastic waste recycling rates, more and better quality of recyclate will help boost the market for recycled plastics. This strategy is part of Europe’s transition towards a circular economy and will also contribute to reaching the Sustainable Development Goals, the global climate commitments and the EU’s industrial policy objectives [
1].
In light of this general problem, bioplastics—polymeric materials derived from renewable sources—now have their chance. They show the advantage of reduced dependence on fossil-based sources, and in most cases, they show complete biodegradability. Different types of bioplastics are known, mostly based on the general families of carbohydrates and proteins. These materials still show several technological limitations that hinder more widespread use. They are difficult to process, brittle, too sensitive to water and poorly resistant to high temperatures. Biodegradable polyesters such as poly-lactic acid (PLA) show better performances, but they are only hemi-synthetic. Finally, bacterial polyesters such as polyhydroxyalkanoates (PHAs) are an interesting class of bioplastics naturally produced by a variety of microorganisms [
2,
3]. PHAs are linear biodegradable polyesters that can be produced by different types of bacteria as energy and carbon storage materials. PHAs are good candidates for the substitution of conventional oil-based technical plastics. Compared to conventional synthetic polymers, PHAs show obvious ecological advantages since they are completely biodegradable and nontoxic [
4,
5] and can be produced from renewable sources, such as glucose or sugar beet bagasse.
PHAs are composed of hydroxyalkanoic acid monomers with a straight or branched chain containing aliphatic or aromatic side groups [
3]. Several metabolic pathways are described for the production of PHAs in bacteria; these processes usually involve acetyl-CoA or acyl-CoA as intermediate steps [
6]. PHAs’ biodegradation is performed by a microorganism that produces PHA depolymerase, an enzyme that allows the conversion of PHAs to water and carbon dioxide or methane [
7].
Different types of PHAs have been bio-produced and many others are currently under investigation. Among them, polyhydroxybutyrate (PHB) and poly(3-hydroxybutyrate-co-3-hydroxyvalerate) P(HB/HV) copolymers are the most widely known. PHB is highly crystalline, stiff and brittle, with a melting temperature of 175 °C; P(HB/HV), instead, is more flexible and impact resistant according to the content of hydroxyvalerate (HV) units.
In PHAs mixed microbial cultures (MMC) process, polymer production and composition strongly depend on the operating parameters, mainly on the composition of the feeding solution and pH [
8]. Few studies [
9,
10] have described the effect of pH on the rate and yield of polymer accumulation, typically indicating a higher production when the pH is controlled between 8 and 9. Along this line, it was found [
11] that pH also plays a pivotal role on the regulation of the ratio between HB and HV monomers. This finding is particularly relevant since the pH can be used as a tool to regulate the HV content in the P(HB/HV) copolymer, regardless of the composition of the feeding. Moreover, to optimize the control of polymer composition, an innovative strategy could be to simultaneously regulate the pH as well as the rate of addition of the feeding solution in the PHAs accumulation stage. Indeed, when precursors of HV formation (i.e., propionic and valeric acid) [
12] are depleted in the medium, only the HB monomer can be produced.
Data regarding PHA producing bacteria and assays for their identification were described in depth in Frison et al., 2021. The variation of the microbial community and identification of specific strains involved in the PHA production process were investigated through polymerase chain reaction denaturing gradient gel electrophoresis (PCR-DGGE) and fluorescence in situ hybridization (FISH) analyses. The results confirmed a relative abundance of the genera Thauera (58.2 ± 11.1%), Paracoccus (19.1 ± 5.2%) and Azoarcus (17.4 ± 4.9%) [
13].
Activated sludge from wastewater treatment plants (WWTPs) is a known source of PHAs-storing organisms [
14]. PHAs production from mixed cultures is accomplished by a sequence of operations: (i) acidogenic fermentation to produce volatile fatty acids (VFAs) from biodegradable organics; (ii) selection of PHAs storing biomass in a sequencing batch reactor (SBR); (iii) batch step to maximize PHAs accumulation in the bacteria cells. The carbon limitation strategy under feast and famine conditions has been found to be favorable for the enrichment and long-term cultivation of PHA-producing bacterial communities, while nitrogen limitation is a successful strategy that can be employed to accomplish high PHAs contents during the PHAs production step [
15]. However, these processes are completely aerobic and energy-intensive; it is estimated that approximately 39 MJ are needed to produce 1 kg of PHAs when aerobic accumulation is employed [
16,
17].
Therefore, it would be desirable to develop more economic ways for PHAs production and new business models for their deployment. One strategy could be the integration of PHAs production within existing waste-treatment processes, i.e., by eliminating the cost of the carbon source while synergistically enhancing the efficiency of the waste-treatment process itself.
An attractive way would be to integrate microalgal culturing into the wastewater treatment process [
18]. However, this strategy will require a redesign and upgrading of the current treatment plants by substituting the current biological unit with a microalgae-based one, which also requires adequate climatic conditions (see for instance the demonstrative installation of the ALL GAS project located in Chiclana in the South of Spain [
19]). In contrast, solutions that integrate microalgae as a side stream process (i.e., in the so-called sludge line) have been proposed. Microalgae are grown by profiting of nutrient-rich side-stream (the liquid fraction of digestate) and CO
2 rich-streams coming from anaerobic digestion, either as off-gasses from biogas combustion or as CO
2 from biogas upgrading [
20,
21]. In this scenario, the microalgae-based nitrogen conversion would reduce the N load to be dealt with by the main activated sludge treatment, thus reducing the associated energy cost. At the same time, microalgal biomass could be sent to the local anaerobic digester to be converted into biogas thus improving the energy balance of the plant or could enter additional process units to be converted into more valuable products such as biofillers [
22] or biofertilizers [
23]. Moreover, microalgal biomass is a potentially exploitable source for the production of VFA-rich streams via acidogenic fermentation. An interesting aspect is the production of propionic and butyric acid that is expected from the fermentation of protein-rich substrates such as microalgae [
24], which could obtain a wide range of PHA copolymers. However, the production of VFA through fermentation of microalgal biomass and the consequent conversion to PHAs has received little attention and needs further study [
25,
26,
27].
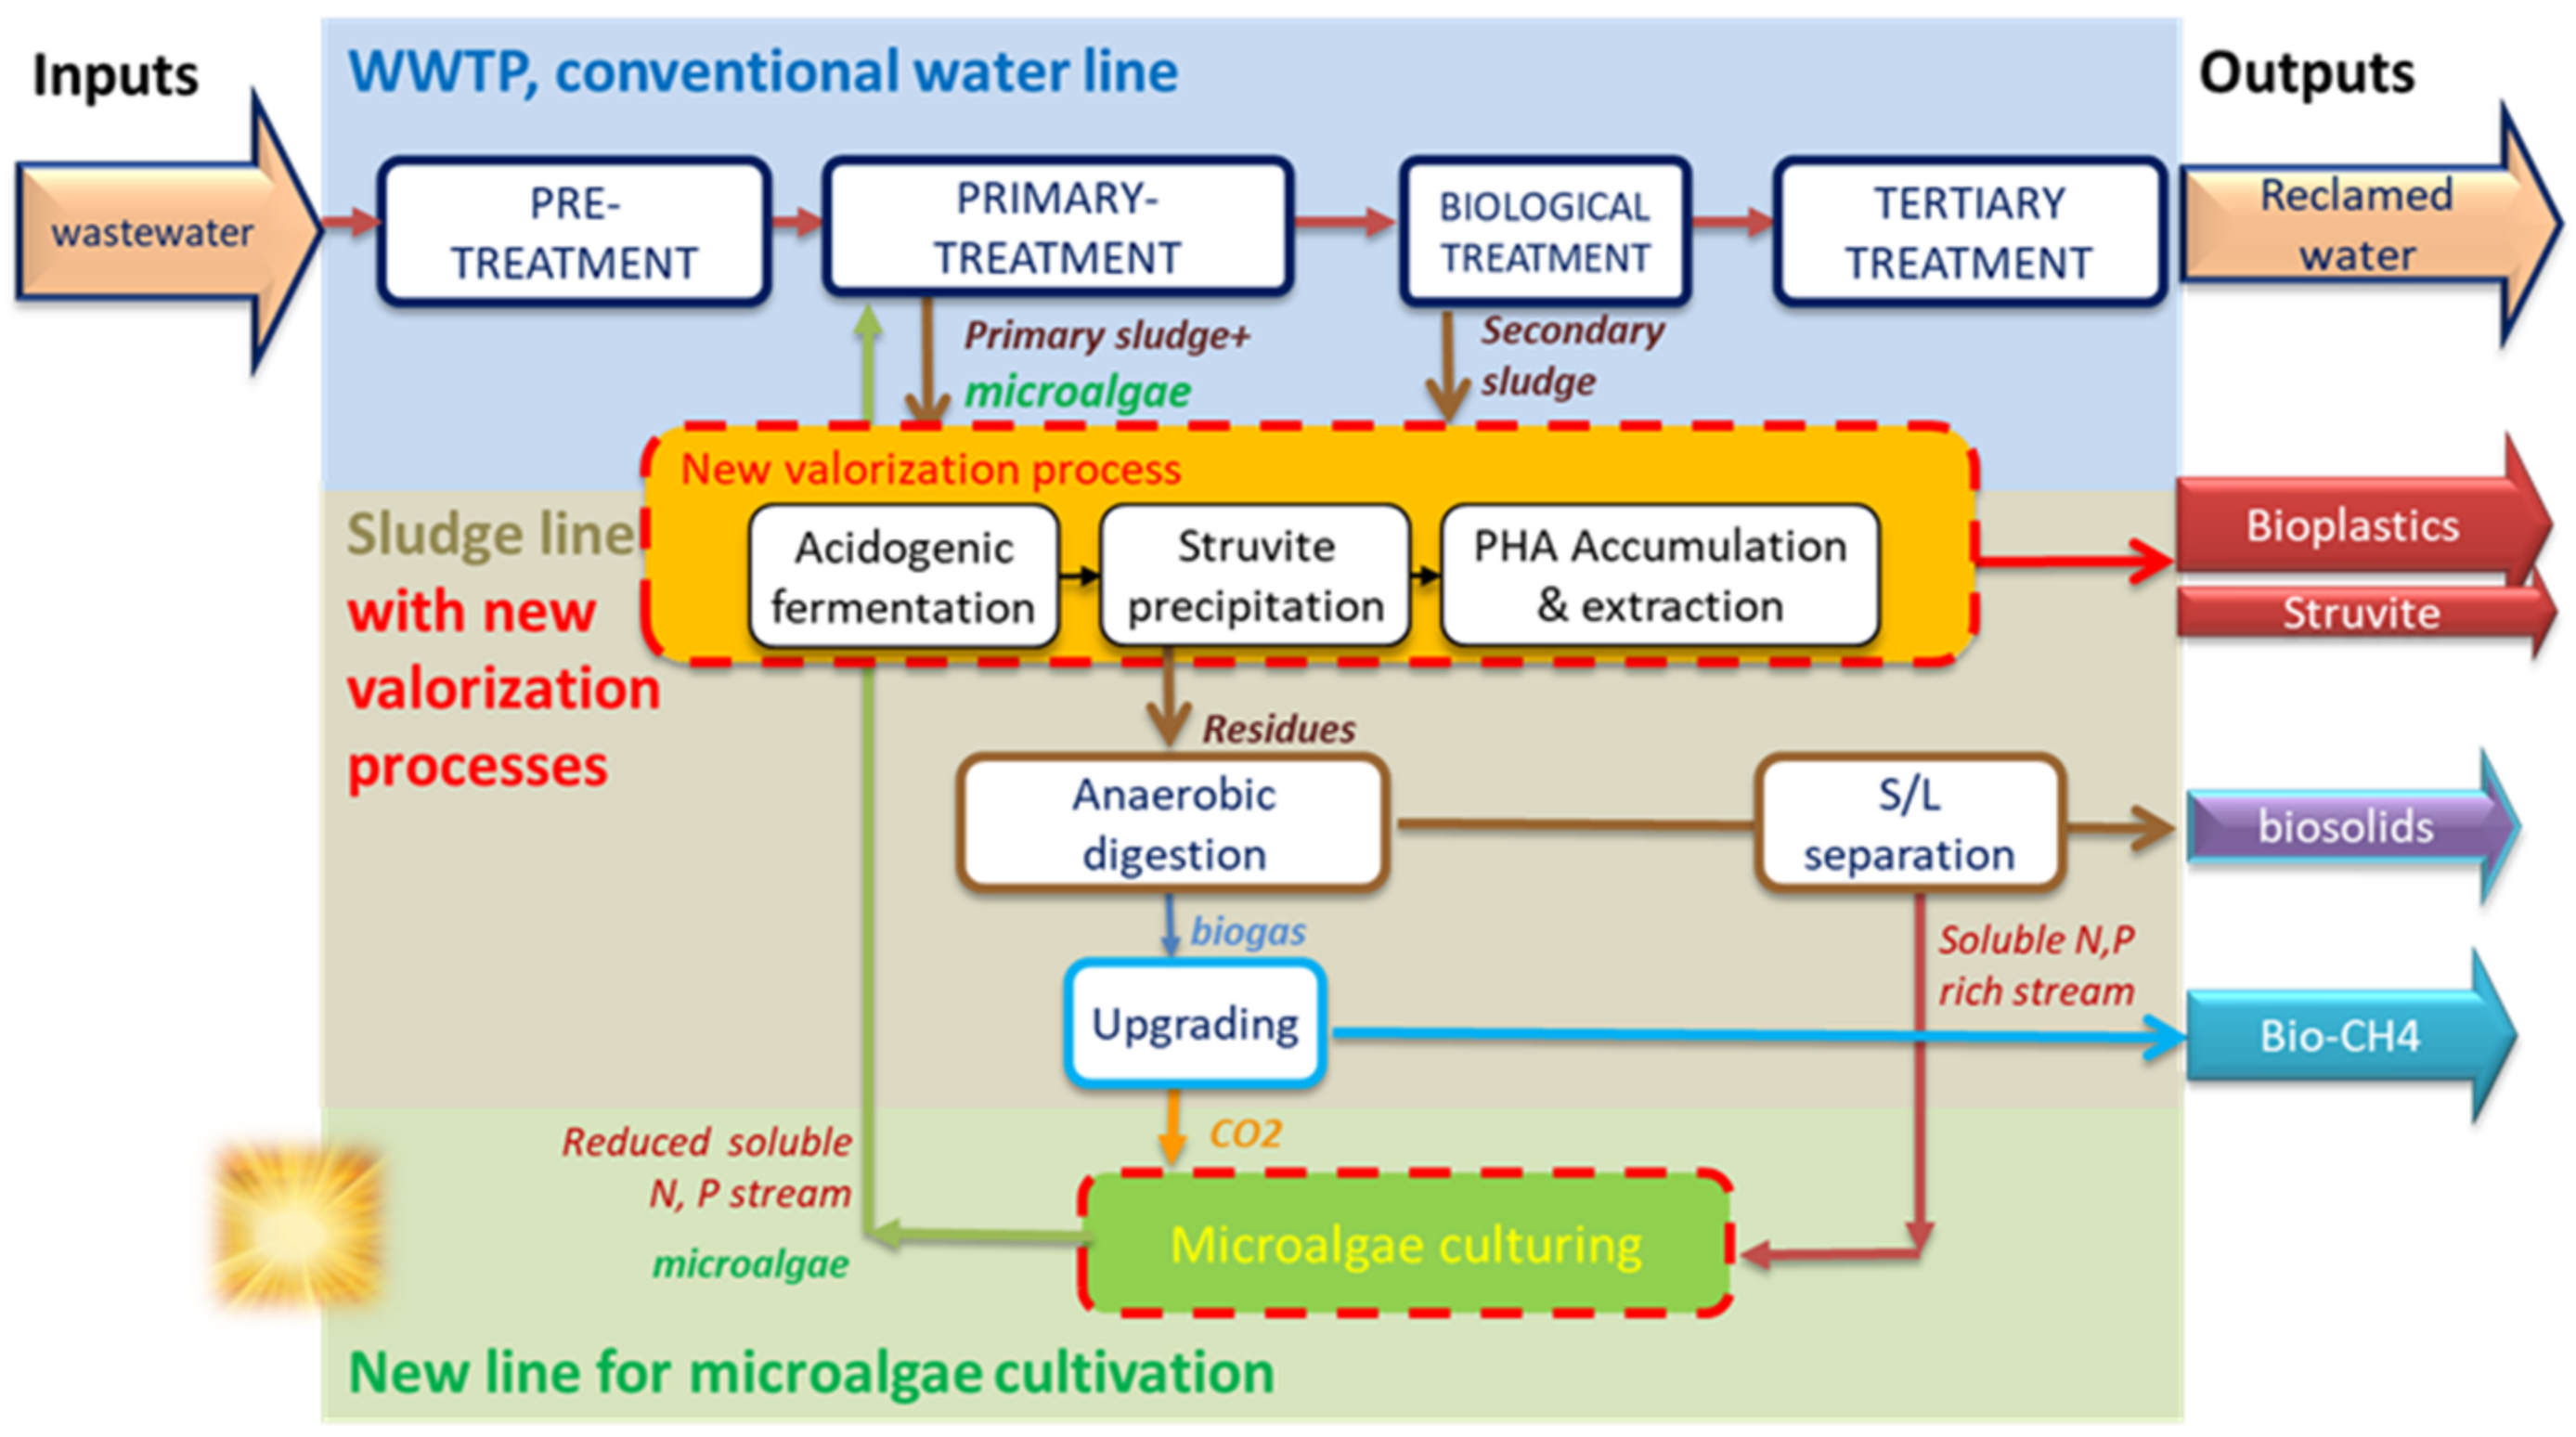
In this paper, a process chain (
Figure 1) is considered for its potential to improve the recovery of materials from WWTP in an energy-effective way, including:
microalgal culturing on the liquid phase of digestate, which is rich in nitrogen and phosphorus and on CO2 from biogas upgrading, thus converting solar energy and inorganic nutrients into microalgae biomass via photosynthesis;
acidogenic co-fermentation of waste activated sludge and microalgae to produce a fermented liquor rich in volatile fatty acids (VFA);
separation of the nutrients (N and P) released during the fermentation process to produce struvite, a slow-release fertilizer;
biological conversion of the VFA mixture into bioplastics (PHAs) by using selected PHAs storing biomass through feast/famine strategy and recovery from PHAs from the bacterial biomass.
Figure 1.
Typical WWTP scheme and additional treatments for resource recovery from wastewater as red dashed items: (i) Microalgae culturing on the liquid fraction of digestate and CO2 from biogas upgrading; (ii) waste sludge and microalgae valorization to bioplastics and struvite.
Figure 1.
Typical WWTP scheme and additional treatments for resource recovery from wastewater as red dashed items: (i) Microalgae culturing on the liquid fraction of digestate and CO2 from biogas upgrading; (ii) waste sludge and microalgae valorization to bioplastics and struvite.
The main advantages of this process chain include: (i) the amount of biomass that can be fermented to VFA for struvite and bioplastics production is increased, compared to the fermentation of the sole waste sludge; (ii) the nutrient loads that are returned to the waterline are reduced, thus limiting the energy/chemical demand; (iii) the proposed technology is suitable for being integrated into existing or new WWTPs, even under sub-optimal climatic conditions for microalgae culturing. Indeed, the microalgae treatment is not responsible for meeting the final effluent quality, relieving the consequences of the seasonality and climatic dependence, which is one of the main constraints in microalgae-based treatment. The above-described treatment chain was tested at the laboratory- and pilot-scale up to the biopolymers and biocompounds characterization (composition and structural features) with a view to their potential marketability. The scheme of this process is shown in
Figure 1.
3. Results
3.1. Batch Co-Fermentation Tests
Batch tests revealed the potential VFA production from the tested substrates. Results are summarized in
Table 3 and
Figure 3, where pH at the beginning/end of the experiment, the Da value (in gCOD/gVS) and the VFA speciation are reported. A first comparison can be made between tests performed with (B2.1) and without (B1) inoculum. The degree of acidification in B2.1 was much lower than that in B1 likely because of the higher operational pH. The Da of B1 was 0.3 on day 10, and even higher (0.47) on day 22 when a higher pH of 6.1 was observed, suggesting that methanogenesis took place in the last week of this batch tests. In the B2 set, the inoculum was used to accelerate the fermentation process and shorten the test duration. In this set, low but measurable methane production was observed. A methane percentage in the biogas between 30 and 40% was measured in all bottles on the day of maximum VFAs production. However, the final methane yield remained below 5(%) as COD, suggesting that the inoculum pretreatment slowed down the methanogenic activity but did not fully prevent it.
In
Figure 3, the VFA composition is reported. Acetic acid was always the main VFA component at the beginning of the test (day 3), while its percentage was generally lower at the end of the acidification tests as a consequence of the onset of methane production. Acetic acid conversion to methane was slower in test B1, where no anaerobic inoculum was used, and in B2.5, where algae were the sole substrate and the overall acidification process was slightly less efficient, as suggested by the lower degree of acidification, thus resulting in delayed methane production.
Co-fermentation tests were performed to identify possible synergistic or competitive effects between the two substrates, namely waste sludge and microalgae. Starting from the VFAs concentration obtained in bottles with only waste sludge and microalgae (B2.1 and B2.5), the expected total VFAs’ concentrations in the other bottles were computed, assuming an additive contribution of the co-fermented substrates. These expected values were then compared to those obtained experimentally in the co-fermentation bottles for the day of maximum VFA accumulation. Note that in this evaluation the amount of biogas produced was accounted for as extra acetic acid. Results showed that, though concentrations of VFAs higher than the theoretical ones were detected for two of the three mixtures (by 22% and 12% for the mixtures B2.2 and B2.3, respectively), the co-fermentation of these two substrates leads to very limited synergistic or competitive effects.
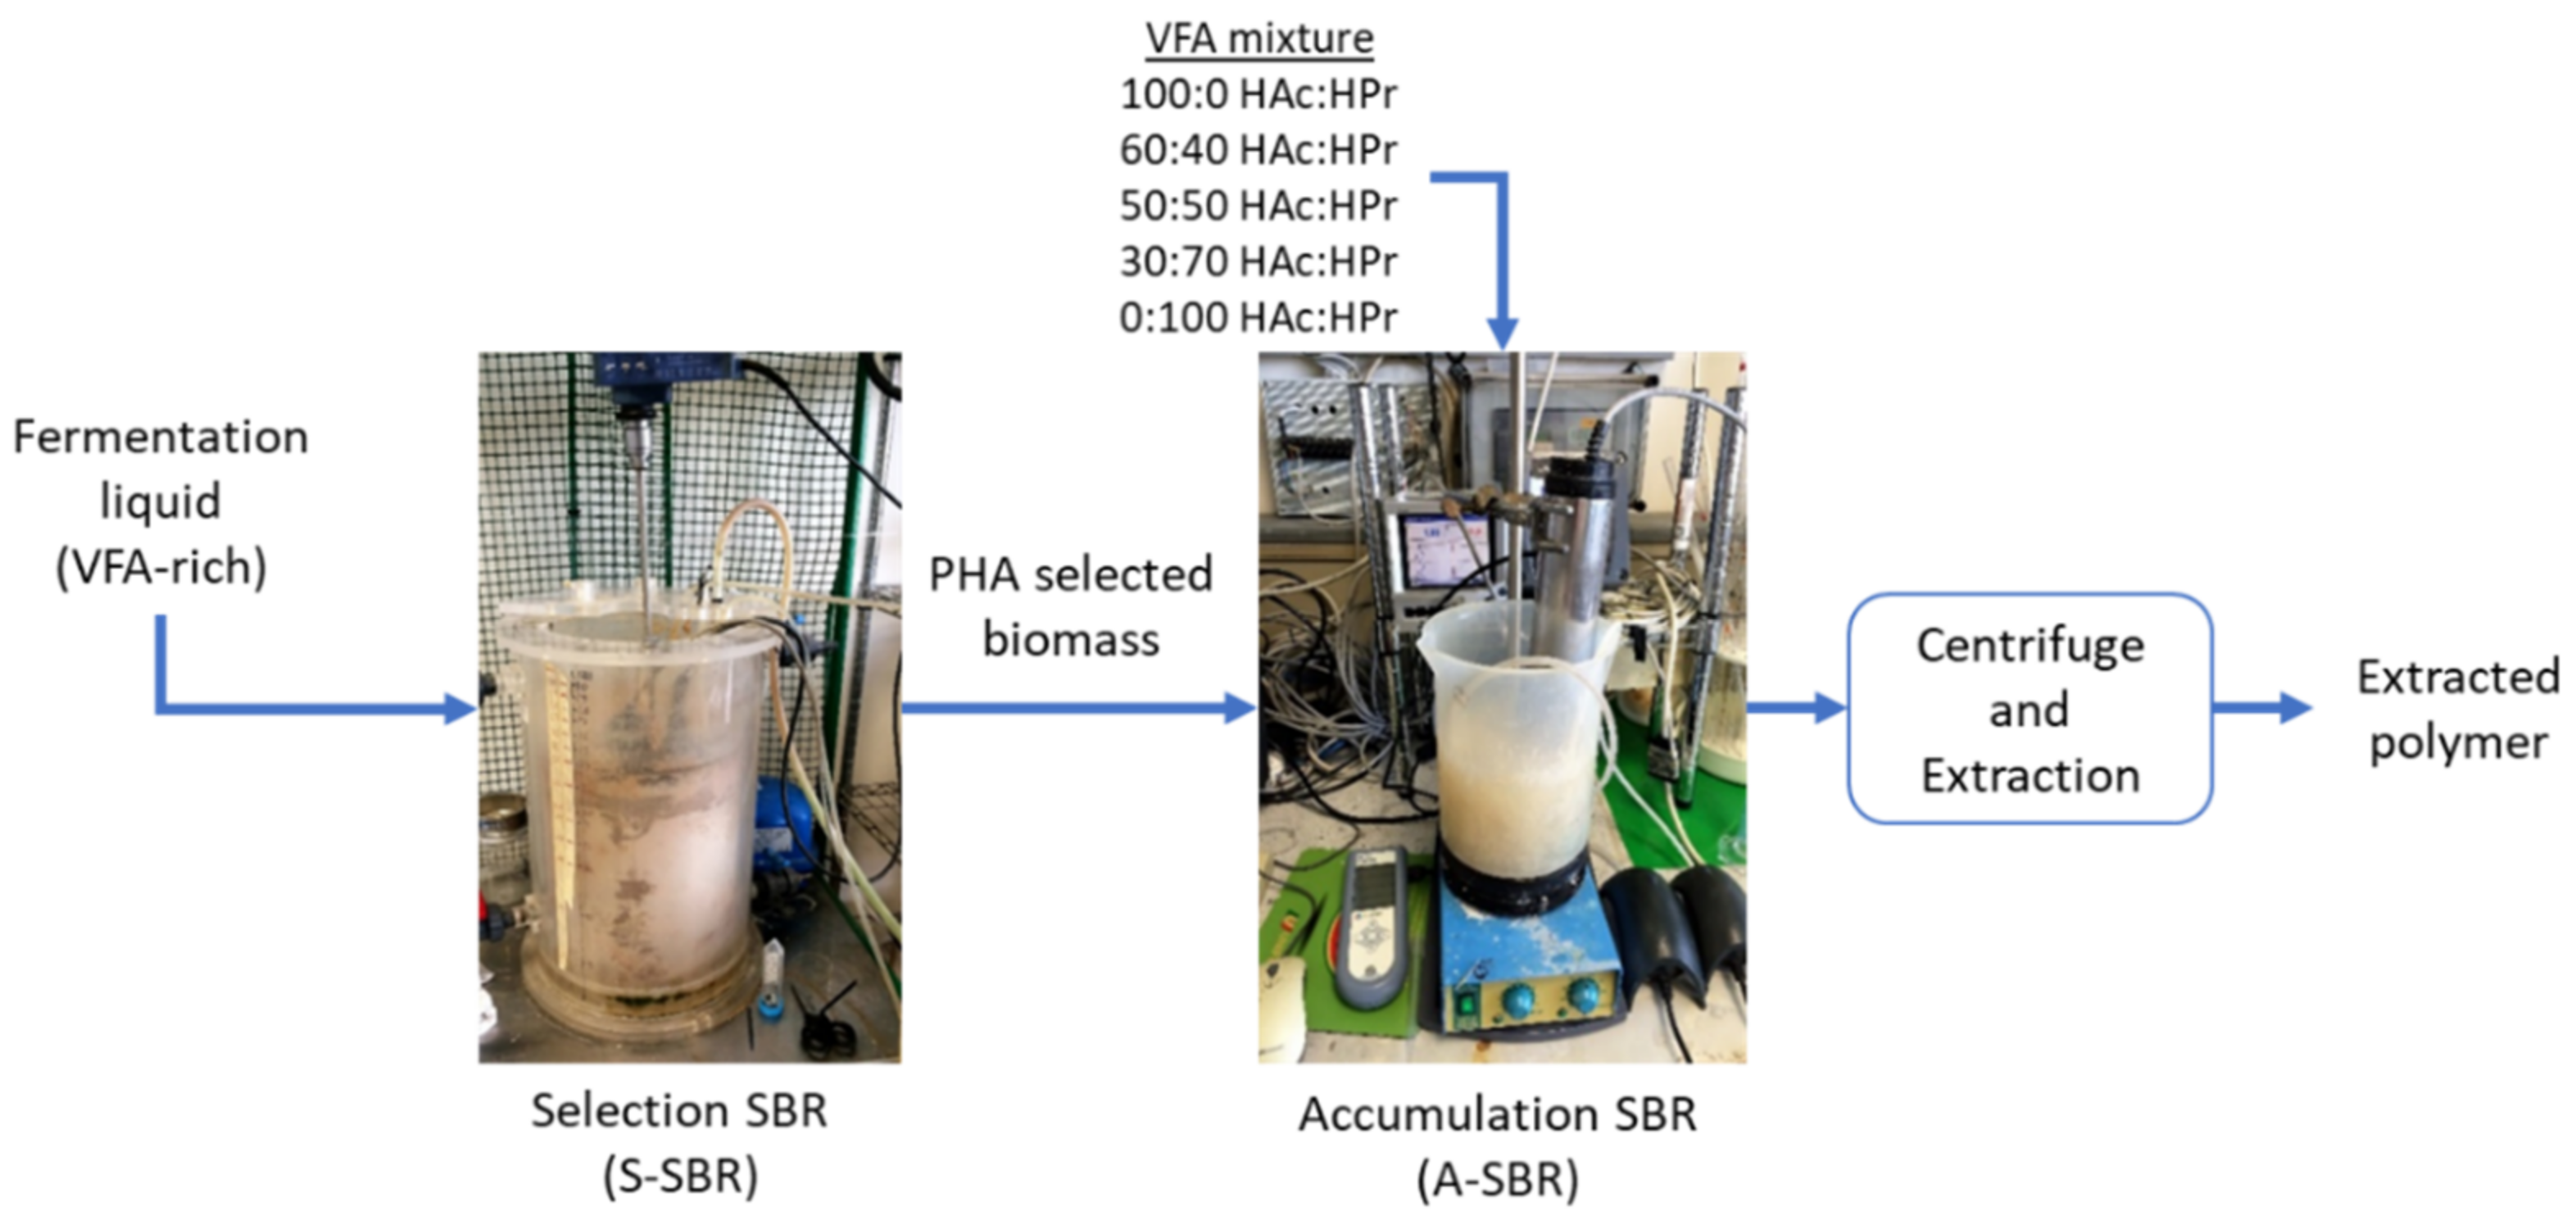
The effect of the composition of the VFA-rich liquor on the PHA production was then tested. Focusing on varying the proportion of the two main VFAs that were found in co-fermentation tests. For each substrate composition as HAc:HPr studied, except for 60:40 HAc:HPr, two batches of PHAs were produced at different times, approximately at a distance of two months from one another (named batch I and II).
After solvent extraction using chloroform, the extracted PHA masses were measured, and dry weights were calculated. The extraction process showed a maximum of 26 wt% for the first batch of PHA produced using 50:50 HAc:HPr as a carbon source.
3.2. Compositional Analysis
Compositional analyses, carried out by
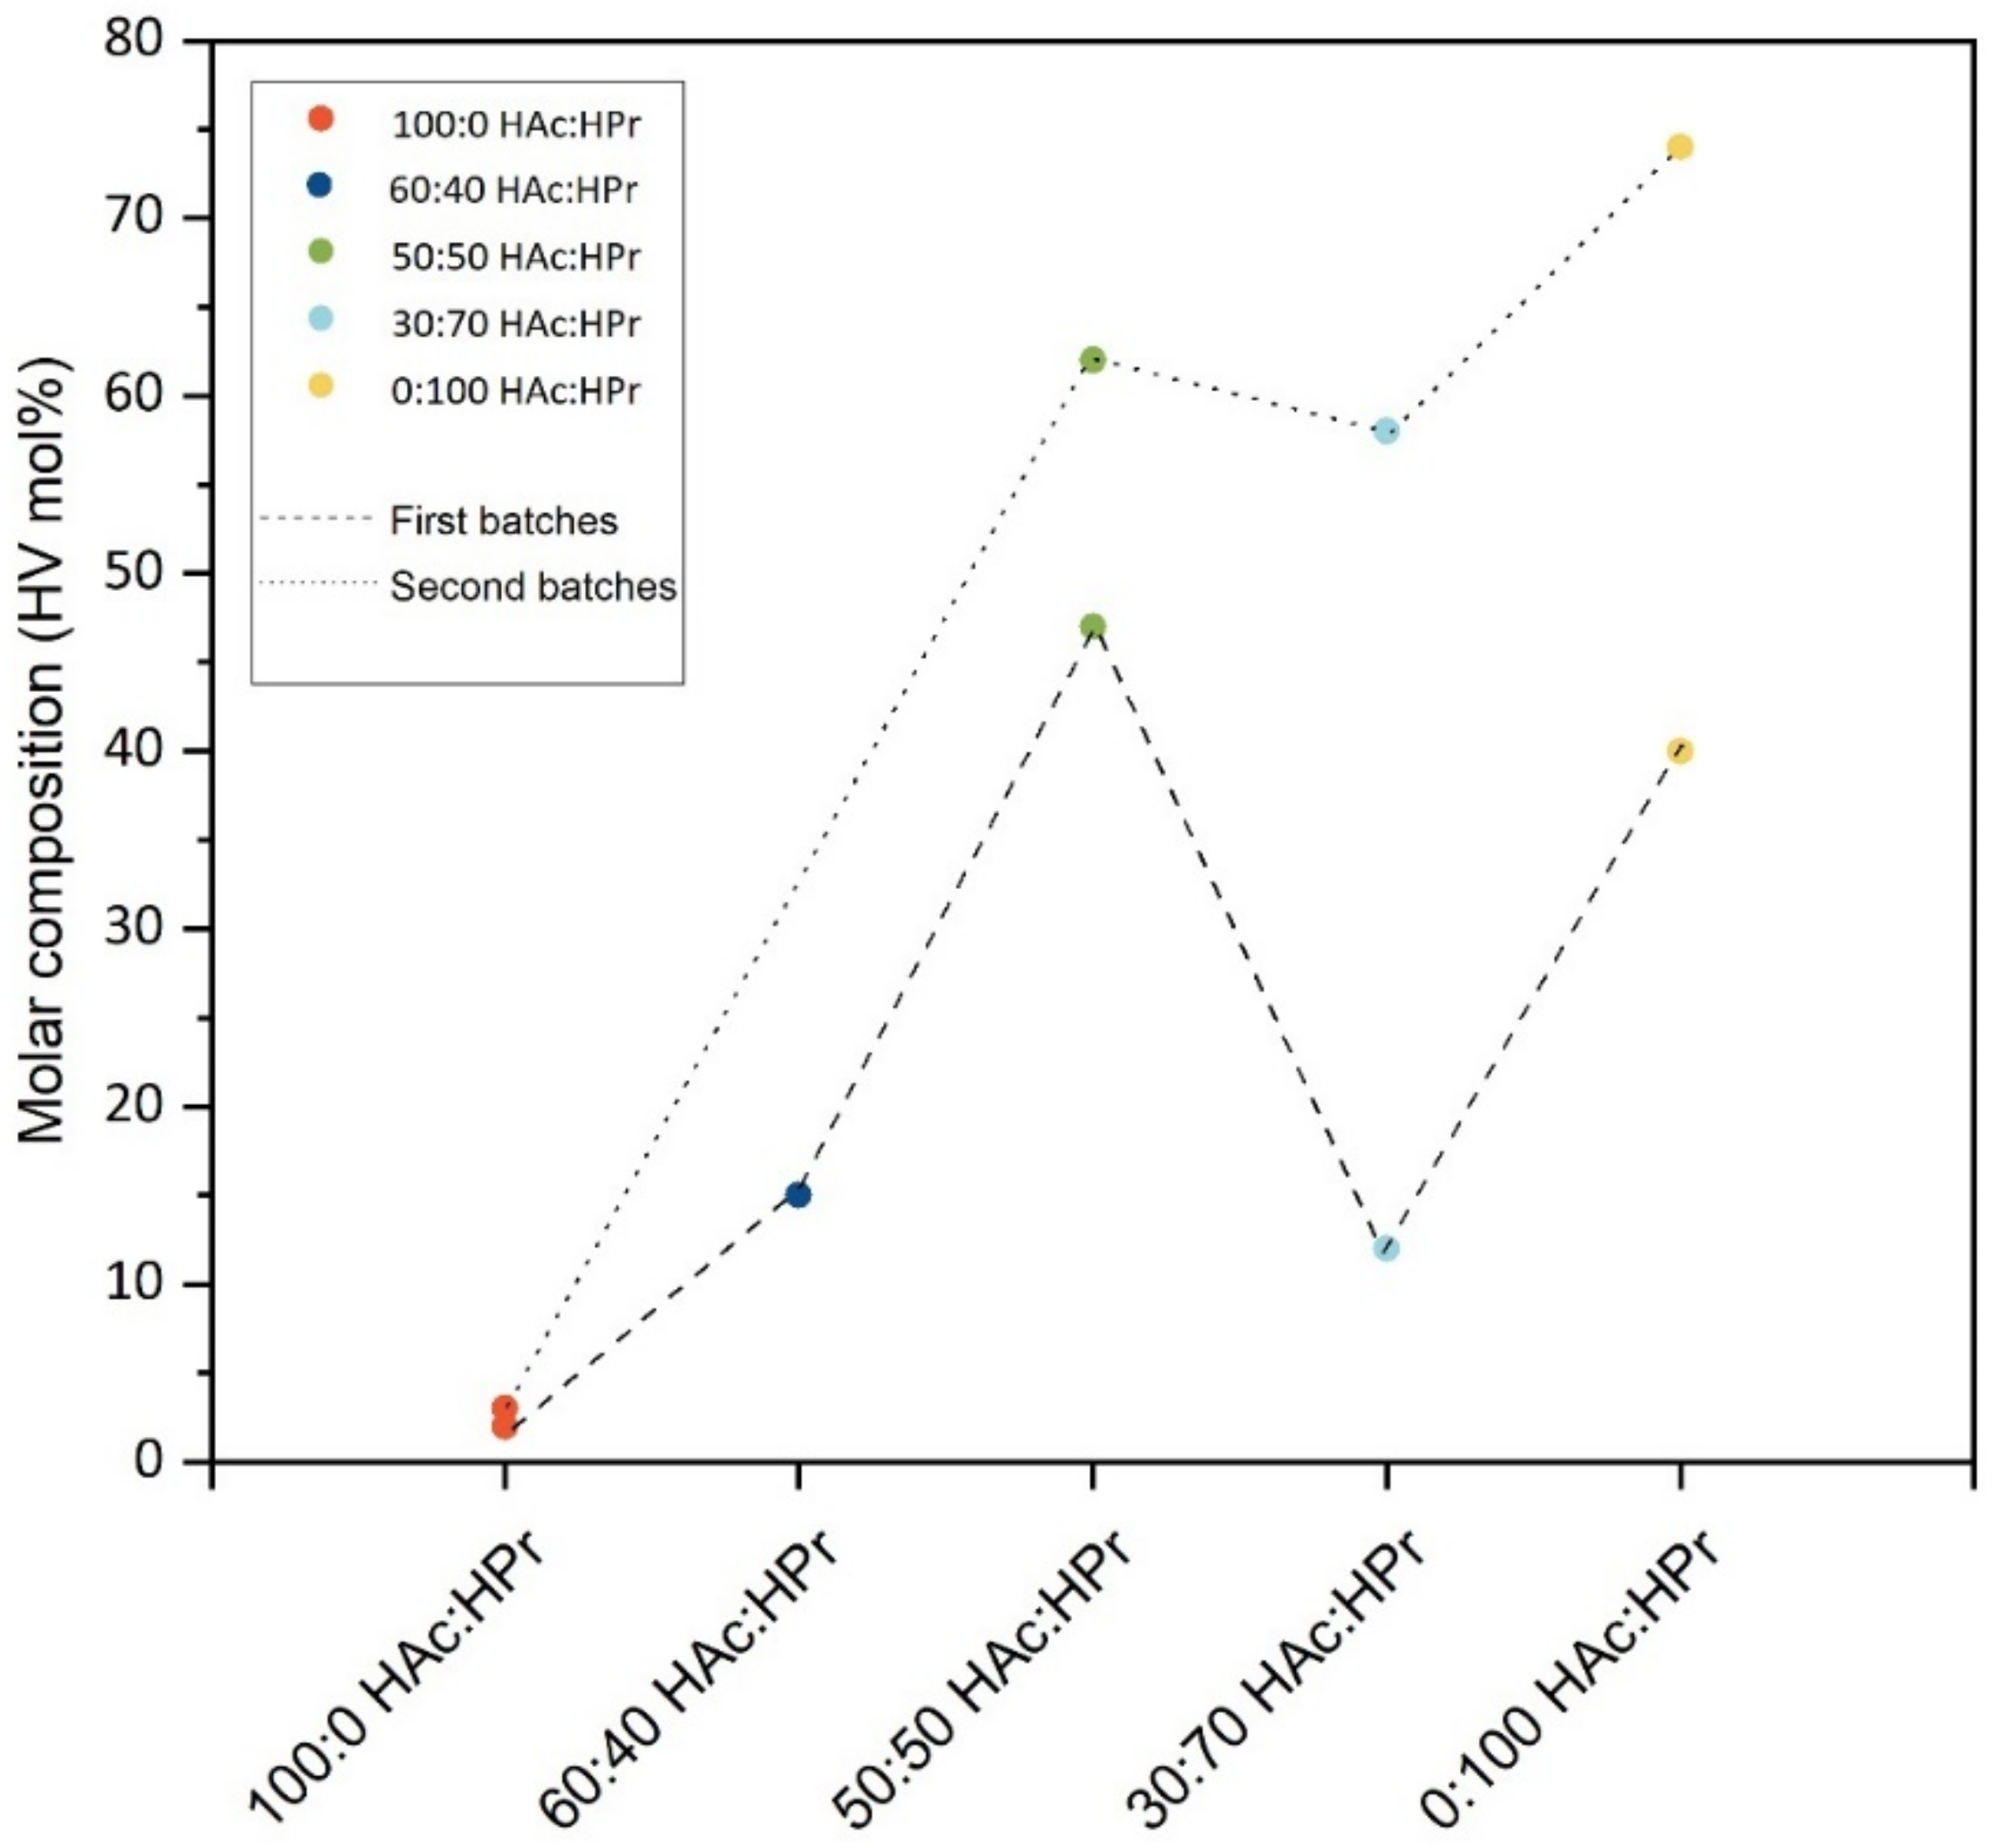
1H-NMR, highlighted that all the extracted PHA were PHBV copolymers, with a variable content of HV units. To highlight the qualitative trend, the results are reported in
Figure 4.
Using HAc only as a substrate, the PHAs obtained are copolymers, with a minimal amount of HV, equal to 2 mol% and 3 mol%. By increasing the HPr relative content over the HAc, the HV units tend to generally grow as reported by both the dashed (first batches) and dotted (second batches) lines and reach a maximum value of 66 mol% when only HPr was chosen.
However, this trend has some exceptions: firstly, it is evident that the molar content of HV units decreased using a substrate 30:70 HAc:HPr with respect to the 50:50 ratio, for both batches; secondly, the use of the same HAc:HPr ratio in the two batches produced copolymers that had a highly different content of HV units.
The exception found that using as a substrate 30:70 HAc:HPr could be related to the poor acclimation of the PHA storing biomass to uptake propionic acid faster than acetic acid. Indeed, this composition of VFA differed significantly from the fermentation liquid (VFA-rich) used during the selection of PHA storing bacteria, which was characterized by a higher HAc:HPr ratio.
The comonomer sequence distribution in the copolymeric chains was evaluated by 13C-NMR. For the samples rich in HB units (97 mol% and 98 mol%), obtained by a substrate of 100:0 HAc:HPr, a quantitative evaluation of the relative intensities was not possible.
3.3. Molecular Weight Measurement
An accurate determination of the true molecular weight requires a dilute solution viscometry measurement. However, the Mark-Houwink parameters have only been reported for the PHB homopolymer. Therefore, in this study, molecular weight measurements of extracted PHAs were conducted by dilute solution viscometry only for PHA produced with 100:0 HAc:HPr. In fact, due to its limited HV unit content (2 mol%), it was possible to estimate the molecular weight with an acceptable error, using the Mark-Houwink parameter for the homopolymer. For all the other PHAs, being copolymers at high content of HV units, GPC was used, with the advantage of having more complete information.
For the first batch of PHA produced with 100:0 HAc:HPr, the computed viscosity average molecular weight,
, that corresponds to the weight average molecular weight
in first approximation, is
. Such high
was expected: it is known that the molecular weight of PHAs synthesized by biological means is much higher than that achieved chemically [
35].
GPC analyses were performed on all the other batches of PHAs. The results are reported in
Table 4 in terms of weight average molecular weight
, number average molecular weight
and polydispersity index PDI. By averaging the values for all the GPC measurements, it is obtained:
3.4. Thermal Analysis
DSC was carried out on PHAs samples to investigate their thermal behavior.
In
Figure 5, the response to the heating scans is reported for the first batches of each ratio (HAc:HPr) of the tested carbon source. Scans are stacked in order of increasing HV content materials, going from the top (lowest content of HV) to the bottom (highest content of HV). The acquired data for all the extracted PHAs are summarized in
Table 5, reporting the melting peaks with the associated enthalpy of fusion. It should be noted that the first heating scan was used for the determination of Tm since in the second heating scan the lower melting components were no longer evident due to insufficient time for crystallization.
Focusing on the thermogram obtained from the first heating scan (
Figure 5a) on the as-produced PHAs, the complexity in the thermal response of the materials, which appear to be semi-crystalline, is evident. In particular, PHAs with a low content of HV show a single melting peak at a temperature above 160 °C; by increasing the HV unit content, other melting peaks were evidenced. During the second heating scan, instead, independently of the copolymer composition, all samples showed a single melting point at the same temperature interval, corresponding to the highest melting peak of the first heating scan. The lower melting components were no longer able to crystallize due to insufficient time, implying slow crystallization kinetics associated with those domains.
Figure 6 shows the melting temperatures and the corresponding enthalpy of the samples.
In
Figure 6, the trend in terms of Tm and the associated fusion enthalpy is shown for the two consistently evident phases. In fact, because of the clear distinction between the high- and low-melting peak regions observed, they have been considered as independent domains, with the enthalpies being separately determined.
The degree of crystallinity
χ was evaluated. One of the standard methods for determining
χ of semi-crystalline copolymers is by comparing the area of the melting peak (
) with the melting enthalpy of a 100% crystalline material (
):
For PHBV, the value of
for the wide spectrum of composition observed in this work is not available in the literature. However, an estimate of the heat of fusion of an infinite crystal of PHB and PHV is reported to be 146 J/g (
) and 131 J/g (
), respectively [
36].
These two values have been used to obtain a rough estimation of χ. In particular, by considering the two well-defined melting peaks at T < 160 °C and T > 160 °C, the fusion enthalpy of the HB-poor domain (T < 160 °C) was normalized to , while the fusion enthalpy of the HB-rich domain (T > 160 °C) was normalized to . This calculation assumes, as a first approximation, that the limited amount of HB units in the HB-poor domain and the limited amount of HV units in the HB-rich domain would not excessively modify the values of .
A specific trend is not observed: the crystallinity seems to be independent of the HV unit content.
3.5. Solvent/Non-Solvent Fractionation
To further validate the result that extracted PHAs in this study are mixtures of random copolymers or block copolymers, and specifically analyze the properties of the different phases, a solvent/non-solvent fractionation was carried out. This process was performed on a single batch, which showed high parameter D and two well-defined melting peaks in DSC analyses. In particular, P(3HB-co-58% 3HV), produced by a substrate of 30:70 HAc:HPr (second batch), was selected. The solvent/non-solvent fractionation resulted in the separation of four fractions, which were analyzed in terms of
1H-NMR,
13C-NMR, GPC and DSC. The four fractions obtained are labeled with a number from 1 to 4, moving from the firstly precipitated fraction to the last one. The results are summarized in
Table 6.
The PHA recovery resulted in 83 wt% of the polymer used in the procedure.
The precipitated fractions showed homogenous results in terms of molecular weights and PDI, coherent with the data reported in
Table 4 for the extracted PHA used in the fractionation procedure. In particular, averaging the values among the fractions, the obtained results for the molecular weights and the polydispersity index are:
It is to highlight that GPC requires the solubility of the polymer in THF, therefore the molecular weight measurement could not be carried out for fraction 1. On the contrary, the other fractions showed a better solubility, even though, for fraction 2 and fraction 3, the solution required filtration before being analyzed.
The first heating scan from the DSC analyses for the extracted PHA before being fractionated and the four fractions are reported in
Figure 7.
As expected, fraction 1, showed a high Tm (172 °C), which tends to confirm that it corresponds to pure PHB. Fraction 2, having 11 mol% HV, shows a shift at lower Tm: one peak is located at 169 °C with a shoulder, and another at 150 °C. Fraction 1 and partially fraction 2, together, constituted that part of the as-produced copolymer, which was named as HB-rich domain, had a Tm at 168 °C. Fraction 4, having 88 mol% of HV units, is the HB-poor domain, with a Tm of 106 °C, very close to the low melting peak of the as-produced copolymer, centered at 101 °C. An intermediate condition was found for fraction 3, showing a multi-melting peak (Tm at 101, 115, 142 and 170 °C) in the DSC thermogram. The presence of more than one peak suggests that this fraction itself was still constituted by different copolymers in terms of the HV:HB ratio. Indeed, the highest (170 °C) and the lowest (101 °C) peaks suggest that fraction 3 was partially constituted by those copolymers present in fractions 2 and 4, respectively. In addition, the peak at 142 °C could be attributed to the intermediate peak visible in the thermogram of P(3HB-co-58% 3HV) at 138 °C (referring to
Figure 5). The peak at 115 °C, instead, was not visible in the thermogram in the material before being fractionated.
13C-NMR was carried out to define the sequence distribution diads and parameter D of the fractions obtained. As mentioned above, fraction 1 could not be analyzed due to the insolubility problem suggesting that it was constituted by HB units only (PHB), or with only trace amounts of HV. All the fractions showed D smaller than 24.0, which was the value obtained for the extracted PHA used in the fractionation procedure, but higher than 1.5, suggesting that they were still blends of copolymer or block copolymers. Fraction 2 and fraction 3 showed the highest values, 18.8 and 9.6, respectively. These values are coherent with the presence of more than one melting peak, as previously discussed (
Table 5), and define the presence of blends of copolymers in these two fractions. Fraction 4, instead, showed a D of 2.2, which is smaller, coherently with the presence of a single melting temperature at 106 °C in the DSC analyses. However, since the value is larger than 1.5, it is possible to assume that fraction 4 is a block copolymer. The presence of blocks, in terms of long sequences of HV units in the polymeric chains, could justify the ability of these copolymers to crystallize. In fact, fraction 4 showed a large fusion enthalpy (82 J/g) associated with its melting peak, which suggests a high degree of crystallinity. As a rough approximation, assuming the melting enthalpy of a 100% crystalline of this material similar to that of PHV (
J/g) [
37], the degree of crystallinity would correspond to 63%.
3.6. Characterization of a Reference PHA
The PHA obtained was characterized with the same methodologies of the previously described polymers. The composition analysis suggests a 41% molar concentration of HB and a 59% molar concentration of HV, with an alternate copolymer structure (D = 1.9). GPC analysis provided the following parameter for the molecular weight:
The thermal analysis showed two melting temperatures, one at 101 °C with an enthalpy of 52 J/g and one at 177 °C with a smaller enthalpy of 9 J/g. None of these peaks were able to crystallize and are not present in the second heating. The glass transition occurs at −7 °C. The estimated degree of crystallinity is 46%. These results are not significantly different from those obtained with other PHAs, whose results are reported in
Table 5. Therefore, it is possible to assume that the range of values obtained in the present study can be a useful basis to predict the possible outcomes of the final PHA.
4. Discussion
As for the co-fermentation of algal biomass with waste-sludge, results show that the composition of the other VFAs changed according to the nature of the substrate. Indeed, the bottle fed on algae is the only one showing a relevant concentration of iso-butyric acid (up to 36%) while the percentages of propionic acid were negligible at day 10. On the contrary, waste sludge fermentation led to a relevant production of propionic acid. The co-digestion of algae and waste sludge led to the highest proportion of acetic and propionic acid (41–51%), indeed the highest percentage of propionic acid is being observed in B2.4, when similar amounts of algae and waste sludge were digested. Since pH was quite homogeneous in all B2 bottles, the observed differences in the VFAs speciation are to be attributed to the substrate nature. The composition of VFAs reflects the metabolic pathways of a specific carbon source. The microalgal biomass is typically rich in proteins (up to 52% on weight basis) and lipids (up to 23% on weight basis) [
38,
39]; this composition supports butyric and valeric acids production [
40]. Carbohydrate-rich waste streams support acetic and propionic acid production [
41]. It is also important to underline how operating conditions influence results: pH values slightly below neutral conditions (as in all these cases) promote acetic and propionic acids production [
42]. As for VFA composition, at the end of all co-fermentation tests, the VFA mixture included all acids, with a more significant presence of valeric acids compared to the mono-fermentation trials. Results of these batch tests suggest that algal biomass and sludge can be effectively co-fermented with a final fermentation efficiency well in line with that computed from results from mono-fermentation tests; the final composition of the VFA mixture includes all acids with a prevalence of propionic and valeric acids.
As for PHA production by MMC, the PHA weight percentages obtained are not compatible with the recent results reported in the literature. In fact, PHA contents and production rates of MMC are reported to be comparable or superior to those of pure culture [
43]. The reason for the low extraction PHA weight percentages can be related to the low a concentration in the initial biomass, due to the different mixture of VFAs used in the A-SBR compared with the S-SBR. The change in the type of carbon source could have negatively affected the uptake rate of the VFAs thus decreasing the final PHAs productivity.
Compositional analysis showed results in agreement with the literature [
44,
45,
46], an increase in HV units in the copolymer has been observed by introducing HPr in the substrate. However, the first batches with 30:70 HAc:HPr and 0:100 HAc:HPr showed molar contents of HV of 12 mol% and 40 mol%, respectively, which are much lower if compared to the molar contents of the second ones, equal to 58 mol% and 74 mol%. Therefore, a certain variability in the batches produced in the same operational conditions has been observed. This fact, which is in line with some papers in the literature [
36], is a well-known characteristic of biological syntheses, where many variables are involved in the process. In addition, it is relevant to highlight that PHAs were produced by a MMC whose precise composition can vary from one selection to another. Moreover, since a few months between the first and second batches had passed, variability in the bacteria population and the accumulation behavior was expected. Finally, it must be mentioned that the SBRs used for the accumulation procedure are located outdoors, and hence temperature variability can play an important role. As a result, variability in the produced PHAs is not a surprising fact. Obtaining PHAs had a very different composition, with HV units in the copolymer ranging from 2 mol% to 74 mol%; they had the positive effect of making the investigation of property variations for a large spectrum of the copolymer composition possible.
The microstructural analysis showed that, in all cases, the quantitative evaluation resulted in D much larger than 1.5, which is the value proposed by Kamiya et al. [
33] above which the material is a mixture of random copolymers and/or “blocky” copolymer. However, it should be noticed that the entity of this phenomenon is variable: D ranges between 2.7 and 46.0. In particular, PHAs obtained by substrates 50:50 HAc:HPr (second batch), 0:100 HAc:HPr (second batch) and 30:70 HAc:HPr (first batch) have D equal to 2.7, 10.1 and 13.2, respectively. These are the lowest values obtained, smaller than all the others, which in some cases are higher than an order of magnitude.
These observations are consistent with other studies [
33,
36,
46,
47,
48] dealing with microbial polyester produced by MMC. In particular, Albuquerque et al. [
48] through in situ analysis of substrate uptake capabilities using microautoradiography-fluorescent in situ hybridization, found that MMC enriched and fed on mixed feeds are composed of multiple populations specialized in the uptake of different substrates. Hence, the formation of polymer blends is not an unexpected outcome.
GPC analyses showed that the molecular weights, with
ranging from
and
are in line with the values in the literature [
37,
49]. The polydispersity indices show a medium-narrow size distribution, where all PDI are less than 2, with a single exception for the PHA of the second batch with the substrate 30:70 HAc:HPr having instead a value of 2.78. However, the exhibited variability is expected and found in many other studies [
46,
50]. In fact, in a bio-synthetic process of polymerization of an MMC, many variables are involved.
,
and PDI did not show a specific trend according to the copolymer composition.
Thermal analysis presents a peculiar behavior that is justified by the presence of complex blends, of high- and low-melting copolymers fractions, as previously observed with
13C-NMR analyses, with micro- and/or macro-phase separation leading to domains of differing composition. The parameter D shows values (
Table 4) that are coherent with the results of thermal analyses.
This complex result is not an isolated case: many as-produced microbial PHA polymers consist of blends of copolymers of different compositions and several studies exploring the effect of deliberate blending of different random copolymers of PHAs on polymer properties were carried out [
37]. It is well-established that pure PHB and pure PHV are immiscible in the melt: blends of PHB and PHV contain phase-separated domains in the melt, which crystallize as PHB and PHV type spherulites, respectively [
51]. As a result, the different domains formed melt phases at different temperatures, giving a multi-melting peak curve at the heating scan.
Melting temperatures are not affected by the average composition but the fusion enthalpies show a clear trend. In fact, as expected, by increasing the content of HV units, the enthalpy increases for peaks at a temperature below 110 °C, which were attributed to the HB-poor domain in the copolymer, hence, rich in HV units. The enthalpy gradually decreases for peaks at a temperature above 160 °C, which were attributed to the HB-rich domain in the copolymer, hence, poor in HV units. Consistent with the obtained results, the melting temperatures of PHB and PHV are reported to be approximately 179 °C and between 107 and 112 °C [
36], respectively. However, PHV melting temperature has not been clearly defined yet, in fact, Ishida et al. [
52] reported very high HV content PHBV of narrow compositional distribution with melting temperatures of approximately 100 °C.
Apart from the presence of different copolymers in a blend, multiple melting peaks can be attributed to: (i) melting, recrystallization and remelting during heating; (ii) the presence of more than one crystal modification; (iii) different morphologies; (iv) physical aging; (v) different molecular weight species; and (vi) orientation effects, etc. [
46].
A similar conclusion could be achieved by analyzing the trend of the Tg. It is possible to distinguish two values: one at about −11 °C, corresponding to a more copolymeric domain, and another at about 8 °C, corresponding to the HB-rich domain. The presence of two Tg in almost all the cases confirmed the presence of different domains in the extracted PHAs batches.
Regarding the degree of crystallinity, by averaging the χ across all the tested PHA, χ is in the range of 49% ± 8%. These values are coherent with the crystallinity reported in the literature: crystallinities of around 60% for copolymers were observed by X-ray diffraction [
37]. However, the minimum at the pseudoeutectic point is not visible.
It is important to highlight that this kind of estimation of crystallinity is affected by the perfection of the crystals formed. Indeed, Chen et al. [
53] have shown that crystallinity obtained according to this method can be called the “equivalent weight crystallinity”, which means “the number of perfect crystals that can be melted by the measured enthalpy of melting”. The equivalent weight crystallinity does not only depend on the amount of crystals, but also on the perfection of the crystals: a crystal with higher perfection has a larger equivalent weight.
The separated fractions obtained by the solvent/non-solvent extraction technique, as expected, showed a progressive increase in HV units. In fact, the lower the HV content, the less soluble the solution is, and, as a result, the fraction of polymers with the lowest content of HV units was the first to precipitate with the smallest addition of n-hexane, which was used as non-solvent. Fraction 1 of the fractionated PHA was obtained without adding n-hexane, indeed, it was not soluble in chloroform. As a result, this fraction could be characterized neither by 1H-NMR nor 13C-NMR. The insolubility in chloroform, coherently with the DSC outcomes, suggests that fraction 1 was constituted by HB units only (PHB), or with only trace amounts of HV. For the characterizable fractions, the HV content was 11 mol%, 35 mol%, 88 mol% for fraction 2, fraction 3 and fraction 4, respectively.
The results of thermal analysis on the fractions clearly show the presence of many domains with different relative compositions in terms of HV:HB in the extracted polymer. The absence of some of these intermediate peaks for the as-extracted PHAs in DSC scans could be explained considering that the complex mixture of random copolymers or block copolymers, could slow down or eventually suppress the crystallization of the domains with an intermediate content of HV units, having the slowest crystallization rates. In fact, the crystallization rate decreases by introducing HV units in PHB, showing its minimum when PHBV is at its pseudoeutectic composition (corresponding to HV content of about 50%) [
37]. Consistent with this trend, in our study, the two extreme compositions (high HB and high HV content domains) always showed the ability to crystallize, either isolated or in the blend; while the intermediate compositions (around the pseudoeutectic) could not form crystalline structures in the blends, but only when isolated (
Figure 7).


