1. Introduction
Increase of traffic intensity, aging of transportation infrastructure, and insufficient maintenance are just a few of the pavement degradation causes. New materials and technologies, like geosynthetics, play a strategic role to increase pavement service life and performance. Indeed, different technologies and modified asphalt by polymer or rubber, have been introduced and presented as systems to reduce premature pavement failures. Some successful techniques have considered the use of geosynthetic products into the pavement systems to increase its performance [
1]. The geosynthetics most used in pavement construction are geotextiles, geogrids, and geocomposites. These materials can be used with different aims to fulfil one or more specific functions in numerous road construction applications. Geosynthetics are used with different functions in road structure, like reinforcement, stiffening, separation, filtration, drainage, and in barriers (protection).
Considering the reinforcement and stiffening functions: the geosynthetic develops tensile forces that maintain or increase the stability and limit the permanent deformations of the geosynthetic-soil system. Instead, when the geosynthetics are inserted between two layers of different materials with the function of separation, it preserves the integrity and functionality of the two materials. According to the texture characteristics, geosynthetics operate on the filtration function, retaining fine particles or drainage function, allowing liquid (or gas) flow within the plane of its structure. Another application is considering the geotextile as a barrier; in this way, the geotextile minimizes the cross-plane flow, providing containment of liquids or gasses [
2].
Geogrid may be used in different pavement depths to improve the road performance and to prevent or reduce some road distresses [
3,
4,
5]. Real applications, theoretical, and numerical studies show that the installation of geogrids between different layers or within the layer can extend the service life of flexible pavements, improving mechanical properties of pavements in terms of fatigue, permanent deformations, and cracks [
6,
7,
8,
9,
10,
11]. That means a low number of maintenance operations during the entire road service life. In the last years, the management of maintenance interventions on road infrastructure was associated with the assessment of environmental pollution caused by them. The environmental benefits that could be obtained through a wide use of the geogrids as reinforcement of flexible pavement can be studied using life cycle analyses (LCA). Life cycle analyses study the global impact of a complex system on the environmental. The LCA considers different aspects (ecological impacts, resources use, and pollutants generated). The LCA in the assessment of the life cycle of a road pavement was applied to reduce energy consumption and carbon footprint [
12]. Consequently, new materials and construction techniques with the aim to improve the performance and the service life of roads and to minimize environmental impacts are required [
13].
The geogrids reinforcements can reduce stress and permanent deformations, improving the sustainability of road pavements. Geosynthetics must provide higher tensile strength with very low deformation and be stiffer than the material to be reinforced. The position and geometric configuration of the reinforcements have an important effect on reinforcement capability. The cross-sectional area must be large enough to redirect the tensile stresses. High strength polymer grids significantly improve the fatigue life of asphalt pavements and reduce the rutting depth [
14]. The mechanical properties of geosynthetics used have an important influence on reinforcement effect. In particular, the tensile modulus is a critical design parameter, and the reinforcement effect increases as the modulus increases. Since dynamic strains induced in the geosynthetic are relatively small for these applications, the secant modulus value is considered to be the most descriptive design parameter [
15].
In terms of reinforcement, the geosynthetic improves the performance of the pavement through the three different effects: lateral restraint, increased bearing capacity, and tensioned membrane effect [
6,
16,
17]. Moreover, the geosynthetic can be also considered as a stress relief interlayer when it is localized at the bottom of an HMA layer to absorb an important quantity of the energy that would otherwise contribute, as an example, to the crack propagation.
The development of reflective cracks in the overlay is retarded using a geosynthetic stress-relief interlayer, which absorbs the induced stress by cracking in the underlying pavement. The geosynthetic interlayer inside the pavement allows slight movements within, therefore, the stress is absorbed without distressing the overlay. Furthermore, the additional interlayer reduces the shear stress between the existing surface and the new overlay, creating a break layer [
9].
As already mentioned, geosynthetic reinforcement can be considered one of the most efficacious road pavement improvement and rehabilitation techniques [
10]. Fiberglass geogrid is extensively used in asphalt pavement. Different studies confirmed that glass fiber grid, correctly installed near the bottom of the HMA layer, significantly increase the fatigue resistance of the pavement [
12,
18,
19,
20].
In recent years, different studies have successfully applied linear viscoelastic theory to model and simulate the behavior of HMA materials [
21,
22], and 3D and 2D FE models were used to predict rutting of asphalt pavements. Several authors conducted studies to compare the results of the elastic FE model and the linear viscoelastic FE model in road pavement simulations. HMA only behaves elastically at low temperatures, and a linear stress–strain relationship is incapable of predicting the nonlinear responses to vehicular loads. Time, temperature, and stress dependent nonlinear behavior of HMA may only be described by creep deformation or plasticity.
Onyango [
23] applied different existing models to predict rutting in HMA and compared the computed results to that obtained in a full-scale accelerated pavement test.
To simulate the rutting phenomenon, it is important to use a mechanical model that can account for cumulative creep strains [
24,
25,
26].
Sadeghnejad et al. [
27] has considered a 2D FE model, using the creep model developed by Hua (2000) [
28] to predict the rutting behavior of asphalt mixtures, also considering the temperature effect.
Different authors also investigated the effect of time loading on permanent deformation results and proposed a total cumulative time loading approach to simulate a large number of loading cycles in FE simulation [
28,
29,
30].
Only few FE studies applied plasticity model of Drucker-Prager for unbound layers combined with the simple creep law to model HMA in pavement structure [
31,
32].
In this paper, a finite element analysis using the software Abaqus was conducted to study the performance of a geogrid-reinforced pavement subjected to cyclic loads.
The aim of this study was to investigate the geogrid reinforcement contribution in reducing the permanent deformation due to cyclic loads. Through 3D-FEM, a road section reinforced by a fiberglass geogrid was analyzed and compared with a traditional road section, to investigate the benefits offered by the geosynthetic completely embedded at two-thirds of the asphalt concrete layer (AC), in terms of permanent deformations (rutting).
The rutting phenomenon is generally explained as inelastic deformation of the pavement materials caused by the repeated (cyclic) traffic loading. Hence, the principal factor in the pavement rutting simulations is the modeling of the inelastic response of the materials under repeated traffic loads. For these reasons, the constitutive models characterizing different materials were chosen: creep model for AC and base layers, and Drucker-Prager model for sub-base and subgrade layers. Instead, the geogrid is modelled as linear elastic.
2. Materials Behavior and Model Description
2.1. Properties of Materials
Most of the material behavior models used for the design of flexible pavements are based on linear elastic theory and, hence, consider the bound and granular layers to be linearly elastic. This approach does not consider the nonlinear behavior of each layer. According to the literature [
33,
34,
35], and considering the mechanical properties of the materials, creep model and Drucker-Prager (D-P) model were selected to describe the bound (AC and base) and the unbound (sub-base and sub-grade) layers, respectively. This is because the elastic model cannot show permanent strain in bound layers after unloading; the layers rebound after removal of the load, and the vertical plastic strain is zero. As already mentioned, plastic deformation of sub-base and sub-grade layer owns a defining role in determining pavement performance and in the rutting phenomenon, therefore, an accurate model should consider plastic behavior of the underlying layers.
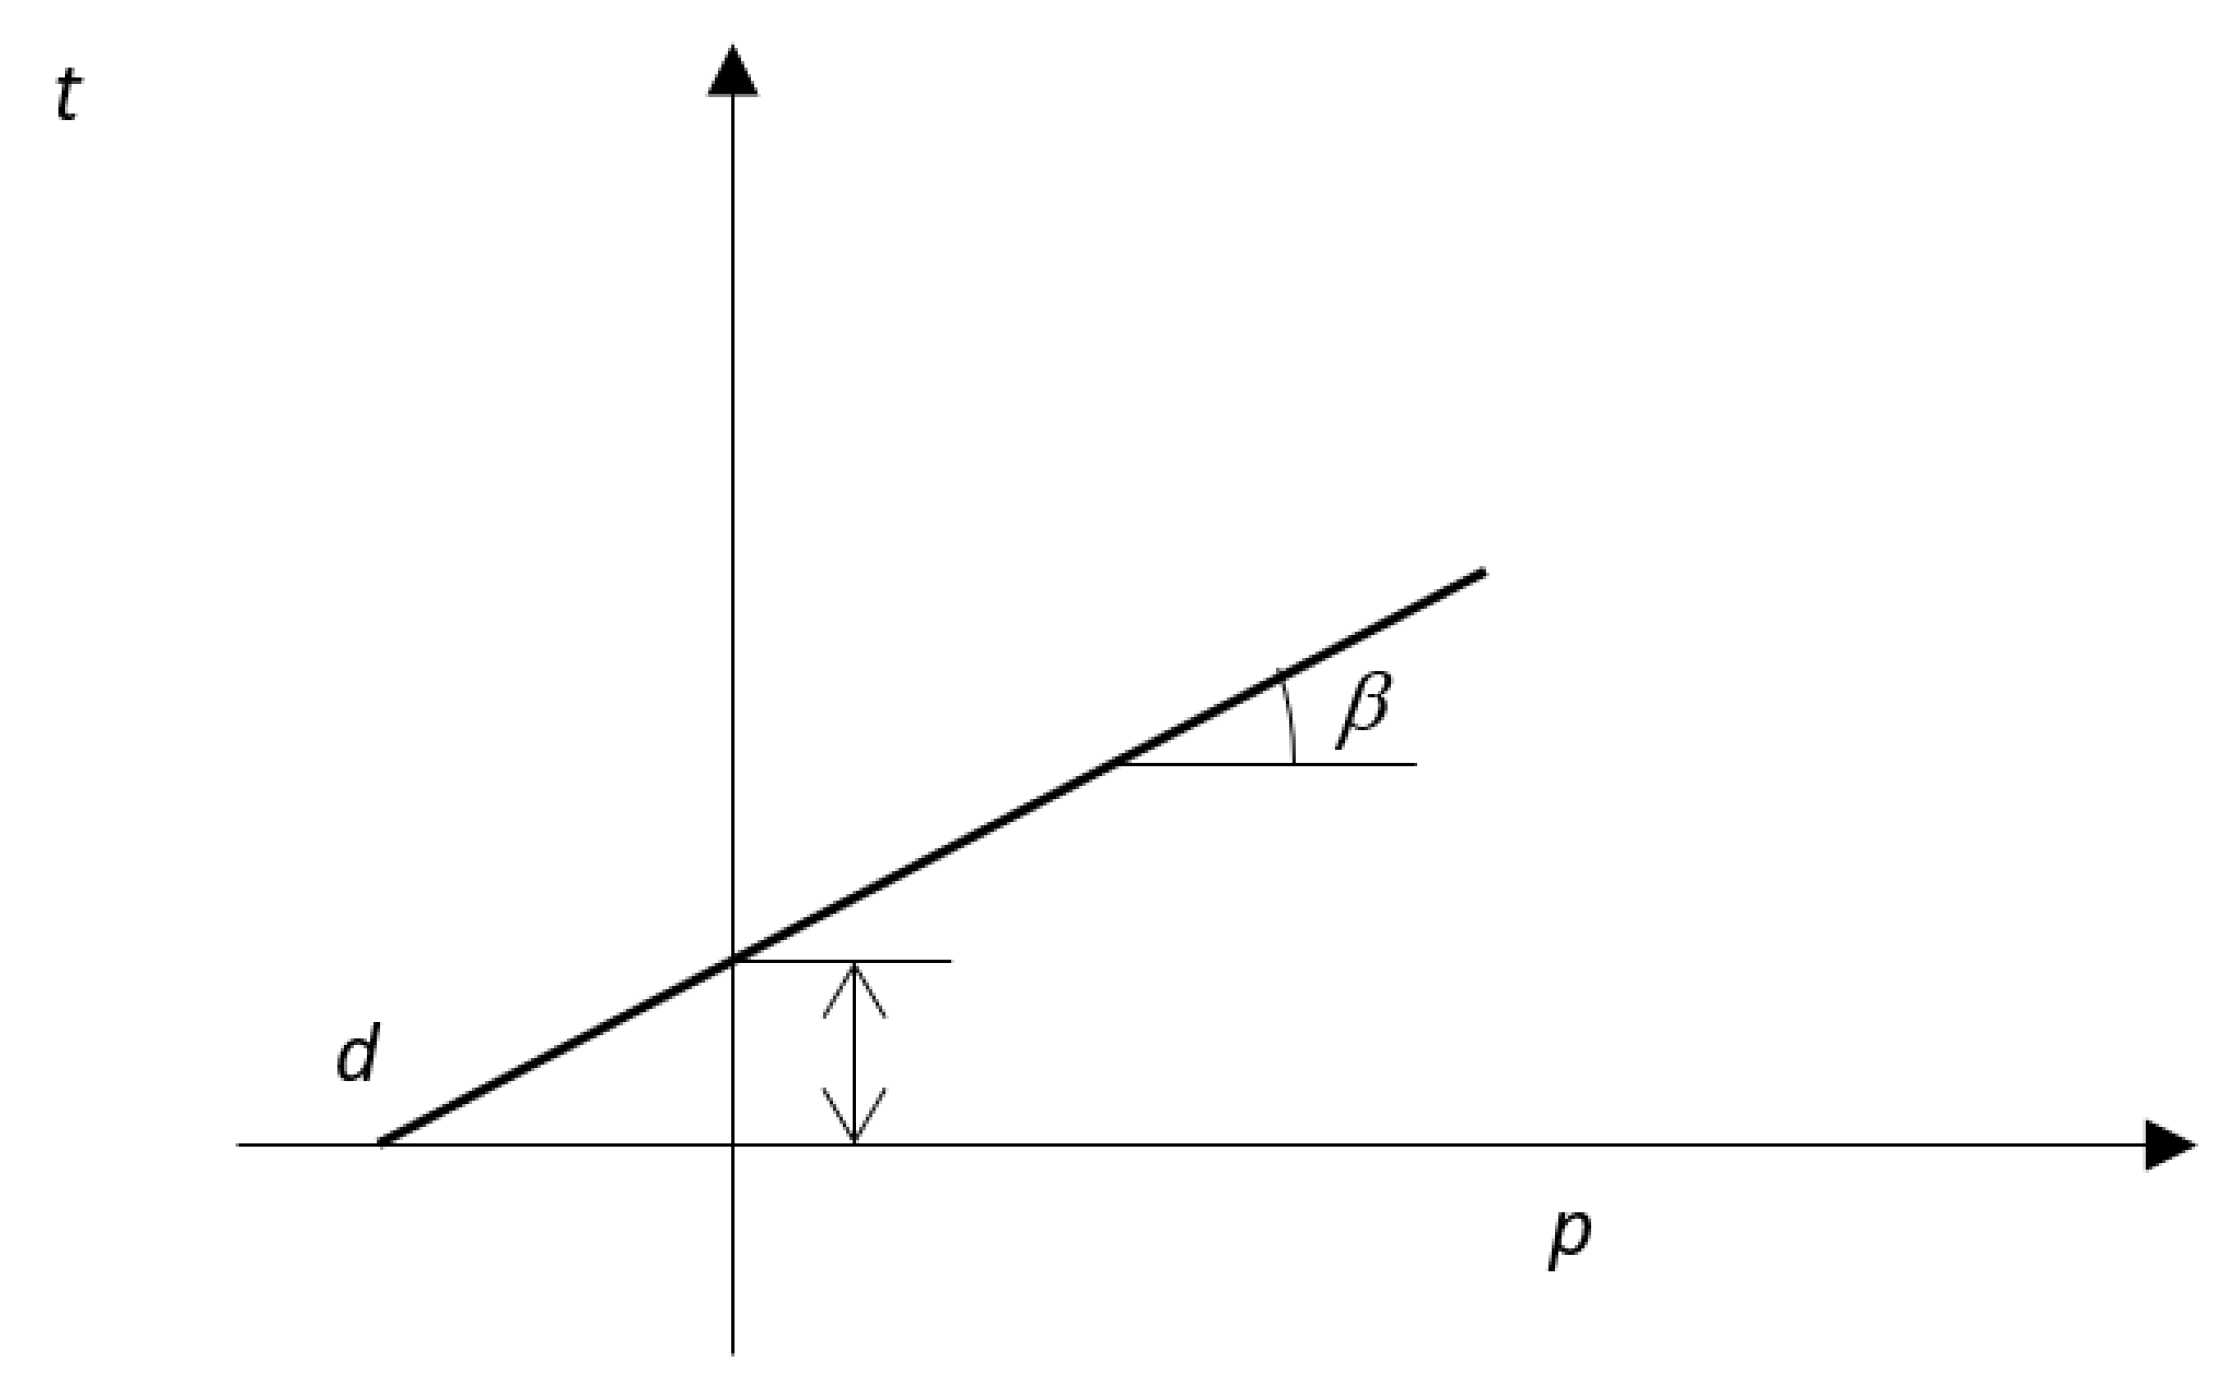
The Drucker-Prager plasticity model has been used in many finite element analyses and in a variety of geotechnical studies. Considering the plasticity models of Abaqus CAE, extended Drucker-Prager is used to model frictional materials, which has a pressure-dependent yield (the material becomes stronger as the pressure increases), and to reproduce the response of the material under monotonic loads. The yield criteria for this class of models are based on the shape of the yield surface in the meridional plane. The yield surface with a linear form is written as:
where
t is a pseudo–effective stress,
β is the slope angle of the linear yield surface in the
p −
t stress plane (meridional plane),
p is the pressure, and
d is the effective cohesion of the material (
Figure 1).
The flexible pavement materials are time, temperature, and stress dependent. As illustrated, for simplicity, flexible pavement designs assume that the structure response under traffic and environmental loads is elastic, assuming rapidly applied vehicle loadings and low temperature climate conditions. Under slow moving loads or with high temperatures stresses, flexible pavements are subject to plastic deformations, which are associated with viscous behavior [
36]. In general, the asphalt mixture response under repeated loads has elastic (immediate response of the pavement), plastic (permanent deformation), and visco-elastic and viscoplastic (mechanical response function of strain/loading time) responses. Flexible paving vehicle passages determine a total strain (ε
tot) which can be expressed as the sum of elastic recoverable strain (ε
e) and plastic irrecoverable strain (ε
p) (which are time independent), and visco-elastic recoverable strain (ε
ve) and viscoplastic irrecoverable strain (ε
vp) (which are time dependent). Plastic strain develops instantaneously, while viscoplastic strain develops at a constant stress level with time. A creep model can characterize this time dependent nature of asphalt materials. Creep phenomenon is broken up into three stages, namely primary, secondary, and tertiary. The three stages correspond to a decreasing, constant, and increasing strain rate, respectively.
In the case of bound materials, and considering the simulation type of this study, a mathematical relation is necessary to describe the first and second portion of the creep curve. Bailey and Norton developed the following model to characterize the primary and the secondary creep stage:
Function (2) represents the constitutive equation of time-hardening model in Abaqus, where A, n, and m are model parameters. These parameters are a function of the bitumen viscosity, the aggregate maximum size, and the aggregate angularity (A and n > 0; −1 < m ≤ 0). While n and m are unitless, the creep strain hardening coefficient, A, has units that are consistent with those of time, t, and stress, σ. The creep power equation is useful to simulate the nonlinear behavior of asphalt mixtures, and it can be used for applications with a constant stress condition.
As known, in Abaqus, it is necessary to describe, a priori, the elastic behavior of each material to activate the creep and D-P models for the first two layers (AC and base) and the other ones (sub-base and subgrade), respectively. In
Table 1 are reported the input parameters for the four pavement layers.
The behavior of geogrid material was considered to be linear elastic [
15,
33] because, in this simulation, the geosynthetic effect as reinforcement was given by choosing of element type in Abaqus as membrane and by its high Young modulus, which increased the stiffening of the AC layer. The geogrid, according to the product sheet, was made up of glass fibers protected by a polymeric upholstery. The elastic parameters of this geosynthetic are mentioned below.
2.2. FEM Setup
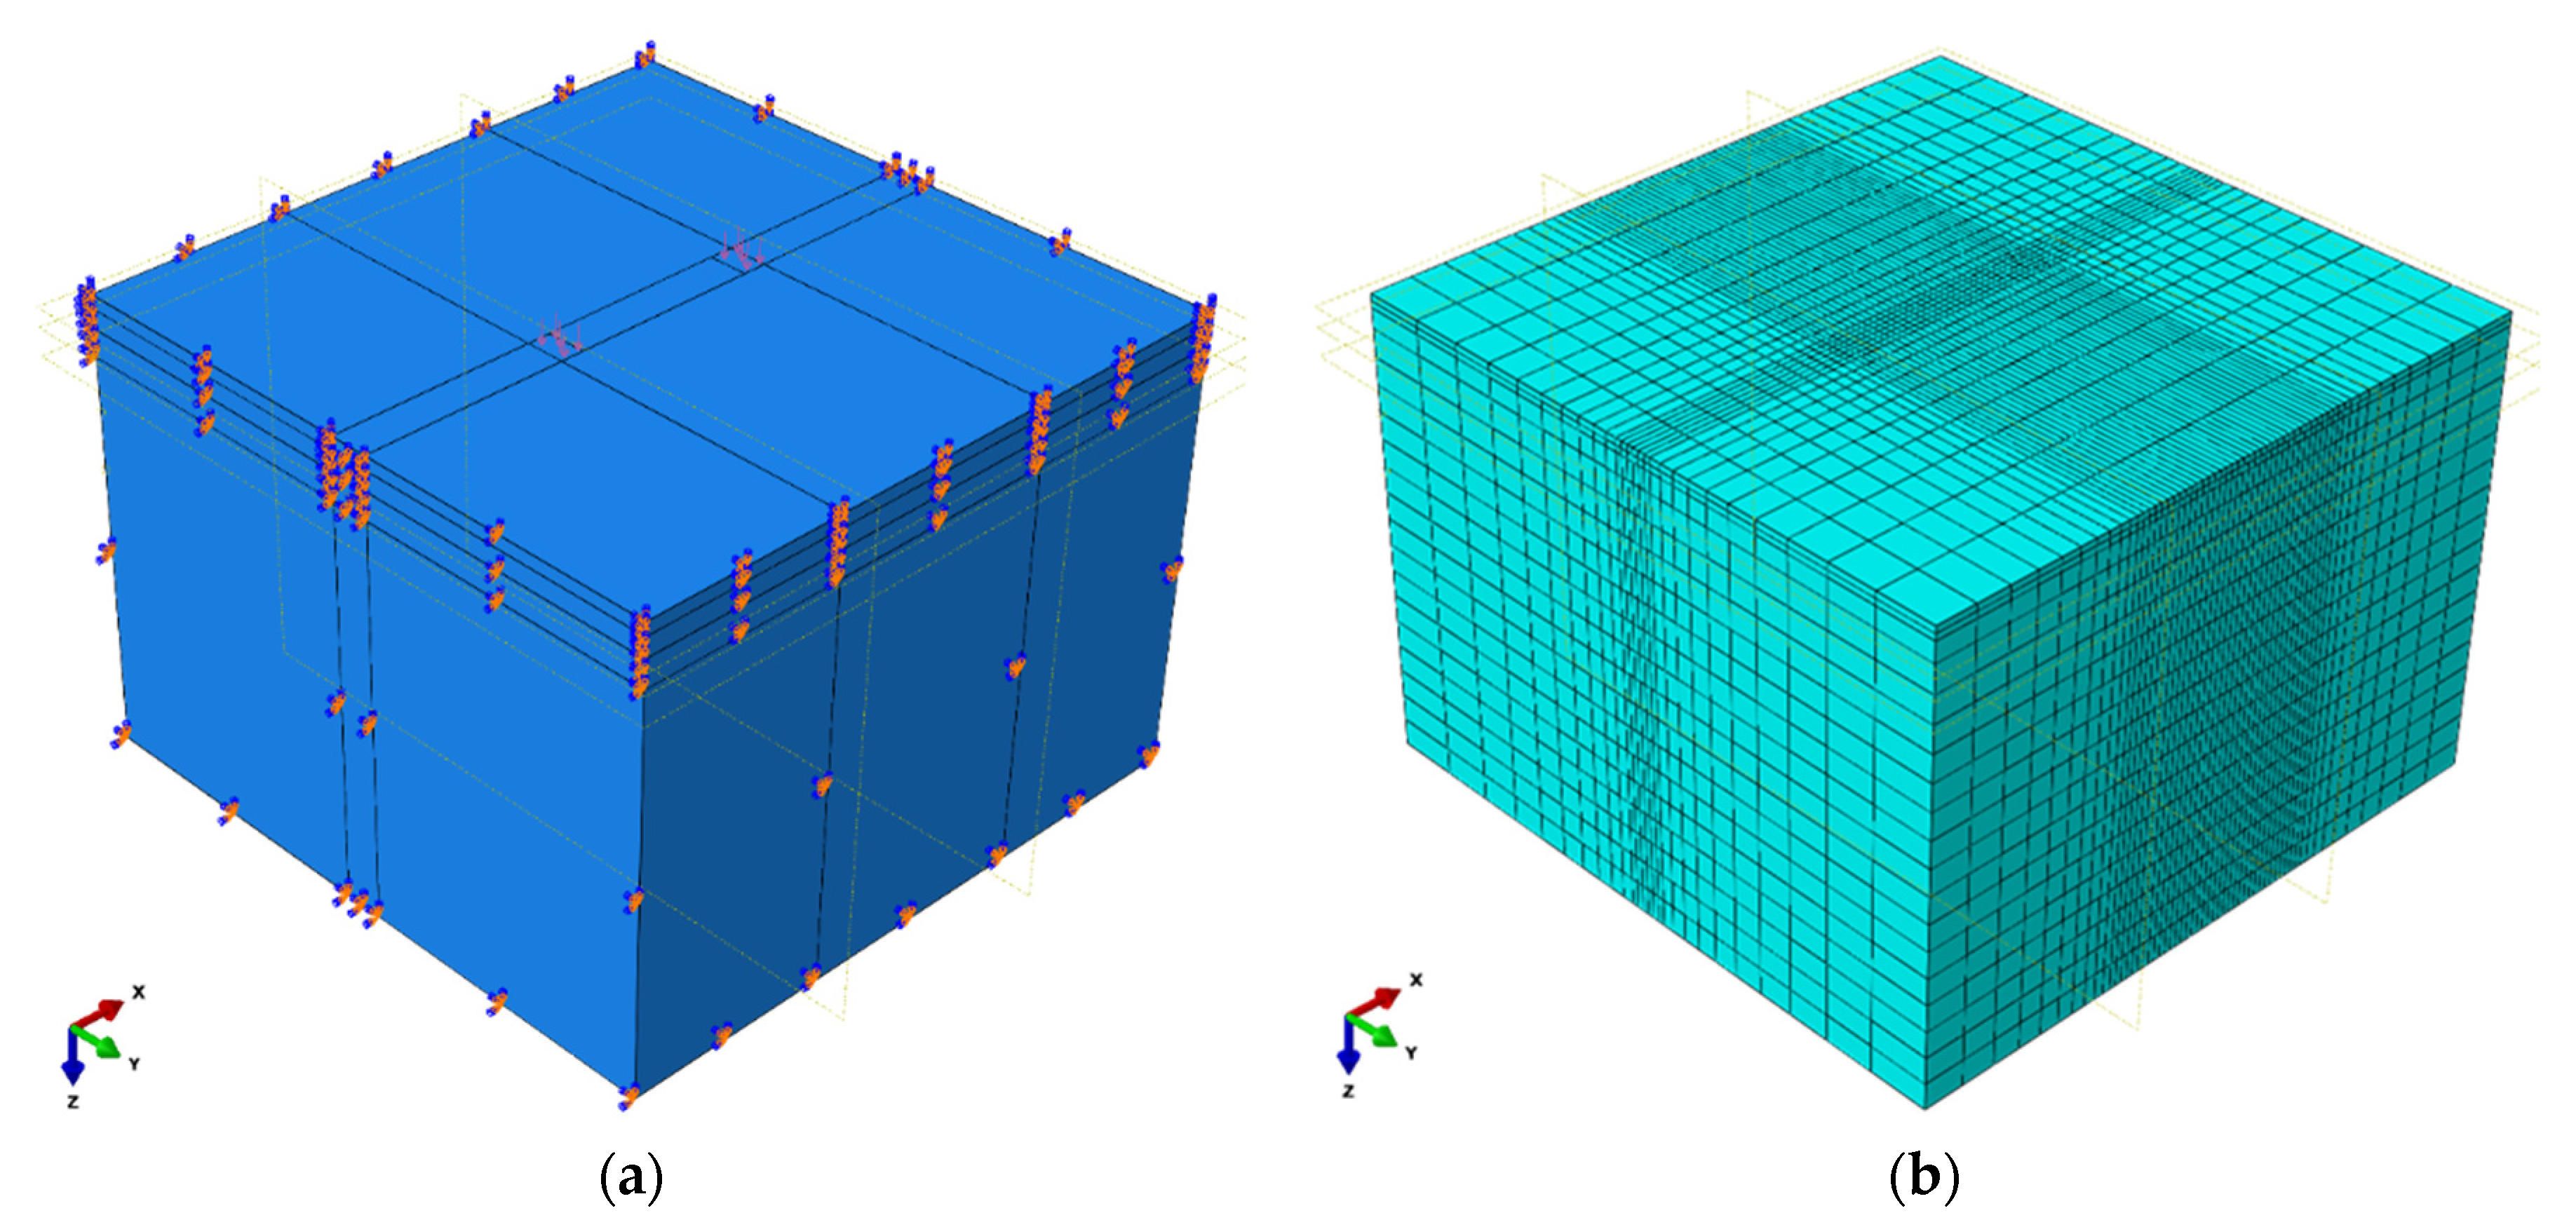
To simulate a road section in Abaqus software, a solid with a square section (5 m × 5 m) was drawn. The flexible pavement layers (
Table 1 and
Table 2) and the two load areas were obtained thanks to the use of different partition planes in the solid (that was modelled as a homogeneous deformable solid).
Figure 2a presents a sketch of the geometry.
The model was completely constrained at the bottom and at the four sides parallel to
y-axis and to
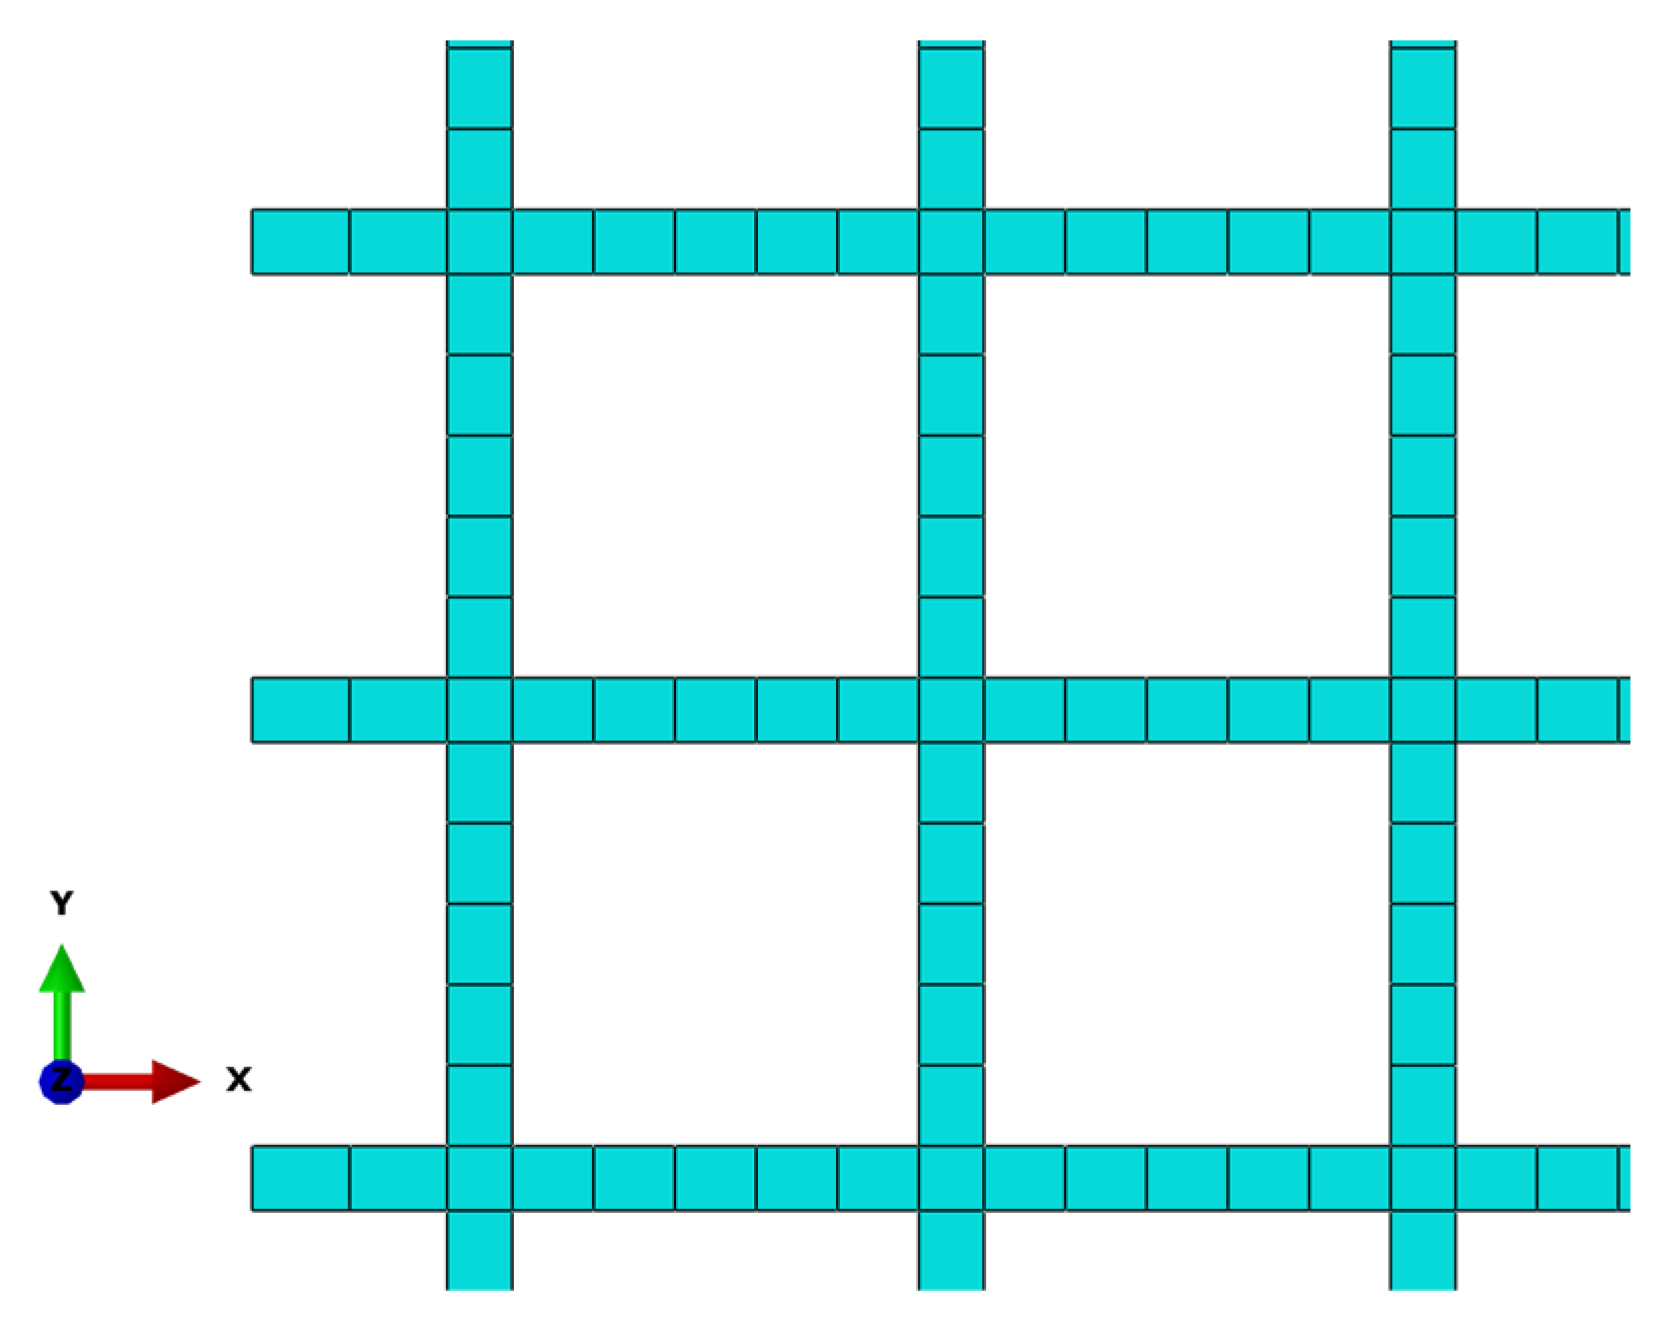
x-axis. All parts were considered perfectly bonded to each other so that the nodes at the interface of the four layers had the same displacements in all three (x, y, and z) directions. Assuming the perfect bond at the layer interfaces implied that there will be no slippage at the interface. The geogrid was considered embedded in AC layer. The mesh element type chosen for the solid body was a 3D eight-node first-order brick C3D8R (
Figure 2b). Instead, the geogrid was simulated like membrane element M3D4 because, in Abaqus, these elements which follow membrane theory are generally used to represent thin surfaces that offer in-plane strength (
Figure 3).
The loading conditions in FEM must simulate the traffic loads which are present on the pavement surface. Traffic loads are given by the sum of vehicle passages. It was observed that vehicle passages have variable trajectories, and the transverse wheel path distribution is identified as wheel wander. As the trajectory cannot be represented deterministically, cycles of load are represented statistically.
In this study, real traffic data were considered. The survey for the year 2017 about the ADT (average daily traffic) in the principal Italian roadways showed the data concerning the SS 106; this route connects Reggio Calabria to Taranto in the east side of the south of Italy. In particular, the stretch close to the Metropolitan Area of Reggio Calabria (11,650 km) was detected. According to the survey, at 11,650 km, the heavy vehicles were 502 per day in the two-way, so considering just one-way, the heavy vehicles with double axle were 251.
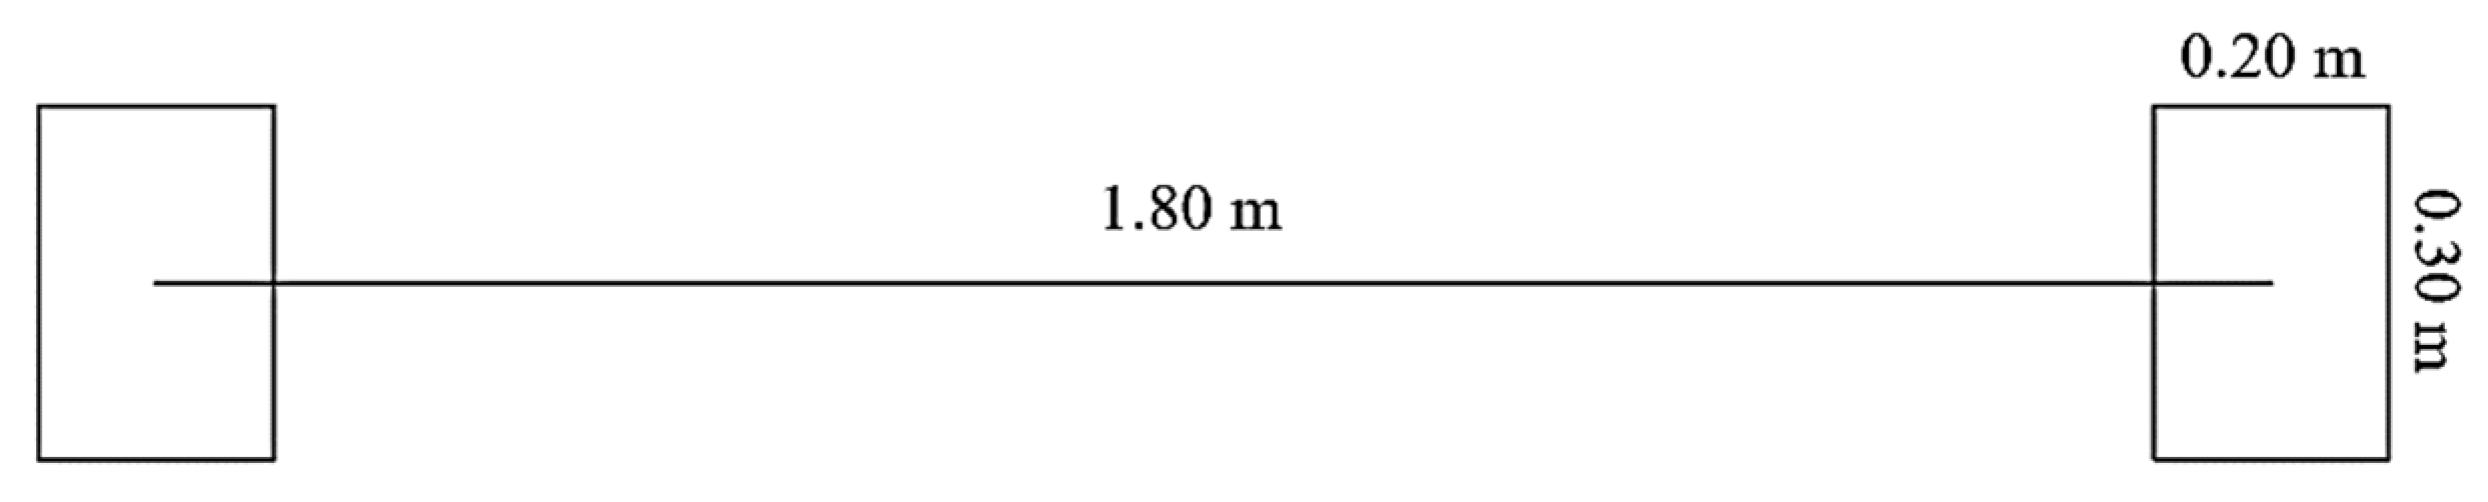
In order to simulate the passage of these vehicles, they could be converted into equivalent repetitions of a standard axle with dual wheels carrying a load of 80 kN; and the layout of the load areas was calculated and modelled as two rectangles 0.30 m × 0.20 m (to simulate two tires’ tracks), with a distance between them equal to 1.80 m [
5,
37], as shown in
Figure 4.
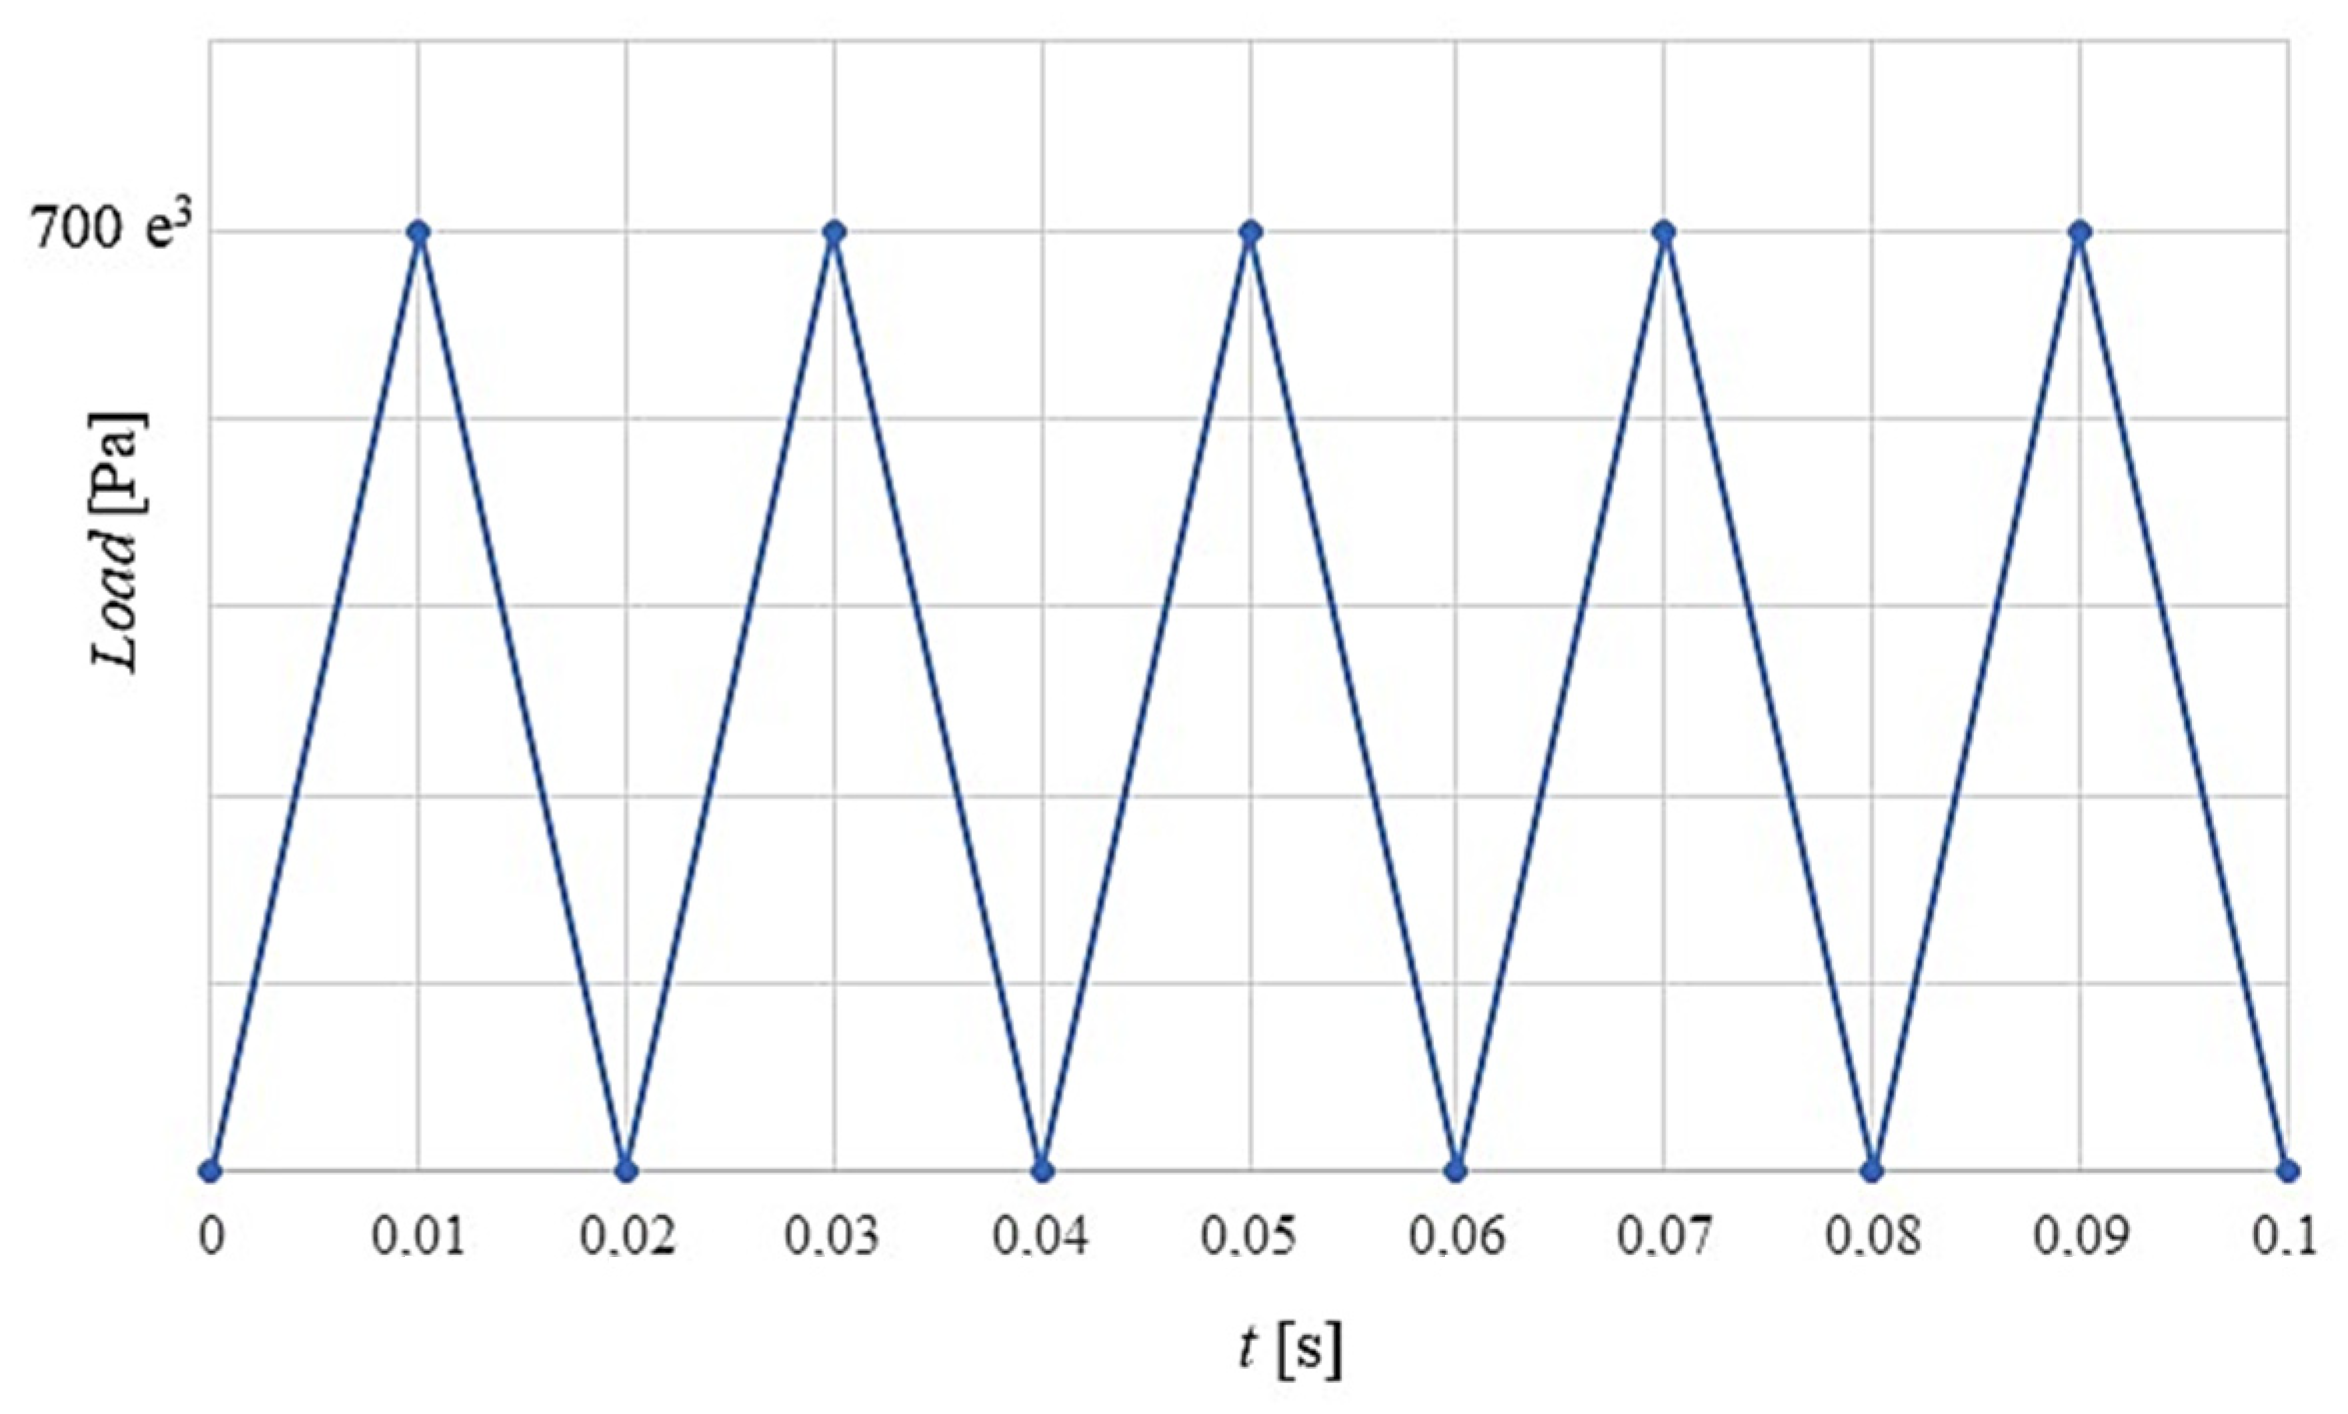
The axial and the radial stress of each wheel changes over a short time defining a stress pulse. The magnitude, shape, and duration of the pulses depend on wheel speed and load. The stress is at its maximum when the load was directly above the contact point between road and infrastructure, and at its minimum when the wheel load is at the furthest distance from that contact point. It can be assumed that the stress wave is either sinusoidal or triangular, with the load duration depending on the speed and the depth [
38,
39,
40,
41]. There is no significant difference in the magnitude of the total and the resilient strains, and between the triangular and sinusoidal stress wave [
33].
Figure 2 shows a triangular load with a peak of 700 kPa [
42].
Figure 5 shows the triangular load with a peak of 700 kPa.
∆t = 0.01 s (according to Brown’s formula), and the duration of the load wave was 0.02 s with a load and an unload, that was equal to a cycle. Considering the survey and the data mentioned above, as the dual axle for each truck, the converted loading time of one vehicle pass was 0.04 s. In this way, the time of loading for one week of traffic composed of 251 heavy vehicles was 73 s, equal to 3650 load cycles.
In Abaqus, two parameters were considered: loading duration and loading area. The duration of the load wave is 0.02 s, considering a vehicle speed equal to 70 km/h. Amplitude tool was needed to describe the loading impulses, so load and unload steps were created for simulating the triangular distribution. Each step had a duration equal to 0.01 s, to which a pression of 700 kPa and a pression of 0 kPa were alternately linked. In this way, a cycle was composed by a load step and an unload step.
3. Results
Two models were realized to investigate the mechanical performance behavior of the traditional and the reinforced sections. Both simulations were carried out as visco-analyses to take in account the behavior of the bound layers, and 73 s of load (one-week traffic, as already mentioned) were applied. The simulations traced the complete history of the load cycles, each 0.51 s for the loading and each 1 s for the unloading and were performed to obtain the accumulated effect after 3650 load cycles.
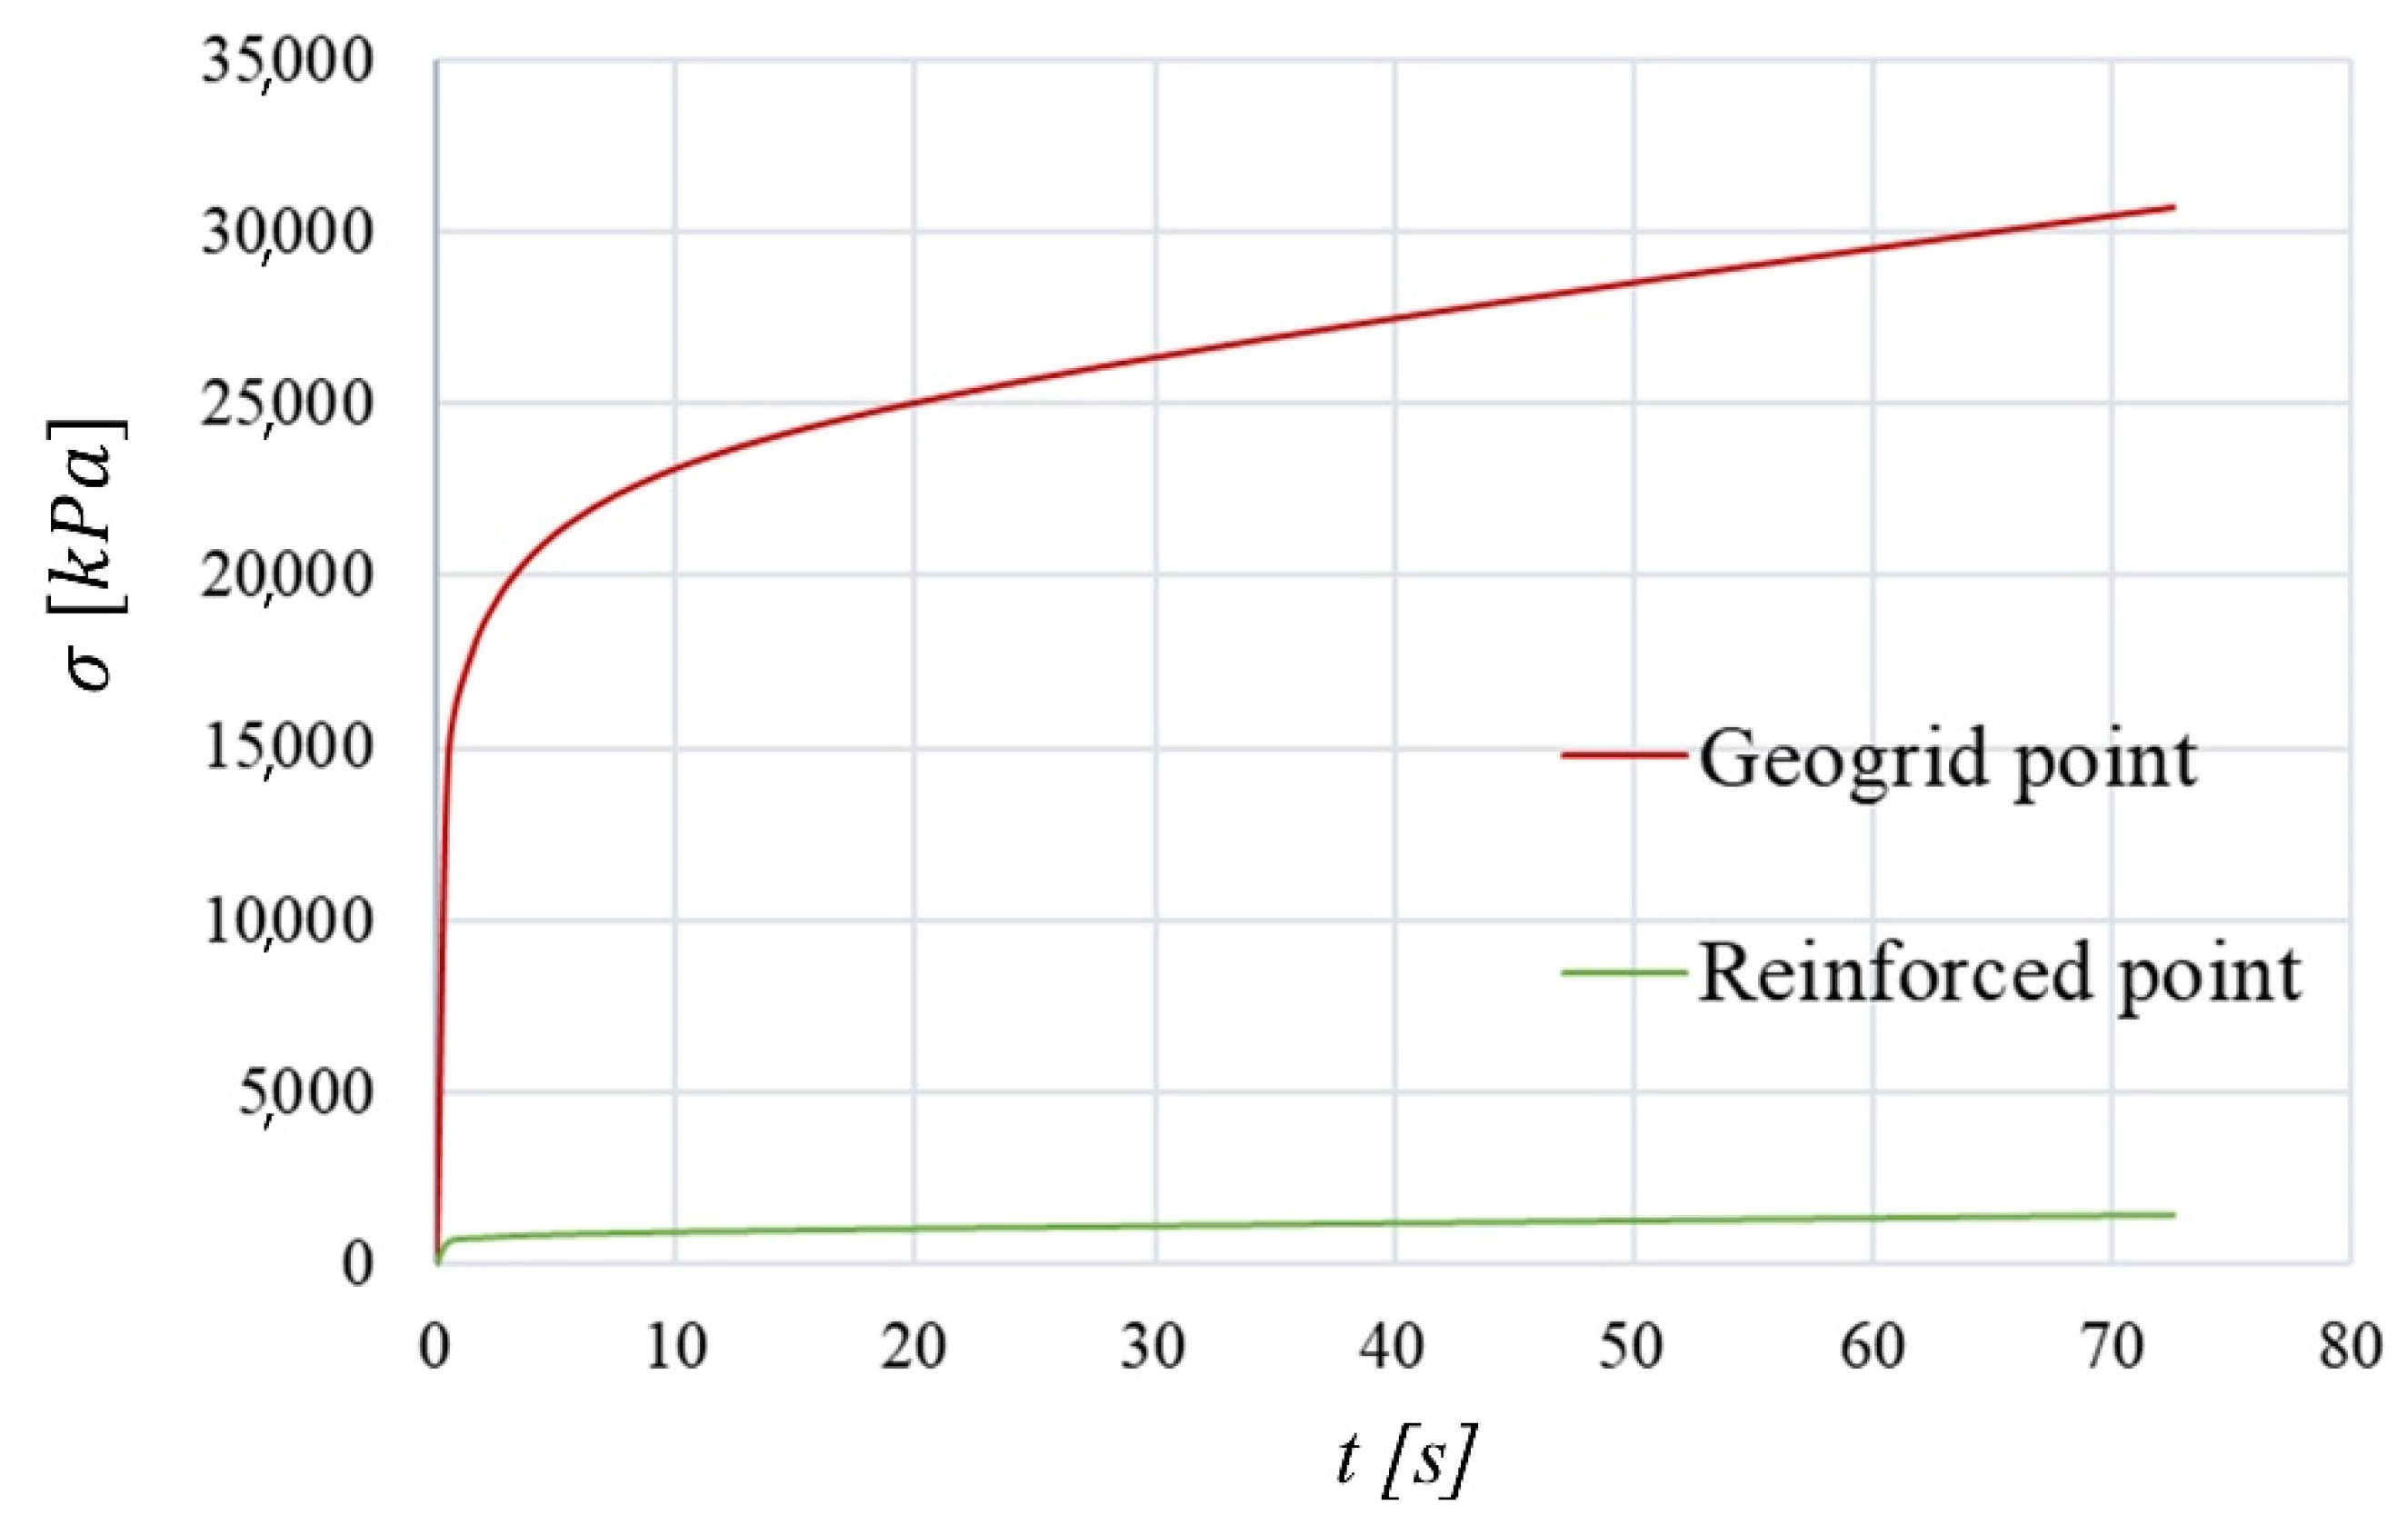
The improvement offered by the geogrid was highlighted by the distribution of stress. Indeed, the stress value of the reinforcement section was legitimized by the geogrid associated stress. As an example, the distribution of Von Mises stress along the x-axis about a geogrid point and the respective AC point under it is shown in
Figure 6a for the loading step 72.52 s, and in
Figure 6b for the last unloading step 73 s. Moreover, the same points were considered to compare the Von Mises stress distribution in time, considering just the loading steps (
Figure 7). The chosen points corresponded to the maximum value of stress under the load areas.
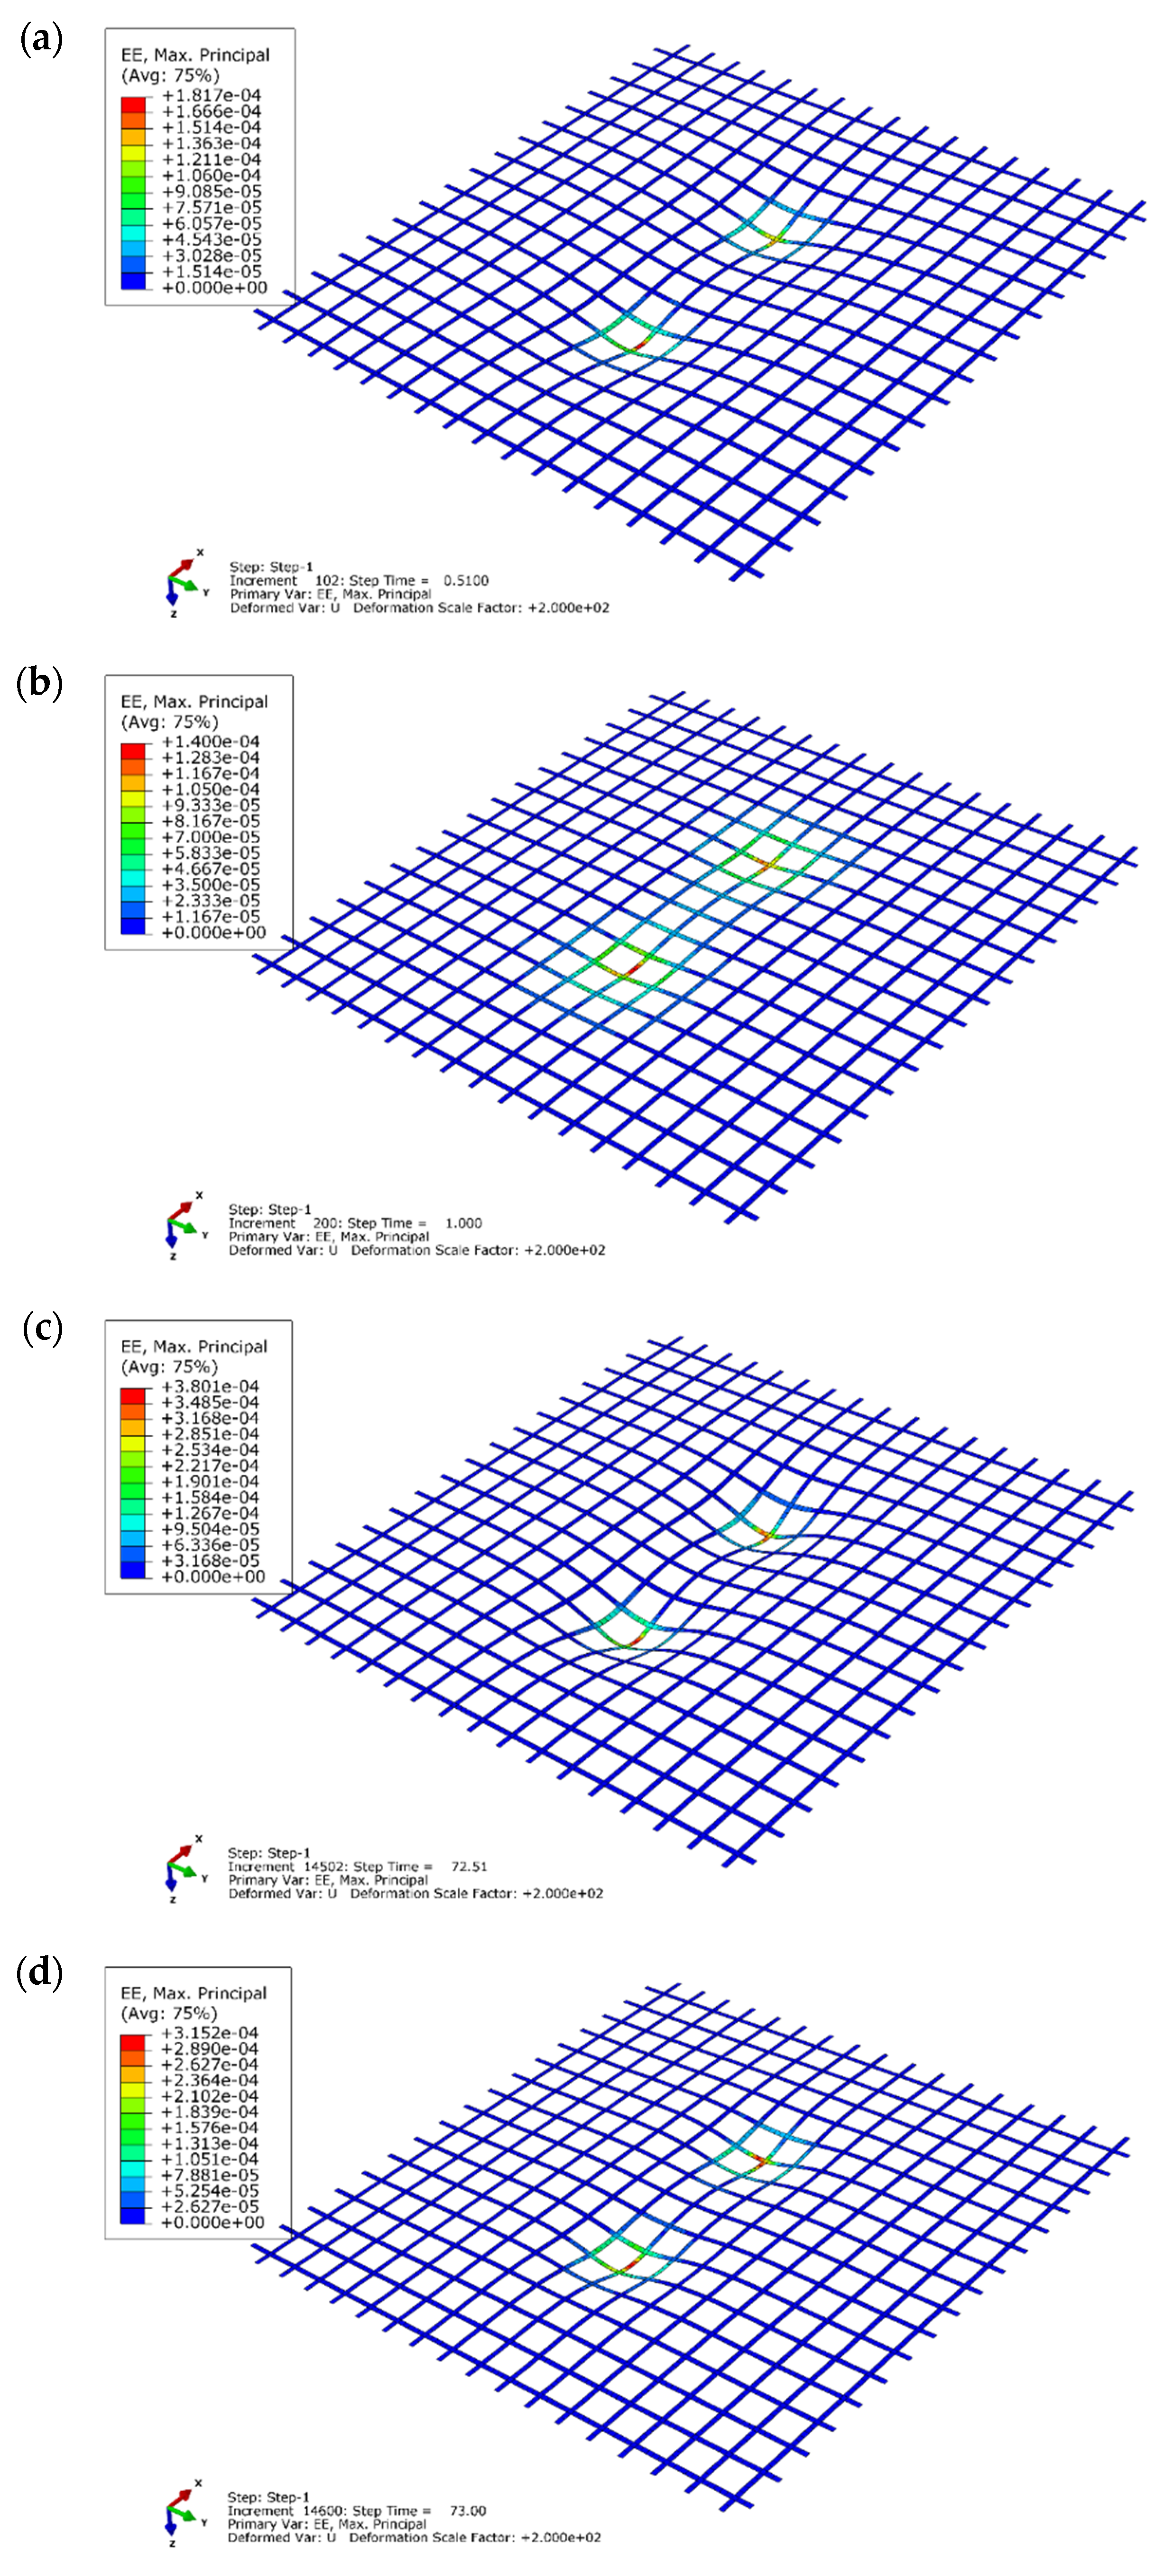
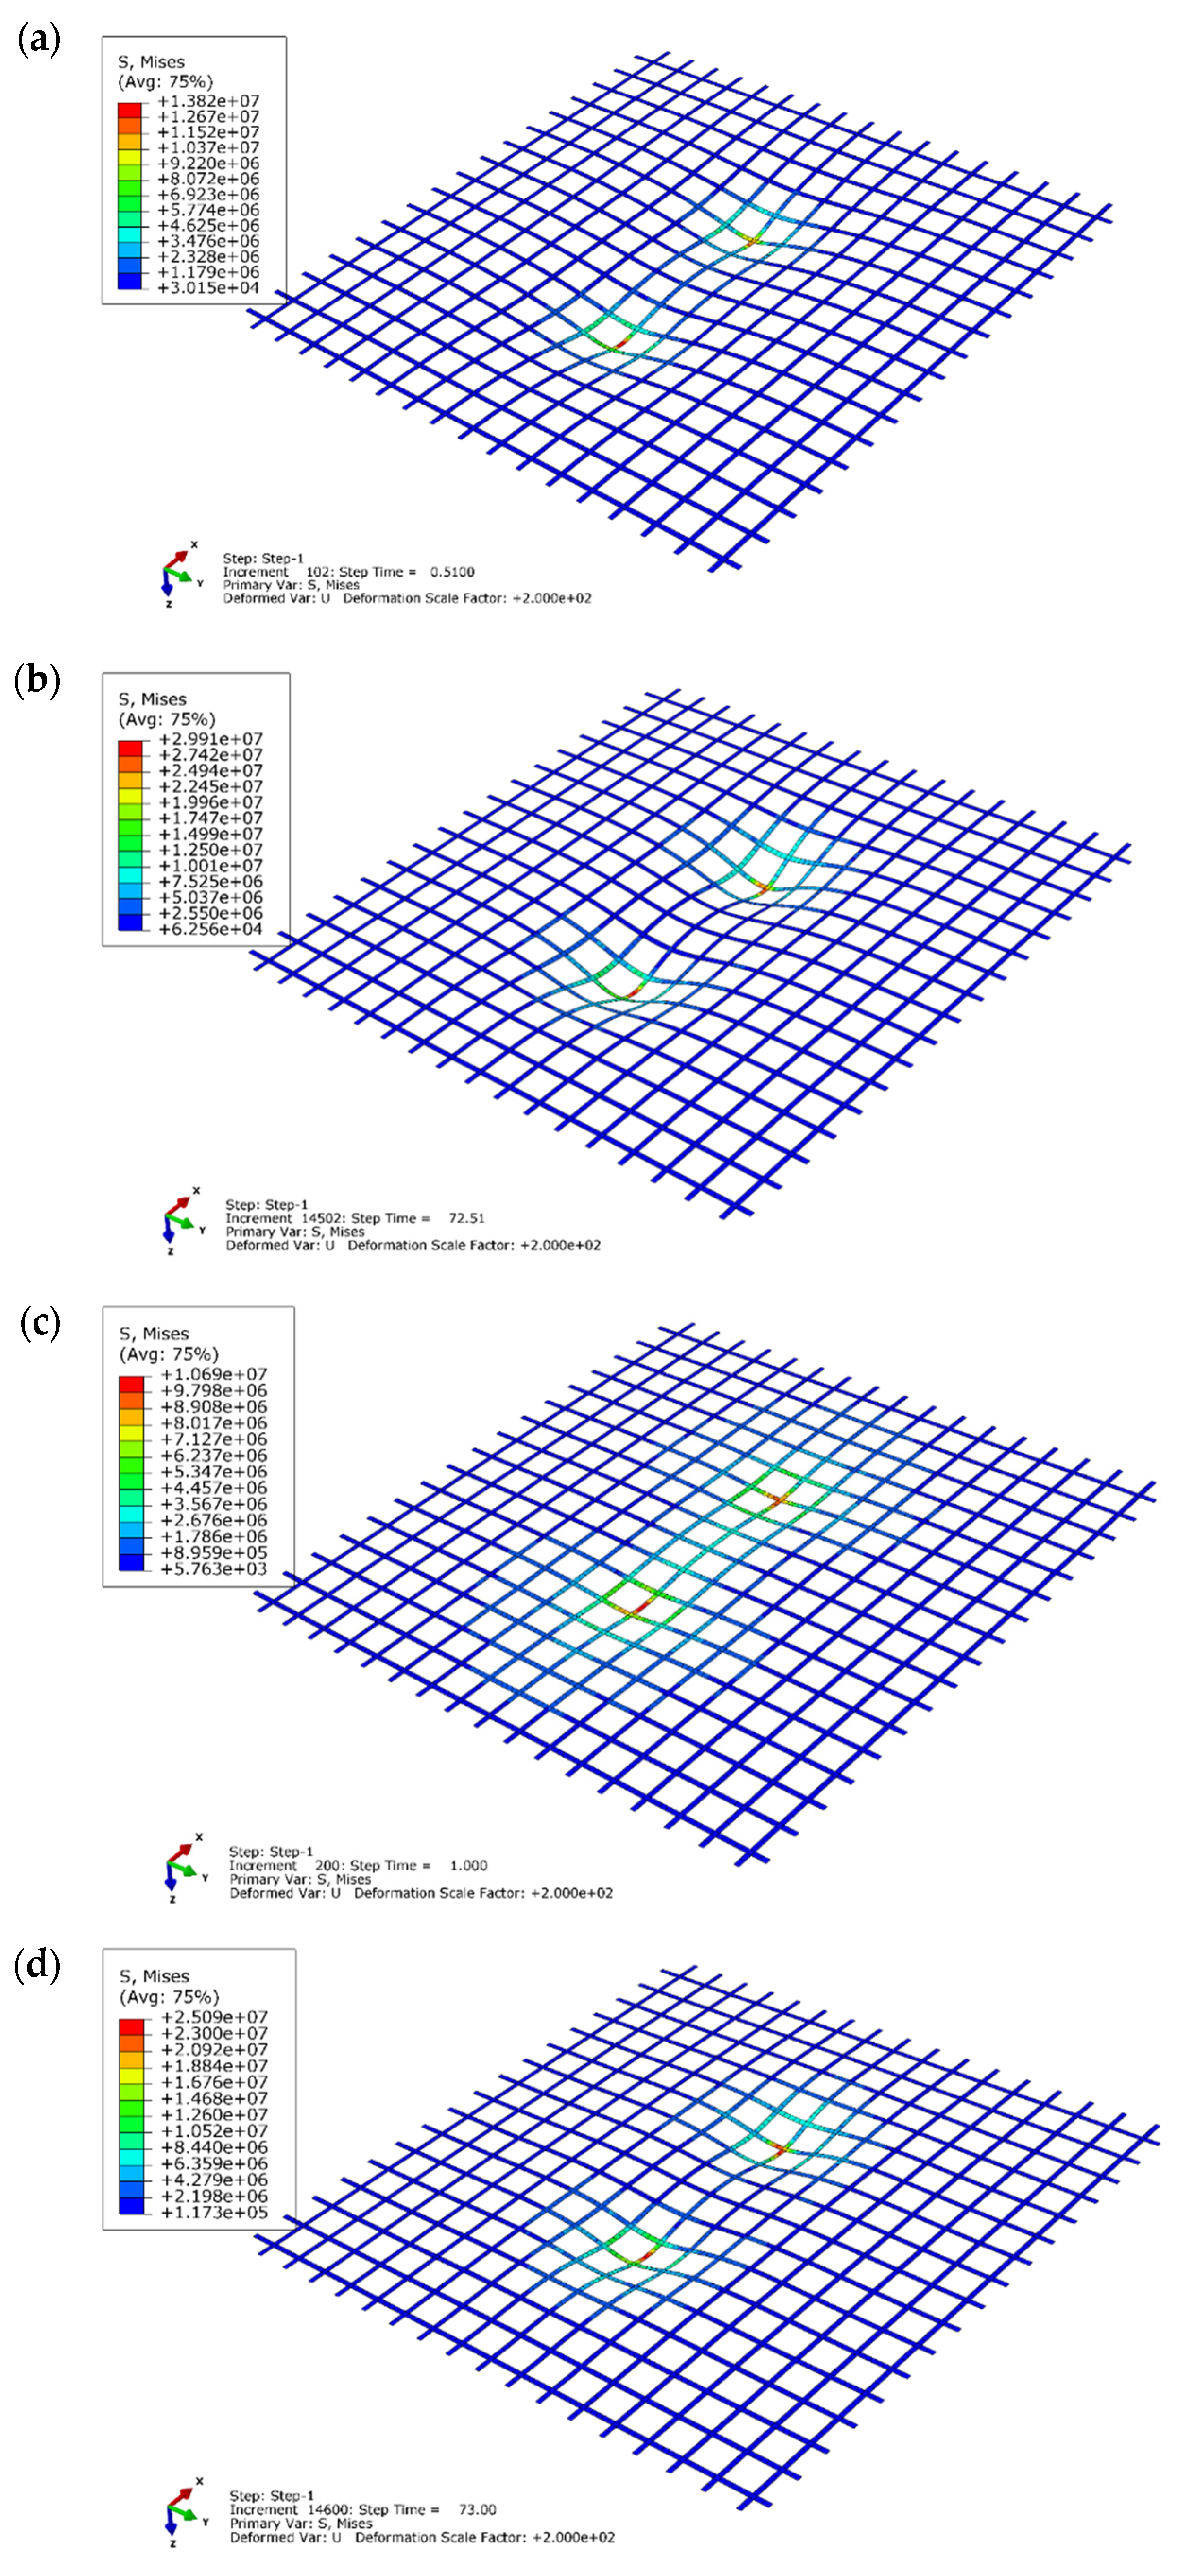
In
Figure 8 and
Figure 9, the distribution of elastic strain and stress in the geogrid plane at different load steps are shown.
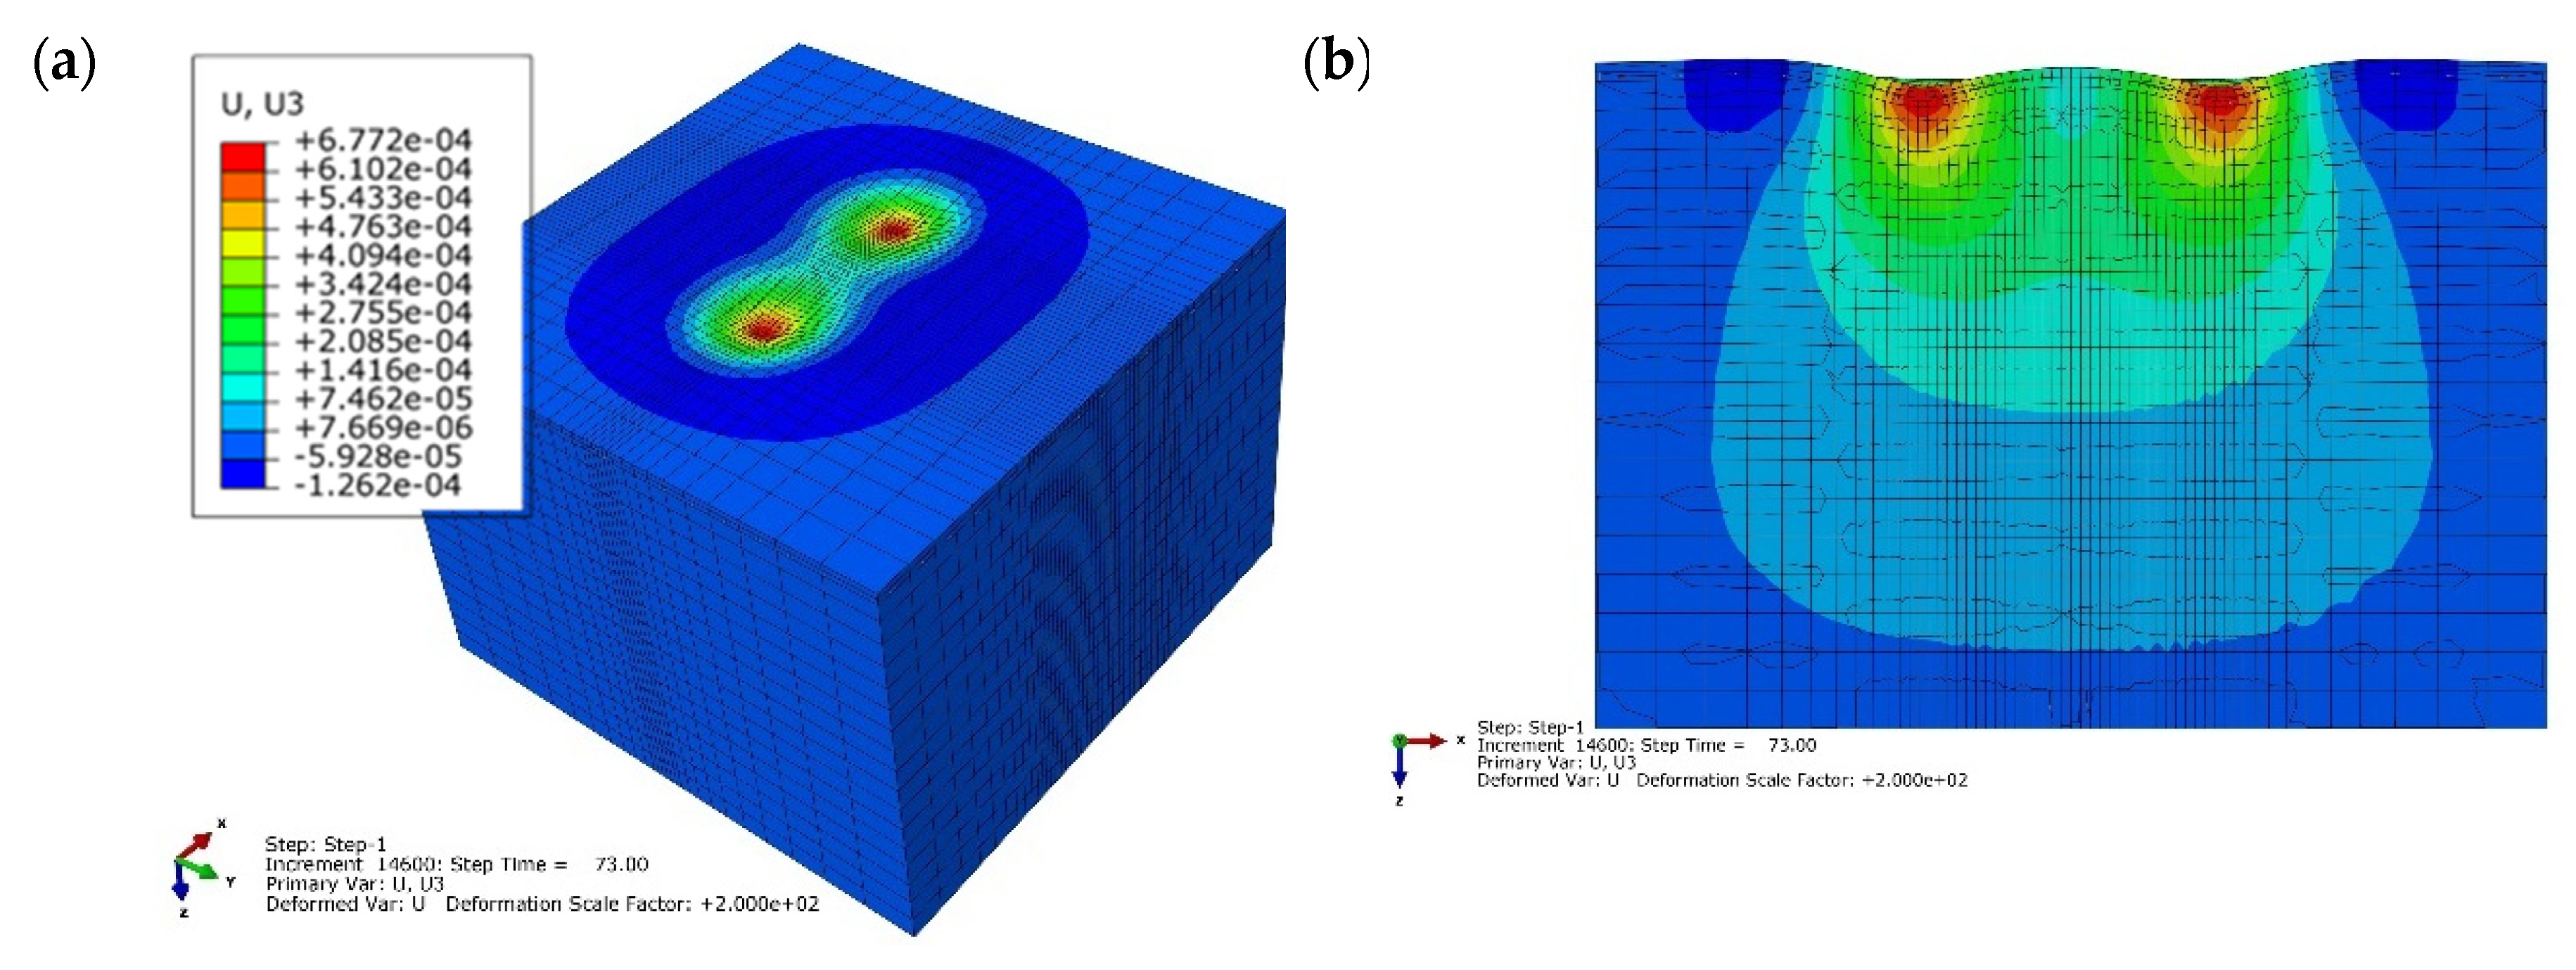
The improvement offered by the fiberglass geogrid in terms of vertical permanent deformation reduction are explained below.
In case of the geogrid-reinforced test section, the results at different time values were lower than the results obtained for the unreinforced test section.
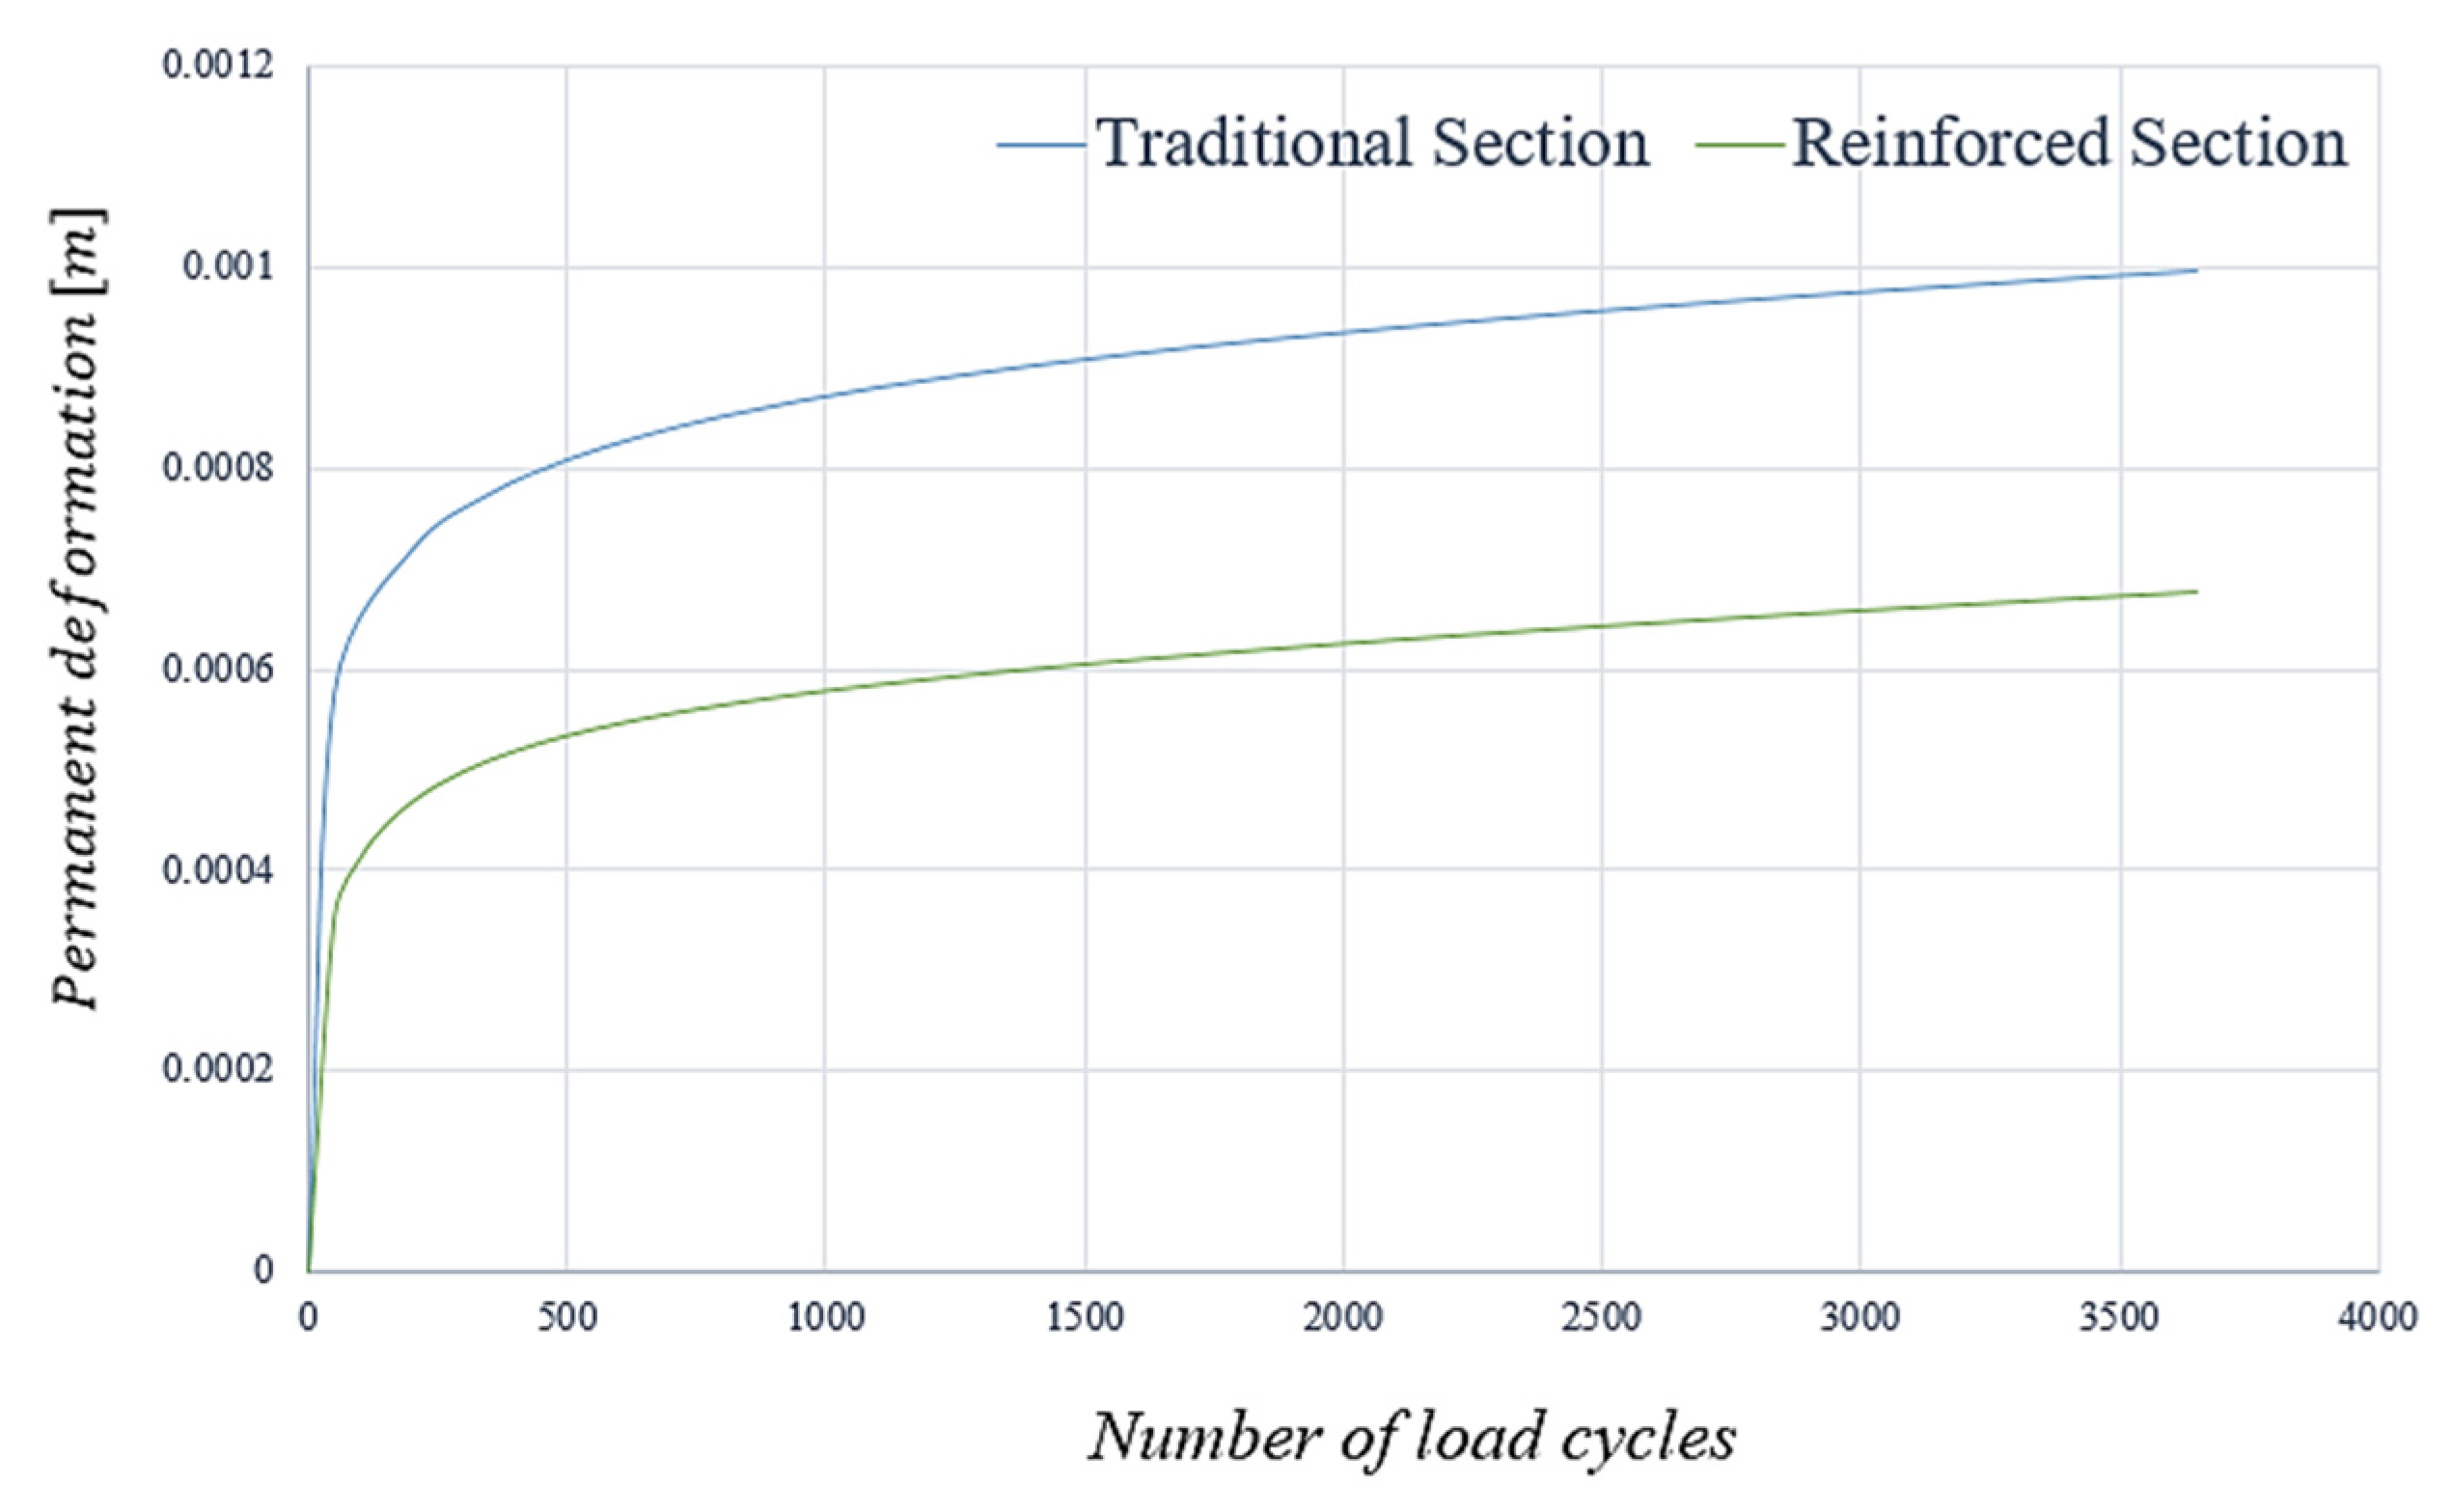
Figure 10 shows the evolution of permanent deformations with the number of load cycles, and the graph well represents the gap between the two test pavements. At
t = 73 s (corresponding to an unloading step and to the last cycle 3650), the maximum value of vertical displacements was 6.772e
−4 m (
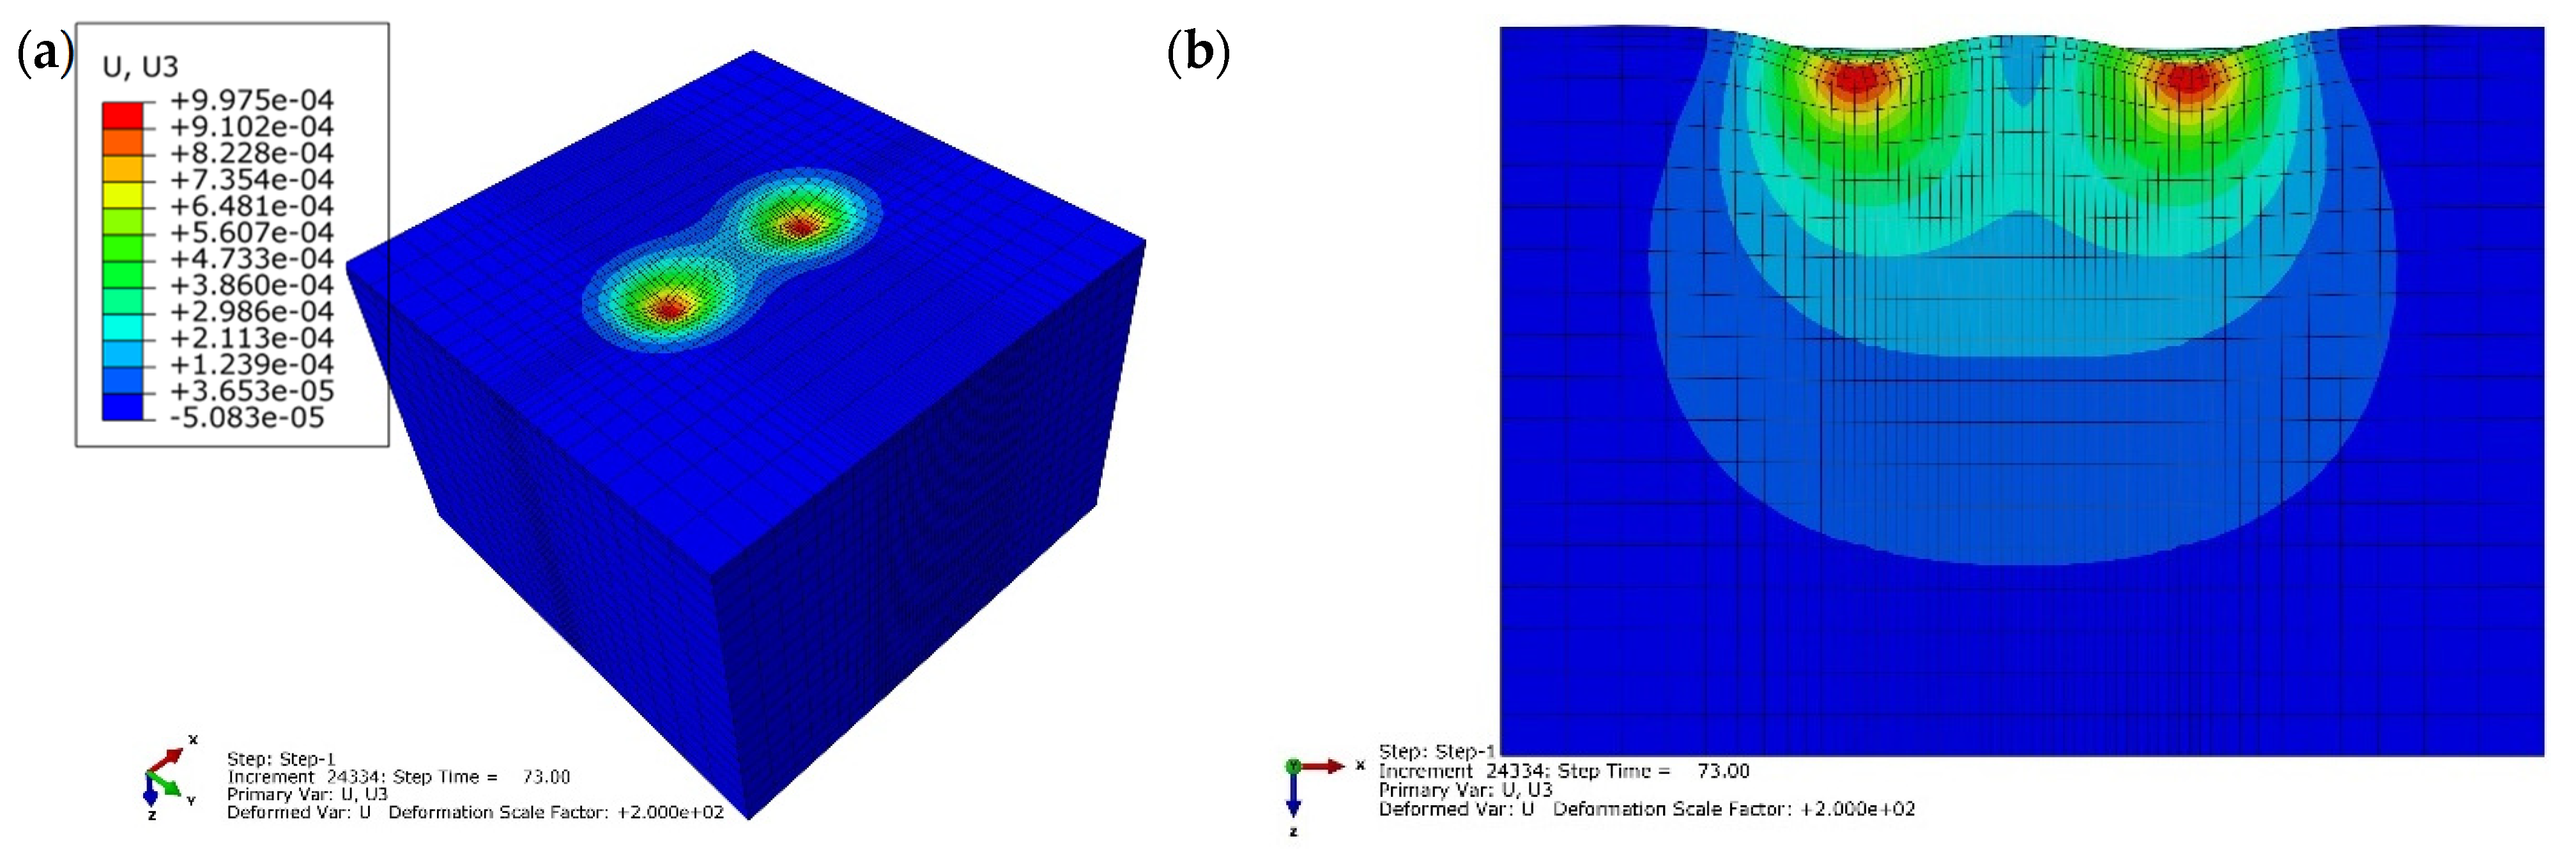
Figure 11) for the reinforced case and 9.975e
−4 m (
Figure 12) for the unreinforced pavement, hence, the improvement was close to the 33%.
The comparison between the reinforced and the unreinforced rut depth along the transversal section (shown in
Figure 11 and
Figure 12) highlighted the improvement offered by the geogrid in terms of vertical rut.
It should be noticed that, in both analyzed cases, a small shoving phenomenon arose on one side of the two load tracks. In particular, the value of the reinforced section was slightly greater than the traditional one because of the high stiffness of the geogrid. Indeed, the young modulus of the geogrid was 40 larger than AC modulus. Furthermore, the membrane effect of the element implicated, as usual, a vertical support component, and the distances between the wheel tracks and the constrained sides (considering the boundary conditions) were small for dissipating the stress.
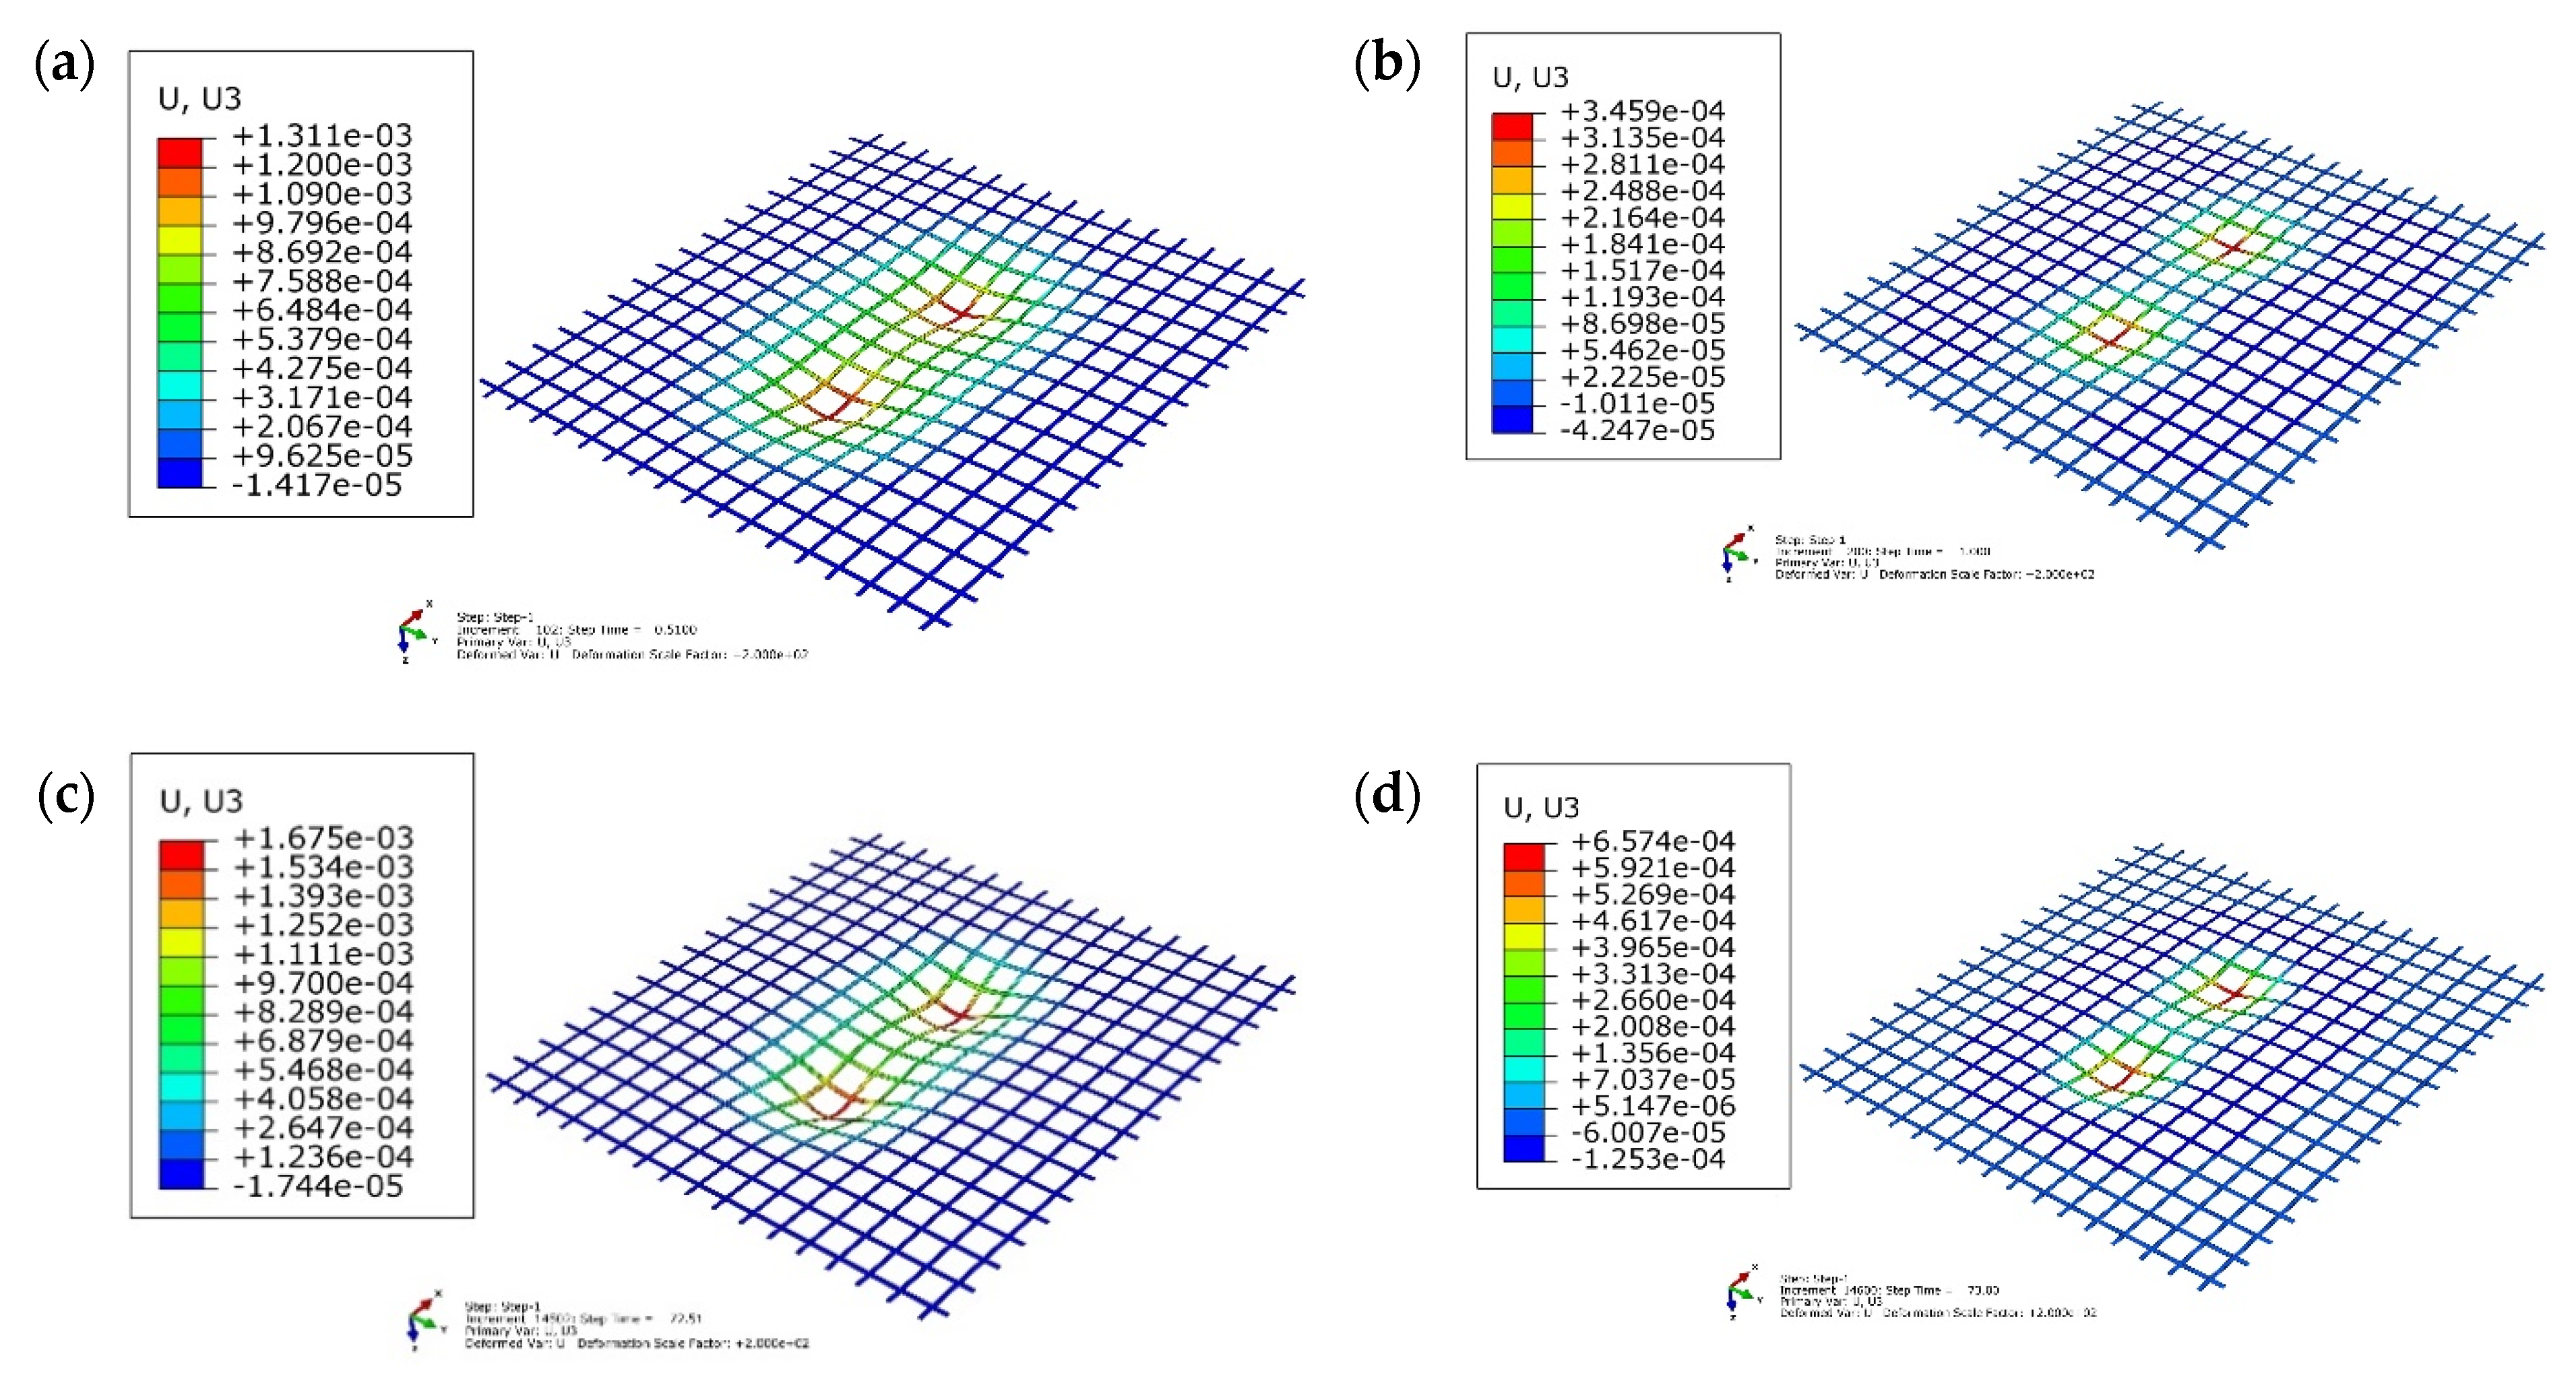
Moreover, it was interesting to investigate the geogrid deformation at different time steps (
Figure 13); as mentioned, the geogrid, modelled as a linear elastic material, was completely incorporated in the AC layer; hence, when the load was zero, it was clear that the geosynthetic had a small vertical deformation because it was affected by the vertical displacement of the upper AC.
The proposed simulation using the creep model for asphalt layers and Drucker-Prager (D-P) model for the sub-base and subgrade layers to predict stresses and vertical displacements and deformations in the pavement structures can lead to results which are comparable with the results obtained from previous numerical simulations of others’ research [
43,
44,
45].
The use of the geogrid layer reduces the permanent deformations when the load is placed on the asphalt pavement, so the geogrid is a reinforcing material used to reduce the rutting in the roads.
4. Conclusions
In this study, the benefits offered by a fiberglass geogrid within the asphalt concrete layer (AC) were investigated in terms of permanent deformations. In particular, the mechanical response of a traditional flexible pavement section composed by four layers (AC, base, sub-base, and subgrade) was compared to a pavement section reinforced by a geogrid in glass fibers, subject to a triangular loading distribution.
The improvement offered by the fiberglass geogrid completely embedded at two-thirds of the asphalt concrete layer was highlighted by the vertical permanent deformation reduction. As a matter of fact, the value of the total rut depth for the traditional section, resulting from permanent deformations, was higher than the result for reinforced pavement.
Specifically, they are to determine the rutting phenomenon under the wheel tracks in both cases.
The proposed model, combining plasticity Drucker-Prager model and simple creep law model, can consider the different behavior of bound and unbound materials and can successfully capture the pavement deformations under vehicular repeated loads.
From an economics point of view, the effectiveness of using geosynthetics reinforcement to reduce superficial permanent rut deformations for a given number of axle loads, in comparison with the traditional configuration, leads to an increase of the road service life and a decrease in the number of periodic maintenance interventions. Although geogrids utilization in road pavement reinforcement implies an addition of CO2 emissions, its mechanism of reinforcement reduces the number of maintenance operations.


