
Probability Model of Riding Behavior Choice of Two-Wheelers under the Influence of the Subsidence Area of a Manhole Cover

Abstract
:1. Introduction
2. Data Source
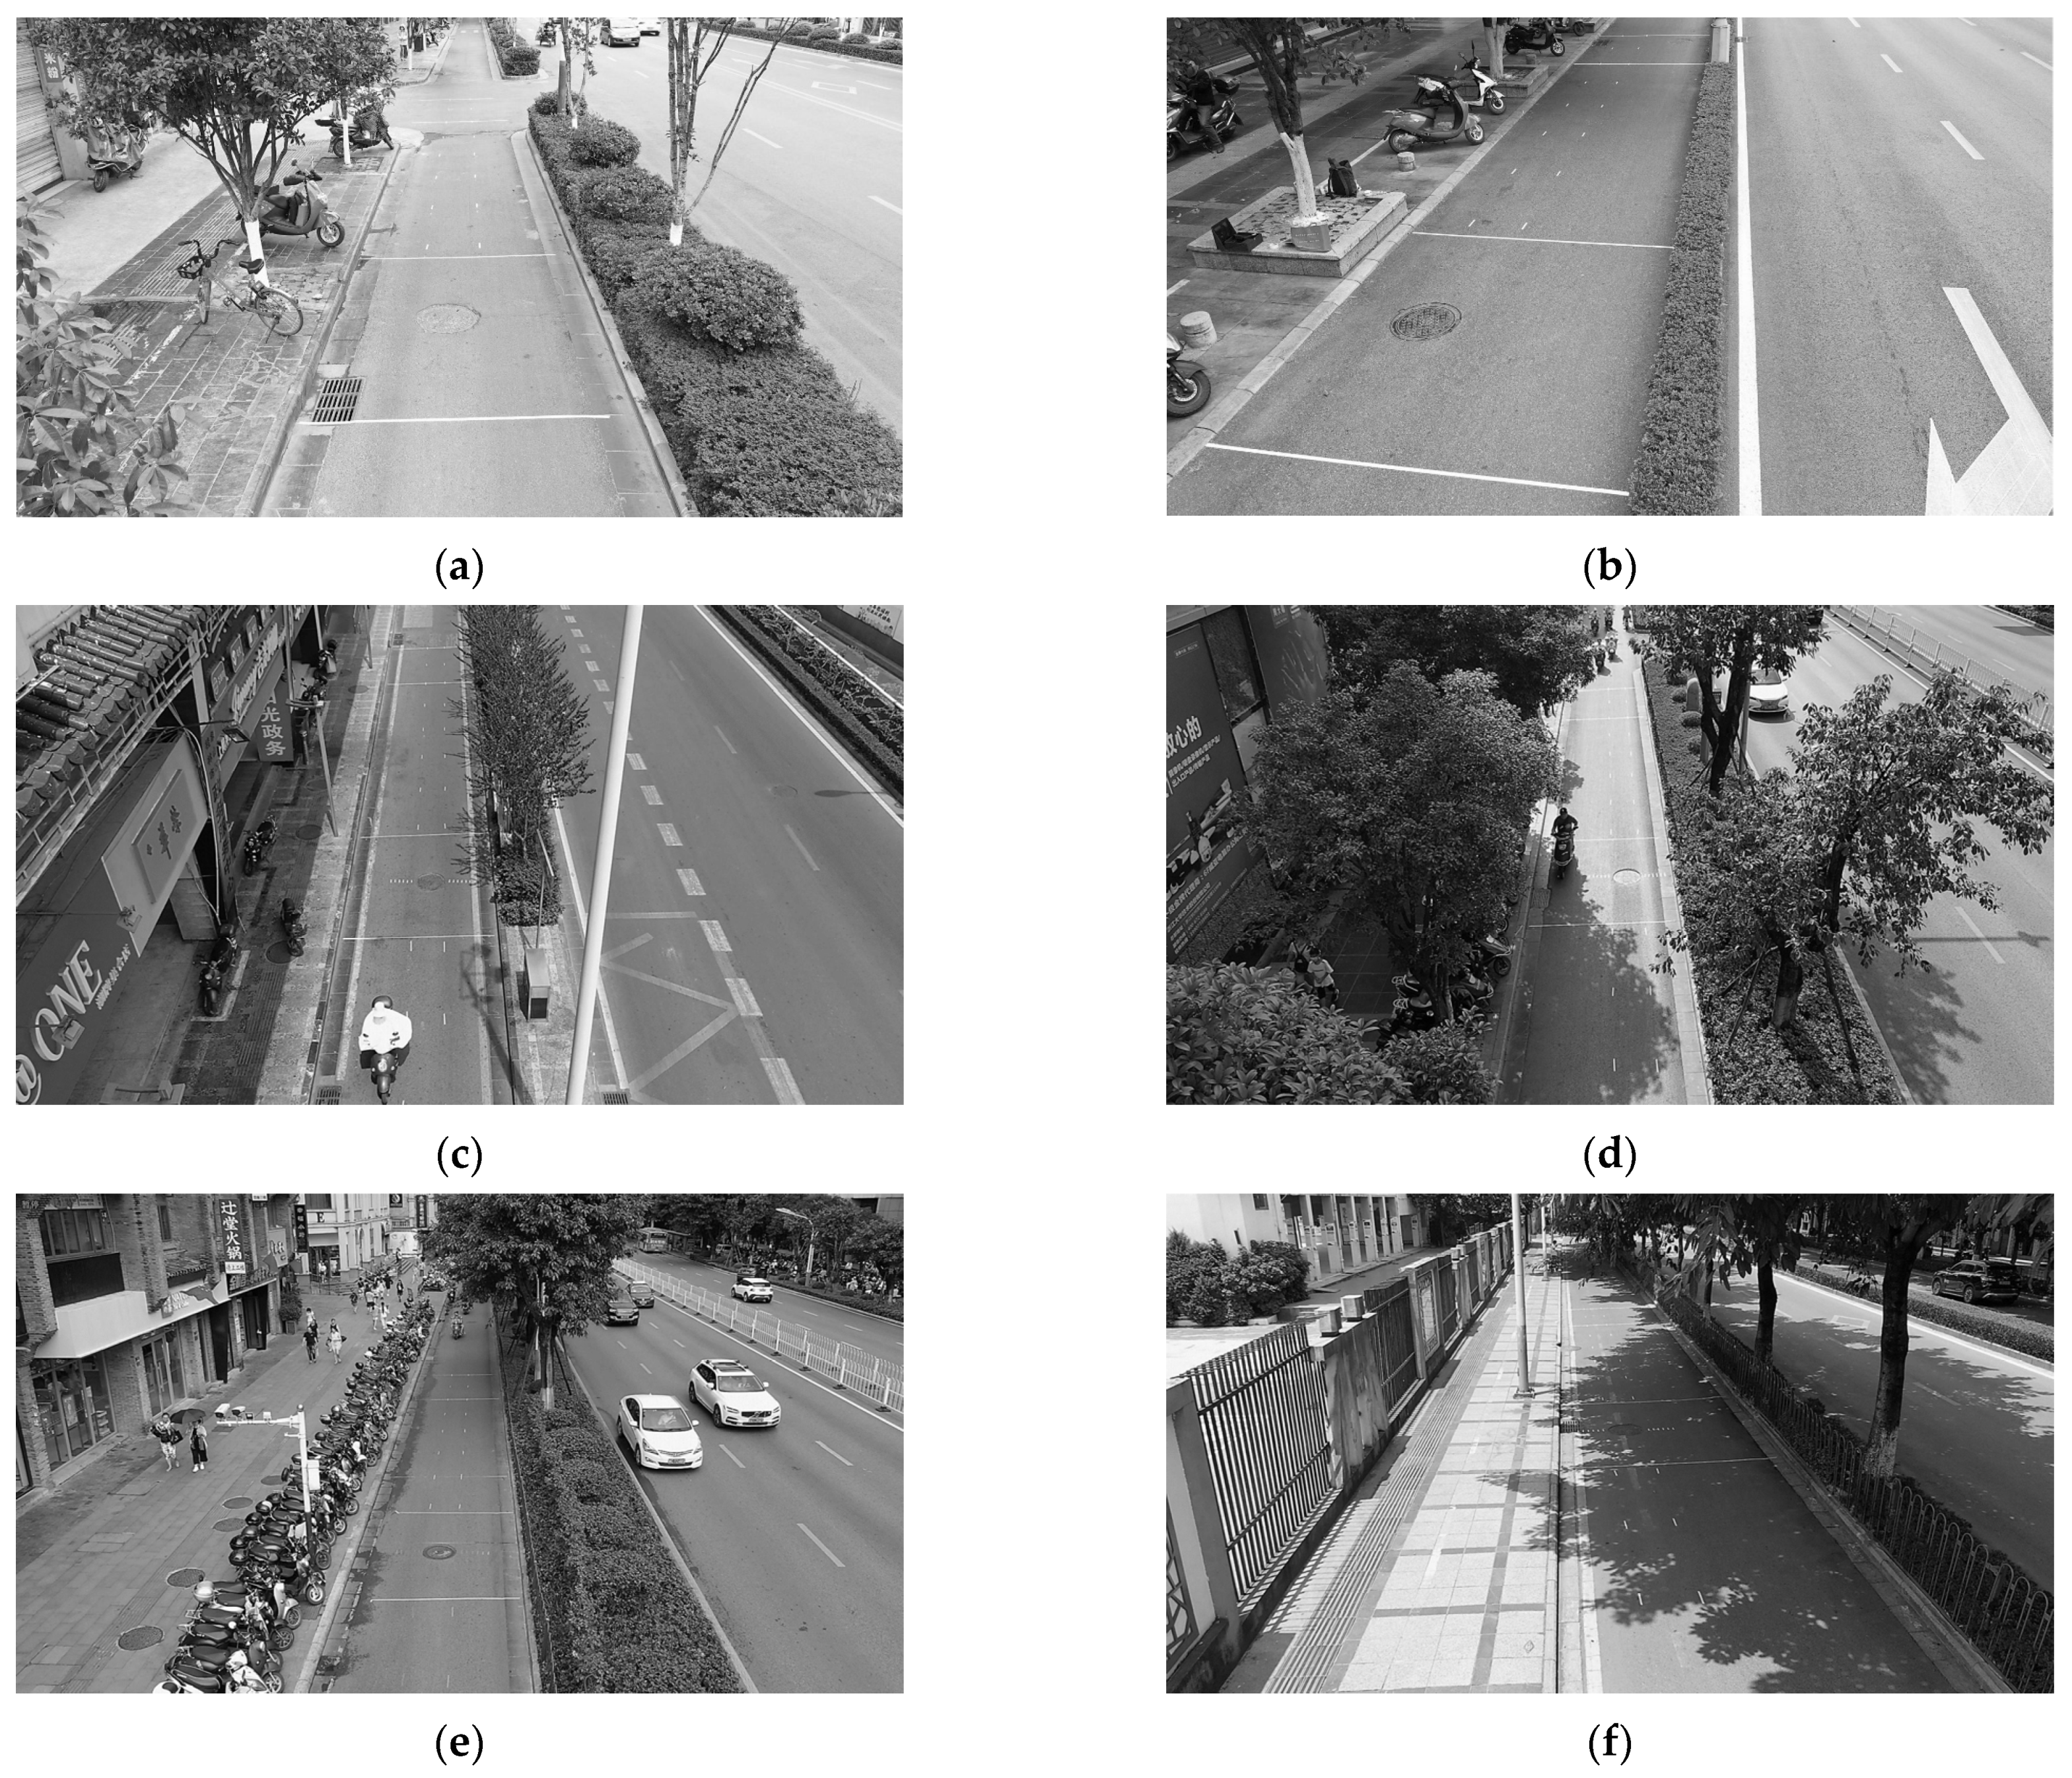
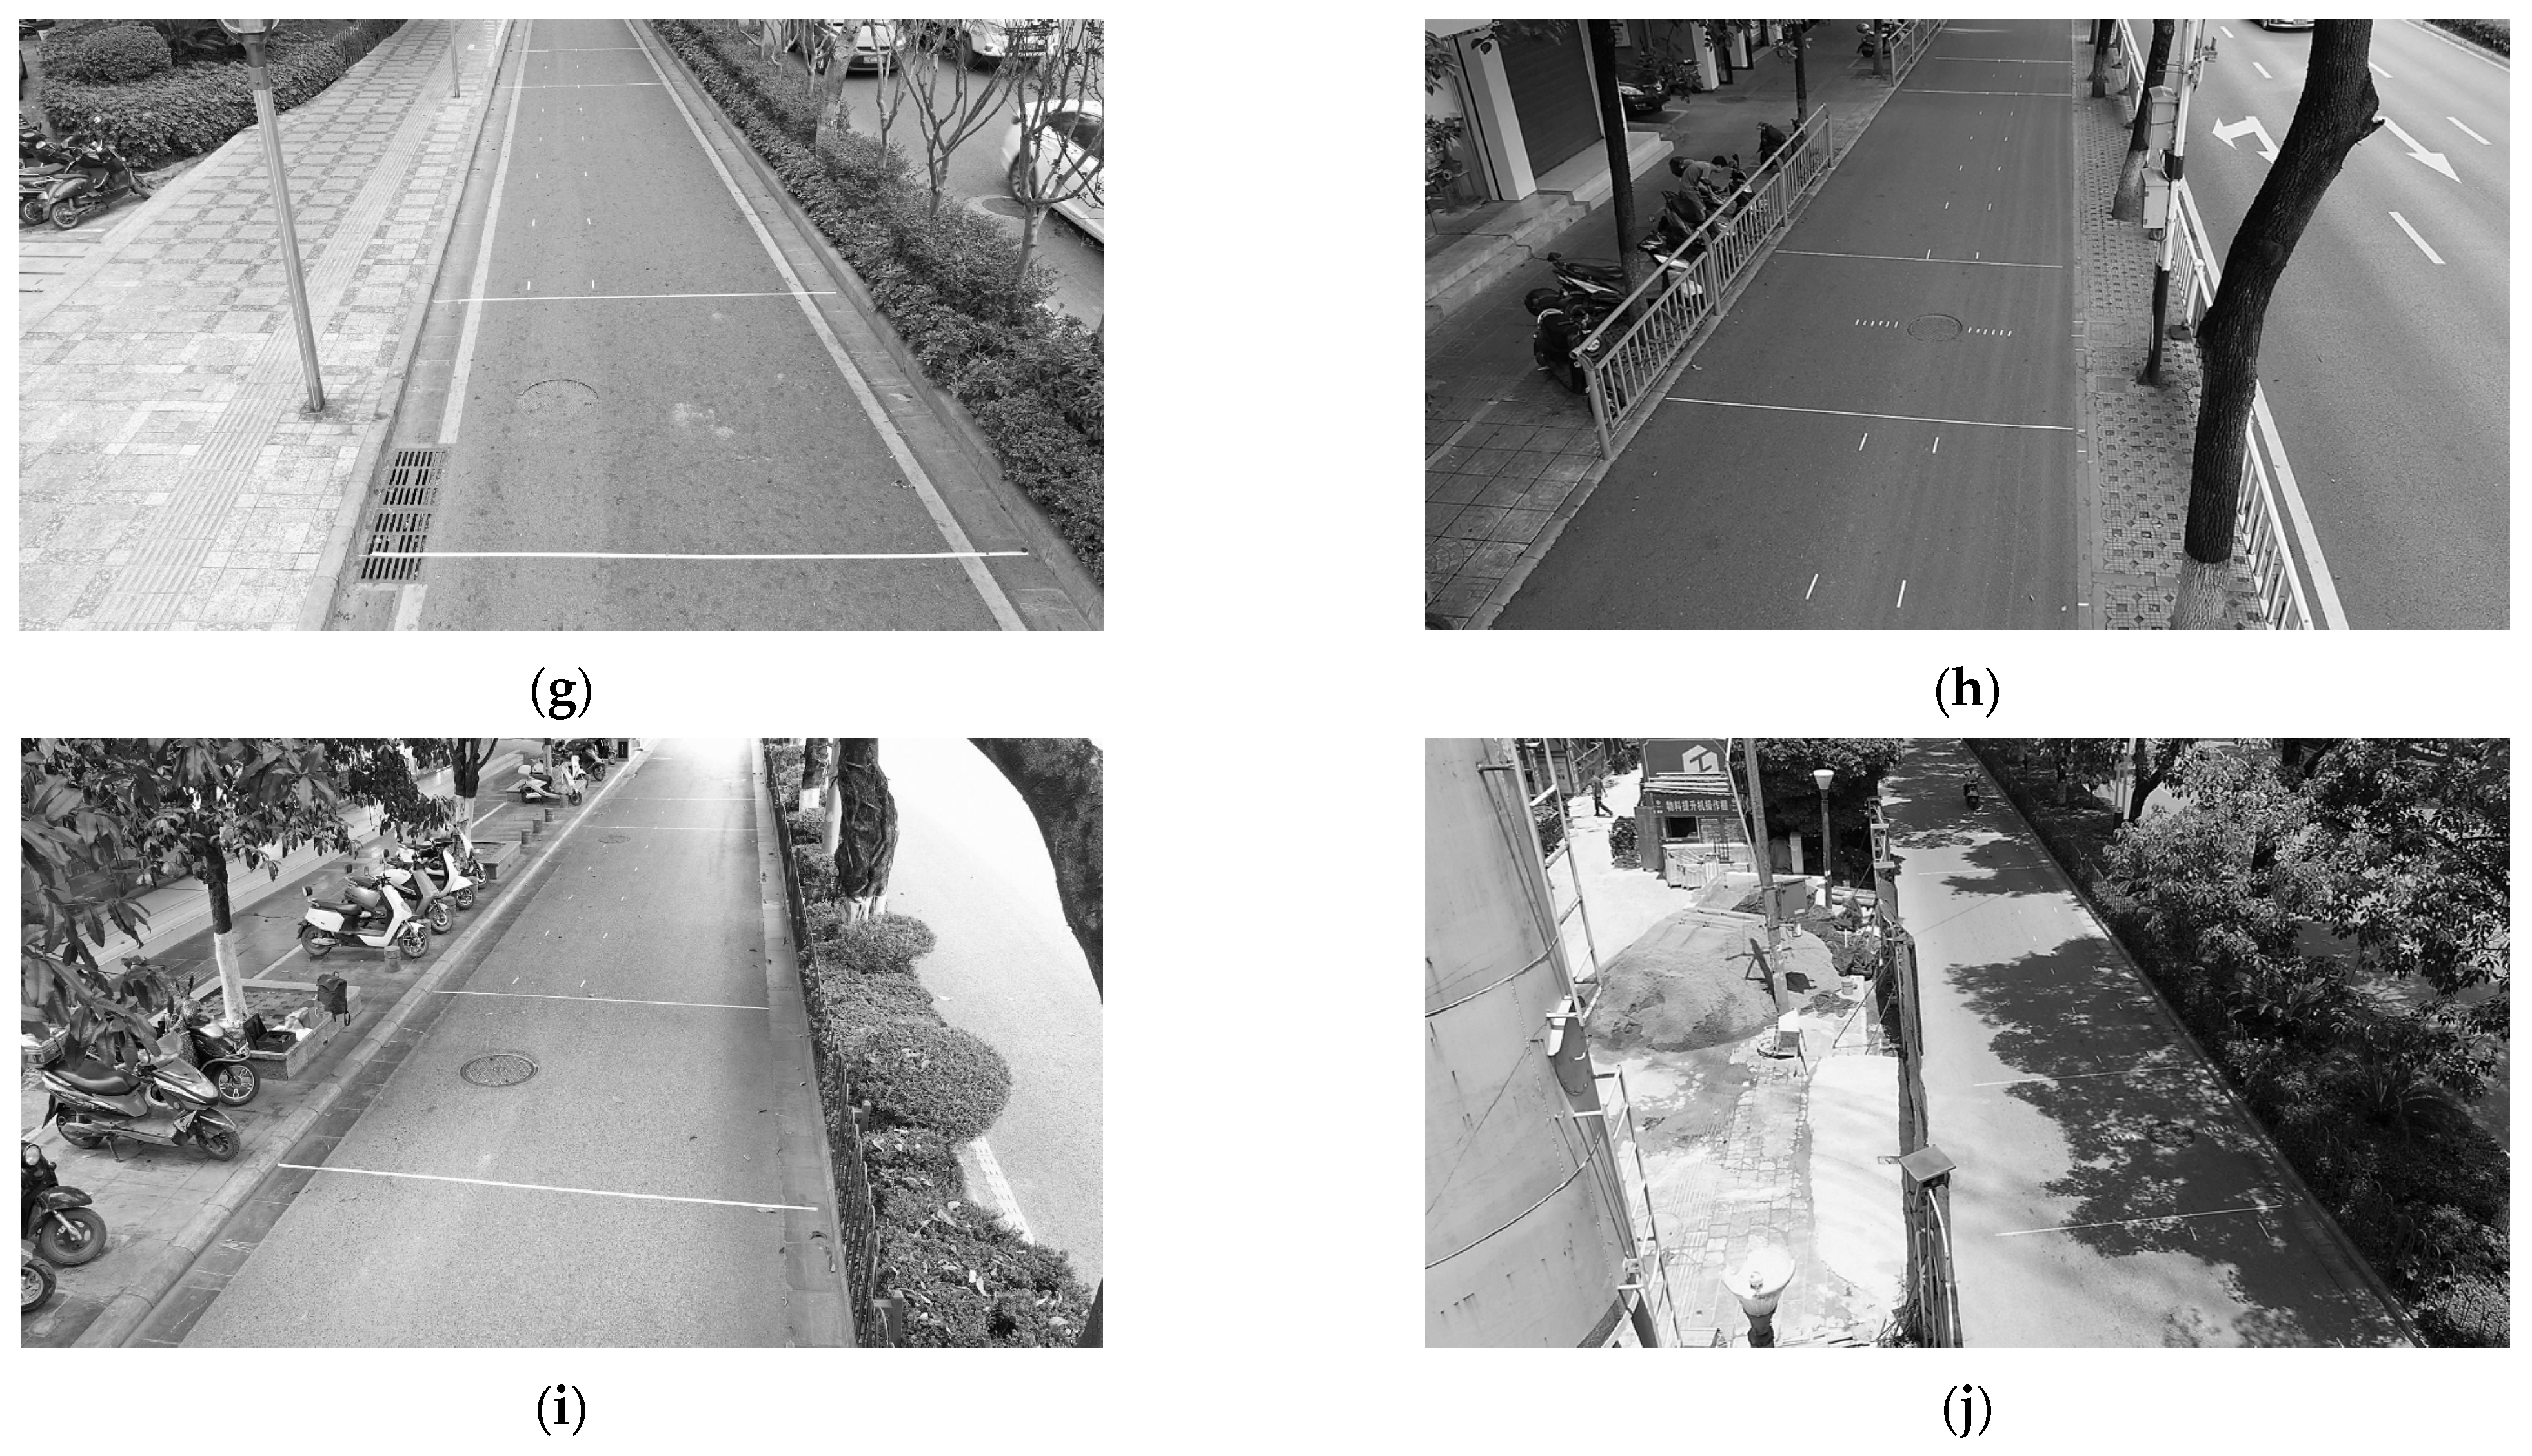
2.1. Survey Section
2.2. Data Collection and Processing
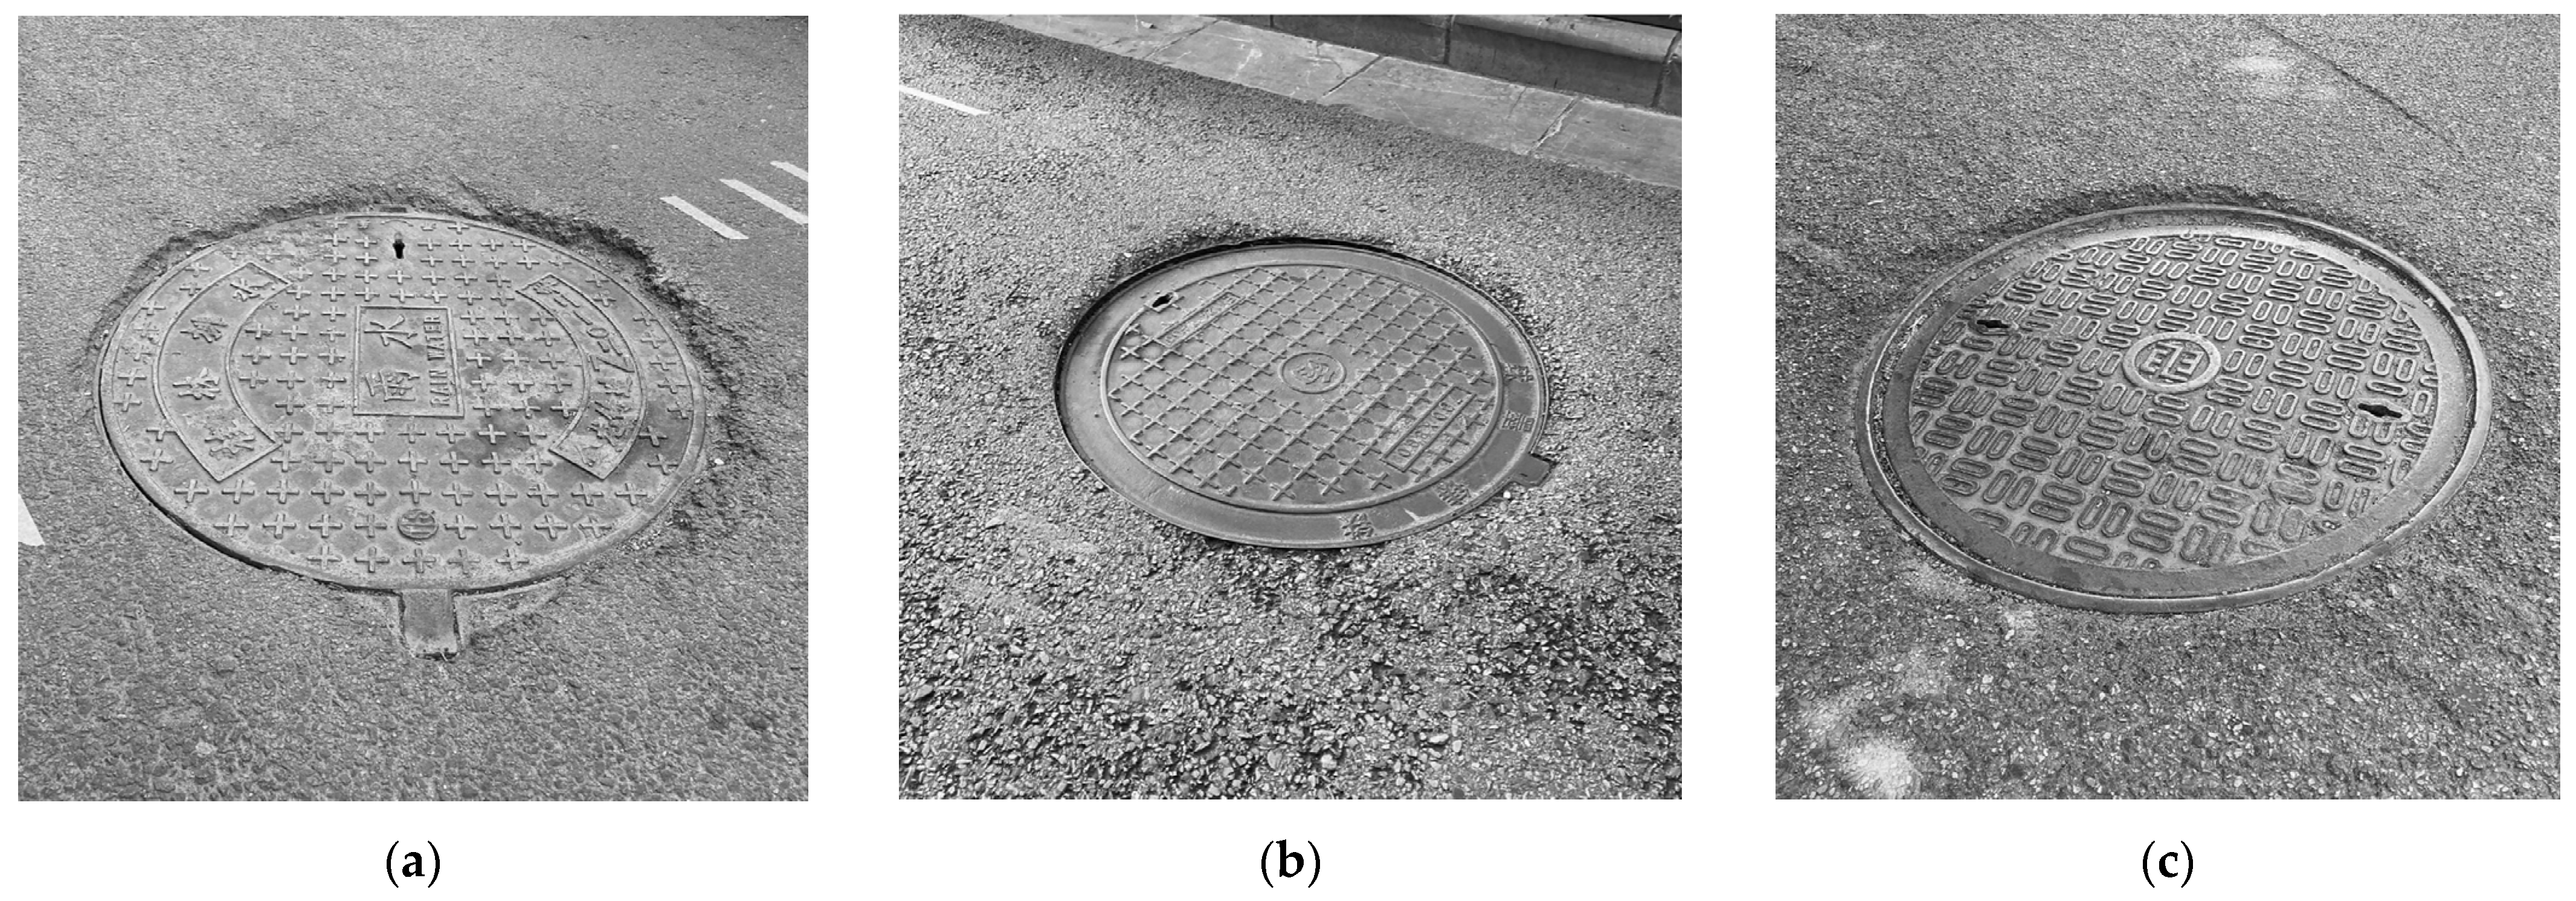
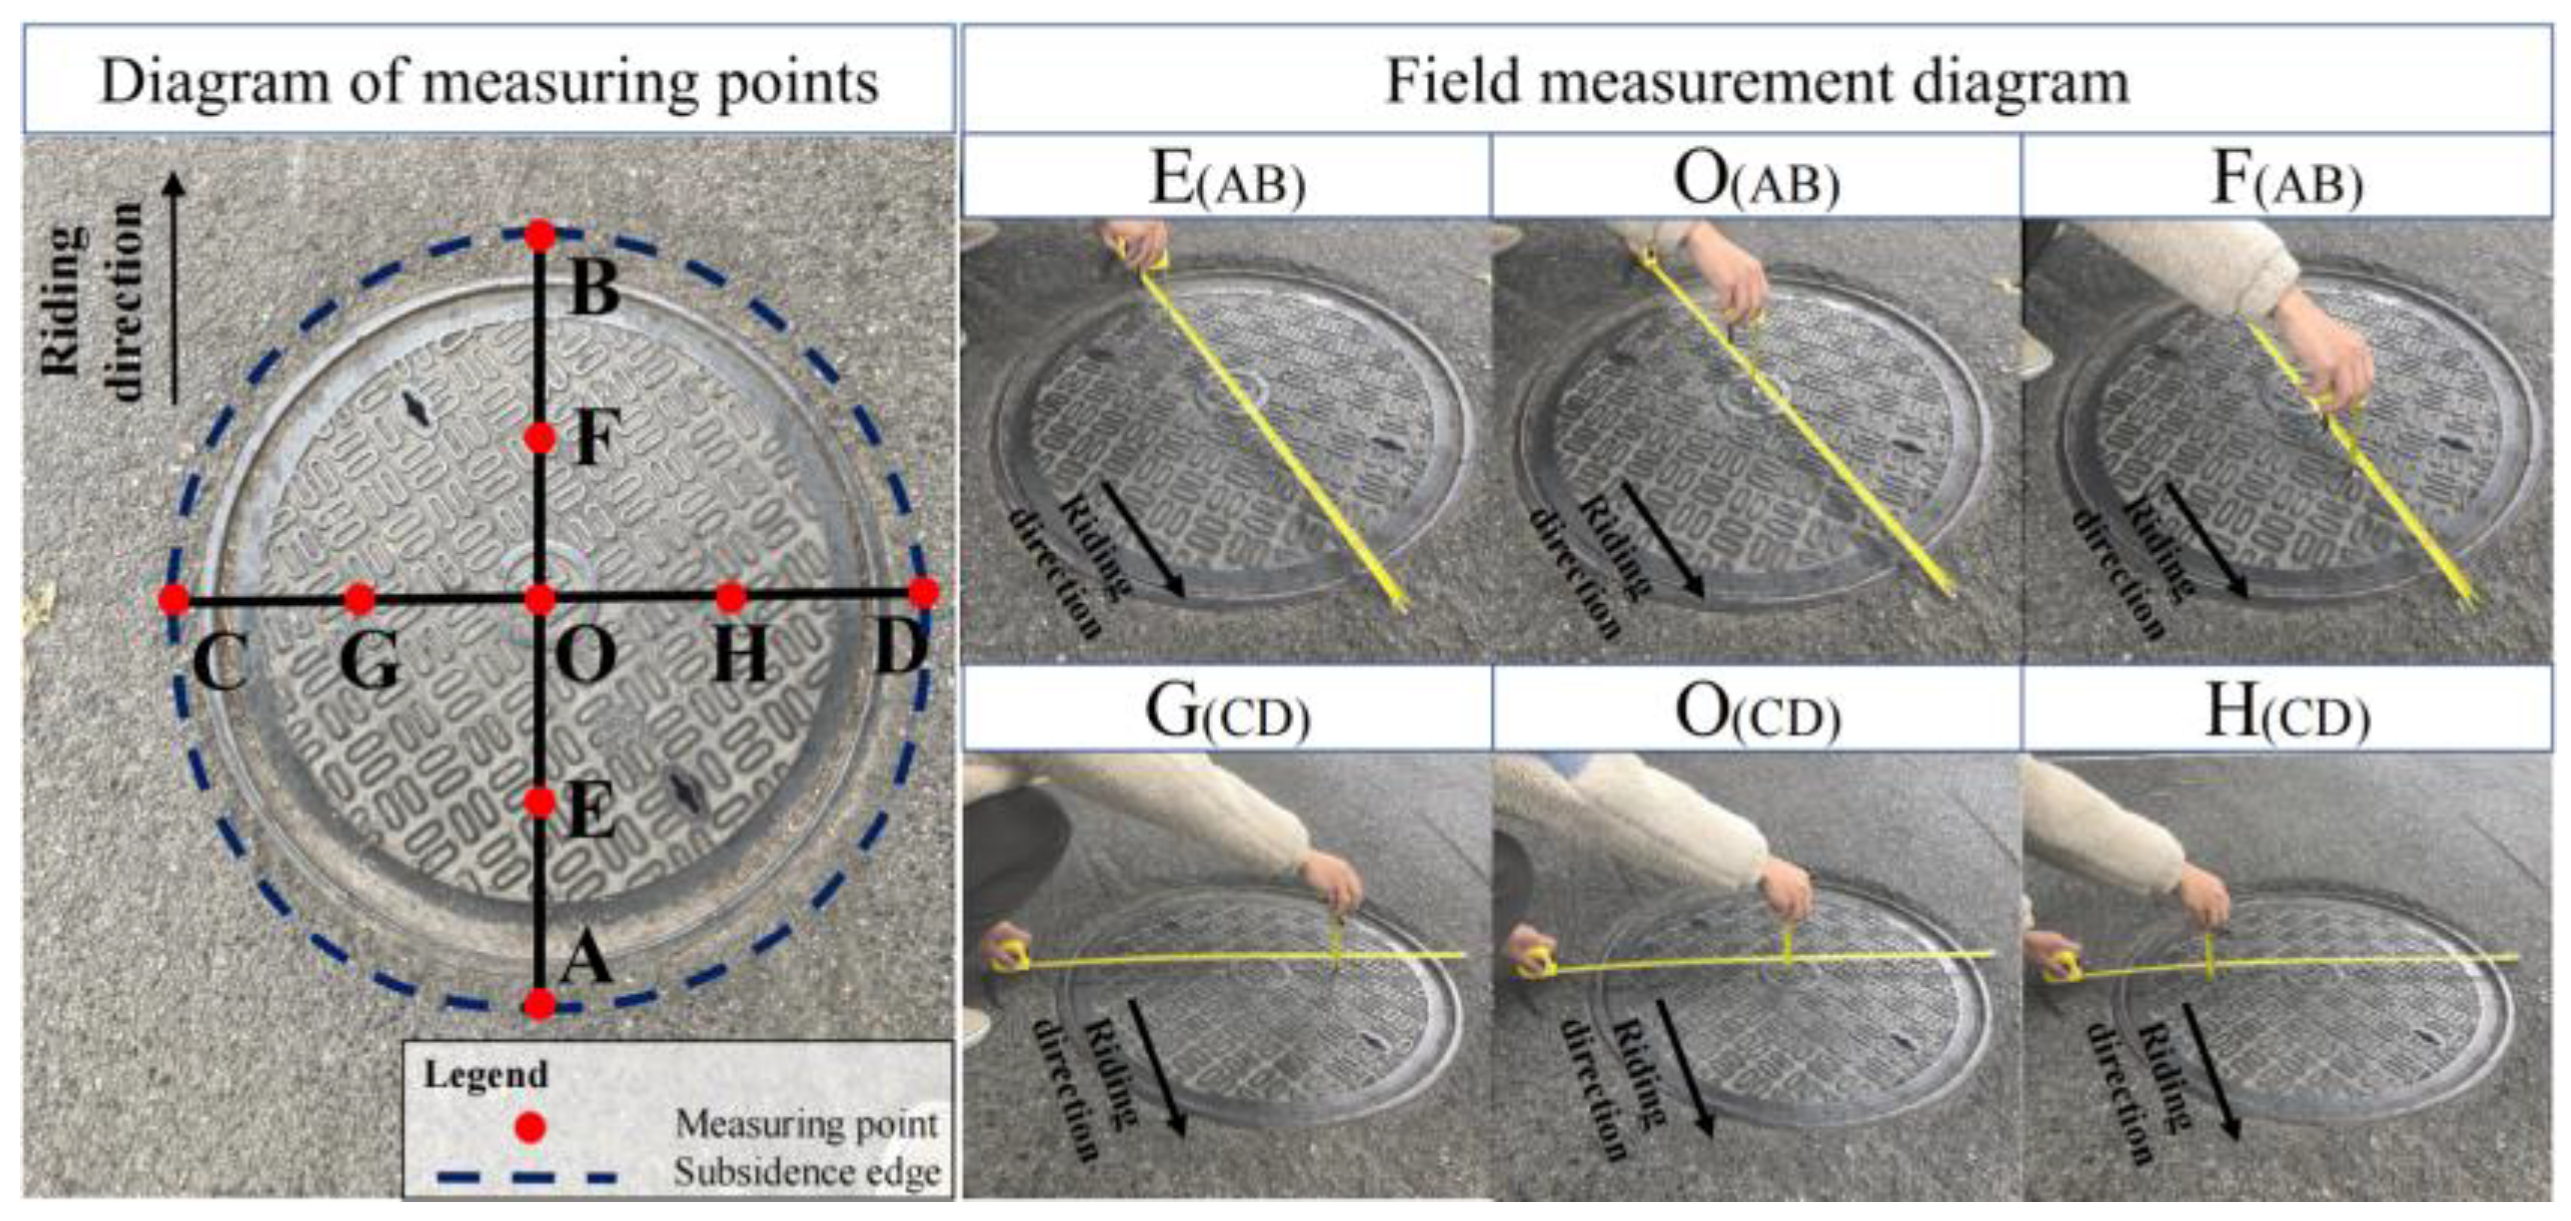
2.2.1. Depth Measurement of the Subsidence Area
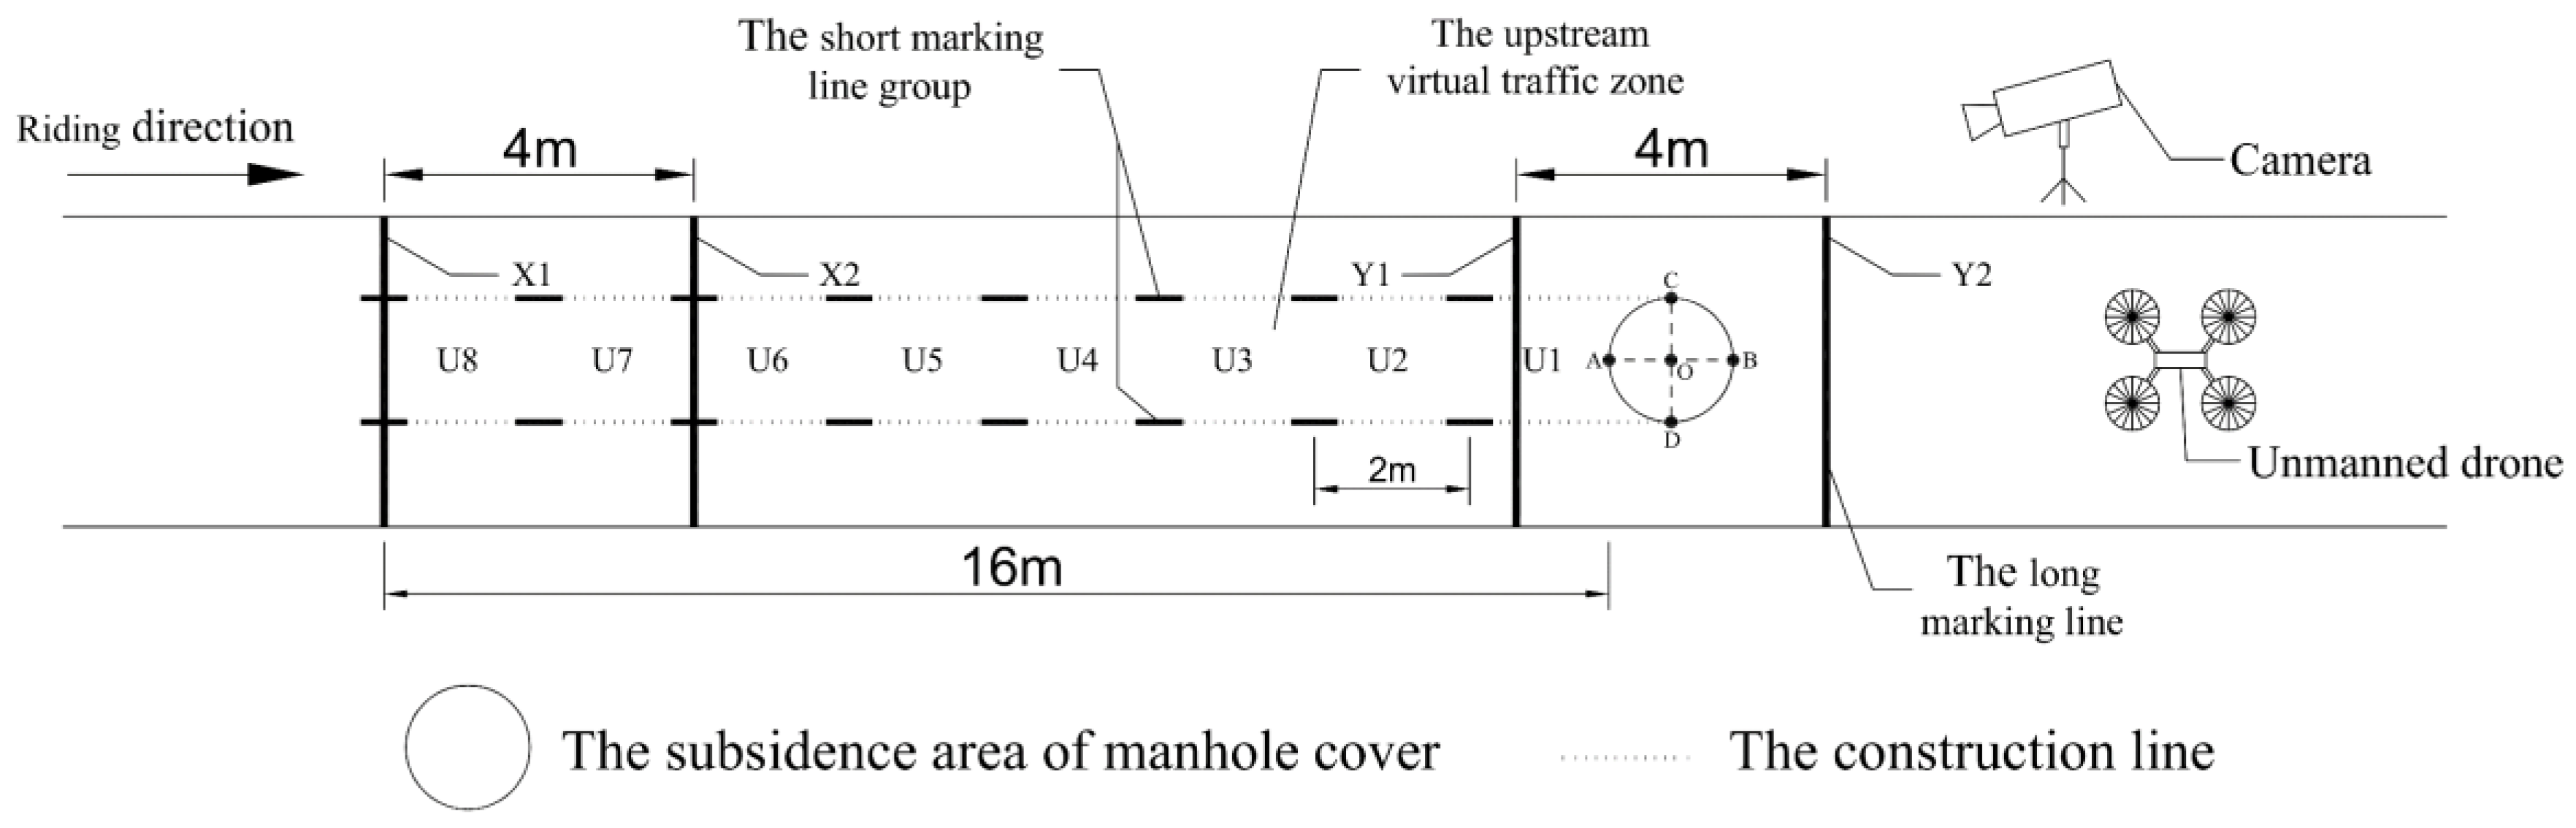
2.2.2. Definition of Upstream Virtual Traffic Zone in the Survey Area
2.2.3. Definition of Velocity Collection Area
2.2.4. Collection Requirements
2.2.5. Data Statistics and Pre-Processing
3. Methodology
3.1. Classification and Definition of Riding Behavior
3.2. Selected Probability of Riding Behaviors and the Influencing Factors
3.3. Selected Probability Model of Riding Behavior
3.3.1. Definition of Velocity Collection Area
3.3.2. Selected Probability Model of Combined Riding Behavior
4. Discussion
- (1)
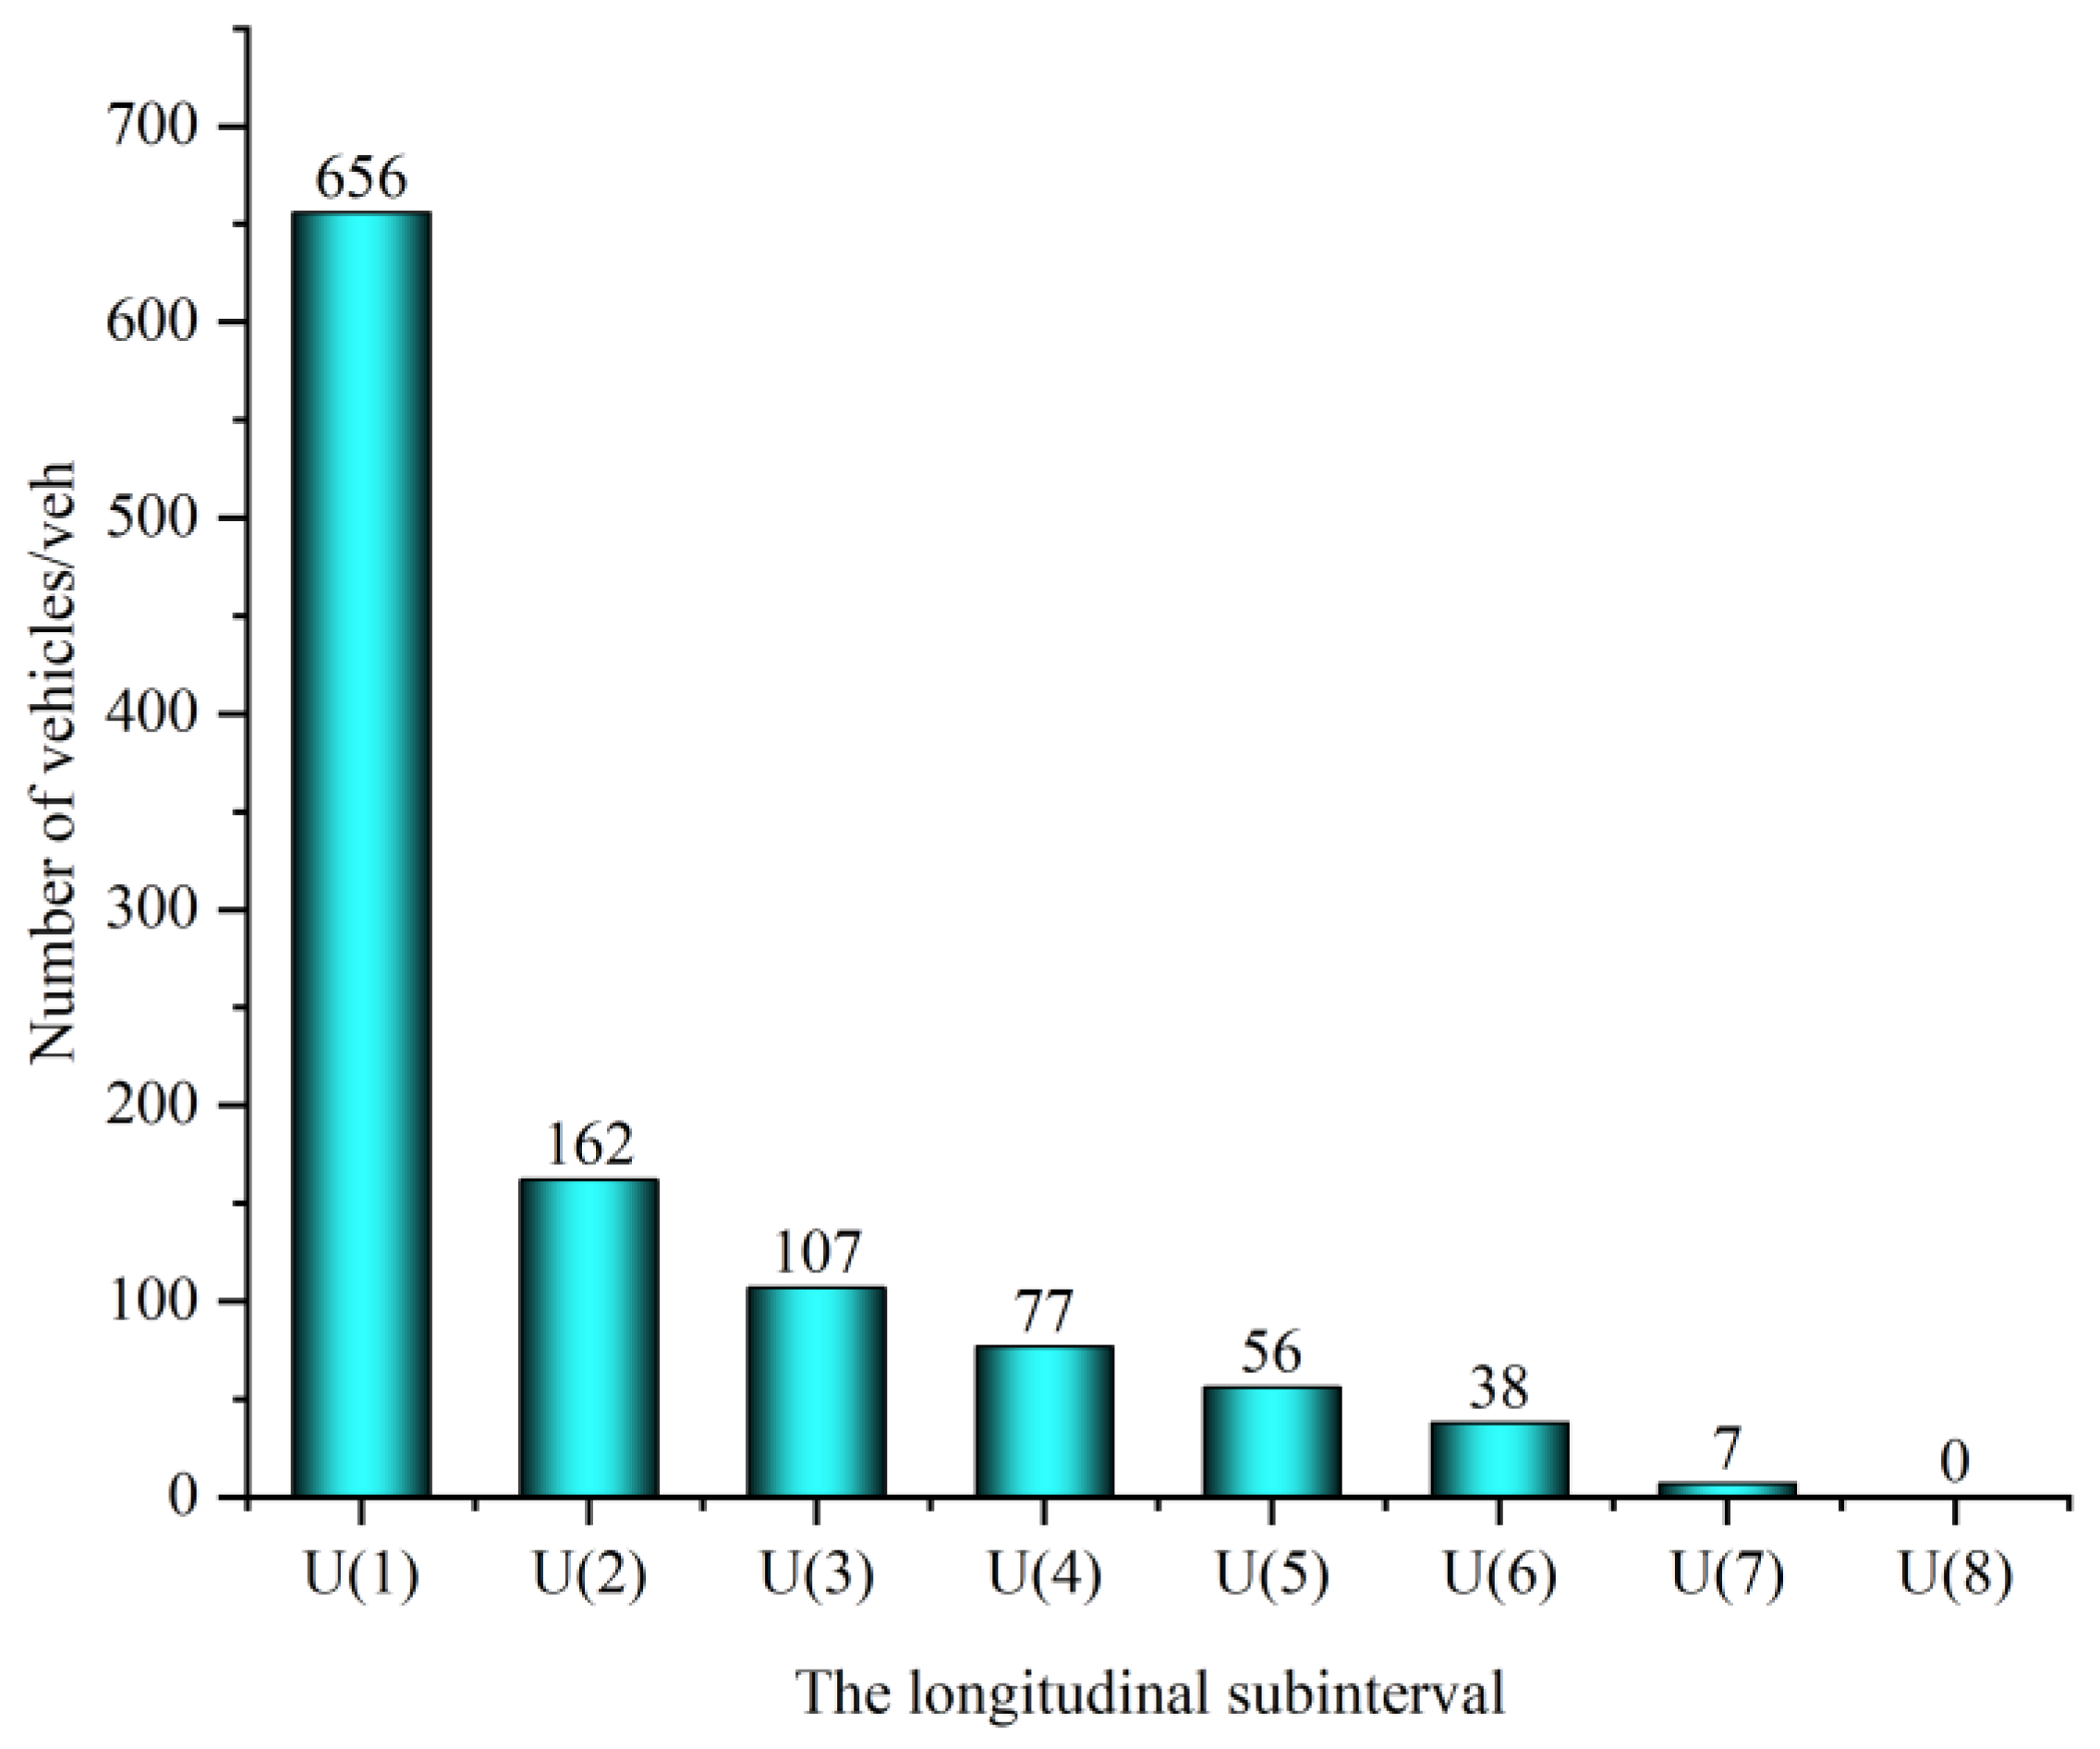
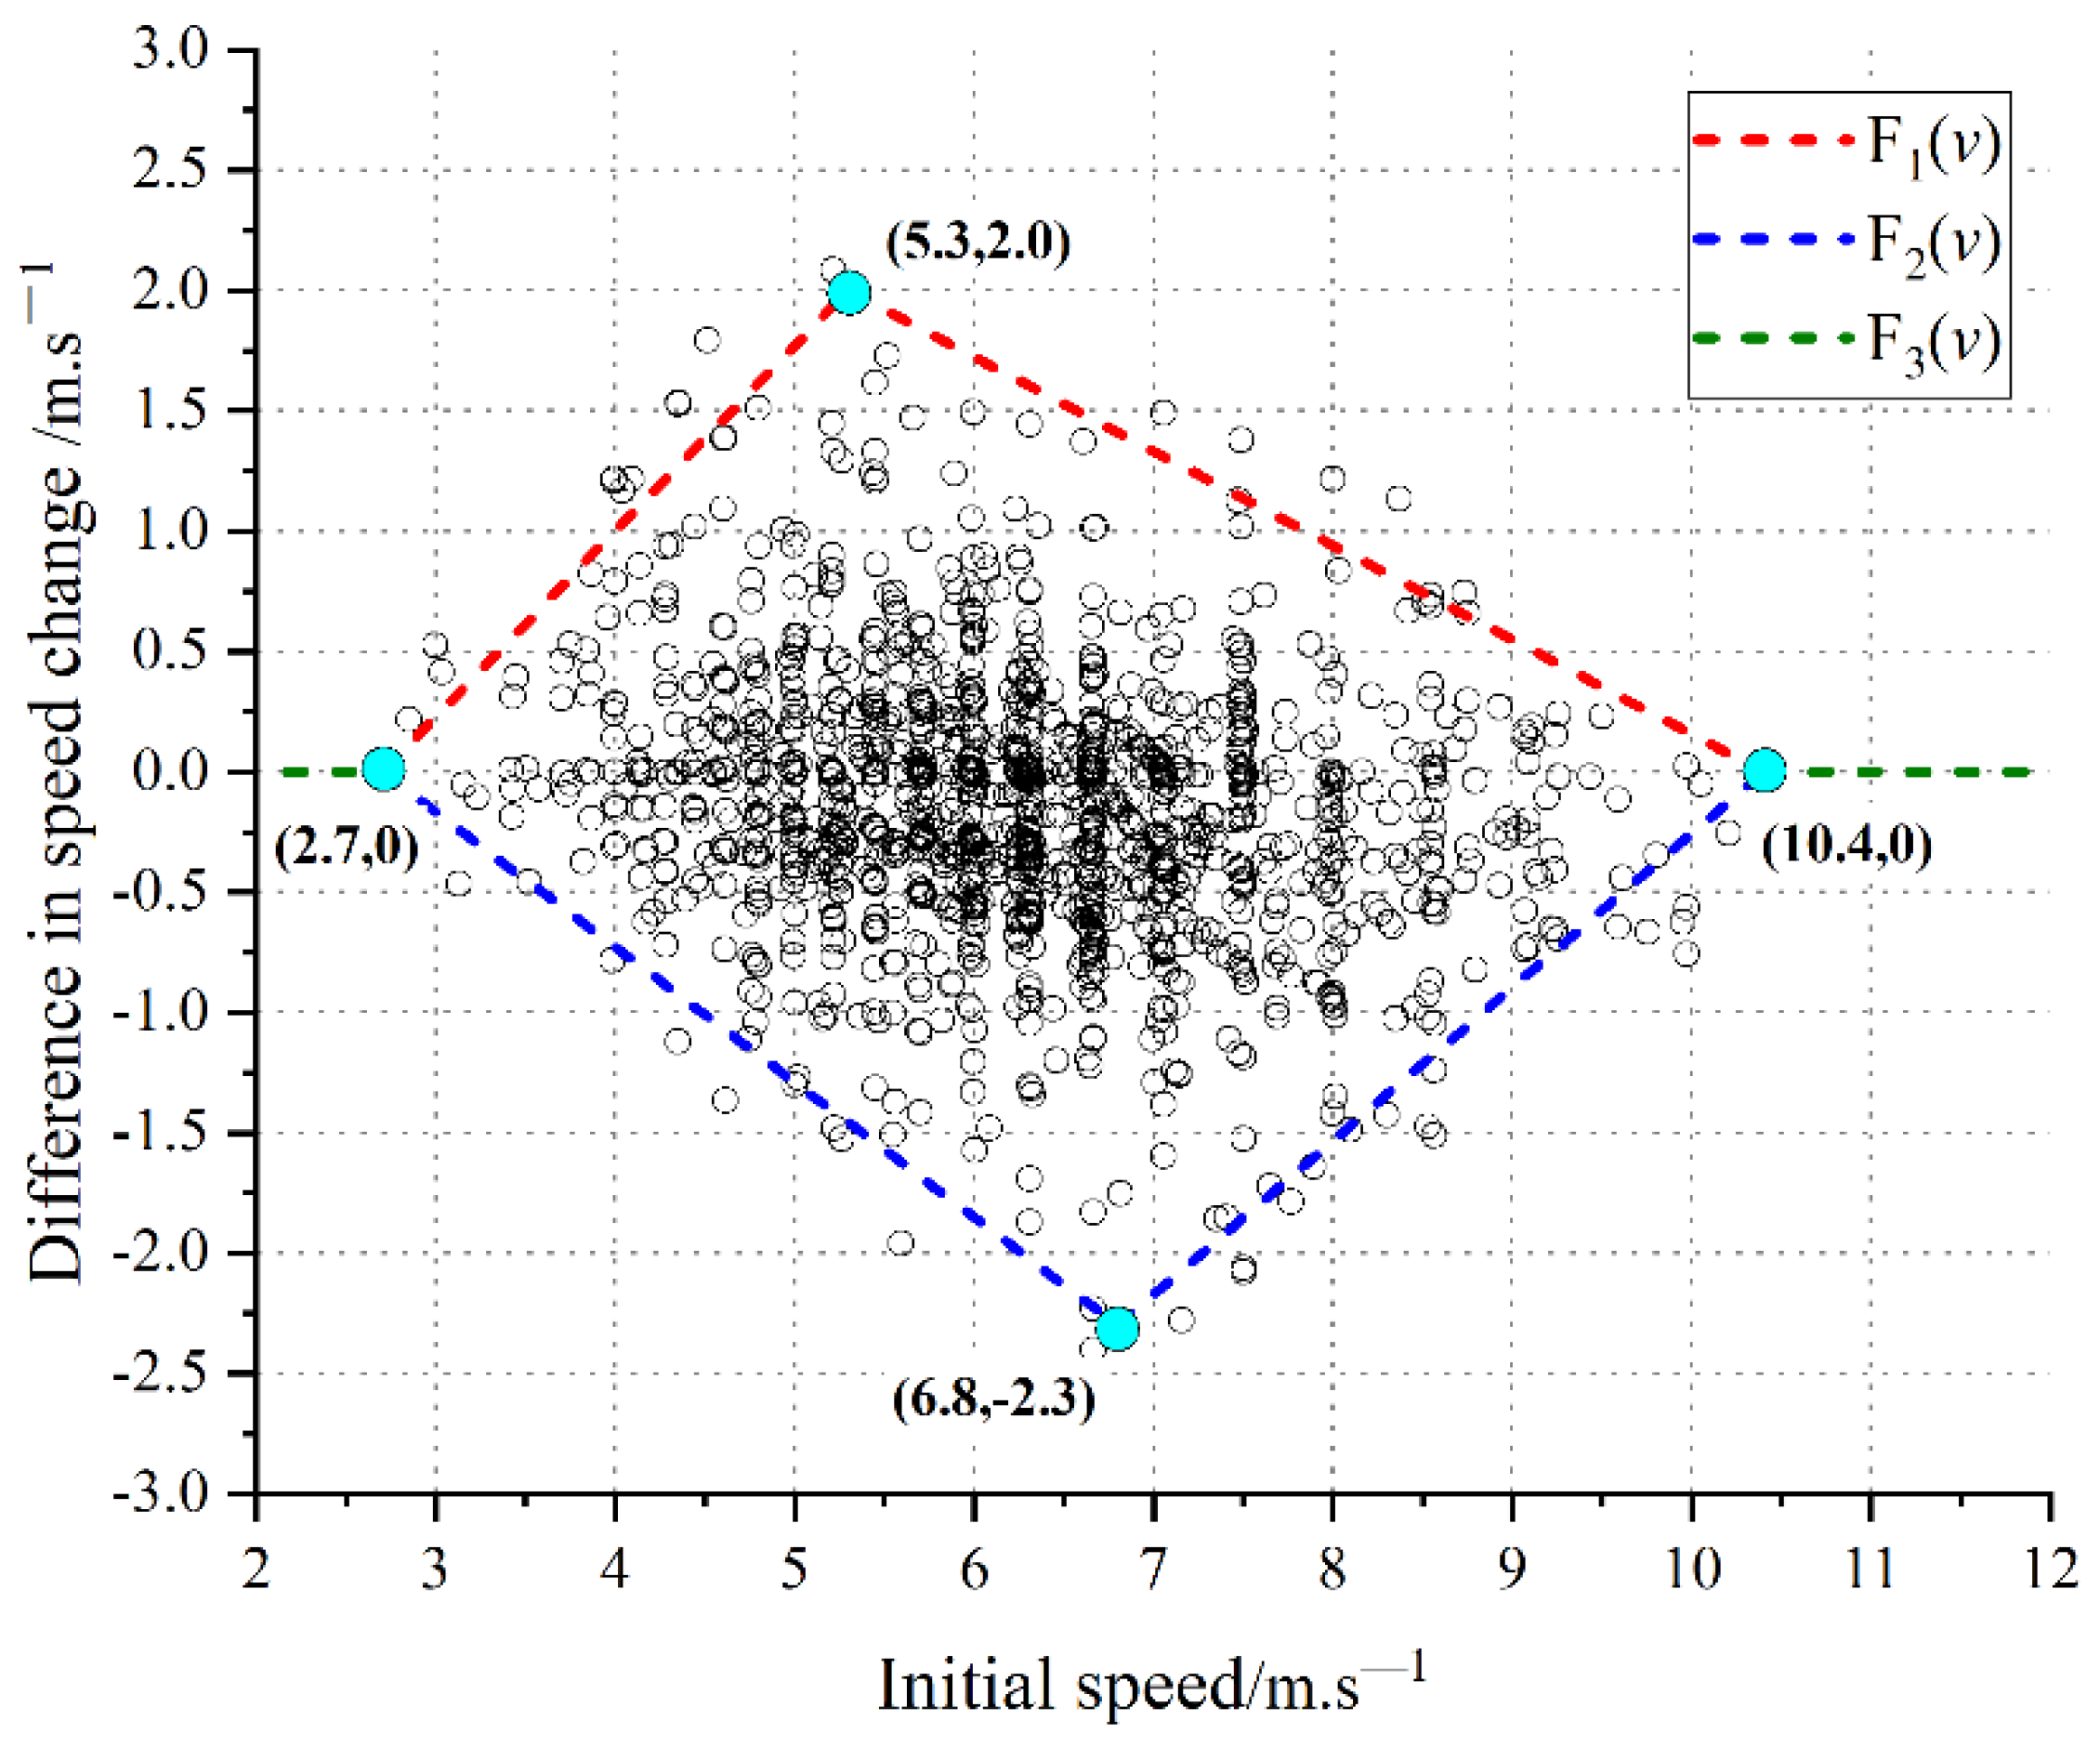
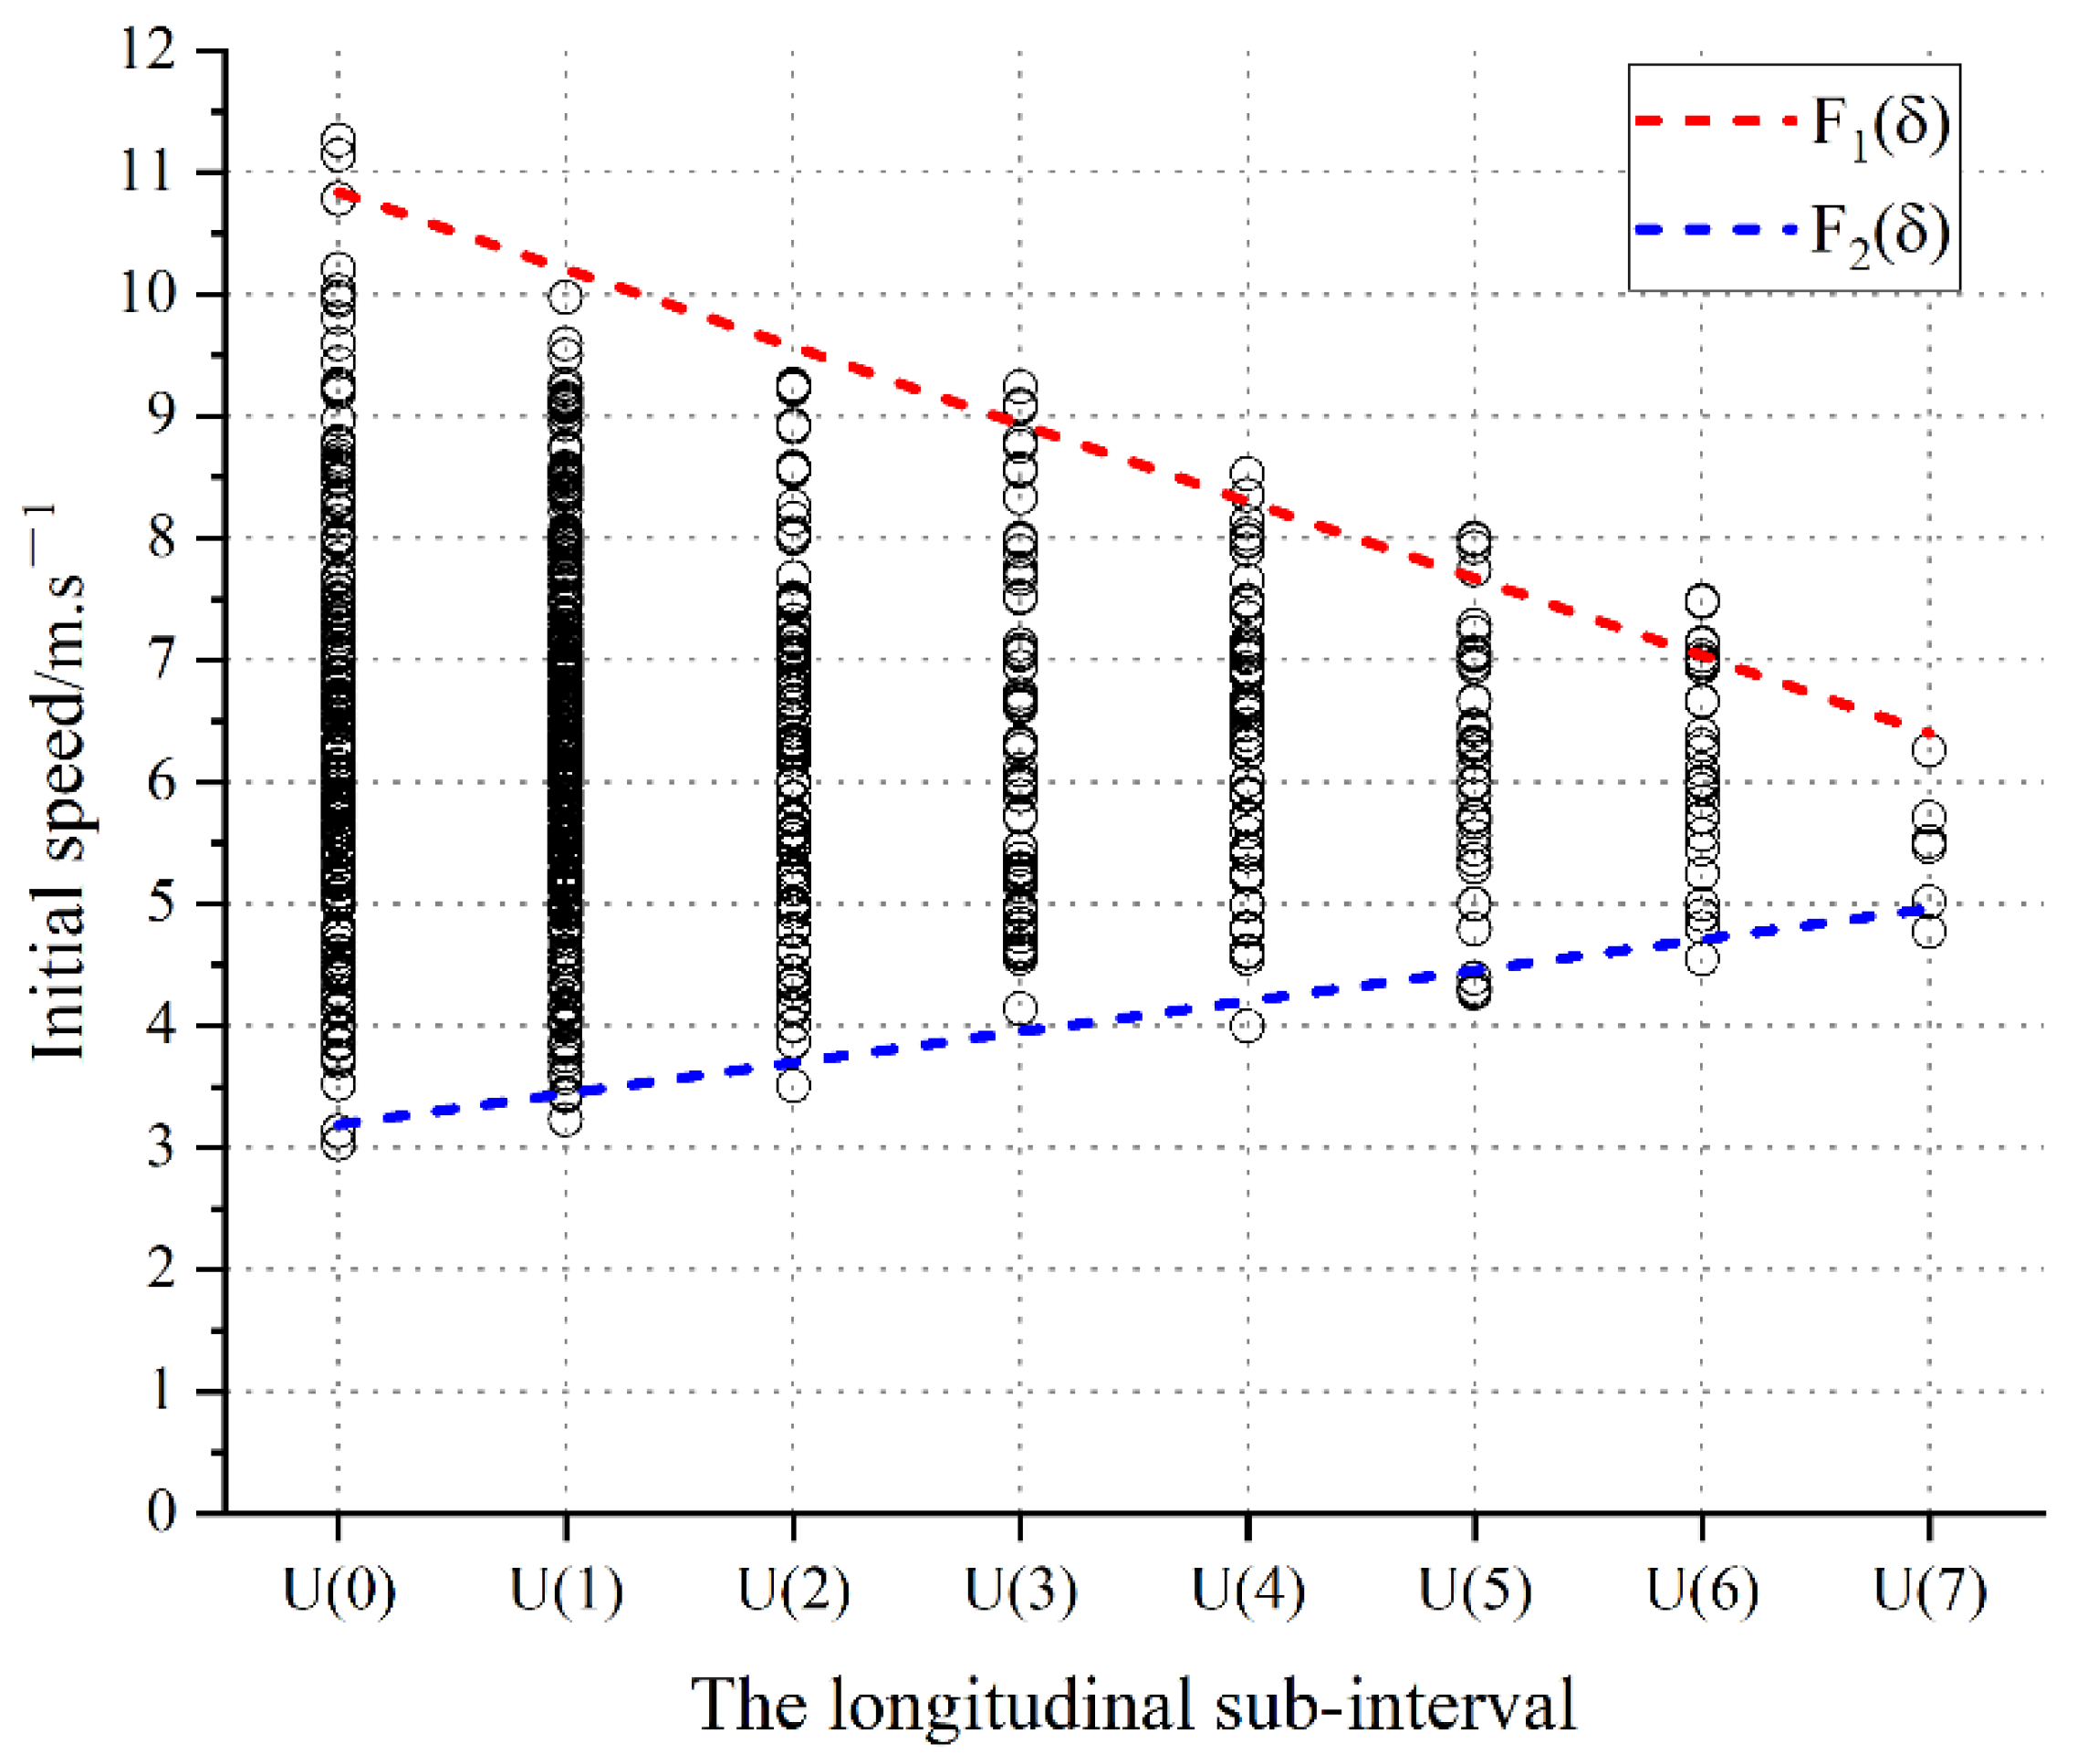
- The results in Figure 6 and Figure 7 show that under the subsidence of manhole cover conditions, when the speed reaches a great value () or a very small value (), two-wheelers have almost no speed change and detour behavior. The reasons are as follows: when the two-wheelers reach the sight distance where the manhole cover can be recognized and identified, the faster the two-wheeler speed is, the less reaction time and operation time for the rider; when the speed reaches a great value, the rider allocates more attention to observe the surrounding disturbance (such as observing the surrounding disturbing pedestrians or disturbing vehicles) to improve the safety of riding, but ignores the observation of the road condition, which in turn leads to a situation where the rider cannot make effective behavior to avoid or improve the comfort of passing when encountering the manhole cover; when the traffic density is very high or the investigated two-wheeler is a human-powered bicycle, the speed may reach a very small value, the impact of the manhole cover on the two-wheeler is minimal and the two-wheeler can pass through the subsidence area without changing its riding behavior.
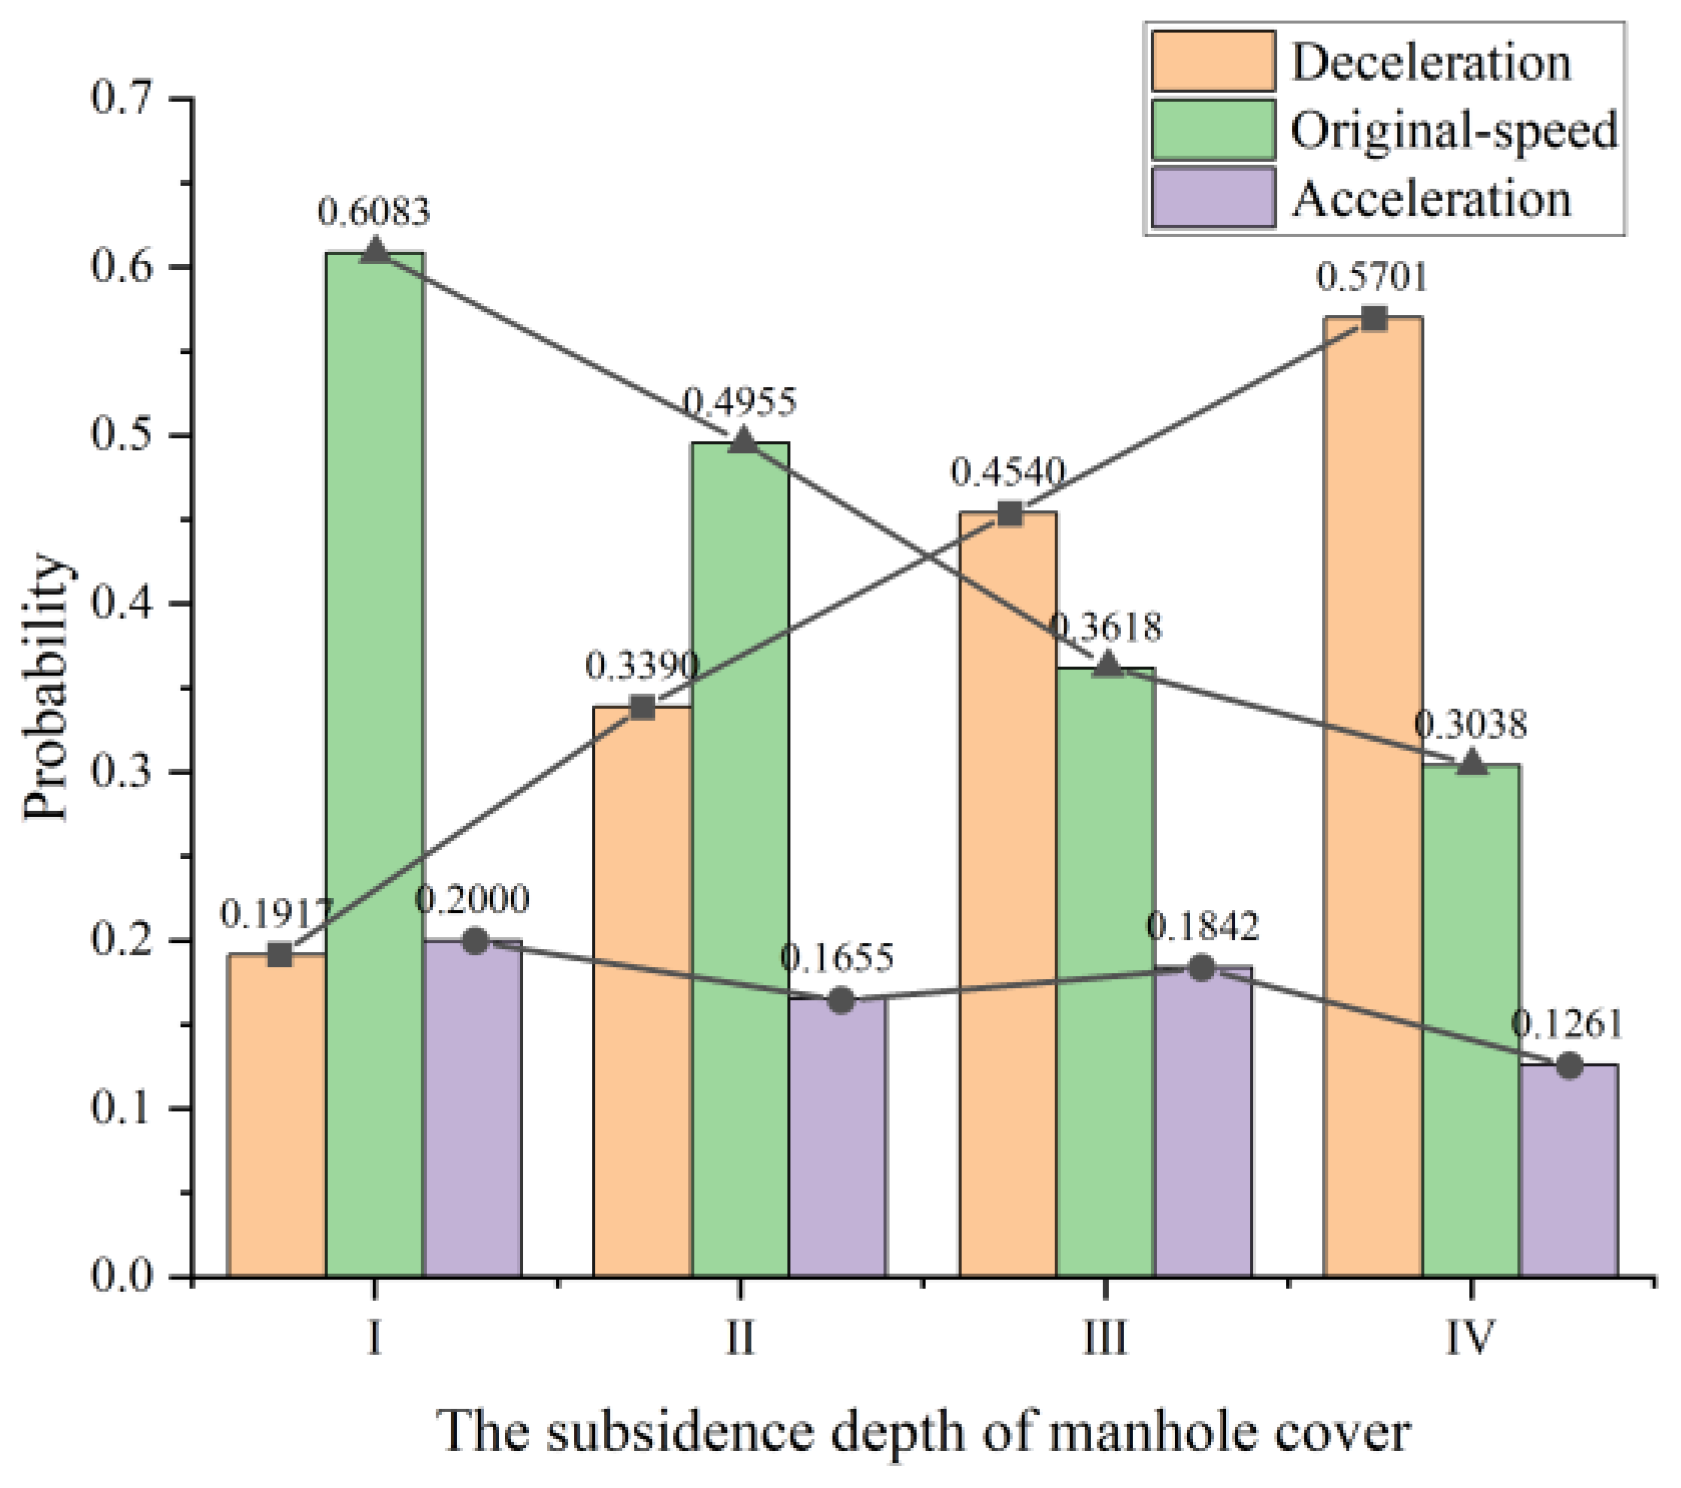
- (2)
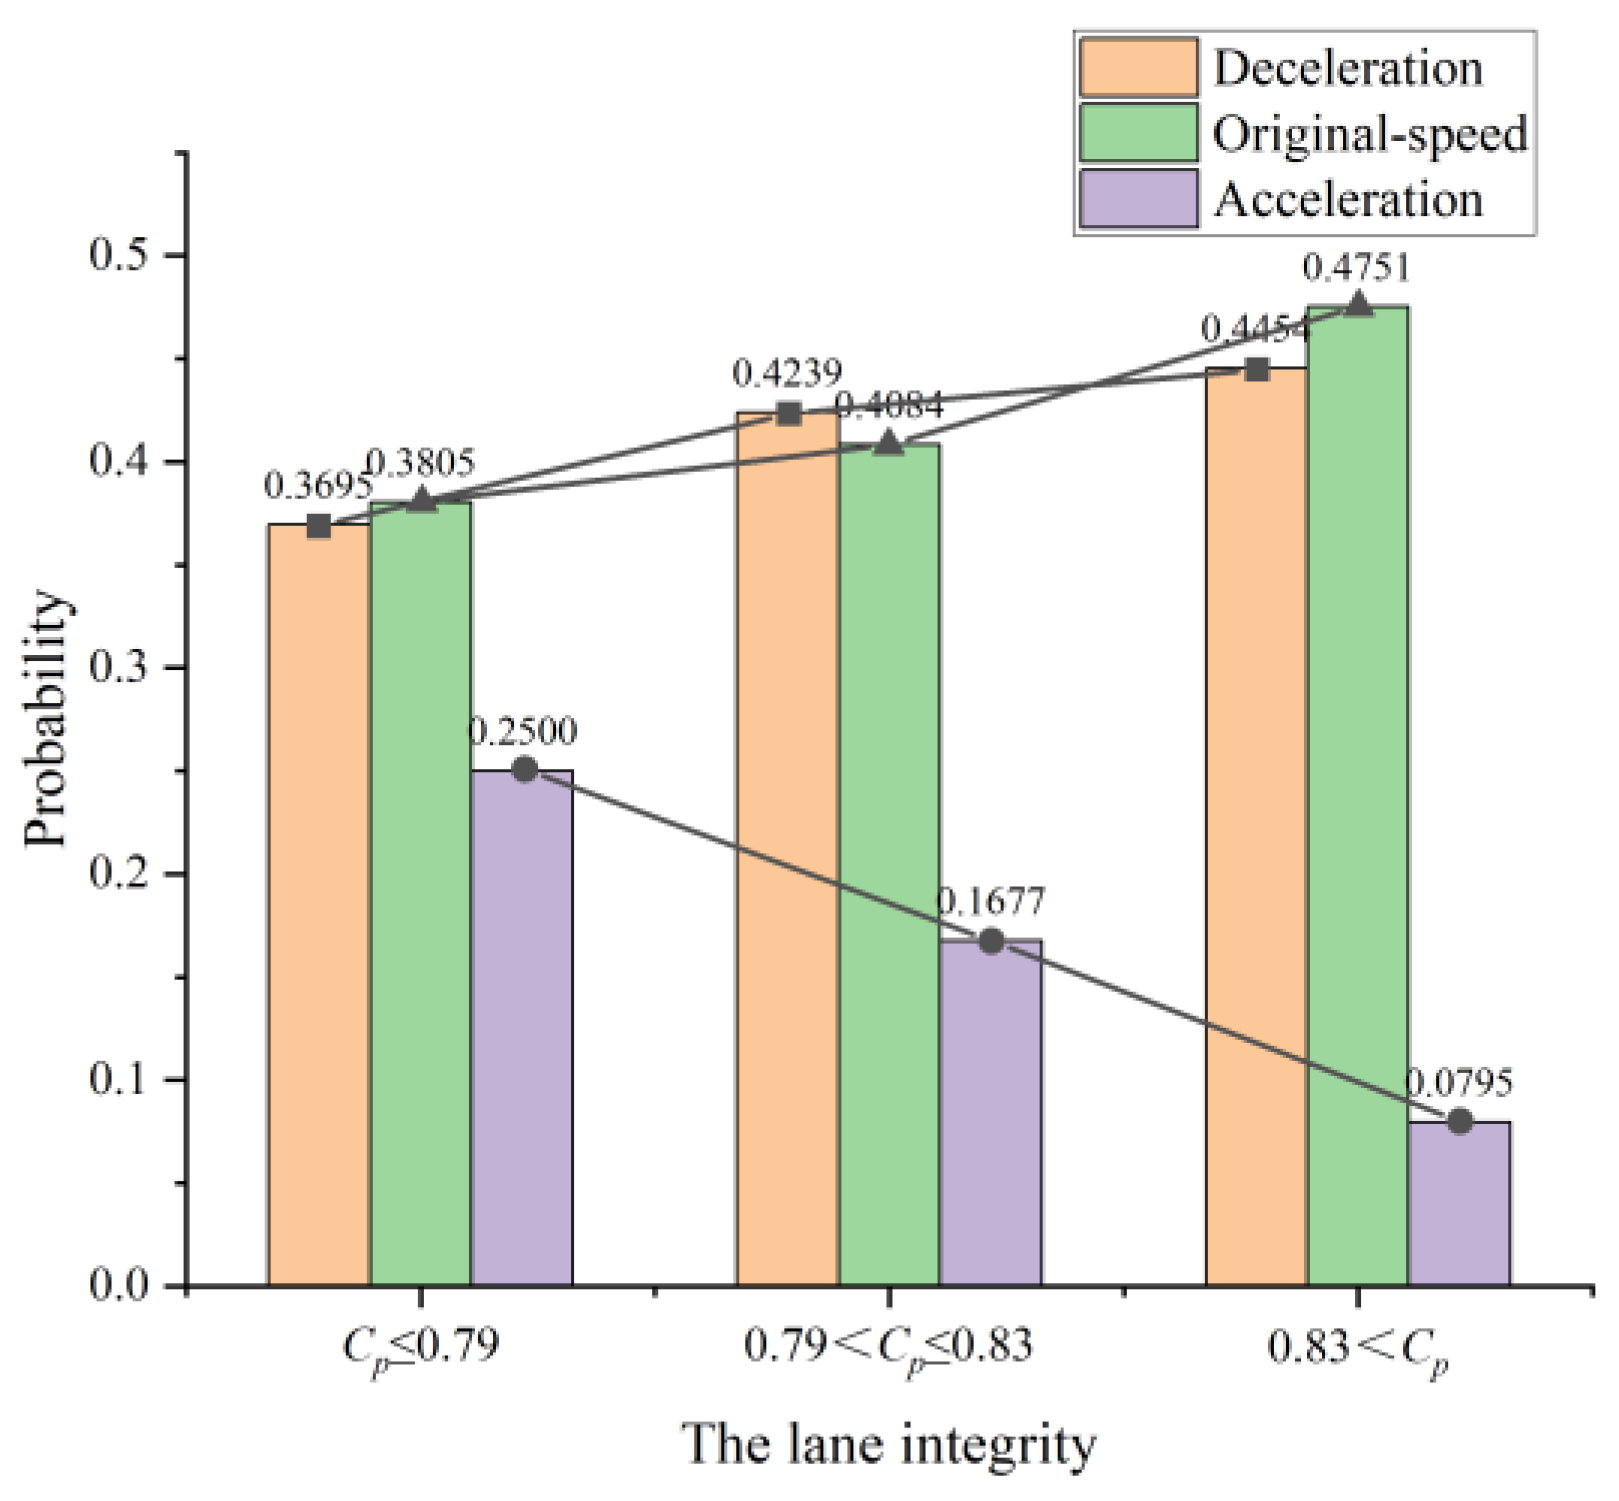
- The results show that the subsidence depth was positively correlated with the probability of deceleration behavior and negatively correlated with original-speed behavior (as shown in Figure 20); lane integrity was positively correlated with the probability of deceleration and original-speed behavior (as shown in Figure 21). The reasons are as follows: the subsidence depth is an influencing factor for the rider to get the information intuitively. The rider can quickly make the judgment of deceleration or original-speed behavior after getting the information of subsidence depth within sight distance and confirming that there is no interference in the surrounding area to improve the riding comfort and safety. In addition, lane integrity is also an important influencing factor. Since the transverse cross-sectional width of the manhole cover sinkhole area is similar, the lane integrity can indirectly reflect the bicycle lane width. If the transverse width of the manhole cover area is the same, the greater the lane integrity, the greater the bicycle lane width. Under similar flow conditions, the greater the lane width, the lower the traffic density and the greater the spacing between two-wheelers. Under low-density conditions, there are fewer two-wheelers on the road that can interfere with riders, and the headways are larger, so riders can detect and discern the subsidence of manhole covers at a greater distance. This gives riders sufficient distance, reaction time and attention to make judgments about deceleration or original-speed behavior.
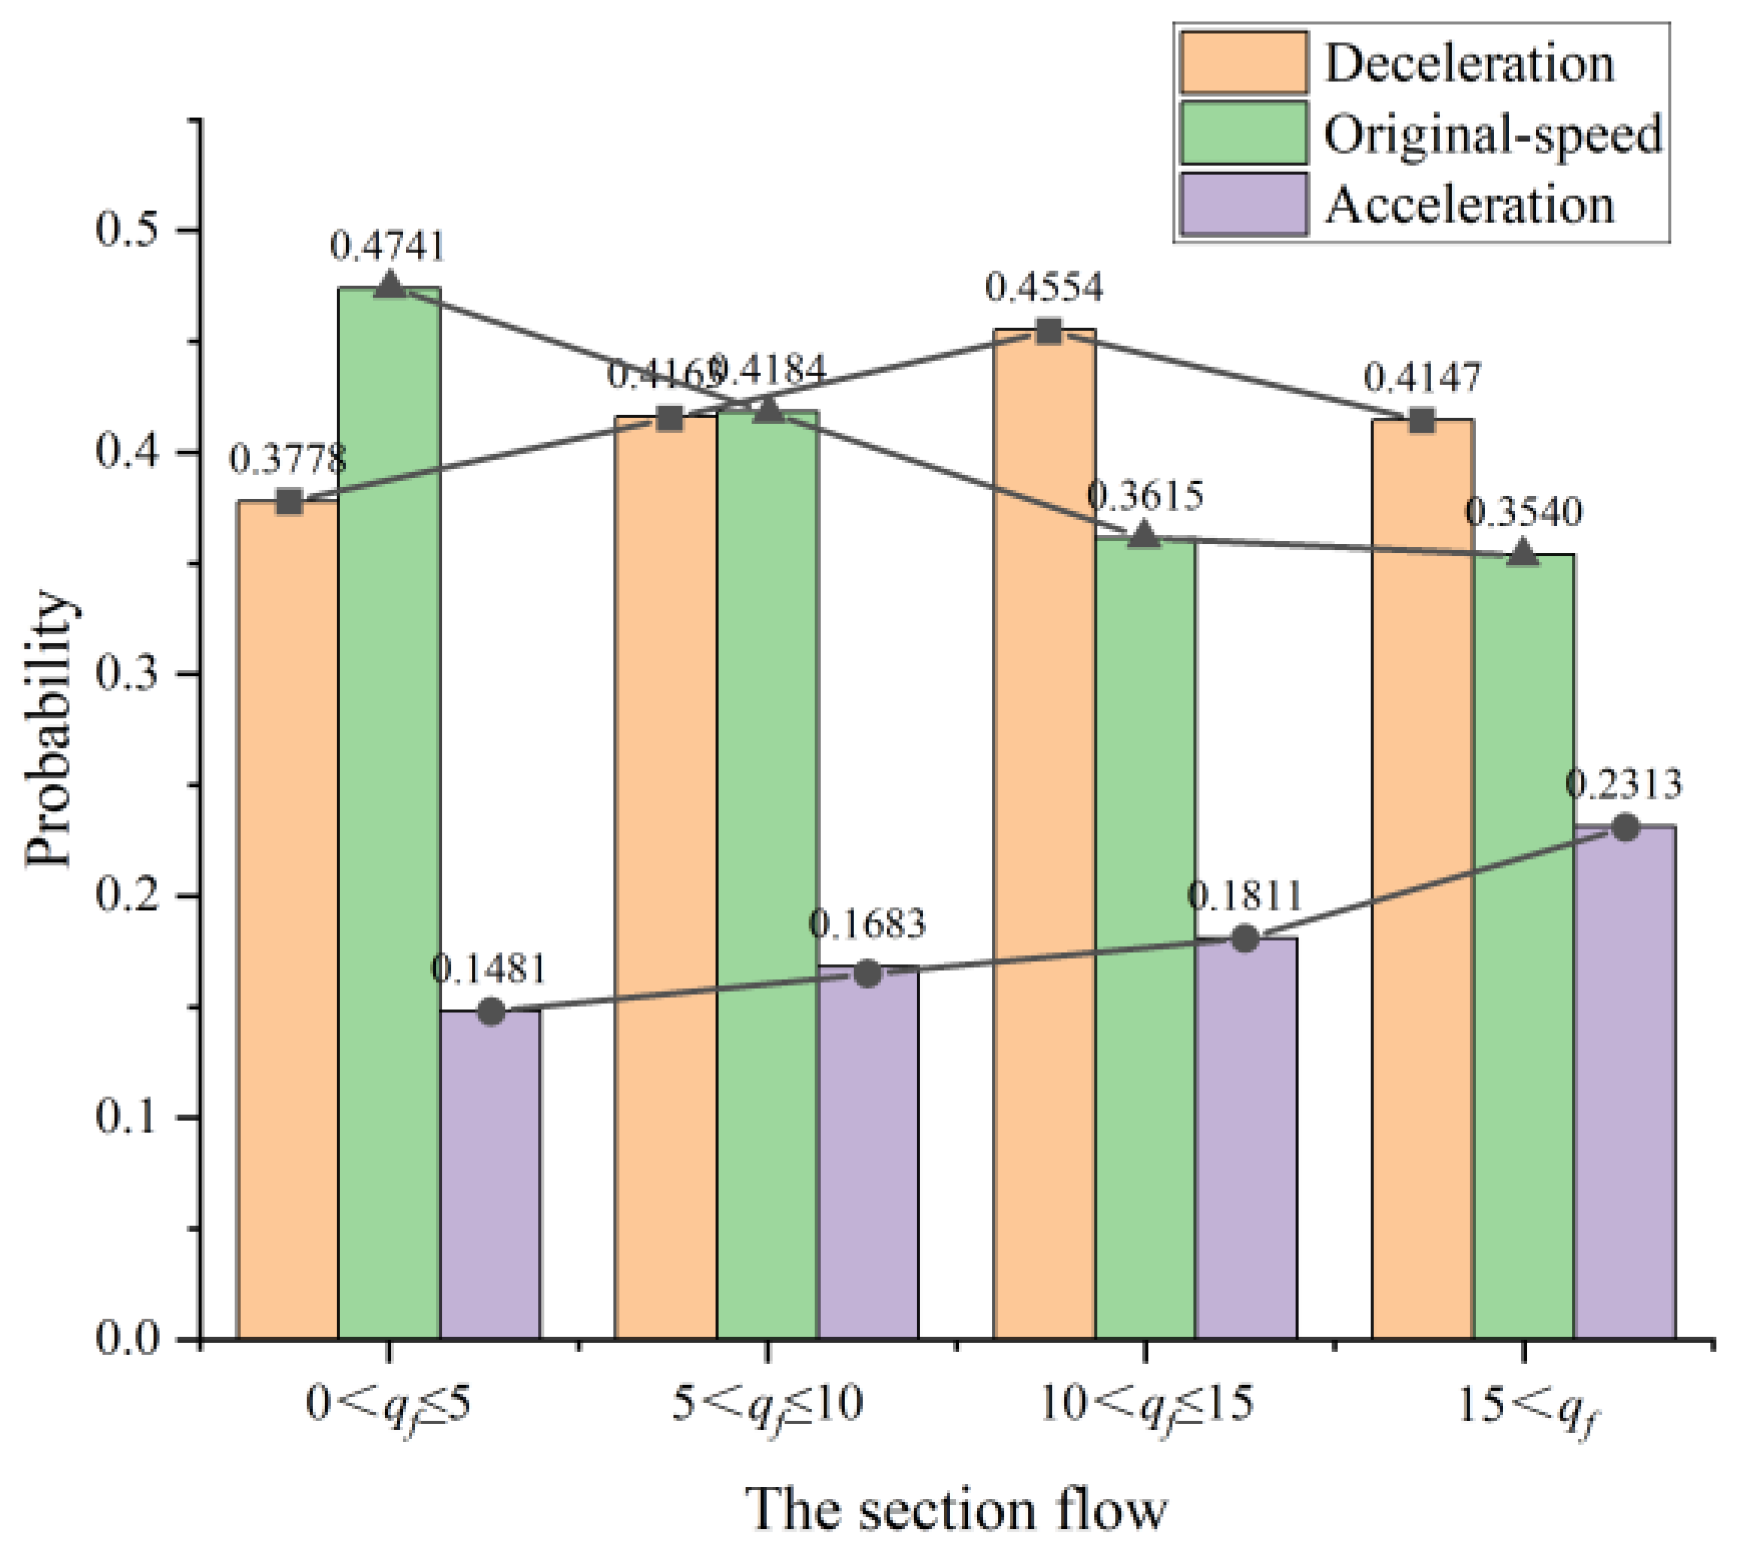
- (3)
- Under the subsidence of manhole cover conditions, acceleration riding behavior is more specific riding behavior. The results show that the probability of this behavior is less correlated with the subsidence depth of the manhole cover, but negatively correlated with lane integrity (as shown in Figure 21) and positively correlated with section flow (as shown in Figure 22). The reasons are as follows: Acceleration behavior is essentially influenced by the driving force of social forces; Liang et al. [33] proposed that, in a specific scenario, the rider is motivated to move towards the destination according to the desired speed at a certain speed, and the force driving the behavior is called the driving force, which is a psychological force. When riders choose to go around to avoid the subsidence to obtain better riding comfort, if there are interfering vehicles behind, this behavior will increase the mutual interference between vehicles, and riders wishing to move laterally safely and comfortably need to improve their longitudinal spacing from interfering vehicles to the side and rear, increasing the rider’s detour safe operating distance and operable time, and the rider’s desired speed is greater than the actual operating speed, thus choosing acceleration riding behavior. Two-wheelers, to avoid the subsidence area, pass from both sides of the manhole cover when the lane width is certain, and the smaller the lane integrity, the smaller the complete lane width on both sides of the manhole cover and the greater the mutual interference between the two-wheelers from the side and rear when detouring; similarly, the higher the section flow, the more interfering two-wheelers there are around the investigated two-wheeler, and the more interference from the side and rear two-wheelers when the two-wheeler detours. Influenced by the driving force, the greater the disturbance, the higher the probability of riders choosing acceleration riding behavior, and the same analytical conclusion can be drawn from the acceleration detour riding behavior selection model in this paper. In summary, acceleration is a riding behavior resulting from the conflict between the rider’s desire to reduce interference with surrounding two-wheelers and his desire for a more comfortable riding experience.
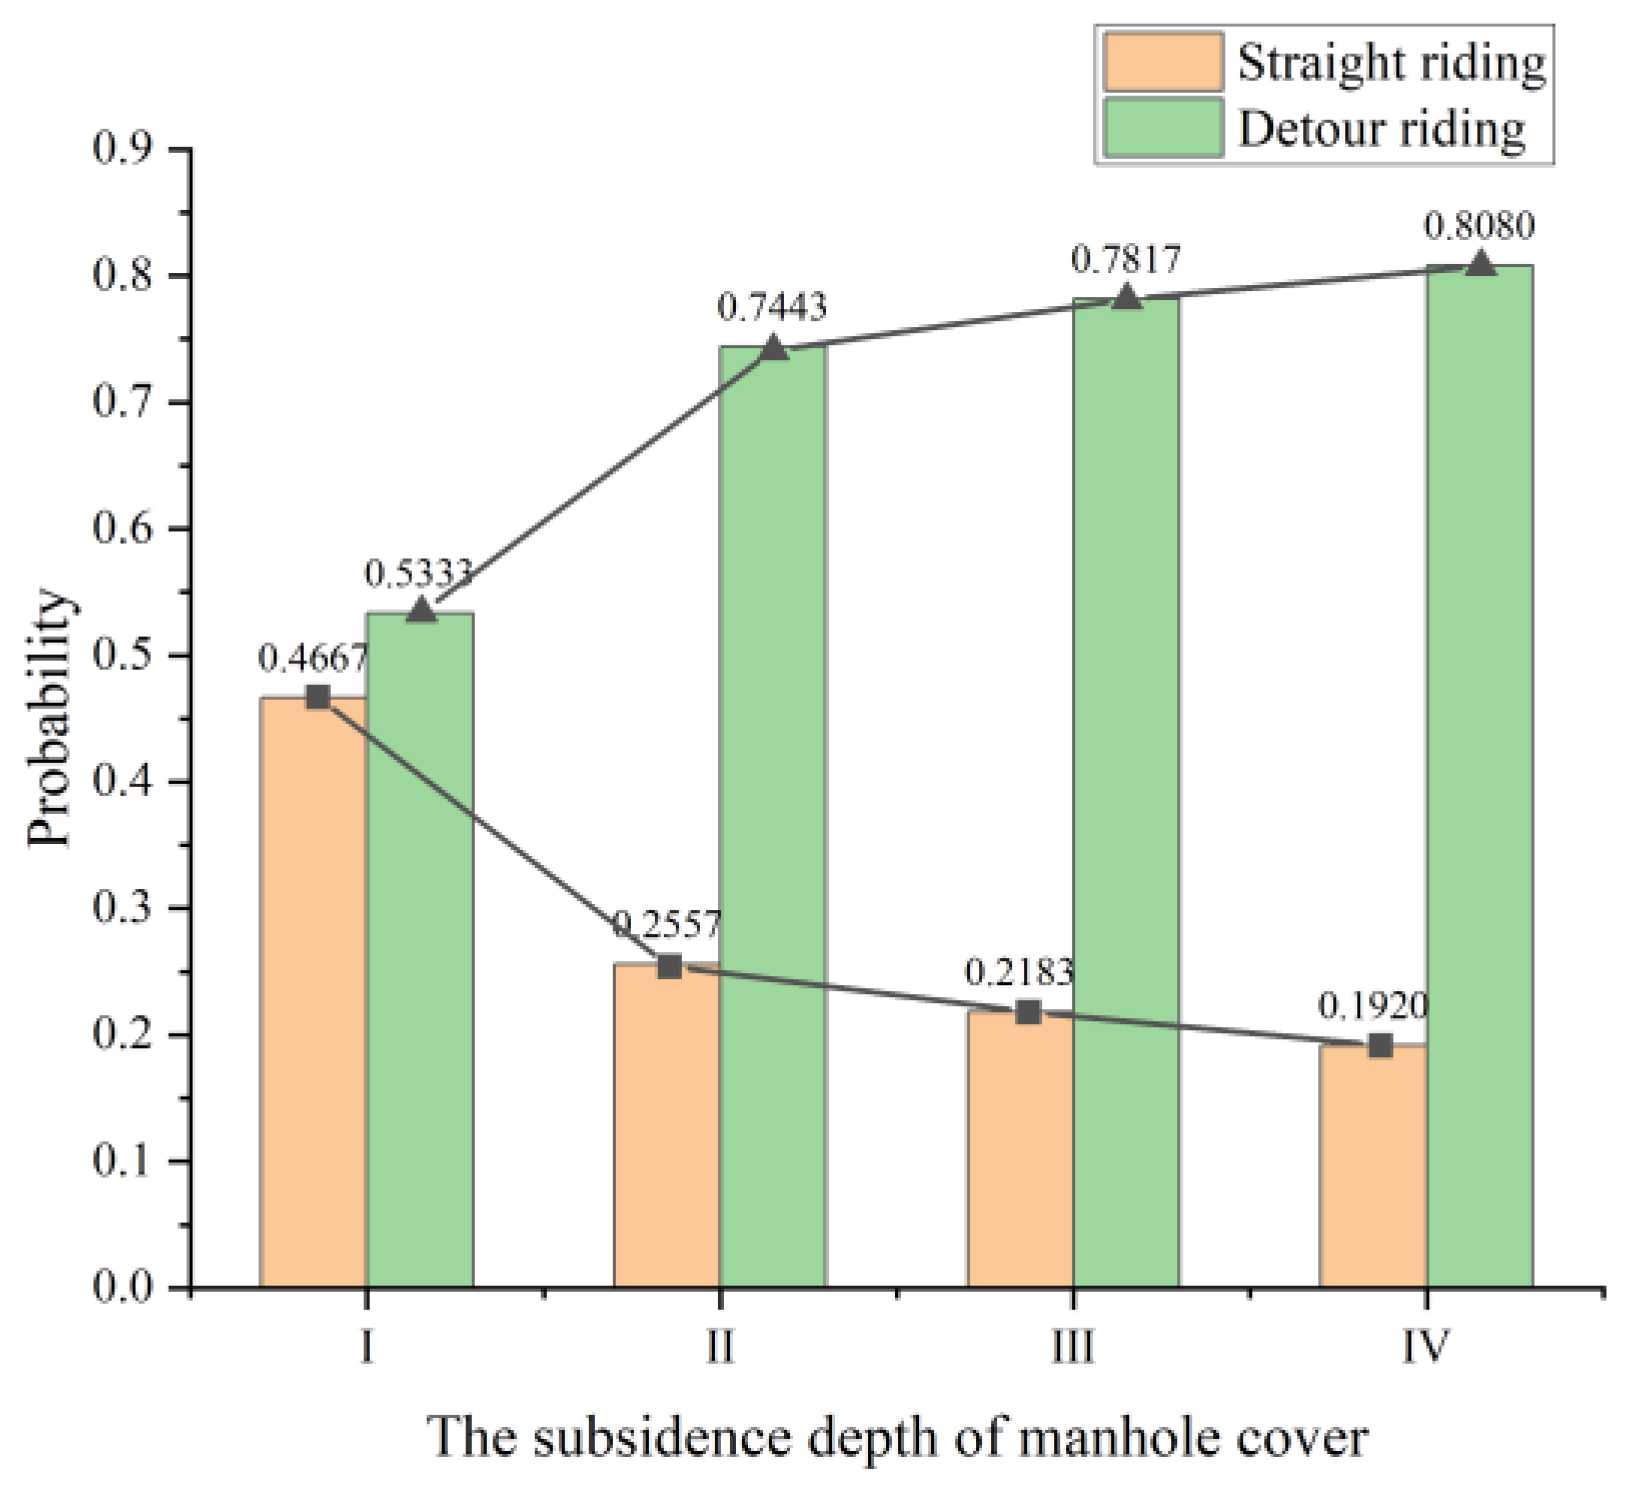
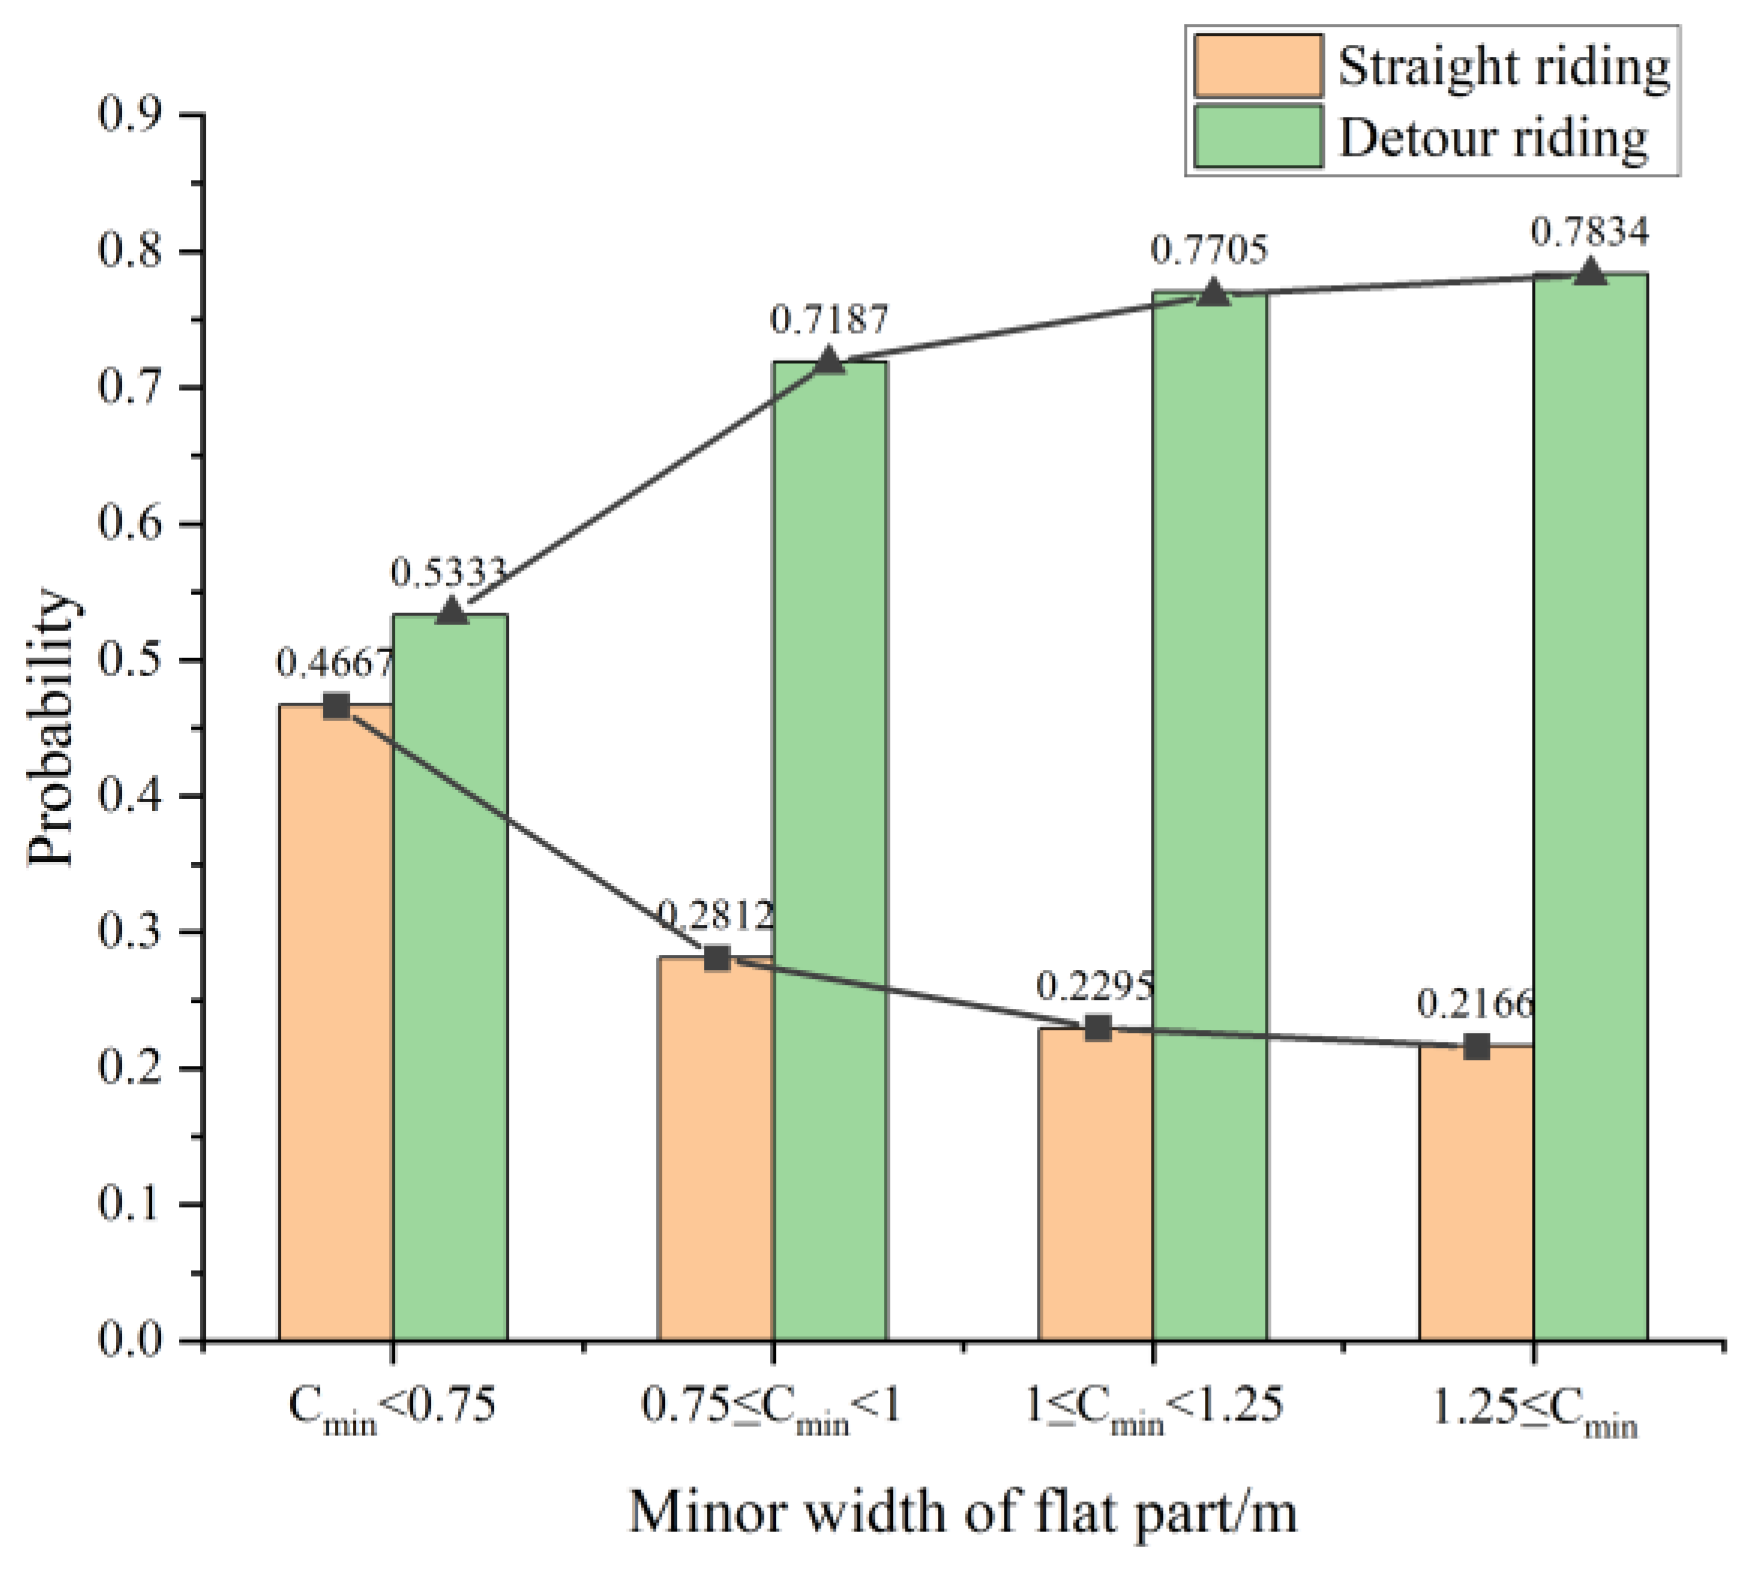
- (4)
- The research findings for trajectory riding behavior show that the subsidence depth of manhole covers is negatively correlated with straight riding behavior and positively correlated with detour riding behavior (as shown in Figure 23); the minor width of the flat part is negatively correlated with straight riding behavior and positively correlated with detour riding behavior (as shown in Figure 24). The reasons are analyzed as follows: as mentioned in discussion (2), the information about the subsidence depth of the manhole cover can be intuitively received by the rider, and the judgment of whether to crush the subsidence or not can be made quickly after observing the surrounding conditions. The minor width of the flat part describes how far the manhole cover is from the hard separation boundary of the lane; the smaller the value, the closer the manhole cover is to the boundary. When a rider wishes to avoid a manhole cover, he or she will choose to pass in the direction that is fastest away from the upstream virtual traffic zone, which is the direction where the two-wheeler is close to the edge line of the upstream virtual traffic zone. Liang et al. [33] in the existing research proposed a lane boundary force, which is a psychological force; hard separation facilities will bring a feeling of discomfort and insecurity to riders, the closer the vehicle is to the road hard separation boundary, the more the vehicle will try to run away from the boundary; therefore, when the manhole cover is close to the lane boundary, the vehicle running close to the lane boundary side in the upstream virtual traffic zone, which is affected by the boundary force, does not choose to pass by the flat part on the boundary side, but chooses not to change direction to run over the manhole cover to pass. From the probability model of original-speed straight riding behavior, it is clear that the minor width of the flat part is negatively correlated with the probability of original-speed detour riding behavior. Liang et al. [34] found that, the closer the bicycle lane area is to the lane boundary, the higher the percentage of low-speed vehicles and the lower the percentage of high-speed vehicles, and since the subsidence of the manhole cover has less impact on low-speed vehicles, more riders riding at low speeds near the lane boundary side tend to adopt the original-speed straight riding behavior to pass through the subsidence area.
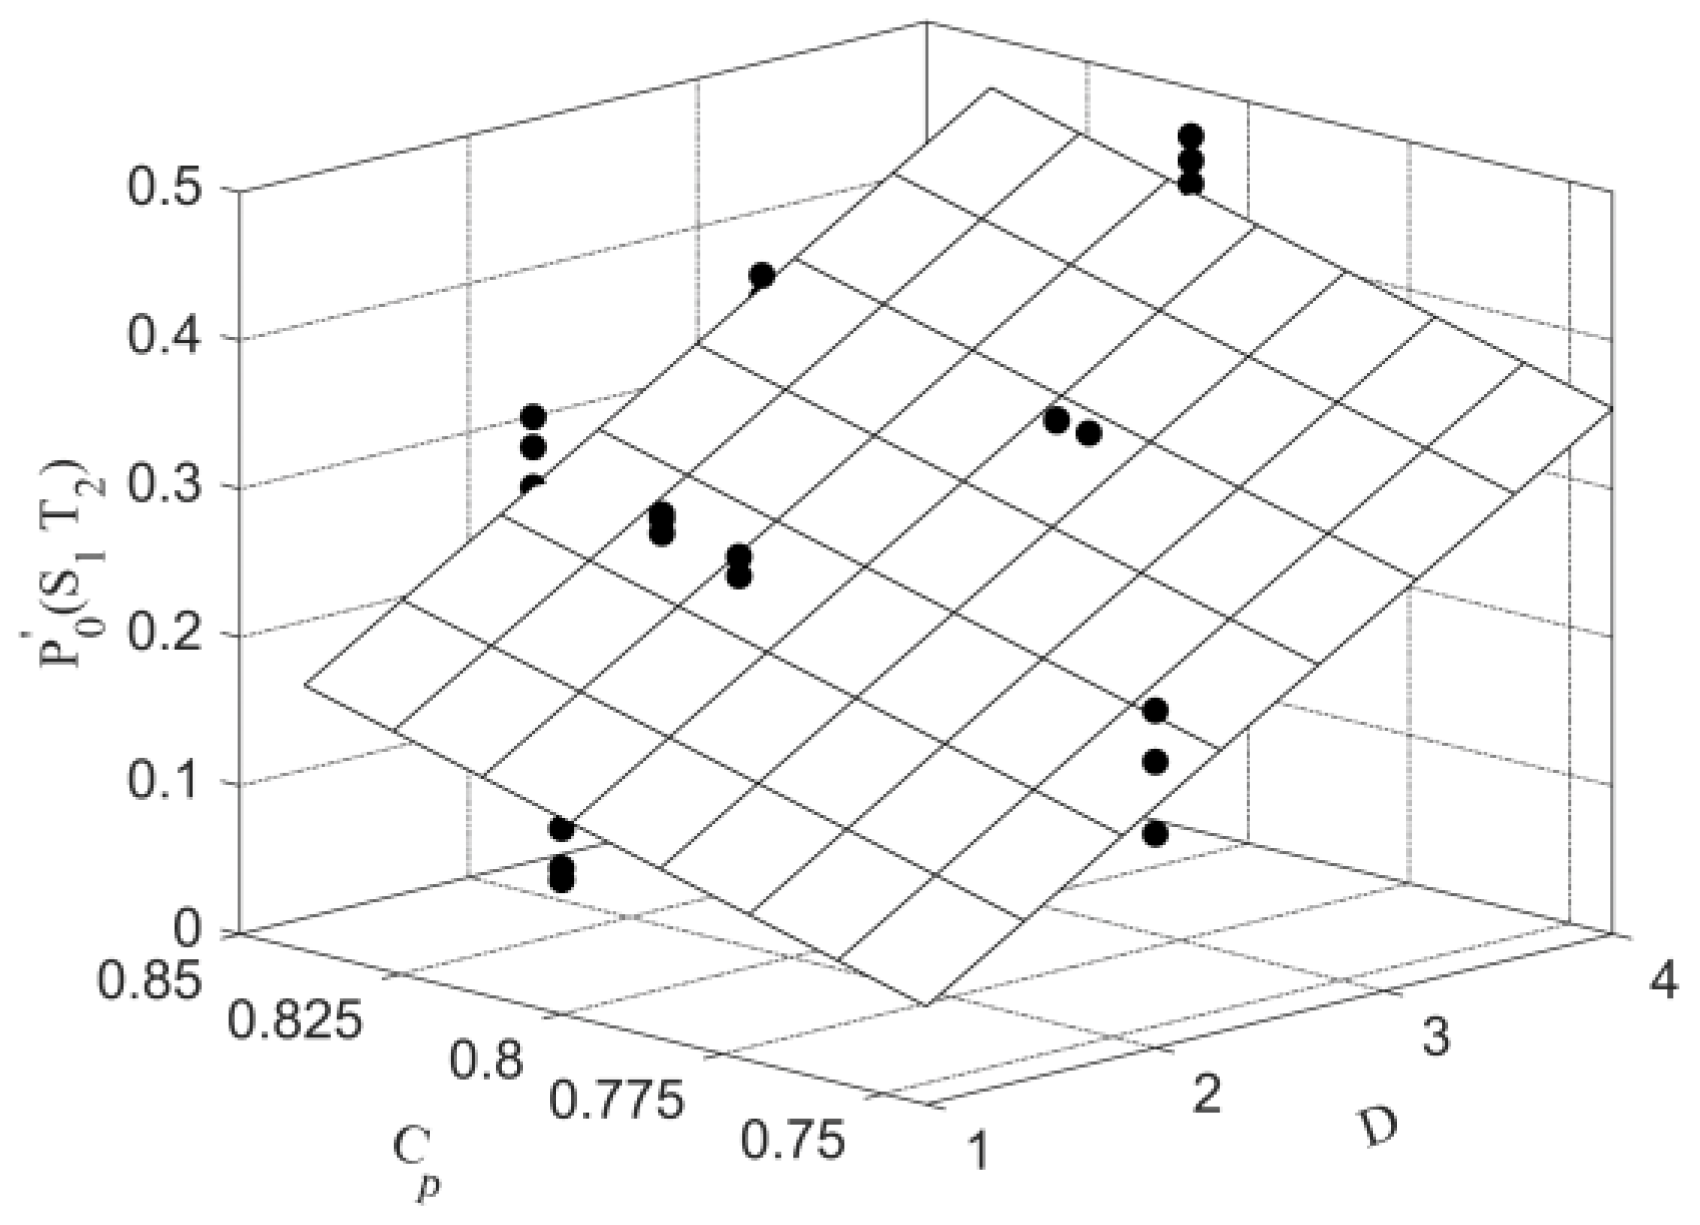
- (5)
- In addition to the correlation with the subsidence depth of the manhole cover, the probability of deceleration straight riding behavior also has a strong correlation with the major width of the flat part, which is negatively correlated with the major width of the flat part. The reasons are as follows: the major width of flat part can describe how far the manhole cover is from the bicycle lane centerline; when the major width of flat part is smaller, the closer the manhole cover is to the lane median. (1) It is known from the literature [34] that the closer the riding area is to the lane centerline, the higher the proportion of medium- and high-speed vehicles that pass within it; from discussion (1), it is clear that the faster the speed of the two-wheeler, the less reaction time and operation time the rider has; from the literature [35], it is clear that when the speed is high, the two-wheeler cannot change the turning angle at a large angle for safety. Therefore, when the rider passes at a faster speed, he finds and discriminates the subsidence area and judges that the speed and distance cannot meet the requirement of avoiding the subsidence area at this time, so the rider chooses deceleration riding behavior to improve comfort when running over the subsidence area. (1) The closer the subsidence of the manhole cover is to the centerline of the bicycle lane, the greater the interference of traffic on both sides of the upstream virtual traffic zone. When the rider’s fastest out of the upstream virtual traffic zone direction side of a more serious interference, subject to the collision avoidance forces proposed in the literature [33], the rider will be forced to choose deceleration straight riding behavior through the subsidence area with high probability.
5. Conclusions
- (1)
- Bicycle road sections with low traffic volumes and a lack of traffic control on the periphery of the city have a higher probability of very high-speed two-wheelers. If the road surface of these sections is not maintained for a long time, creating a more serious problem of manhole cover subsidence, it is very likely to cause traffic safety problems. In contrast, the subsidence of manhole covers has less impact on two-wheelers operating in high-density environments.
- (2)
- Subsidence depth is one of the main factors affecting riders’ riding behavior, and it has a great influence on the selection of riders’ speed and trajectory behavior; the influence of subsidence of grade Ⅰ and below on riders is small; the influence of grade Ⅱ and above on riders is large, especially the depression of grade Ⅳ, which is likely to cause safety problems.
- (3)
- The narrower the bicycle lane and the higher the traffic flow, the greater the probability that the rider will choose the acceleration detour riding behavior, the greater the impact of subsidence of the manhole cover on traffic flow. The acceleration detour riding behavior is a riding behavior resulting from the conflict between the rider’s desire to reduce mutual interference with surrounding two-wheelers and his desire for a more comfortable riding experience. This paper shows that it is important for riders to obtain information about the movement of the two-wheelers behind them when operating the lateral movement.
- (4)
- The closer the manhole cover is to the lane boundary, the less it affects two-wheelers and the less it interferes with traffic flow. The closer the manhole cover is to the lane centerline, however, the greater the impact on two-wheelers and the greater the disruption to traffic flow operations.
6. Applications and Suggestions
- (1)
- City managers and traffic managers should pay more attention to bicycle roads with low traffic volume and a lack of traffic control on the periphery of the city and regularly inspect the pavement conditions of these roads. If there is a subsidence of grade Ⅳ, it should be repaired and maintained in time. If maintenance cannot be carried out in time, it is recommended to set up a prompt sign at the exit road of the upstream intersection of the road section to indicate that there is a serious pavement damage problem ahead and ask two-wheelers to slow down, and the same prompt sign should be set up 30 m upstream of the subsidence.
- (2)
- Subsidence of level Ⅰ does not need much repair treatment. Selective repair treatment is determined by the position of the level II or III in the section, section flow and lane width. Subsidence of level Ⅳ should be repaired as soon as possible.
- (3)
- Although the subsidence of manhole covers in major bicycle lanes in cities with narrower lanes and higher traffic flow is unlikely to cause safety issues, it will affect the riding comfort of a large number of riders and is likely to disrupt traffic flow operation due to higher traffic flow and density. Subsidence of manhole covers in main bicycle lanes in cities with small lanes should be addressed as soon as possible, and if this is not possible, reflective strips can be plastered on the manhole covers to improve visibility of the subsidence of manhole covers.
- (4)
- When comparing the subsidence of manhole covers near the lane boundary to the subsidence of manhole covers near the lane centerline, city managers should pay more attention to the subsidence of manhole covers near the lane centerline, which has a greater impact on the operation of two-wheelers; if such covers have more serious subsidence problems, they should be dealt with quickly.
- (5)
- Traffic managers should strengthen the education of riders by considering the following: (1) They should educate riders to develop the habit of looking in the rearview mirror when the two-wheeler is in lateral motion. Riders must examine the rear two-wheeler activity through the rearview mirror because the low noise of the two-wheeler operation makes it impossible for them to notice the rear hazard more thoroughly through hearing alone. (2) They should educate riders on how to adjust the best angle of the rearview mirror according to their height, sitting posture and riding habits. (3) They should educate riders to prohibit wearing headphones or any clothing or accessories that cover or wrap the ears during riding. This behavior can enhance the ability of riders to perceive the surrounding hazards through hearing.
- (6)
- Traffic managers should strengthen the inspection of two-wheelers and strictly check two-wheelers without rearview mirrors, and shared bicycle companies should also install rearview mirrors on the shared two-wheelers they put out.
Author Contributions
Funding
Institutional Review Board Statement
Informed Consent Statement
Data Availability Statement
Conflicts of Interest
References
- Xiong, W.H.; Wei, D. lmpaction Analysis of Motorcycle Forbidden Policy’s upon Resident’s Traveling Time Cost. J. Transp. Syst. Eng. Inf. Technol. 2013, 13, 203–208. [Google Scholar] [CrossRef]
- Zhao, D.; Li, S.J. Economic analysis of urban motorcycle bans—Nanning City as an example. Leg. Econ. 2016, 57–58. Available online: https://kns.cnki.net/kcms/detail/detail.aspx?dbcode=CJFD&dbname=CJFDLAST2016&filename=FZJJ201607017&uniplatform=NZKPT&v=gtaj7qgUXNurp7ixgIhOutwmAQK6p2JVJ7wdivDTuAz7DPYnTd2gX8NxU11BSSfK (accessed on 14 July 2016).
- Nie, X. A study on the current development of urban non-motorized transportation in China. New Technol. New Prod. China 2016, 21, 126. [Google Scholar] [CrossRef]
- Kuang, L.J.; Ye, X.F. Characteristics of Bike-and-Ride at Urban Mass Transit Station. Urban Mass Transit 2010, 13, 53–56. [Google Scholar] [CrossRef]
- Zhao, Q.M.; Ren, R.B.; Liu, Y.; Li, Z.G.; Hu, G.L. Fracture Mechanism of Pavement around Manholes in Urban Road. J. Chongqing Jiaotong Univ. (Nat. Sci.) 2021, 40, 87–94. [Google Scholar]
- Yv, T.G.; Jiang, C.J.; Cao, X.Y. Quality Defects Treatment of Municipal Roads Inspection Wells. Constr. Technol. 2014, 43, 291–293. [Google Scholar]
- Mastinu, G.; Ploechl, M. Road and Off-Road Vehicle Systemdynamics Handbook; CRC Press: Boca Rato, FL, USA, 2014; pp. 21–25. [Google Scholar]
- Wang, X.R.; Zhang, J.X.; Kong, X.G. Asphalt Pavement Damage Evaluation Based on Riding Comfort. Munic. Eng. Technol. 2014, 32, 32–36. [Google Scholar]
- Shan, L.Y.; Hou, X.S. Analysis of the relationship between pavement unevenness and driving comfort based on the whole vehicle model. Highway 2005, 122–125. Available online: https://kns.cnki.net/kcms/detail/detail.aspx?dbcode=CJFD&dbname=CJFD2005&filename=GLGL200508029&uniplatform=NZKPT&v=HA55WY4YtFYY6INiG6QRKpOknwco8a86CUBVixBgpXxq0jZcaTuofZGpQ-HV81V1 (accessed on 25 August 2005).
- Shan, L.Y.; Hou, X.S.; Ma, S.L. Evaluation standard of pavement roughness based on ride comfort. J. Harbin Inst. Technol. 2008, 935–938. [Google Scholar]
- Lu, C.G.; Zhao, Q.H.; Zhang, H.X.; Yang, J.Z. Research on the Influence of Road Roughness, Speed and Seat Occupancy Rate on Driving Comfort Based on Simulink. J. Qingdao Univ. (Eng. Technol. Ed.) 2020, 35, 29–36. [Google Scholar] [CrossRef]
- Guan, L.M.; Wang, G.P.; Zhu, J.Y.; Wu, D.F. Prediction of driving comfort on urban road based on discrete roughness index. J. Vib. Shock 2021, 40, 236–242. [Google Scholar] [CrossRef]
- Zhao, Q.; Yuan, Q.Q. The Construction Standard of Bicycle Friendly City from the Kano Demand Model. Mod. Transp. Technol. 2019, 16, 81–87. [Google Scholar]
- Xiao, H.Z.; Qiu, X.F.; Li, L.Z.; Chen, Z.P. Evaluation Method of Comfort of Public Bicycle Routes in Xiamen. Technol. Innov. Appl. 2019, 104–105. [Google Scholar]
- Cheng, G.Z.; Liu, B.T.; Ma, Y.F. Effect of Poor Pavement Surface Condition on Capacity of Urban Roadway. Urban Transp. China 2012, 10, 68–74. [Google Scholar] [CrossRef]
- Chen, H.; Ma, X.T.; Zhao, D.T. Simulation of Vehicle Lane-changing Behavior on Damaged Pavement Based on CA Model. J. Highw. Transp. Res. Dev. 2018, 35, 117–125. [Google Scholar]
- Khan, S.; Raksuntorn, W. Characteristics of Passing and Meeting Maneuvers on Exclusive Bicycle Paths. Transpor-tation Research Record. J. Transp. Res. Board 2001, 1776, 220–228. [Google Scholar] [CrossRef]
- Chen, X.; Yue, L.; Han, H. Overtaking Disturbance on a Moped-Bicycle-Shared Bicycle Path and Corresponding New Bicycle Path Design Principles. J. Transp. Eng. 2018, 144, 4018041–4018048. [Google Scholar] [CrossRef]
- Xu, L.; Liu, M.Q.; Song, X.; Jin, S. Analytical Model of Passing Events for One-Way Heterogeneous Bicycle Traffic Flows. Transp. Res. Rec. 2018, 2672, 125–135. [Google Scholar] [CrossRef]
- Li, Z.; Wang, W.; Liu, P.; Bigham, J.; Ragland, D.R. Modelling Bicycle Passing Maneuvers on Multilane Separated Bicycle Paths. J. Transp. Eng. 2013, 139, 57–64. [Google Scholar] [CrossRef]
- Dong, P.; Wang, X.; Yun, L.; Fan, H. Research on the characteristics of mixed traffic flow based on an improved bicycle model. Simulation 2017, 94, 451–462. [Google Scholar] [CrossRef]
- Kuang, X.Y.; Cao, W.H.; Wu, Y. Cellular Automata Model of Non-motor Vehicle Flow Considering Reverse Vehicles. J. Syst. Simul. 2016, 28, 268–274. [Google Scholar] [CrossRef]
- Ping, P.; Chang, Y.L.; Zhang, P. Impact of inbound and Outbound Passengers form Bus Stop on Neighboring Bicycle Lane Capacity. J. Chongqing Univ. Technol. (Nat. Sci.) 2018, 32, 103–110. [Google Scholar]
- Wen, X.M.; Fu, L.P.; Zhao, M.; Pan, X.F. Analysis of Driving Behaviors and Pedestrian Crossing Safety on Urban Roadway with Mixed Traffic Flow. J. Transp. Inf. Saf. 2020, 38, 12–19. [Google Scholar]
- Ye, X.F.; Deng, S.J.; Chen, J.; Zhen, J.H. lmpact of Curbside Parking on Bicycle Lane Capacity. J. Southwest Jiaotong Univ. 2015, 50, 529–535. [Google Scholar]
- Ye, X.F.; Chen, J.; Feng, S.M.; Deng, S.J. Model of non-motorized vehicle flow speed influenced by curbside parking. J. Harbin Inst. Technol. 2016, 48, 115–119. [Google Scholar]
- Zhang, G.Q.; Wang, H.; Chen, J. Psychological research in traffic engineering. J. Southeast Univ. (Philos. Soc. Sci.) 2012, 14, 156–159. [Google Scholar] [CrossRef]
- Editorial Department of China Journal of Highway and Transport. Review on China’s Traffic Engineering Research Progress: 2016. China J. Highw. Transp. 2016, 29, 1–161. [Google Scholar] [CrossRef]
- Zhou, D.; Ma, H.L.; Jin, S.; Wang, D.H. Flow-density relationship of mixed bicycles based on Logistic model. J. Traffic Transp. Eng. 2016, 16, 133–141. [Google Scholar] [CrossRef]
- Wang, Y.M.; Elhag, T. On the normalization of interval and fuzzy weights. Fuzzy Sets Syst. 2006, 157, 2456–2471. [Google Scholar] [CrossRef]
- Agostinelli, C. Robust Stepwise Regression. J. Appl. Stat. 2002, 29, 825–840. [Google Scholar] [CrossRef] [Green Version]
- Burkholder, T.J.; Lieber, R.L. Stepwise Regression is An Alternative to Splines For Fitting Noisy Data. J. Biomech. 1996, 29, 235–238. [Google Scholar] [CrossRef]
- Liang, X.; Mao, B.H.; Xu, Q. Psychological- physical force model for bicycle dynamics. J. Transp. Syst. Eng. Inf. Technol. 2012, 12, 91–97. [Google Scholar] [CrossRef]
- Liang, X.; Xiao, Z.S.; Yuan, Y.; Huang, X. Setting Conditions and Key Parameters for Two-way Separated Bicycle Lane Design. J. Transp. Syst. Eng. Inf. Technol. 2016, 16, 227–232. [Google Scholar] [CrossRef]
- Xv, Y.W. Talking about the running of bicycle. J. Sichuan Vocat. Tech. Coll. 2002, 56–57. [Google Scholar] [CrossRef]


| Number | Survey Section | Isolation Facilities | Width of Lane/m | Subsidence Depth/cm | Width of Subsidence/m |
|---|---|---|---|---|---|
| 1 | Fangxiang Road | Greenbelt | 3.0 | 1.5 | 0.77 |
| 2 | Zhongshan Middle Road | Greenbelt | 3.5 | 0.8 | 0.70 |
| 3 | Cuizhu Road section A | Greenbelt | 3.5 | 2.0 | 0.72 |
| 4 | Jiefang East Road section A | Greenbelt | 3.5 | 2.1 | 0.71 |
| 5 | Jiefang East Road section B | Greenbelt | 3.5 | 2.3 | 0.73 |
| 6 | Liuhe Road | Greenbelt | 4.0 | 1.3 | 0.72 |
| 7 | Cuizhu Road section B | Greenbelt | 4.5 | 1.8 | 0.72 |
| 8 | Zhongshan North Road | Fence | 4.5 | 2.1 | 0.72 |
| 9 | Jiefang East Road section C | Greenbelt | 4.5 | 3.2 | 0.86 |
| 10 | North Ring 2nd Road | Greenbelt | 5.0 | 1.7 | 0.96 |
| Behavior Category | Behavior Subclass | |
|---|---|---|
| Independent riding behavior | Speed riding behavior | Deceleration riding behavior |
| Original-speed riding behavior | ||
| Acceleration riding behavior | ||
| Trajectory riding behavior | Straight riding behavior | |
| Detour riding behavior | ||
| Combined riding behavior | Deceleration straight riding behavior | |
| Deceleration detour riding behavior | ||
| Original-speed straight riding behavior | ||
| Original-speed detour riding behavior | ||
| Acceleration straight riding behavior | ||
| Acceleration detour riding behavior | ||
| Characteristic Type | Influence Factor | Symbol | Unit |
|---|---|---|---|
| Characteristics of traffic environment | Subsidence depth of manhole cover | D | |
| Lane integrity | % | ||
| Major width of flat part | m | ||
| Minor width of flat part | m | ||
| Section flow | |||
| Characteristics of riders | Age proportion of riders | % | |
| Sex proportion of riders | % |
| Severity | Type | Subsidence Depth/cm | Traffic Riding Experience |
|---|---|---|---|
| Slight subsidence | Type I | Slight turbulence under high speed, and no obvious turbulence under medium and low speed | |
| Moderate subsidence | Type II | Slight turbulence under medium and low speed, and moderate turbulence under high speed | |
| Relatively serious subsidence | Type III | Moderate turbulence under medium and low speed, and serious turbulence under high speed | |
| Severe subsidence | Type IV | Serious turbulence under medium and low speed, dangers are prone to be caused under high speed |
| Location Number | |||||||
|---|---|---|---|---|---|---|---|
| 1 | 3.27 | 0.1102 | 0.1441 | 0.1186 | 0.3983 | 0.0424 | 0.1864 |
| 5.27 | 0.1009 | 0.1927 | 0.0963 | 0.3257 | 0.0642 | 0.2202 | |
| 8.43 | 0.1000 | 0.2273 | 0.0727 | 0.3091 | 0.0818 | 0.2091 | |
| 2 | 4.83 | 0.0667 | 0.1250 | 0.2583 | 0.3500 | 0.1333 | 0.0667 |
| 6.44 | 0.0896 | 0.0983 | 0.2833 | 0.3109 | 0.1039 | 0.1140 | |
| 9.02 | 0.0895 | 0.0903 | 0.2903 | 0.2930 | 0.1179 | 0.1190 | |
| 3 | 8.10 | 0.0973 | 0.3303 | 0.0839 | 0.2848 | 0.0464 | 0.1573 |
| 11.20 | 0.1071 | 0.3293 | 0.0864 | 0.2656 | 0.0519 | 0.1597 | |
| 14.07 | 0.1260 | 0.3297 | 0.0883 | 0.2311 | 0.0622 | 0.1627 | |
| 4 | 6.19 | 0.1772 | 0.2911 | 0.0759 | 0.2785 | 0.0506 | 0.1266 |
| 10.03 | 0.1476 | 0.2667 | 0.0905 | 0.2667 | 0.0619 | 0.1619 | |
| 14.45 | 0.1290 | 0.2452 | 0.0968 | 0.2903 | 0.0581 | 0.1806 | |
| 5 | 9.05 | 0.1122 | 0.3265 | 0.0510 | 0.2653 | 0.0102 | 0.2347 |
| 12.23 | 0.1528 | 0.2949 | 0.0461 | 0.2778 | 0.0092 | 0.2176 | |
| 15.31 | 0.1866 | 0.2687 | 0.0373 | 0.2836 | 0.0075 | 0.2164 | |
| 6 | 5.37 | 0.0896 | 0.2769 | 0.1293 | 0.3995 | 0.0263 | 0.0814 |
| 7.26 | 0.0902 | 0.2642 | 0.1357 | 0.3979 | 0.0285 | 0.0835 | |
| 9.77 | 0.0870 | 0.2740 | 0.1244 | 0.3914 | 0.0297 | 0.0935 | |
| 7 | 4.35 | 0.0988 | 0.3210 | 0.1111 | 0.4198 | 0.0000 | 0.0494 |
| 5.73 | 0.0850 | 0.3007 | 0.1307 | 0.4248 | 0.0000 | 0.0589 | |
| 7.42 | 0.1053 | 0.2737 | 0.1474 | 0.4211 | 0.0000 | 0.0526 | |
| 8 | 4.33 | 0.1389 | 0.3426 | 0.0370 | 0.3611 | 0.0185 | 0.1019 |
| 6.28 | 0.1390 | 0.3632 | 0.0852 | 0.3094 | 0.0179 | 0.0852 | |
| 10.99 | 0.1261 | 0.3782 | 0.1176 | 0.2857 | 0.0168 | 0.0756 | |
| 9 | 4.72 | 0.1230 | 0.4672 | 0.0328 | 0.2459 | 0.0328 | 0.0984 |
| 6.70 | 0.1174 | 0.4507 | 0.0376 | 0.2770 | 0.0376 | 0.0798 | |
| 8.51 | 0.1169 | 0.4351 | 0.0325 | 0.2857 | 0.0455 | 0.0844 | |
| 10 | 4.61 | 0.0682 | 0.2614 | 0.1818 | 0.3295 | 0.0227 | 0.1364 |
| 5.48 | 0.0897 | 0.2483 | 0.1586 | 0.3241 | 0.0207 | 0.1586 | |
| 6.31 | 0.0980 | 0.2255 | 0.1569 | 0.3333 | 0.0294 | 0.1471 |
| Riding Behavior | Regression Model | |
|---|---|---|
| Deceleration | 0.941 | |
| Original-speed | 0.900 | |
| Acceleration | a | 0.821 |
| Model | Variable | Coefficient | Standard Error | t | Significance |
|---|---|---|---|---|---|
| Probability model of deceleration behavior | Constant term | −0.744 | 0.143 | −5.193 | 0.000 |
| D | 0.118 | 0.006 | 20.259 | 0.000 | |
| 1.046 | 0.179 | 5.859 | 0.000 | ||
| Probability model of original-speed behavior | Constant term | −0.213 | 0.179 | −1.186 | 0.246 |
| D | −0.115 | 0.007 | −15.744 | 0.000 | |
| 1.162 | 0.224 | 5.200 | 0.000 | ||
| Probability model of acceleration behavior | Constant term | 1.853 | 0.163 | 11.378 | 0.000 |
| −2.144 | 0.200 | −10.721 | 0.000 | ||
| 0.005 | 0.002 | 3.240 | 0.003 |
| Riding Behavior | Regression Model | |
|---|---|---|
| Straight riding behavior | 0.601 | |
| Detour riding behavior | 0.603 | |
| Left detour riding behavior | 0.833 | |
| Right detour riding behavior | 0.807 |
| Model | Variable | Coefficient | Standard Error | t | Significance |
|---|---|---|---|---|---|
| Probability model of straight riding behavior | Constant term | 0.542 | 0.045 | 12.029 | 0.000 |
| D | −0.049 | 0.013 | −3.807 | 0.001 | |
| −0.149 | 0.048 | −3.119 | 0.004 | ||
| Probability model of detour riding behavior | Constant term | 0.456 | 0.045 | 10.140 | 0.000 |
| D | 0.049 | 0.013 | 3.786 | 0.001 | |
| 0.151 | 0.048 | 3.177 | 0.004 | ||
| Probability model of left detour riding behavior | Constant term | 0.401 | 0.061 | 6.535 | 0.000 |
| D | 0.185 | 0.026 | 7.229 | 0.000 | |
| 0.099 | 0.011 | 9.142 | 0.000 | ||
| −0.278 | 0.068 | −4.058 | 0.000 | ||
| Probability model of right detour riding behavior | Constant term | −0.610 | 0.311 | −1.962 | 0.061 |
| D | −0.105 | 0.023 | −4.494 | 0.000 | |
| 1.008 | 0.387 | 2.607 | 0.015 | ||
| −0.103 | 0.010 | −10.381 | 0.000 | ||
| 0.232 | 0.062 | 3.710 | 0.001 |
| Riding Behavior | Regression Model | |
|---|---|---|
| Deceleration straight riding behavior | 0.603 | |
| Deceleration detour riding behavior | 0.877 | |
| Original-speed straight riding behavior | 0.795 | |
| Original-speed detour riding behavior | 0.503 | |
| Acceleration straight riding behavior | 0.595 | |
| Acceleration detour riding behavior | 0.715 |
| Model | Variable | Coefficient | Standard Error | t | Significance |
|---|---|---|---|---|---|
| Probability model of deceleration straight riding behavior | Constant term | 0.063 | 0.025 | 2.522 | 0.020 |
| D | 0.021 | 0.005 | 4.524 | 0.000 | |
| −0.017 | 0.006 | −2.723 | 0.013 | ||
| 0.030 | 0.013 | 2.291 | 0.033 | ||
| Probability model of deceleration detour riding behavior | Constant term | −0.892 | 0.181 | −4.935 | 0.000 |
| D | 0.096 | 0.007 | 13.043 | 0.000 | |
| 1.160 | 0.225 | 5.147 | 0.000 | ||
| Probability model of original-speed straight riding behavior | Constant term | 0.354 | 0.028 | 12.602 | 0.000 |
| D | −0.063 | 0.008 | −7.820 | 0.000 | |
| −0.081 | 0.030 | −2.734 | 0.011 | ||
| Probability model of original-speed detour riding behavior | Constant term | −0.097 | 0.226 | −0.430 | 0.670 |
| D | −0.033 | 0.010 | −3.498 | 0.002 | |
| 0.682 | 0.279 | 2.445 | 0.022 | ||
| −0.006 | 0.002 | −2.418 | 0.023 | ||
| Probability model of acceleration straight riding behavior | Constant term | 0.215 | 0.027 | 7.995 | 0.000 |
| −0.025 | 0.007 | −3.787 | 0.001 | ||
| −0.117 | 0.019 | −6.280 | 0.000 | ||
| Probability model of acceleration detour riding behavior | Constant term | 1.343 | 0.169 | 7.942 | 0.000 |
| −1.564 | 0.208 | −7.536 | 0.000 | ||
| 0.006 | 0.002 | 3.366 | 0.002 |
Publisher’s Note: MDPI stays neutral with regard to jurisdictional claims in published maps and institutional affiliations. |
© 2022 by the authors. Licensee MDPI, Basel, Switzerland. This article is an open access article distributed under the terms and conditions of the Creative Commons Attribution (CC BY) license (https://creativecommons.org/licenses/by/4.0/).
Share and Cite
Zhou, D.; Hu, Q.; Sun, X.; Yao, W.; Gu, G.; Yang, R.; Ma, C. Probability Model of Riding Behavior Choice of Two-Wheelers under the Influence of the Subsidence Area of a Manhole Cover. Sustainability 2022, 14, 3532. https://doi.org/10.3390/su14063532
Zhou D, Hu Q, Sun X, Yao W, Gu G, Yang R, Ma C. Probability Model of Riding Behavior Choice of Two-Wheelers under the Influence of the Subsidence Area of a Manhole Cover. Sustainability. 2022; 14(6):3532. https://doi.org/10.3390/su14063532
Chicago/Turabian StyleZhou, Dan, Qingwei Hu, Xin Sun, Weizhen Yao, Guobin Gu, Ruixin Yang, and Congruo Ma. 2022. "Probability Model of Riding Behavior Choice of Two-Wheelers under the Influence of the Subsidence Area of a Manhole Cover" Sustainability 14, no. 6: 3532. https://doi.org/10.3390/su14063532