1. Introduction
The integration of Information and Communication Technologies (ICT) plays an important role to increase digital literacy, especially in a developing country. Indonesia is one of the developing countries with the largest area in ASEAN, which is divided into several islands with three main regions, namely west, middle, and east. Studies on ICT infrastructure are becoming regulatory basic information on profiling regions with vulnerable groups such as the eastern island of Indonesia. One of the interesting aspects of the advancement of ICT is its impact on the government ICT activity, especially in the dissemination of publicly accessible information about governance. The government’s efforts are mandated in UU No. 14 of 2008 concerning Openness of Public Information.
In 2011, the government regulated ICT financing for the development and widespread use of ICT, namely through the Minister of Communication and Information Technology Regulation No. 21/PER/M.KOMINFO/10/2011 concerning Utilization of Information and Communication Technology Financing. In practice, the mechanism in the regulation of the Ministry of Communication and Information Technology (PERKOMINFO) is mostly directed at providing optical and network networks, public access services for Wi-Fi internet services, data recovery centres, and financing the development of the domestic ICT industry. In 2014, the Government Regulation No. 96 of 2014 concerning the 2014–2019 Indonesian Broadband Plan or “Rencana Pita Lebar” provided strategic guidance in accelerating and expanding comprehensive and integrated “Rencana Pita Lebar” in Indonesia. As a result of the plan, in 2015 fibre optic was built in Indonesia along 41,151.6 km.
The Information and Communication Technology Development Index (ICT-DI) was developed by the International Telecommunication Union (ITU) under the name ICT Development Index (ICT-DI). ICT-DI is very important as a standard measure of the level of ICT development in a region that can be compared across time and between regions. In addition, ICT-DI is also able to measure the growth of ICT development, measure the digital gap or digital divide between regions, and measure the potential for ICT development. In general, there was an increase in the value of provincial ICT-DI in Indonesia from 2019 to 2020. DKI Jakarta became the province with the highest ICT-DI, which was 7.27 in 2019 and increased in 2020 to 7.46. Meanwhile, the province with the lowest ICT-DI was Papua, which was 3.35 in 2020, an increase from 3.29 in 2019. Papua is one of the largest provinces in eastern Indonesia, followed by Sulawesi, Nusa Tenggara, and the Maluku islands.
The research about ICT is indeed a crucial intrinsic component of Industrial 4.0 and Society 5.0 and penta-helix collaboration [
1,
2,
3,
4,
5,
6]. This is the reason the ICT attracts so much attention. To begin with, in Malaysia, the integration of ICT and technological tools in the education sector has a big challenge towards the new era of the Education 4.0 system [
7]; these findings have shown significant positive impacts on students’ academic performance and teachers’ effective ICT utilization. An intensification of digital working driven by COVID-19 has been increasing in Saudi higher education [
8] and social work students in Greece [
9], including digital deprivation [
10], digital exhaust, and digital footprints [
11]. Based on this case, it can be concluded that the human dependency on information technology is getting stronger during the pandemic. The advantages of the implementation of ICT also drive a positive impact on the government’s environmental protection expenditure (GEPE) [
12]. Internet penetration of GEPE is proven through its effect on restraining government’s behaviors, enhancing the public’s environmental protection awareness, and improving the government’s responsiveness to the public’s needs. The use of information technology through mass media such as radio can be used as a medium for introducing culture between various regions, which can be used as a way of promotion to introduce and spread culture [
13].
The clustering techniques starting from traditional statistics, data mining, machine learning, and deep learning can provide information to group cities with the same characteristics [
14,
15]. Clustering is a statistical method for separating a data set into several groups by distance, then we can get information about the relationship between observations [
16]. The objects in each cluster will be homogeneous, while heterogeneous compared to objects in other clusters [
17].
The output generated from the cluster analysis can be used as an index for a certain group size where the index value can be used as a benchmark for measuring the gap between clusters. The indexing measurement that is very useful to determine socio-economic groups is called Environment Vulnerable Index (EVI). However, EVI was developed by the Pacific Islands Commission for Applied Geosciences as a global composite index that measures an area’s environmental vulnerability [
18]. Overall results from these studies obtained using data in Greece suggested that EVI can be a good tool after further development in the context of decision making and environmental sustainability. In addition, Ref. [
19] performs a multi-scenario model of plastic waste accumulation potential in Indonesia, potential of mangroves in Southeast Asia towards remote sensing, statistic, and socio-demographic data [
20,
21,
22].
The use of an index in assessing social vulnerability can define conditions of social vulnerability in general. The studies by [
23] aim to explain social vulnerability in Indonesia at the district level using the hybrid of Fuzzy C Means clustering method. Meanwhile, Ref. [
24] introduces a model of vulnerability to disasters and generates a social vulnerability index (SoVI) using the Principal Component Analysis (PCA) method. In Indonesia, Ref. [
25] was initiated a social vulnerability index (SoVI) in Padang which considers the disaster risk as a function of natural hazard. Recently, Refs. [
26,
27,
28] introduce the social vulnerability index (SoVI) which was calculated using various variables. By referring to existing findings, this study aims to revisit the latest condition of ICT vulnerability in the Eastern Island of Indonesia using the 2020 National Socioeconomic Survey (SUSENAS) and National Labor Force Survey (SAKERNAS) data at the district/city level. The clustering method used in this study is Fuzzy C Means Clustering. Following the idea for this study, the next section will discuss a brief overview of the Fuzzy C Means Clustering method based on kinds of literature.
2. Methods
This study uses secondary data from Badan Pusat Statistik (BPS), namely the 2020 National Socio-Economic Survey (SUSENAS) and the 2019 National Labor Force Survey (SAKERNAS). The SUSENAS is a survey designed to collect population social data that are relatively very broad. The data collected include, among others, education, health/nutrition, housing, other socio-economic activities, socio-cultural activities, household consumption/expenditures and income, travel, and public opinion regarding their household welfare.
BPS also provides employment data through the National Labor Force Survey (SAKERNAS). The main objective of SAKERNAS is to obtain information on the unemployment rate and its changes from time to time at the national, provincial, and district/city levels.
Table 1 shows the dataset with 15 variables based on aspects of business vulnerability covering 174 districts/cities.
The data used in this study includes information related to ICT such as ownership of telecommunications equipment, access to the internet, and the use of information technology in daily activities. In addition, information on socio-economic aspects is represented by variables such as education and savings.
2.1. Clustering
Cluster analysis is a statistical method that is used to classify objects into relatively homogeneous groups, which are called clusters based on their characteristics. Cluster analysis classifies objects so that each object with the closest similarity to another object is in the same cluster. The clusters formed have high internal homogeneity and high external heterogeneity [
16,
30,
31,
32].
The purpose of cluster analysis is to group similar objects together. Objects that have a smaller distance will be considered the same or similar in one group compared to other objects with a greater distance [
33]. There are some commonly used distances:
= distance between cluster objects,
p = many measurement variables,
= observation of object-A; variables-j,
= observation of object-B; variables-j.
Other dissimilarity measures exist such as correlation-based distances, which is widely used for gene expression data analyses. Correlation-based distance is defined by subtracting the correlation coefficient from −1 to 1. Different types of correlation methods can be used such as:
Pearson correlation measures the degree of a linear relationship between two profiles.
It is a special case of Pearson’s correlation with
and
both replaced by zero:
The Spearman correlation method computes the correlation between the rank of
andthe rank of
variables.
where,
and
.
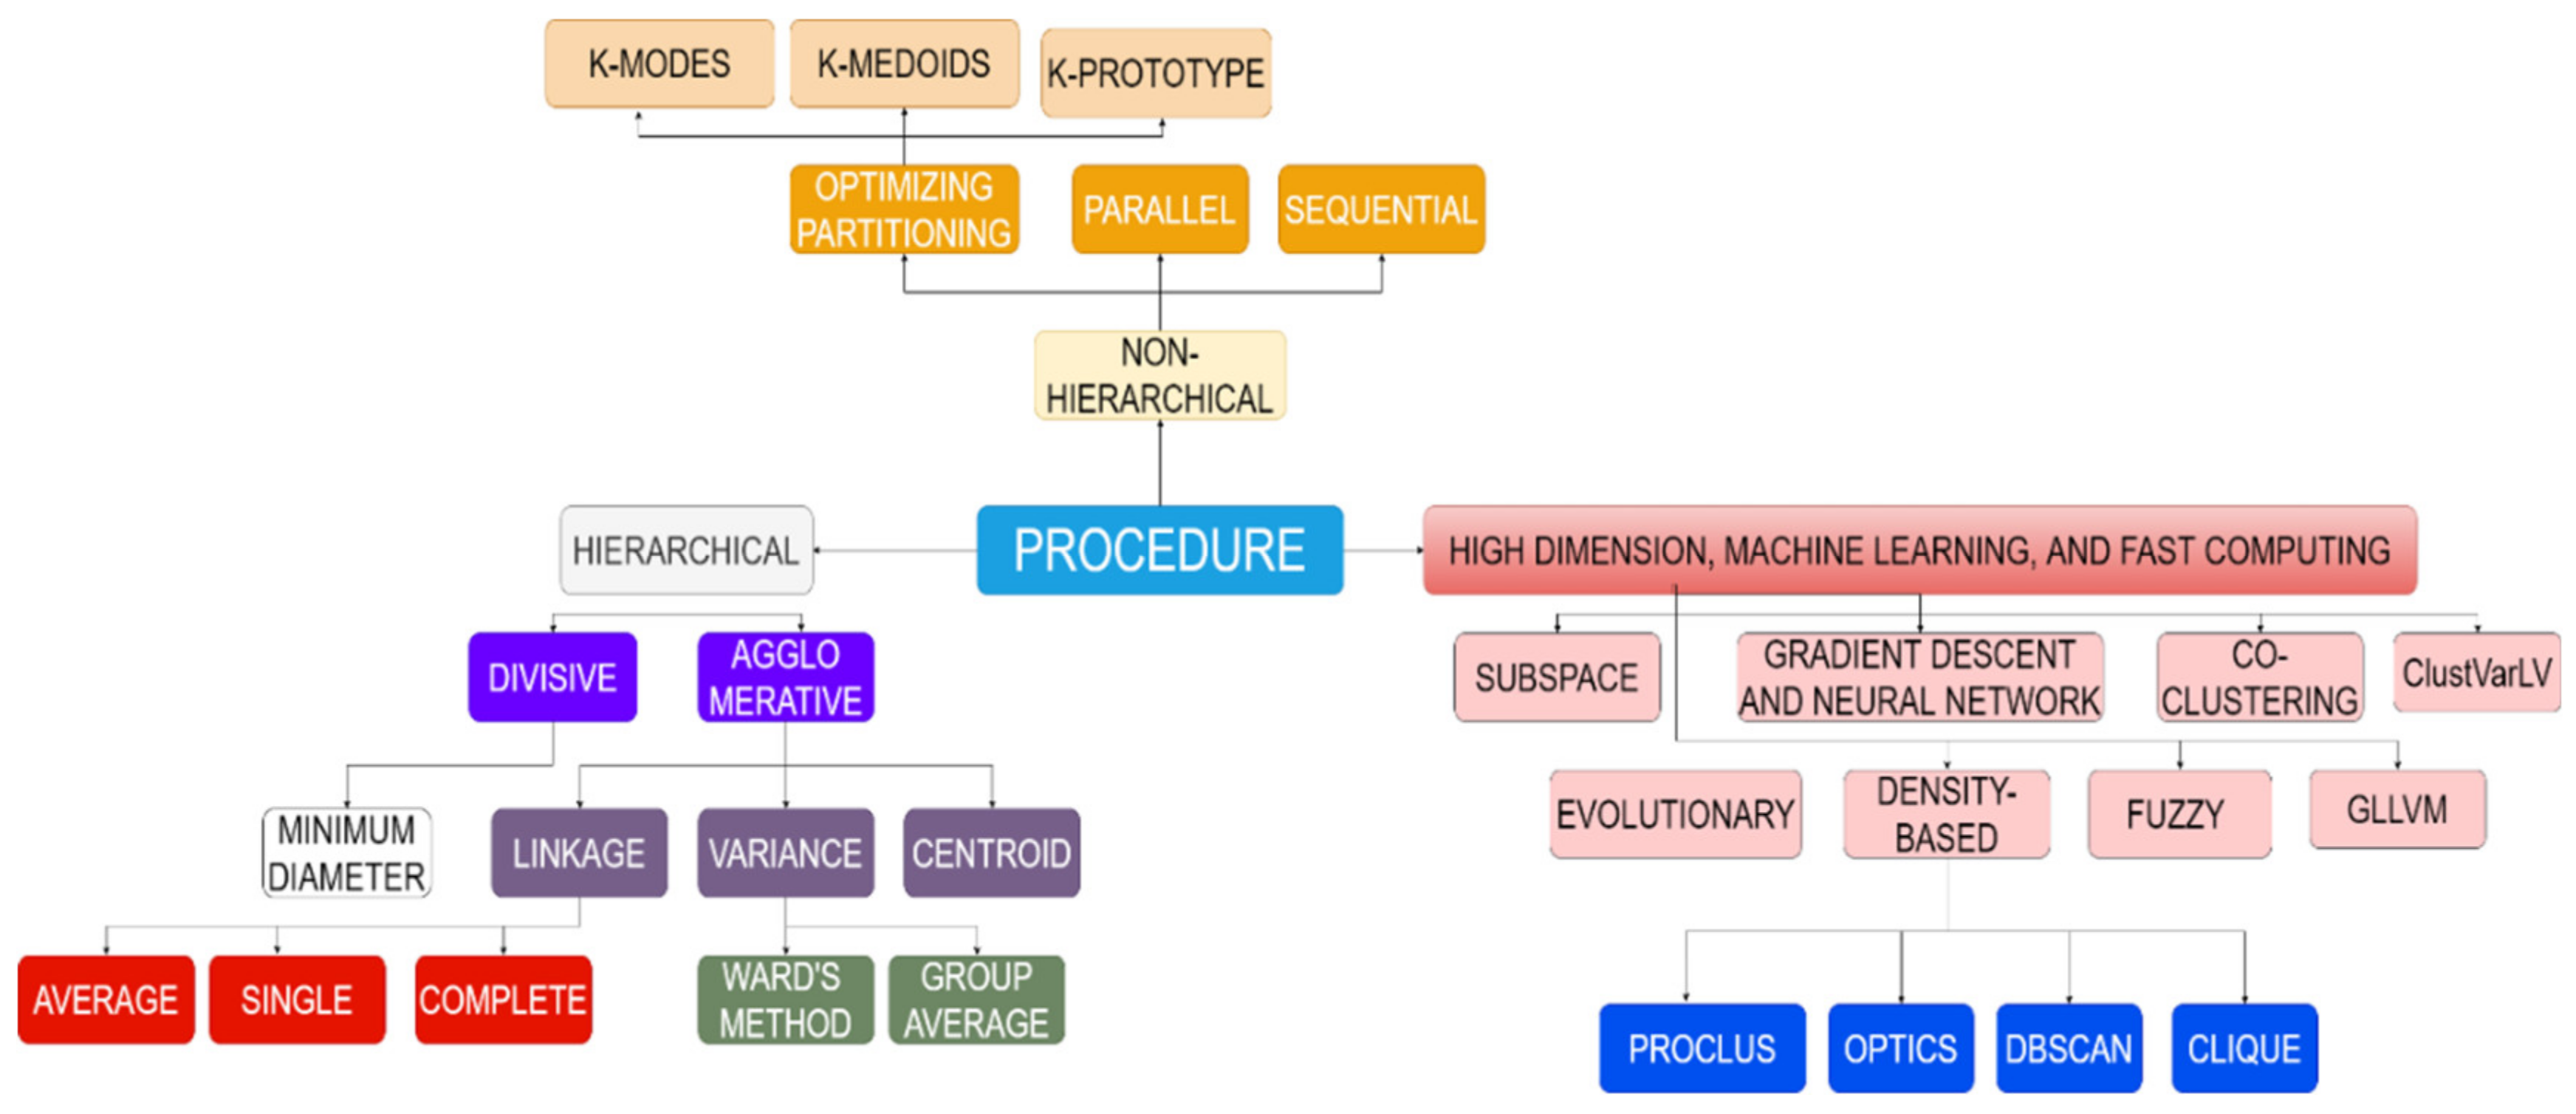
Using different distance measures can lead to different conclusions. Therefore, it is suggested that researchers use several different methods, then compare the results. Within a cluster, there are many methods that can be used. However, in general, there are two basic methods that are commonly used. The following is an image of the classification of the clustering procedure. The cluster analysis chart in
Figure 1 shows the types of clustering methods ranging from hierarchical methods to non-hierarchical methods and their derivatives.
2.2. Fuzzy C Means
Fuzzy statistics is a suitable technique to overcome various types of uncertainty and imprecision of the specifications of the hypothesis and the information obtained from the data [
34]. Fuzzy set theory was first introduced by Lotfi Zadeh, a professor at the University of California in 1965. The basic rules of fuzzy logic do not require complex mathematical models to operate; what is needed is a practical and theoretical understanding of the behaviour of the system as a whole [
35].
To calculate the infinite number of degrees between yes and no, Zadeh developed the idea of classifying sets called fuzzy sets [
36]. Unlike mathematical logic, fuzzy logic has multiple values. Unlike the concept that states everything is true or wholly false, fuzzy logic divides it into degrees of membership and degrees of truth, namely something that can be partially true and partially false at the same time. A fuzzy set is a general form of an ordinary set that has a membership level of each element that is limited by the interval [0, 1].
Basically, all sets have a degree or membership value. However, in the classical set the membership values are binary, namely 1 (member) and 0 (non-member). While the fuzzy set membership value is in the interval [0, 1]. The following explains the basic differences between classical (crisp) and fuzzy sets:
2.3. Conventional Set (Crisp)
A classical set (crisp or hard) is a clear set of objects, defined as a way to separate the elements of the universe of speech which are divided into two, namely members and nonmembers. If
, then the membership value of
is equal to 1. However, if
then the membership value of
is equal to 0. The notation
reflects that
containing the value of
with
is correct.
is the degree of membership for crisp set and can be described as:
A fuzzy set is a general form of an ordinary set (crisp), which has a membership level of each element that is limited by the interval [0, 1].
Let the universal set
= simple subset of .
Then can be described as:
is not a member of , if = 0
member of A with low membership degree, if
member of A with high membership degree, if
member of A, if .
The mathematical concept above is called a fuzzy subset of
, and can be written as
. The fuzzy subset of
can be written as follows:
The fuzzy membership value indicates that an item in the universe is not only at 0 or 1, but also values that lie between them. In other words, the truth value of an item is not only true or false. A value of 0 indicates false, a value of 1 indicates true, and there are still values that lie between true and false. Based on
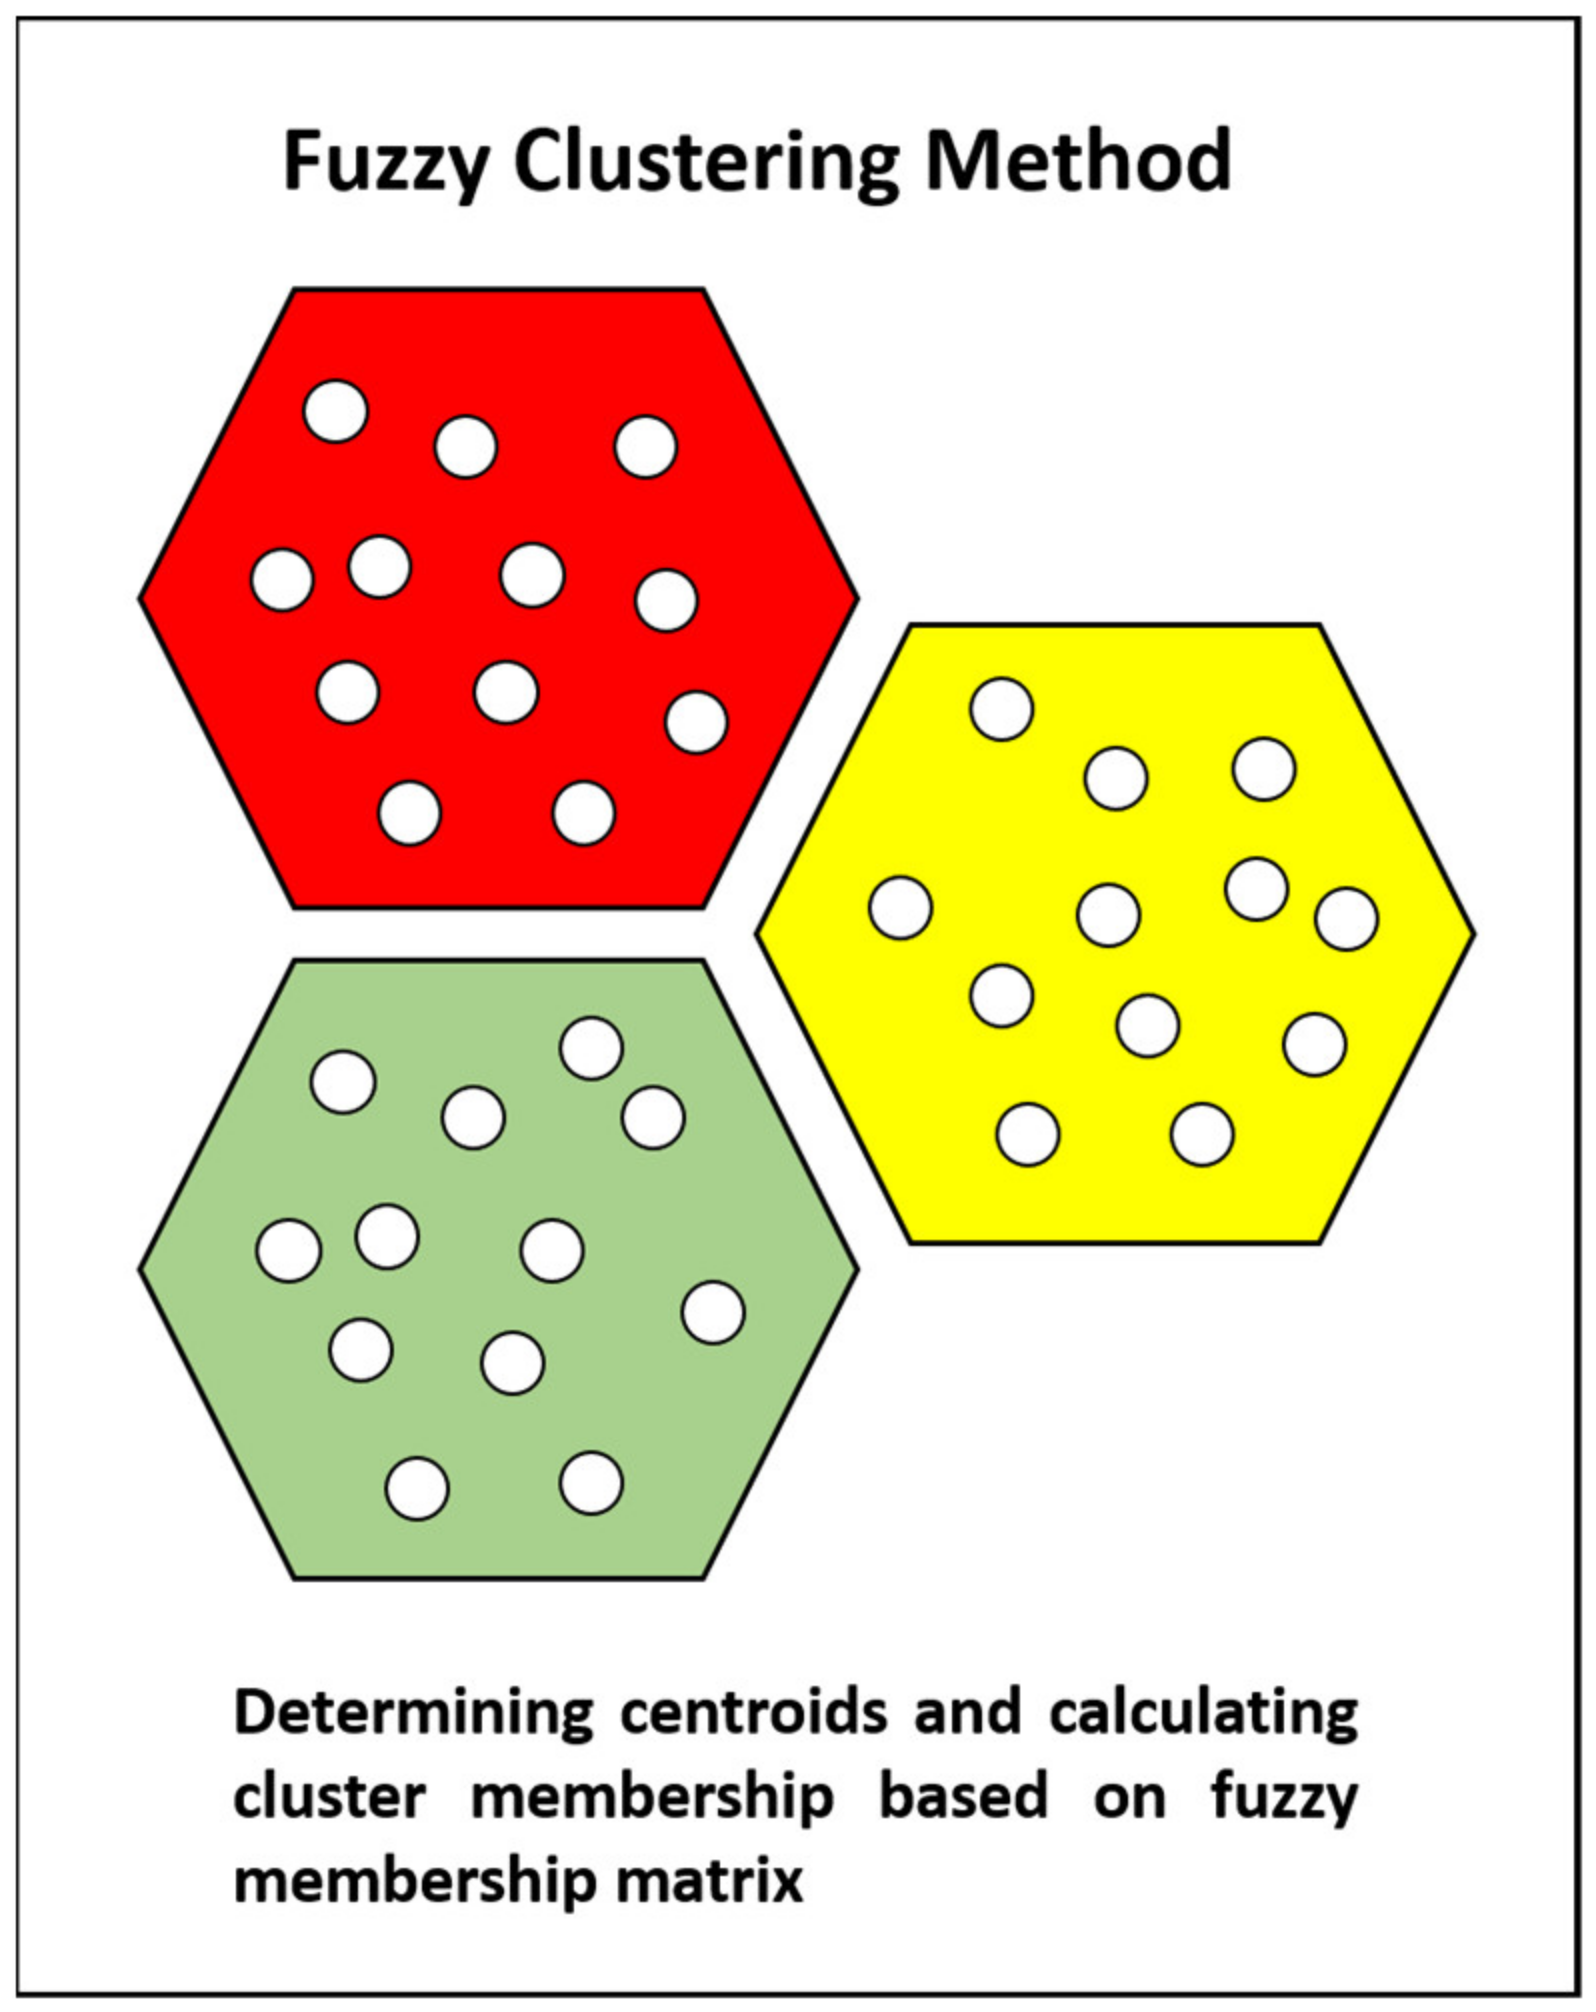
Figure 2, it can be seen that the fuzzy cluster members will approach the center point of cluster and will define into the same cluster, as well as other fuzzy members, more detail we provide the pseudo-code step construction in eight steps to finish the algorithm.
Pseudo-code below represents the step construction of Fuzzy C Means (FCM).
| Algorithm 1 |
Step 1:
Determine the data to be clustered, in the form of a matrix of size ( data sample size, p = variable for each data). is the th sample data and the th variable |
Step 2: Determine:
Number of clusters
Weighting power
Expected smallest error
Initial objective function |
Step 3:
Generate random numbers |
Step 4:
Calculate the th cluster center with and
|
Step 5:
Update fuzzy membership value
|
Step 6:
Calculating the objective function in the th iteration
|
Step 7:
Checking the stop condition (convergent) with condition below:
- -
if , then the iteration stops - -
If not, then , repeat step 4
|
Step 8:
Finish |
3. Results and Discussion
3.1. Bibliography towards Information and Communication Technologies Vulnerability
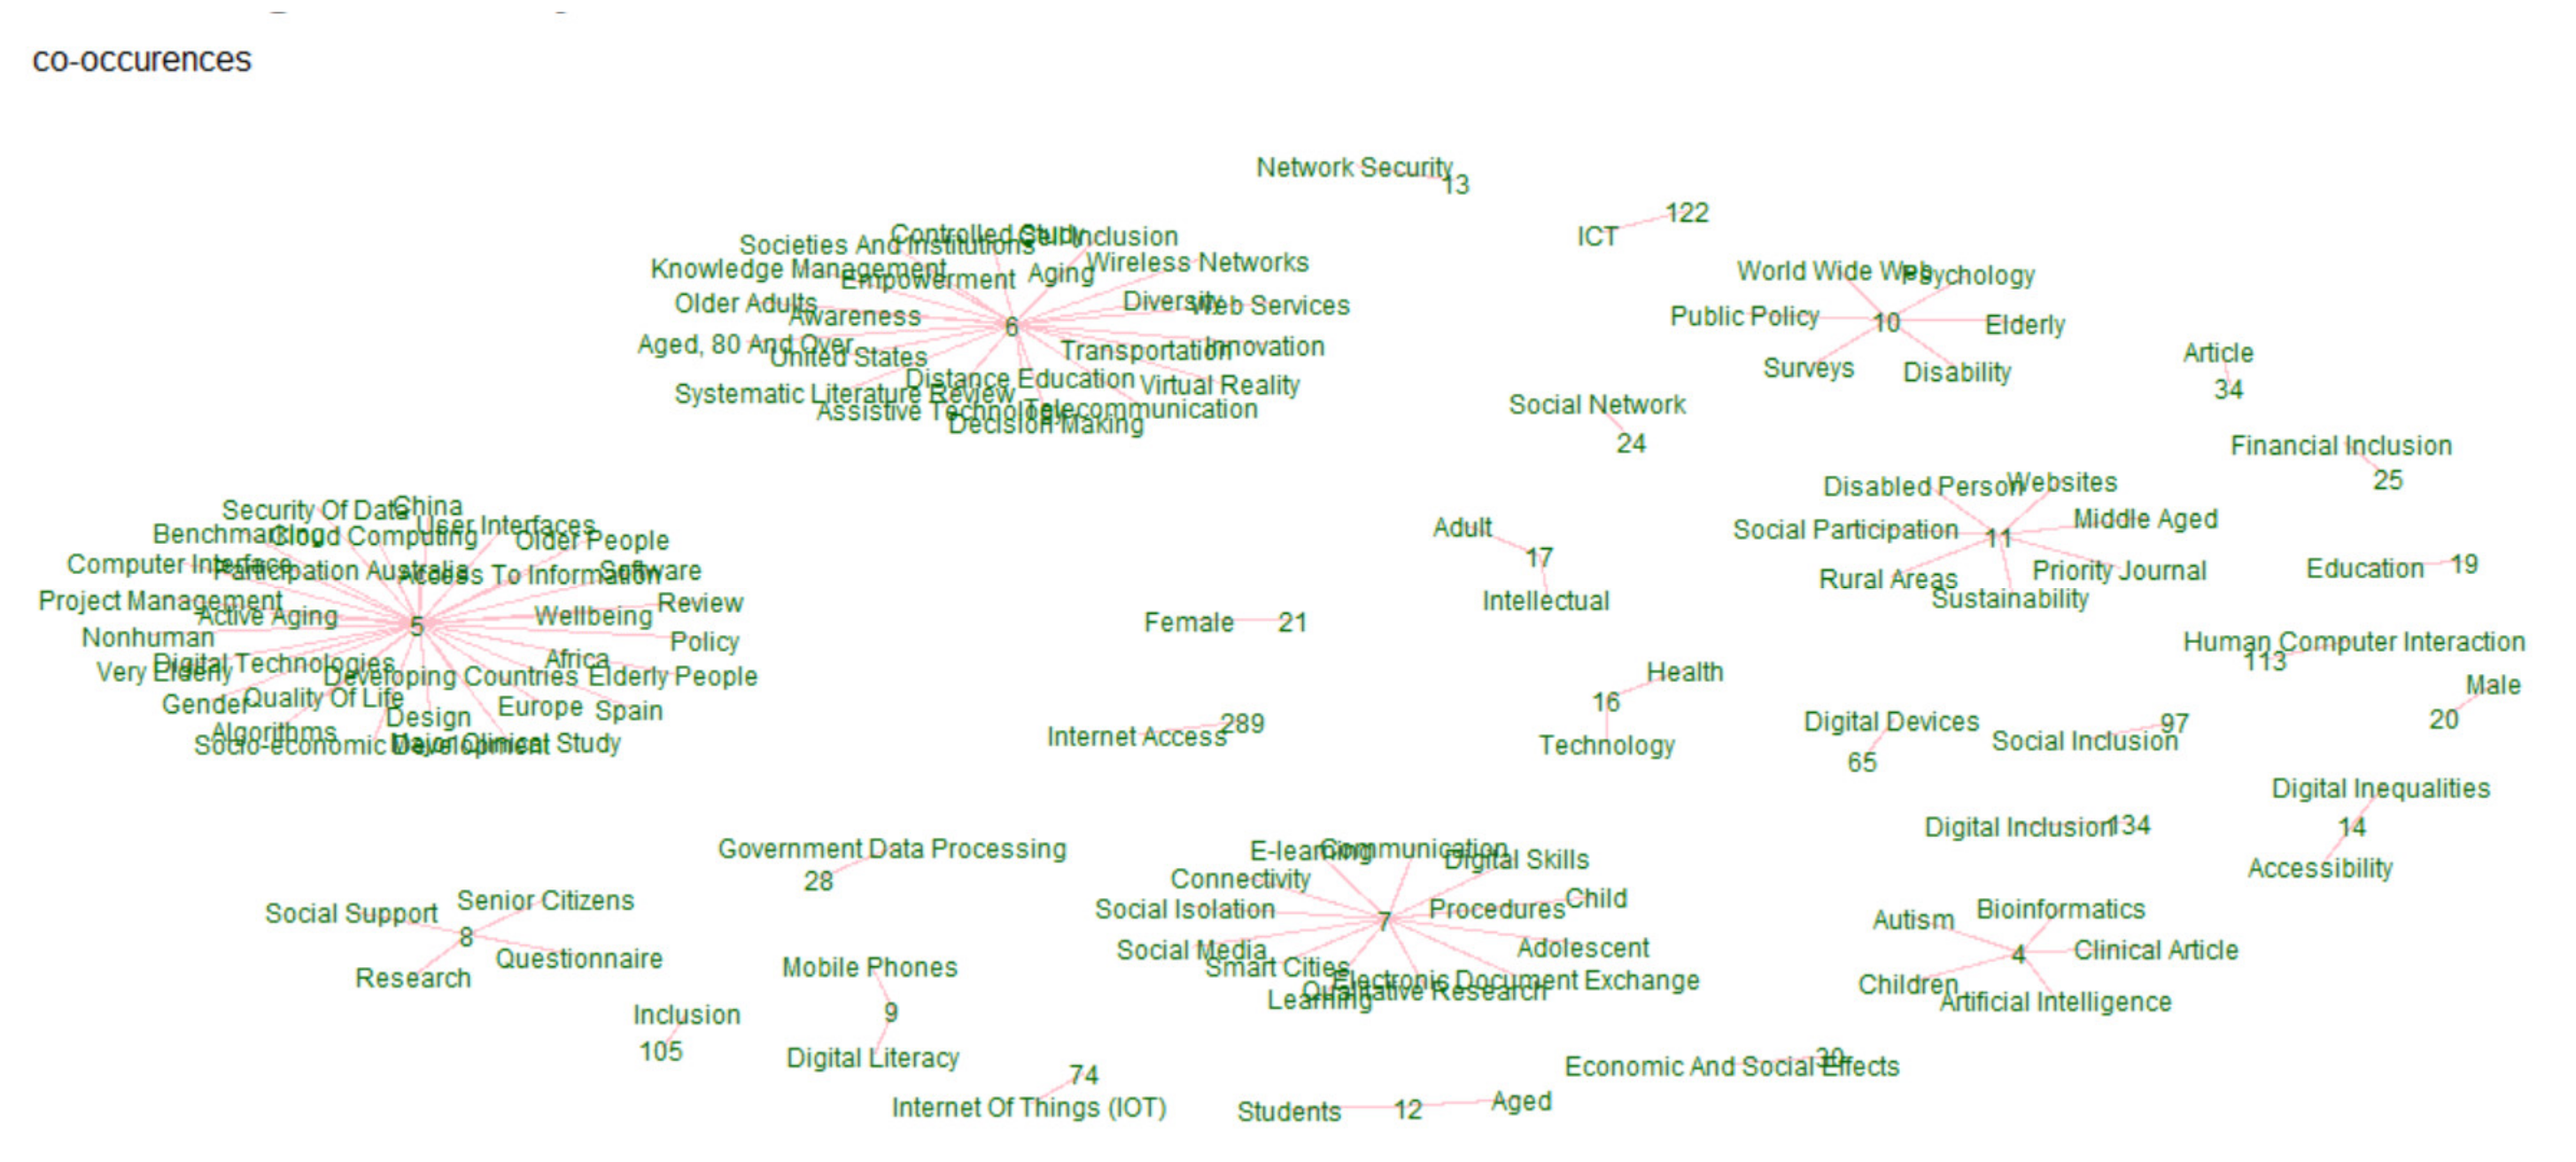
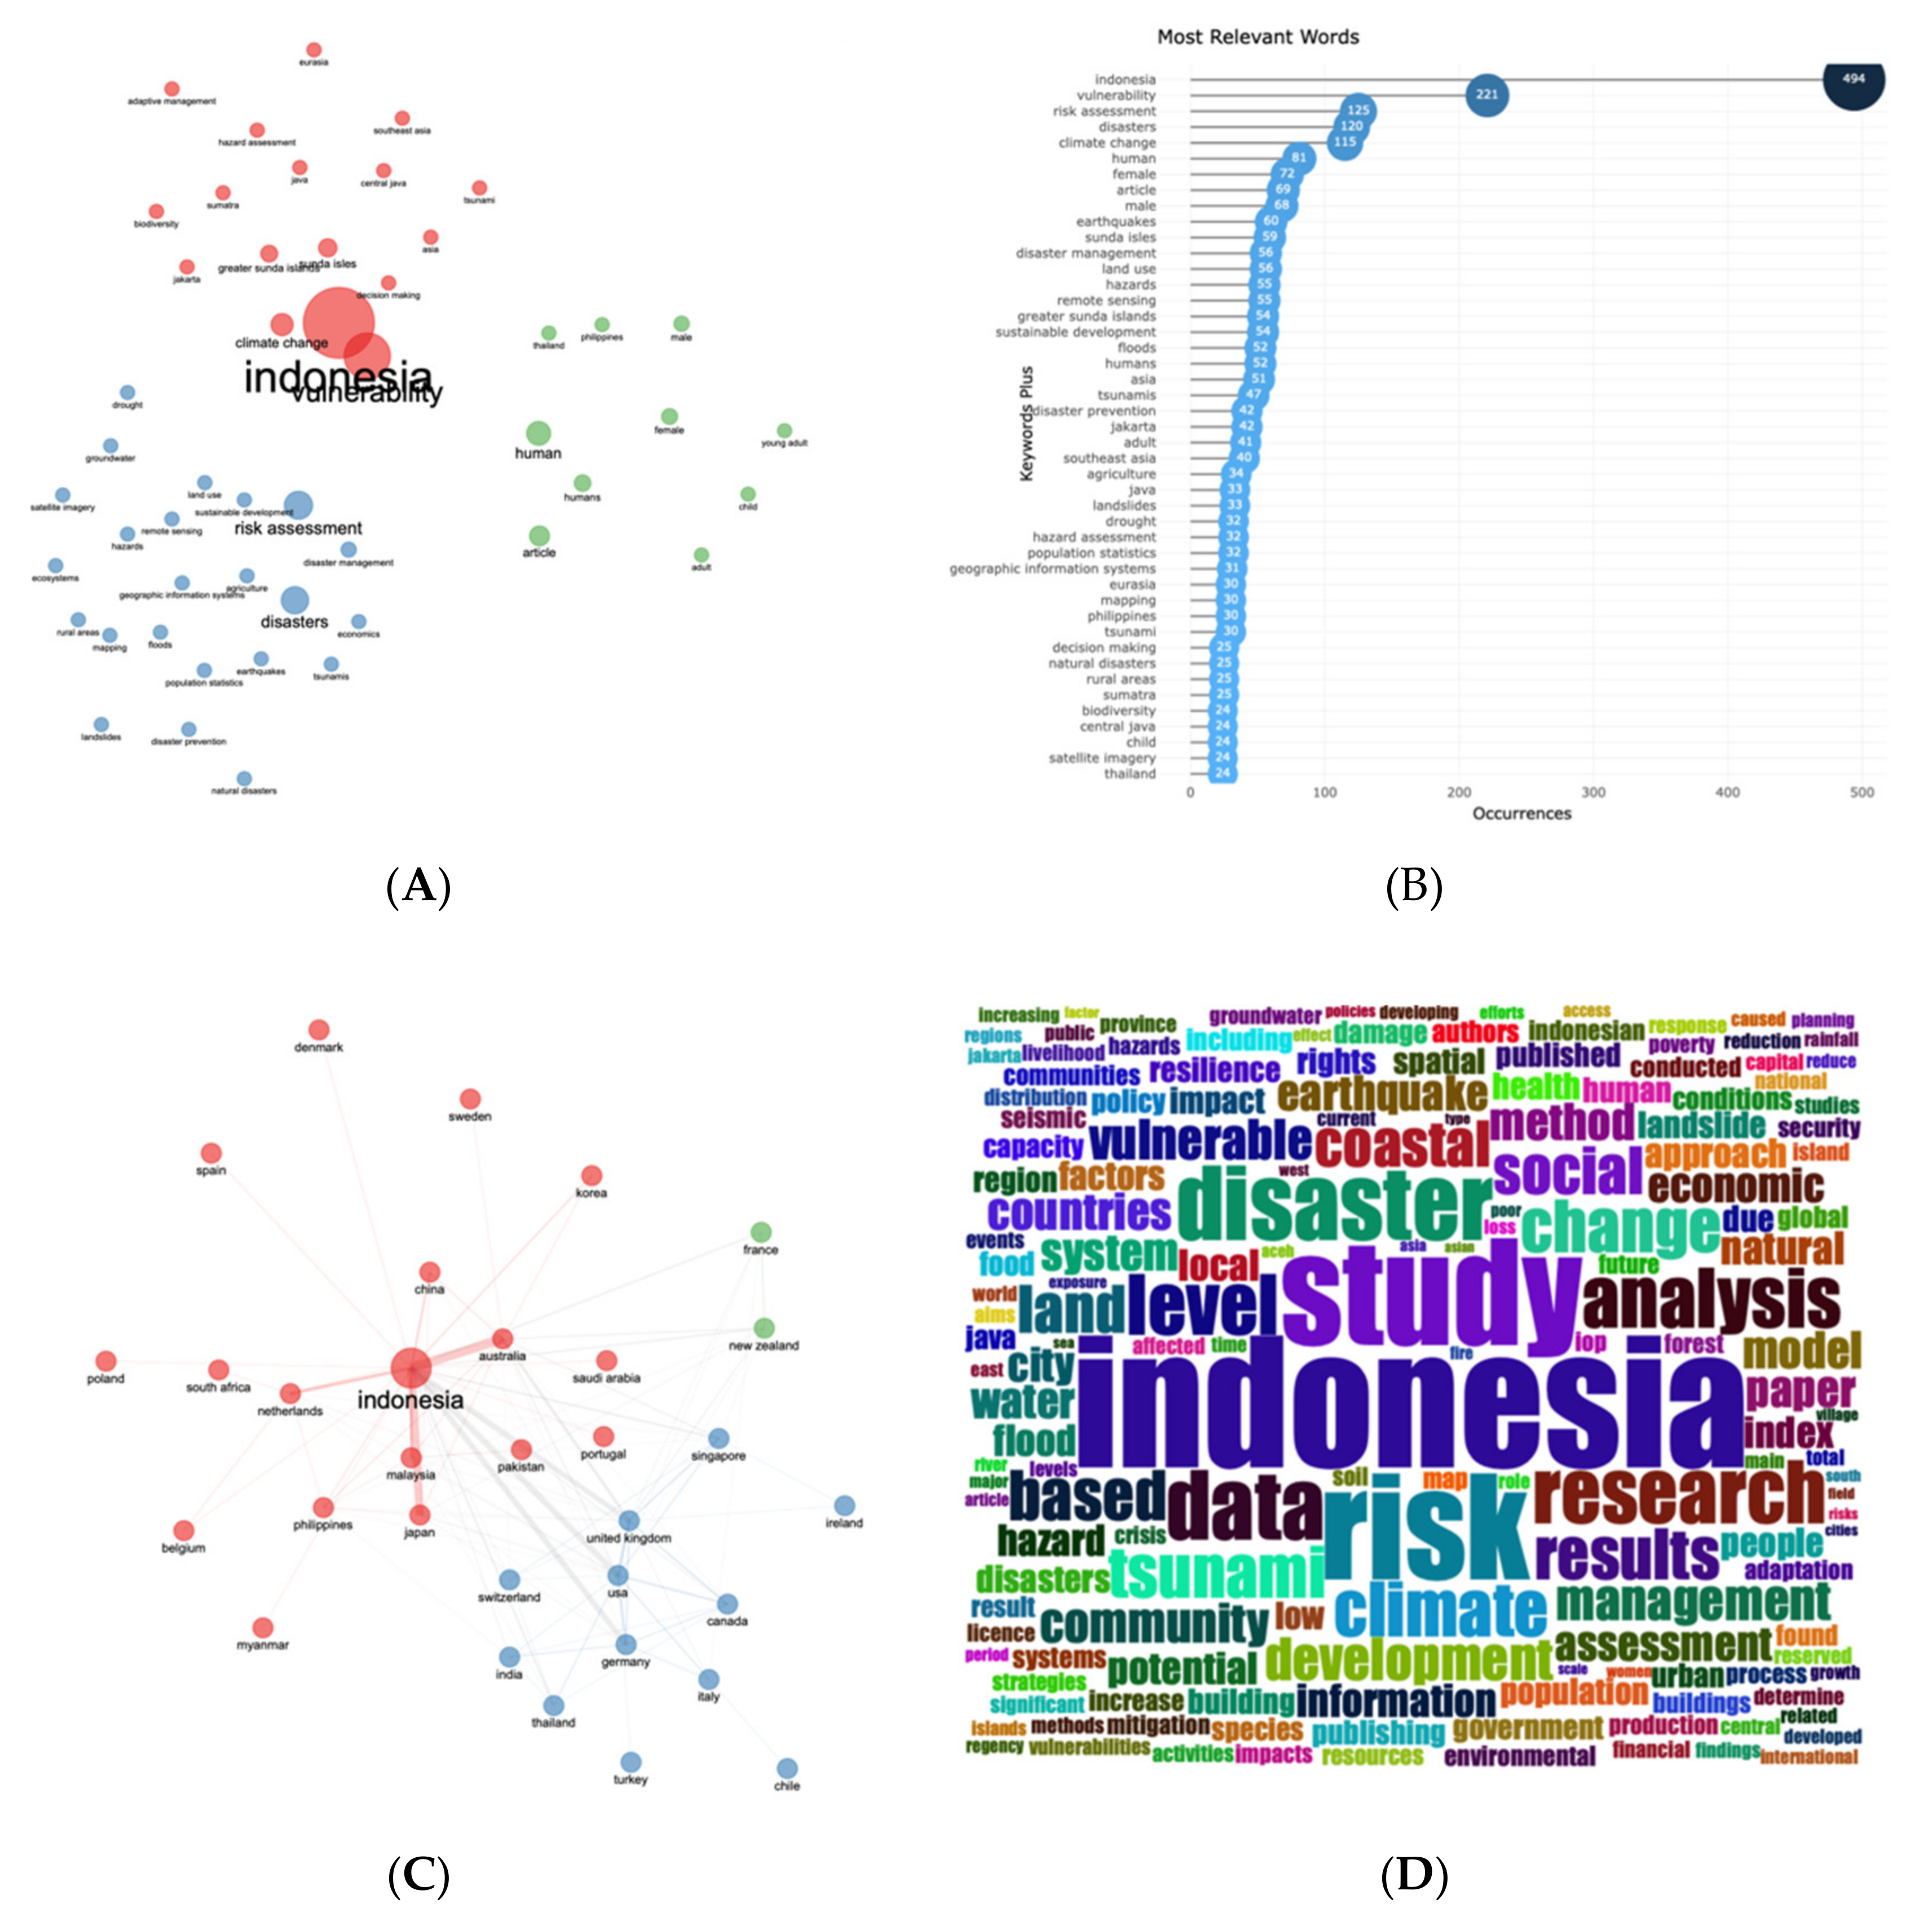
As mentioned before, the increase in digital literacy will be greatly influenced by the integration of ICT. By using bibliometric analysis, it shows what topics are being researched by scientists that are relevant to digital literacy through Scopus website until December 2021. From the results of the bibliometric analysis in
Figure 3, it can be seen that internet access is the most researched topic, followed by digital inclusion and ICT. The most popular words that apparently shows that many scientists discuss internet access, digital inclusion, ICT, IOT, digital devices, etc. Another outcome from bibliometrics we could find some published articles from around the world compared with the Indonesian side.
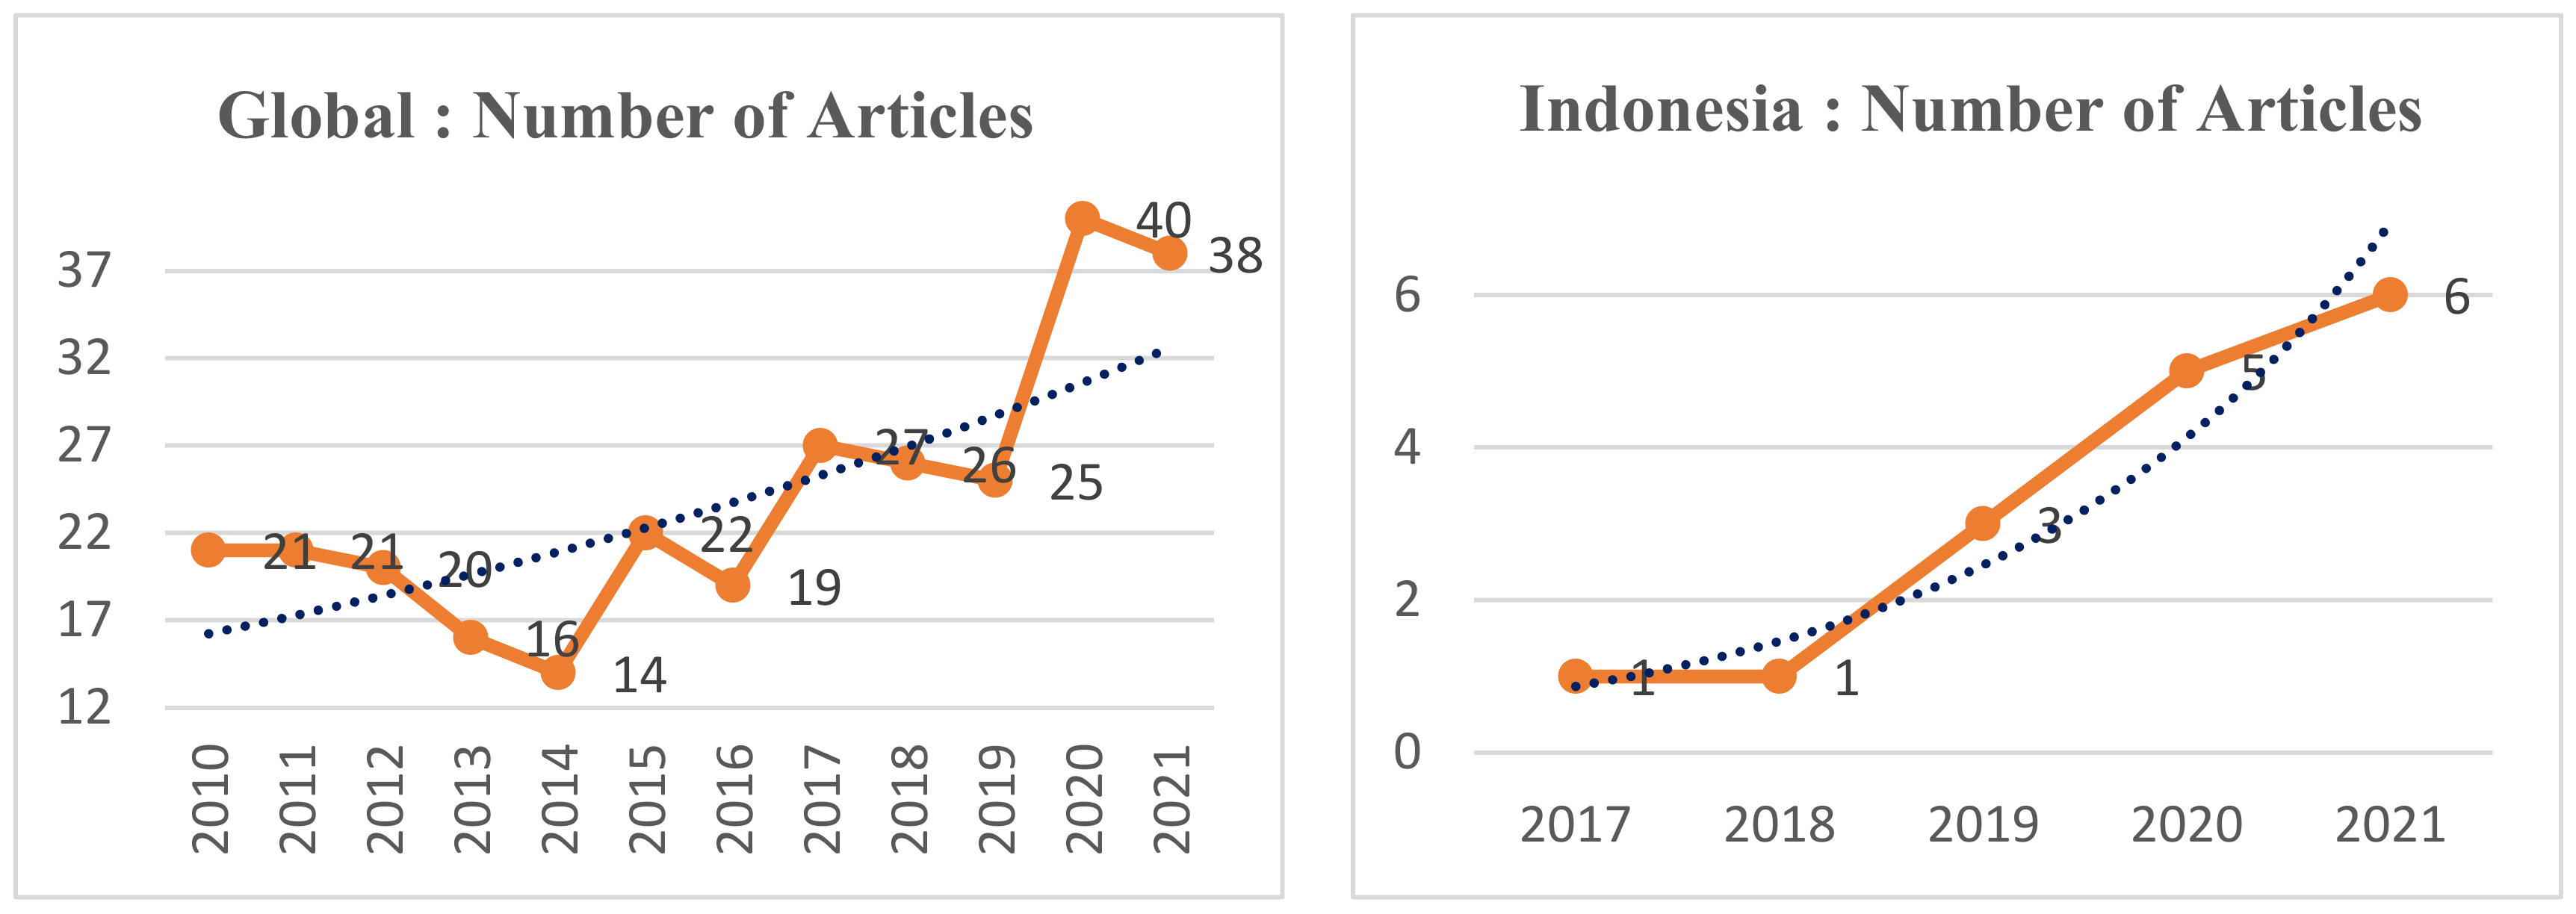
Figure 4, shows and defines that research in Indonesia on digital literacy is still on a small scale when compared to a global one.
ICT Research is very applicable especially to be a concern for all penta-helix collaboration, which includes businesses, public administration, local residents, the knowledge sector, and capital as an early warning system of the impacts that may be caused by uncontrolled natural disasters. Research on natural disasters is fascinating and essential, which concerns the topic of sustainable development goals (SDGs). In taking into account the accumulation of disaster risk generators, it is possible to position the community and the area concerned at different levels of risk. The higher the hazard threat in a room, the higher the risk of a disaster affecting the region. Likewise, the higher the level of vulnerability of the community or population, the higher the level of risk. Using the calculation of risk analysis can determine the level of risk faced by the area concerned. The vulnerability index is the expected level of damage from a particular hazard. Generally, although the type of threat or hazard is the same from one area to another, it causes different impacts due to other vulnerability indices. In line with this,
Figure 5 represents the bibliography study on “Indonesia Vulnerability” by gathering data using Scopus 1181 document results.
Figure 5A,B represent why it is necessary to carry out disaster management which includes all activities that include aspects of planning and disaster management, before, during, and after a disaster occurs, known as the disaster management cycle, which aims to prevent loss of life, reduce human suffering, provide information to the community and stakeholders—authorities regarding risks, reducing damage to crucial infrastructure, property, and loss of economic resources. Disaster is a phenomenon that can minimize its impact on disaster areas by taking preventive, mitigation, preparedness, emergency response, recovery, and rebuilding (development) measures. Therefore, this paper also addresses the vulnerability of the social and economic conditions of the population, in the sense that this analysis is carried out on socio-economic conditions that affect the exposure of the community when a disaster occurs and natural hazards, non-natural hazards, and social hazards.
Figure 5C shows the collaboration of several researchers between countries on the topic of ICT research. This proves that many outside researchers want to study the issue of ICT vulnerability with Indonesian researchers.
Figure 5D, similar to
Figure 5A,B, discusses the ICT issue related to socio-economics vulnerability conditions under treat from disaster occurs (natural hazards, non-natural hazards, and social hazards).
This analysis is based on the variables that have been determined in the methodology, namely the population density variable, the percentage of the female population, the portion of the elderly population, and toddlers, and from an economic point of view, the poverty level and the existence of a business location were chosen because the poverty condition of the people and the place of the business will affect the prospective community in responding to the disaster that will occur. The existence of a threat to the community’s welfare certainly affects the socio-economic conditions. This analysis analyses the overall state of vulnerability, including physical, social, and economic conditions in the study area. In this case, it means that this analysis is carried out on diseases that affect the community’s vulnerability. This vulnerability is the result of the sum and overlay of several vulnerabilities above; this analysis is based on the variables that have been determined in methodology, namely 15 vulnerability variables. These variables are analysed because they will affect when the disaster is predicted. The existence of this threat certainly affects the community’s physical, social, and economic conditions. Based on the classification of total vulnerability, the level of real exposure in eastern Indonesia can be determined. Based on the results of the analysis carried out, it can be seen that the entire study area for total vulnerability consists of moderate to very high exposure.
3.2. Initial Diagnostic
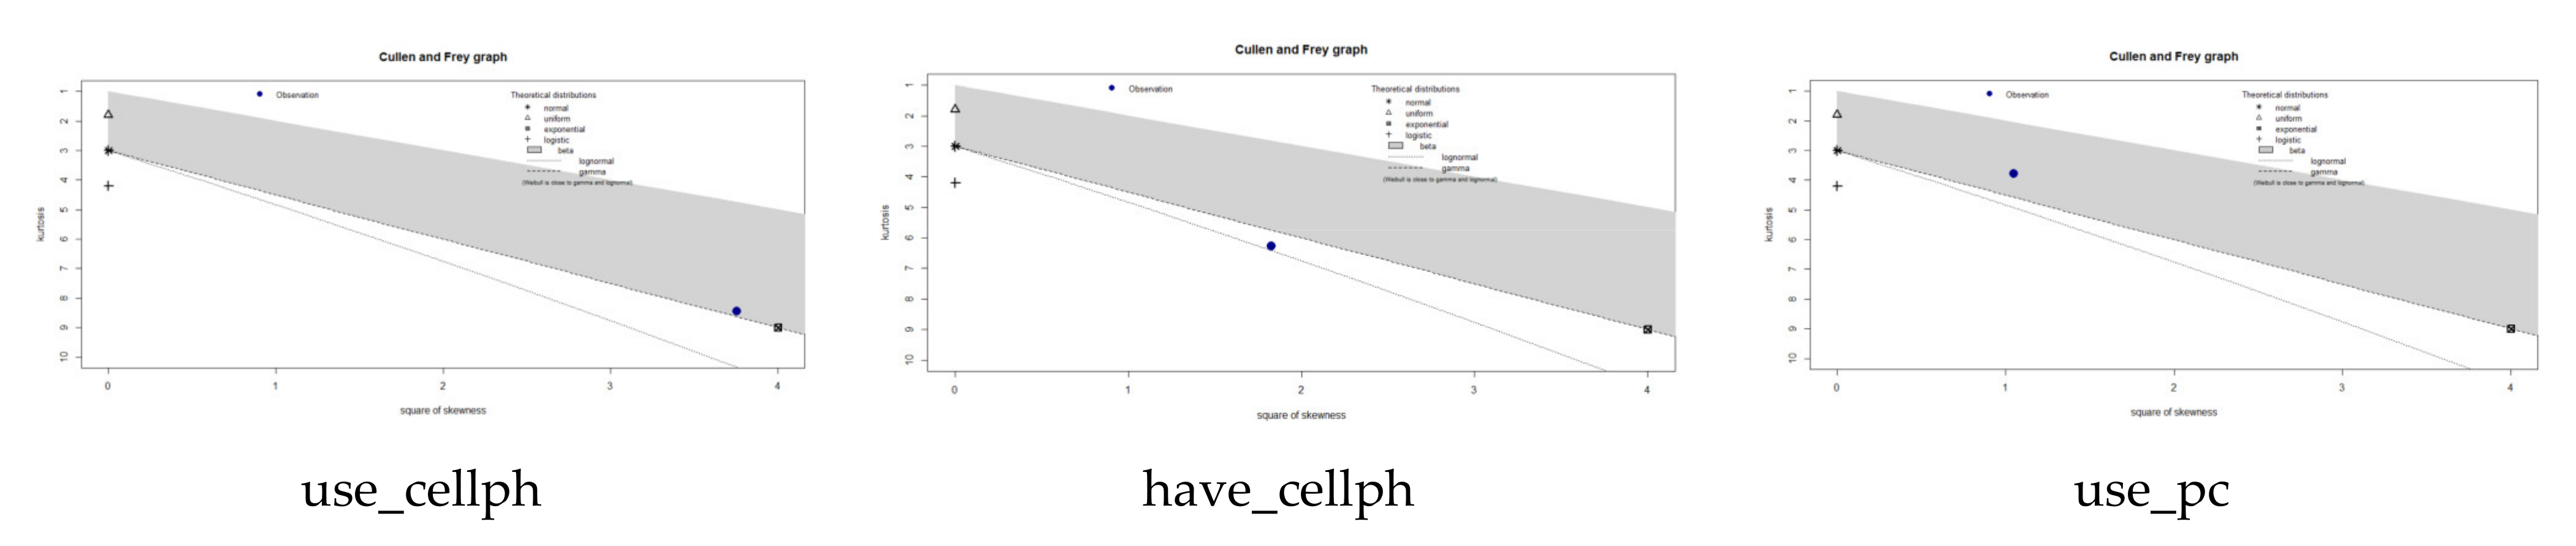
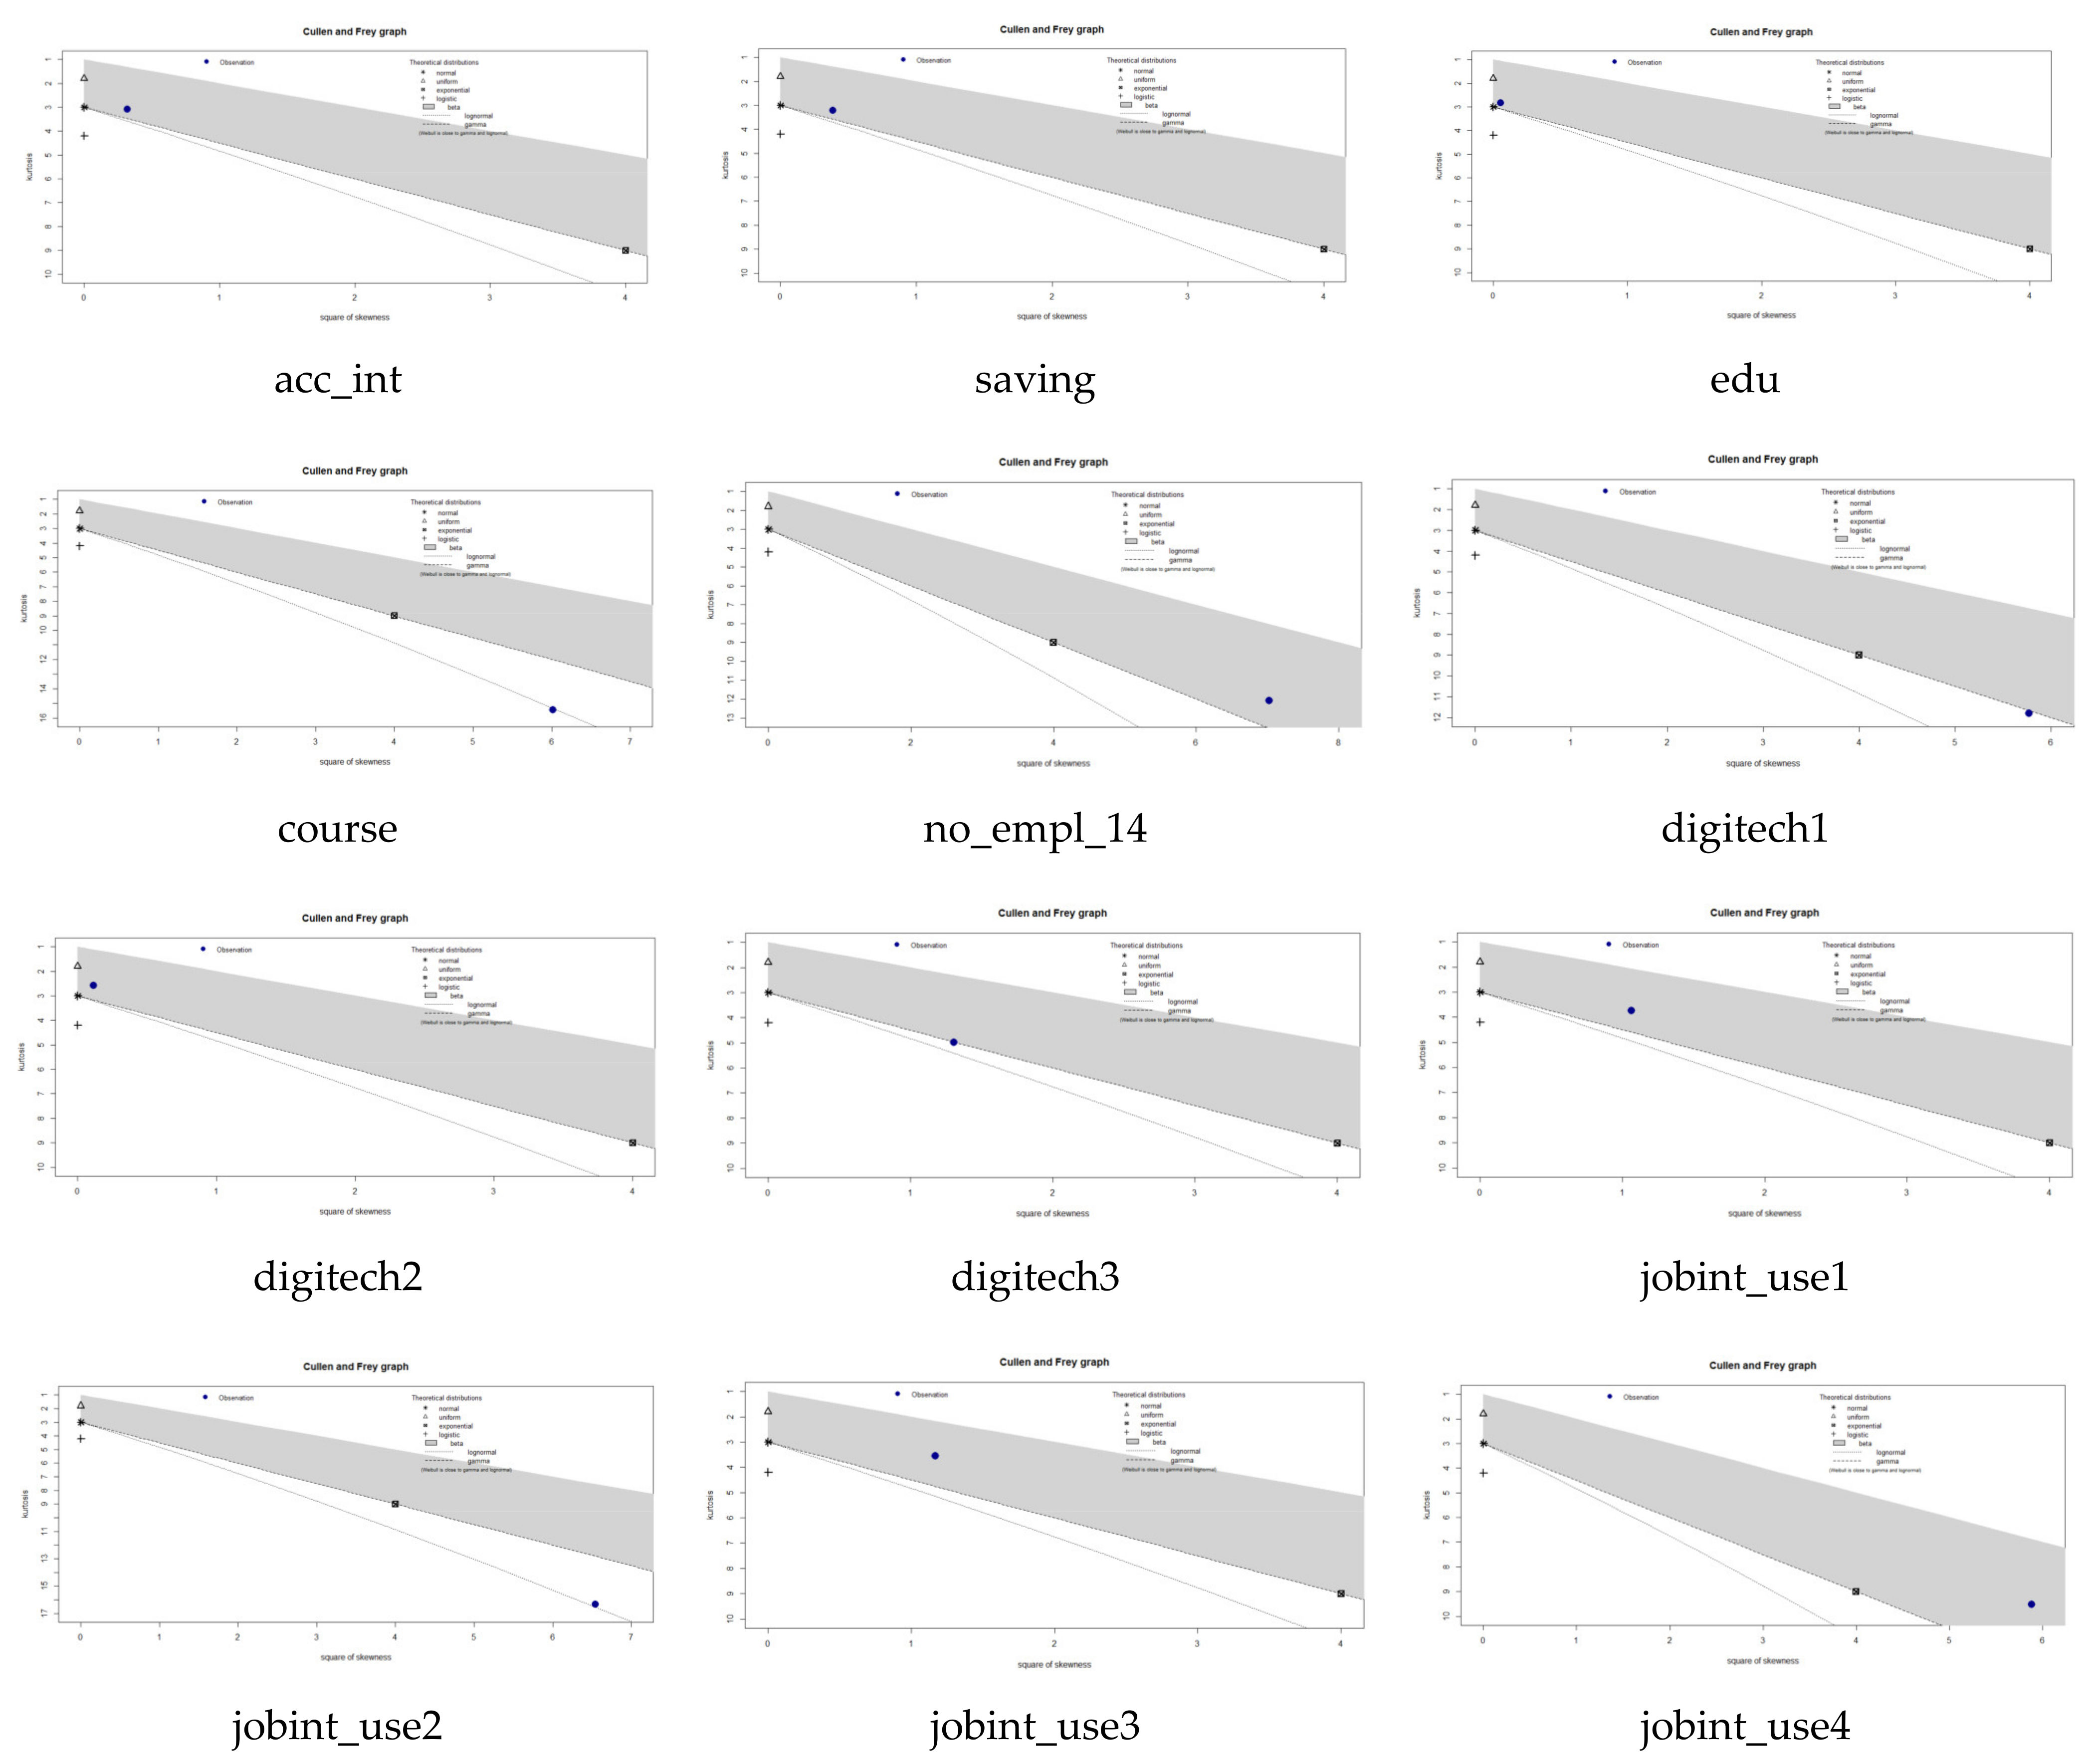
At the initial step, descriptive statistical analysis was carried out on 15 variables for all districts and cities, which shows in
Table 2. In addition,
Figure 6 shows the data distribution including the square of skewness and kurtosis. In terms of the use of ICT, it can be seen that there are still many people from eastern Indonesia who have not yet benefited from access to information technology. On the other hand, the use of ICT to support work such as promotions, social media, and e-commerce is still very minimal because the average value is small (<25%). Access to the internet is also still very low on average (26.60%), this is a concern for the government that less than half of the population of eastern Indonesia feels the benefits of the presence of the internet.
Examining the data distribution is very important to gain insight into the information trend of the problem to be solved. This is because in the dataset, there is no information represented by 0/null. This means that that does not provide information in that area at the household level. Yet, it is different for the use_cellphone and saving variables.
The next step is to analyze the correlation between variables. In general, correlation analysis is a statistical method used to find out and measure the relationship between two variables or more. With this method, one can determine how strong the relationship between variables that have not been known before is.
Based on the results of the correlation analysis in
Figure 7, there are several variables that have a strong relationship, such as ownership of a computer and the use of internet access. This can be an indication that the increase in people’s purchasing power for computers must also be supported by the availability of wide internet access. Another fact that can also be seen from the correlation plot is that many people use smartphones as a medium of communication at work. This will certainly have a good impact on improving public information services through central and local government regulations.
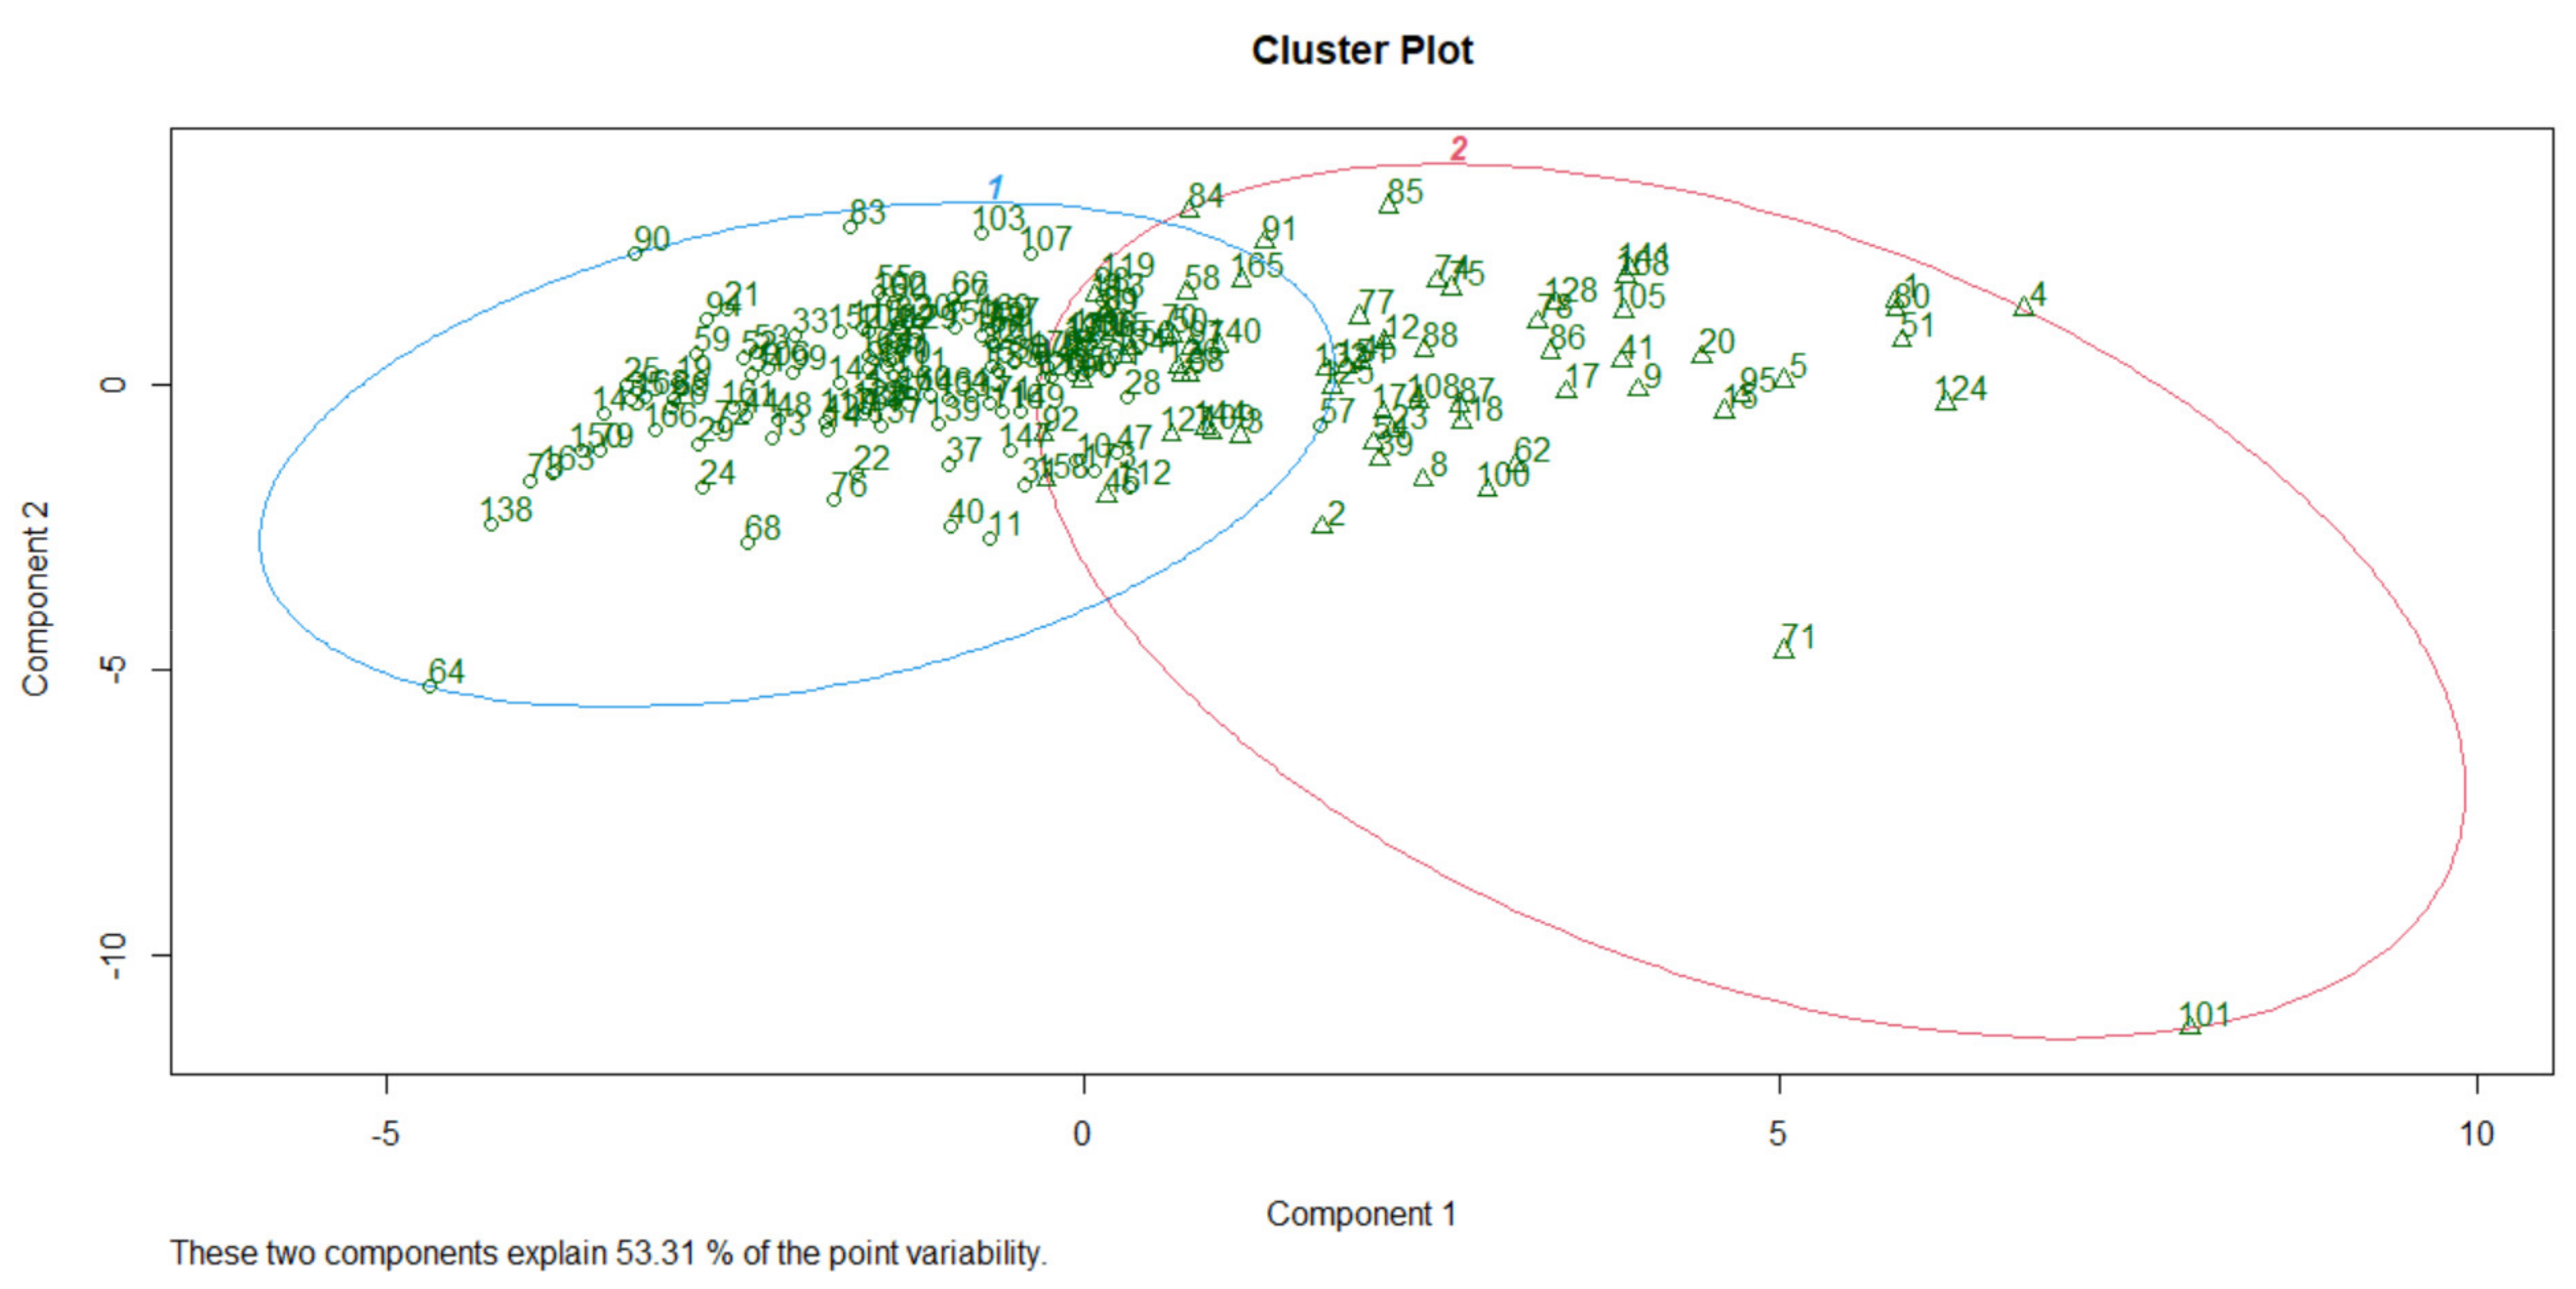
3.3. Spatial Fuzzy C Means Clustering
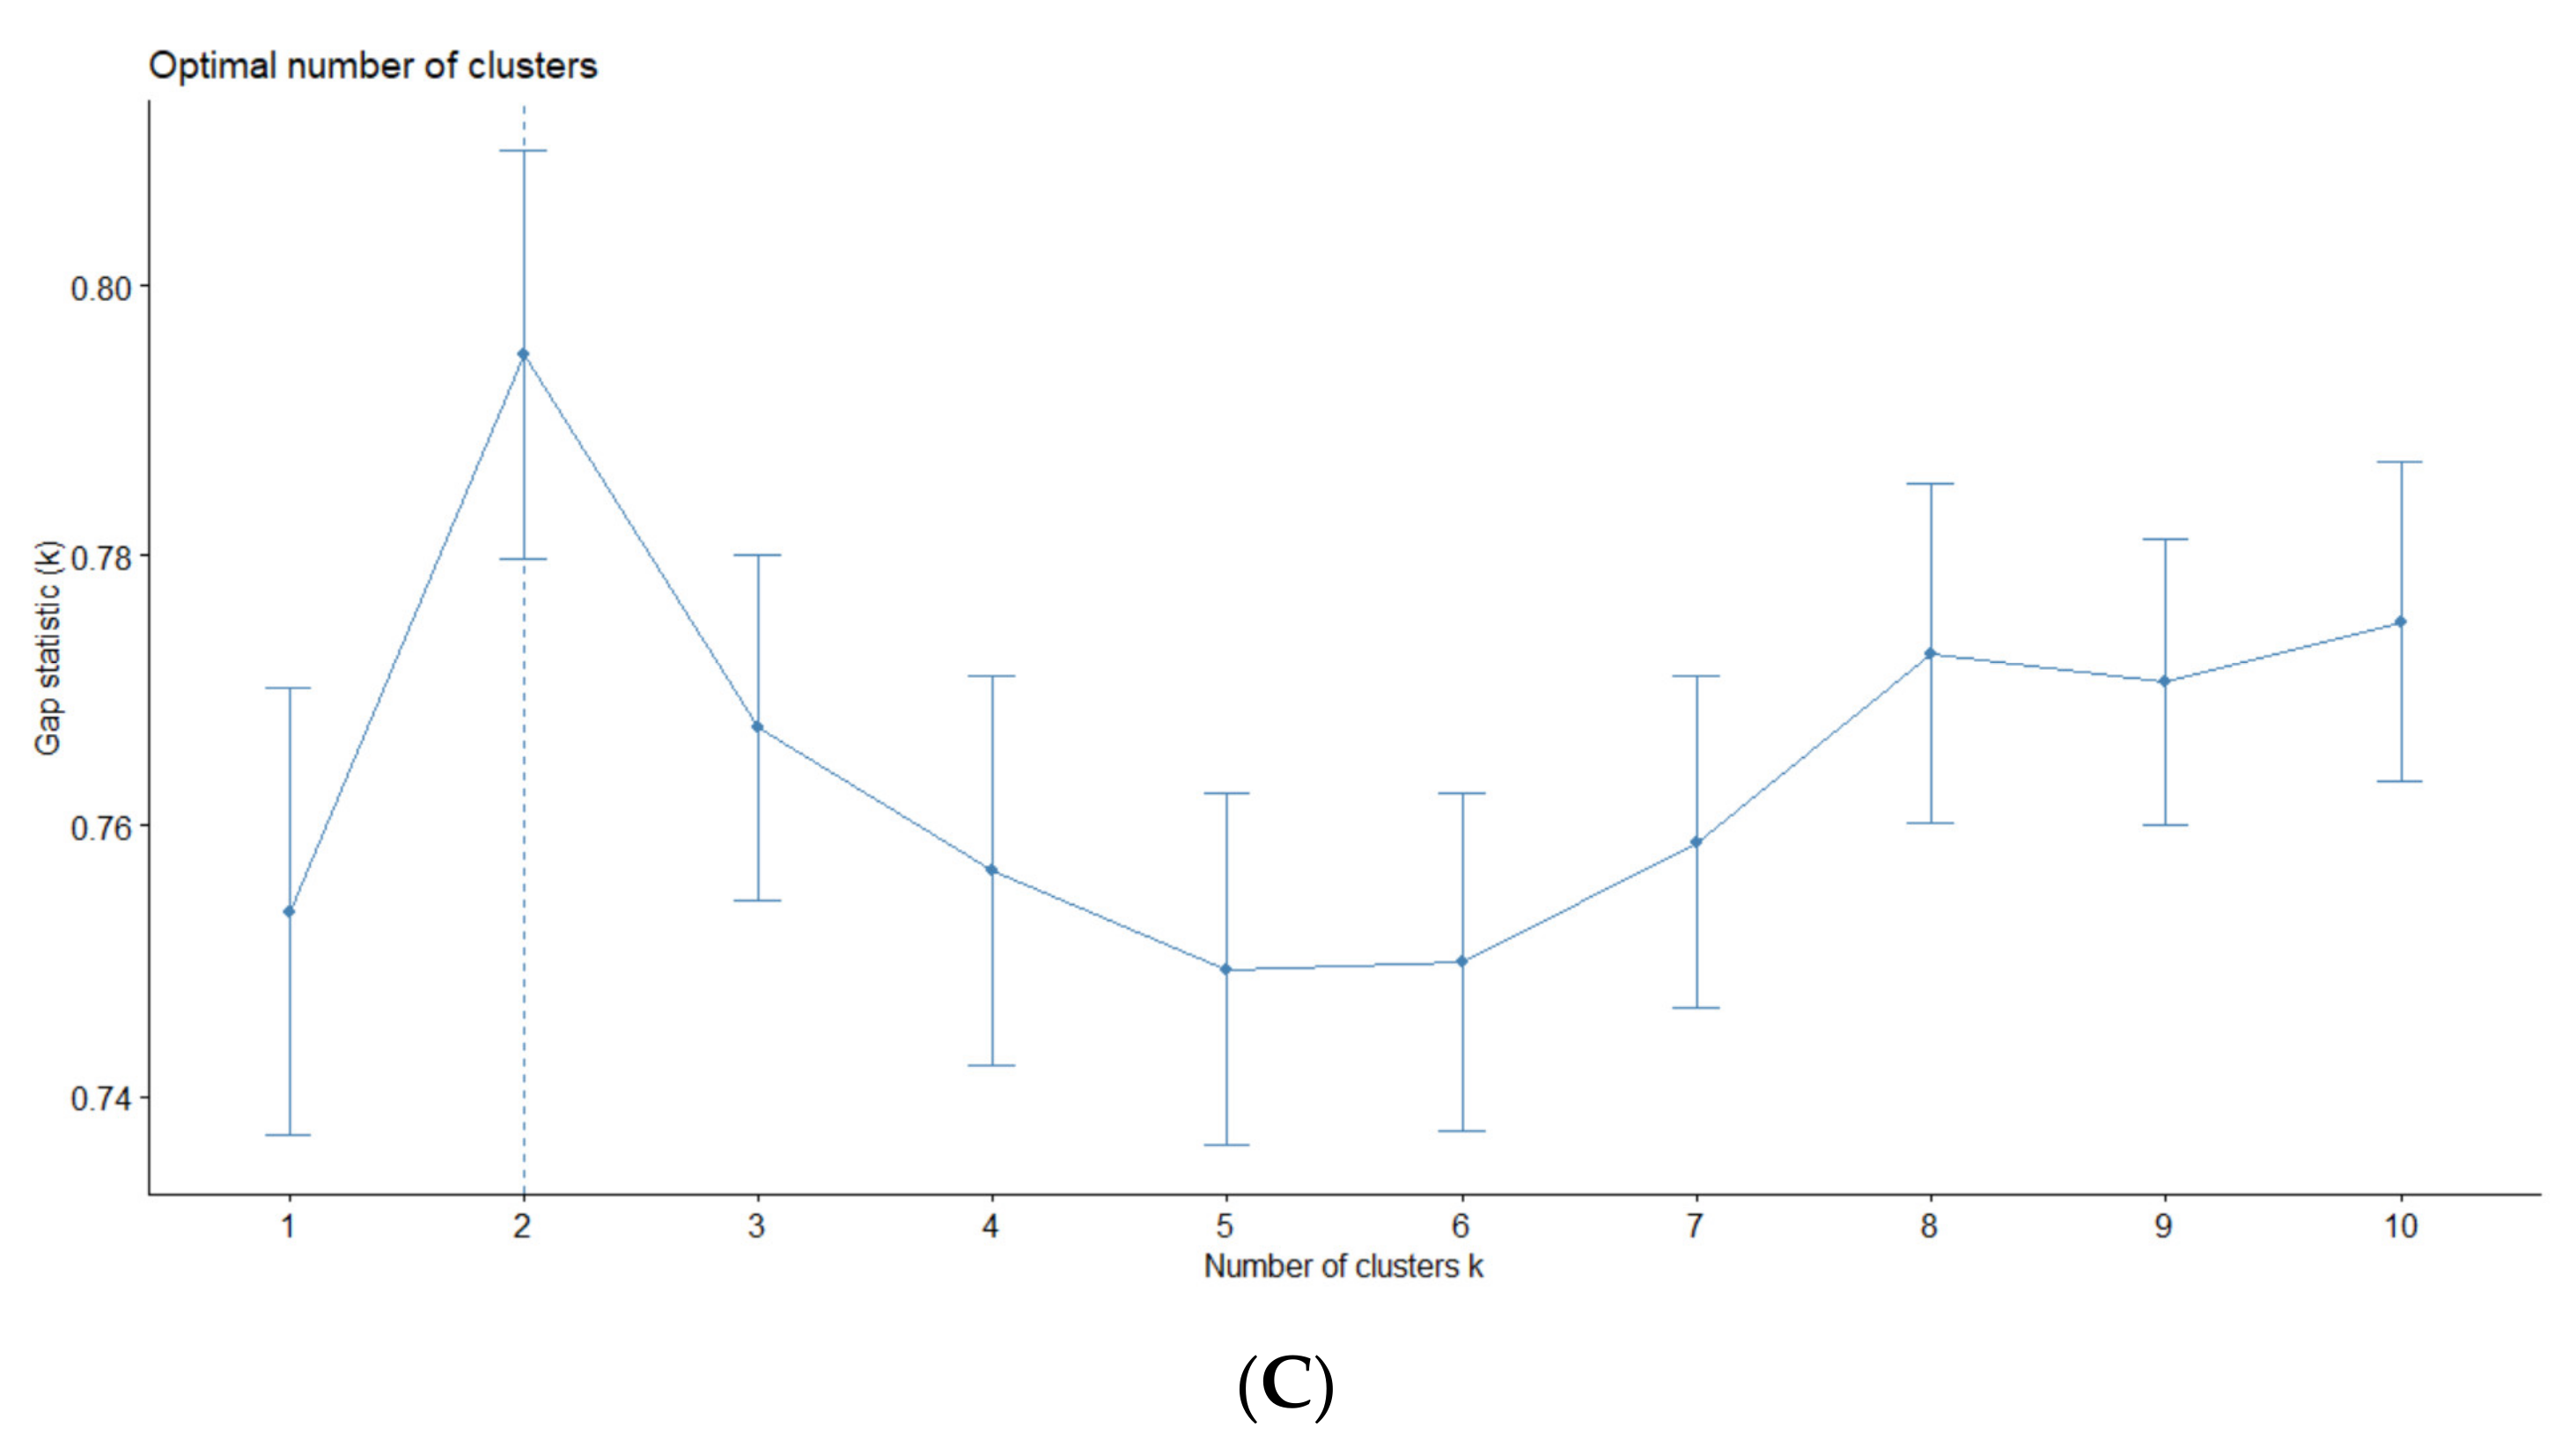
The next step is to find the optimal number of clusters. In addition, Silhouette, Elbow, and Gap statistics indicators as the statistical evaluation to measure the optimal cluster, which represents in
Figure 8. In line with this, the Fuzzy C Means towards ICT clustering in Eastern Indonesia only can be performed by two clusters.
Before running the FCM machine learning model, validation is needed by taking the test with several clusters. This test uses measurement parameters including Fuzzy Silhouette Index, Partition Entropy, Partition Coefficient, and Modified Partition Coefficient, respectively. The purpose of this validation is to ensure that the cluster with two groups is the best when compared to several other groups.
Based on the validation measurements in
Table 3 (SI, PE, PC, MPC), it can be ascertained that the number of two clusters is the best model. With the largest SI value of 0.5264, the smallest PE value of 0.5699, the largest PC value of 0.6153, and the largest MPC value of 0.2270. We also could define the cluster plot in
Figure 9.
Having the optimal cluster plot can define which areas are included in the vulnerable or low category cluster through the cluster center point value. By looking at the output cluster center values in
Table 4 shows can conclude that cluster 1 is for areas that are very vulnerable because most of the cluster center point values are lower than cluster 2. There is a very large gap between cluster 1 and cluster 2 for several variables, such as the use of personal computers (use_pc). This certainly needs to be a concern that the operational use of a very important PC has not been evenly distributed between regions, thus it needs support from the government for the equitable introduction of hardware such as PC and other supporting devices for the advancement of ICT. This automatically has an impact on the variable of using a PC for work (digitech1); if we look at the value of the center of cluster 1, it is very far (almost three times) compared to cluster 2. The very large gap is also shown in the variable of using information technology for buying and selling activities in e-commerce (jobint_use4), even though if the use of information technology is used properly it will be able to encourage the Micro Small Medium Enterprises (MSMEs) sector to be better known and sell to other areas both in terms of national and international scale.
From the results of the cluster output in
Figure 10 obtained members who entered cluster 1 as many as 108 regions while members who entered cluster 2 as many as 66. This means that 62% of regions in eastern Indonesia fall into the category where ICT is very vulnerable, the remaining 38% fall into the category of low vulnerability.
3.4. Future Work toward ICT Expansion Based on an Existing Plan
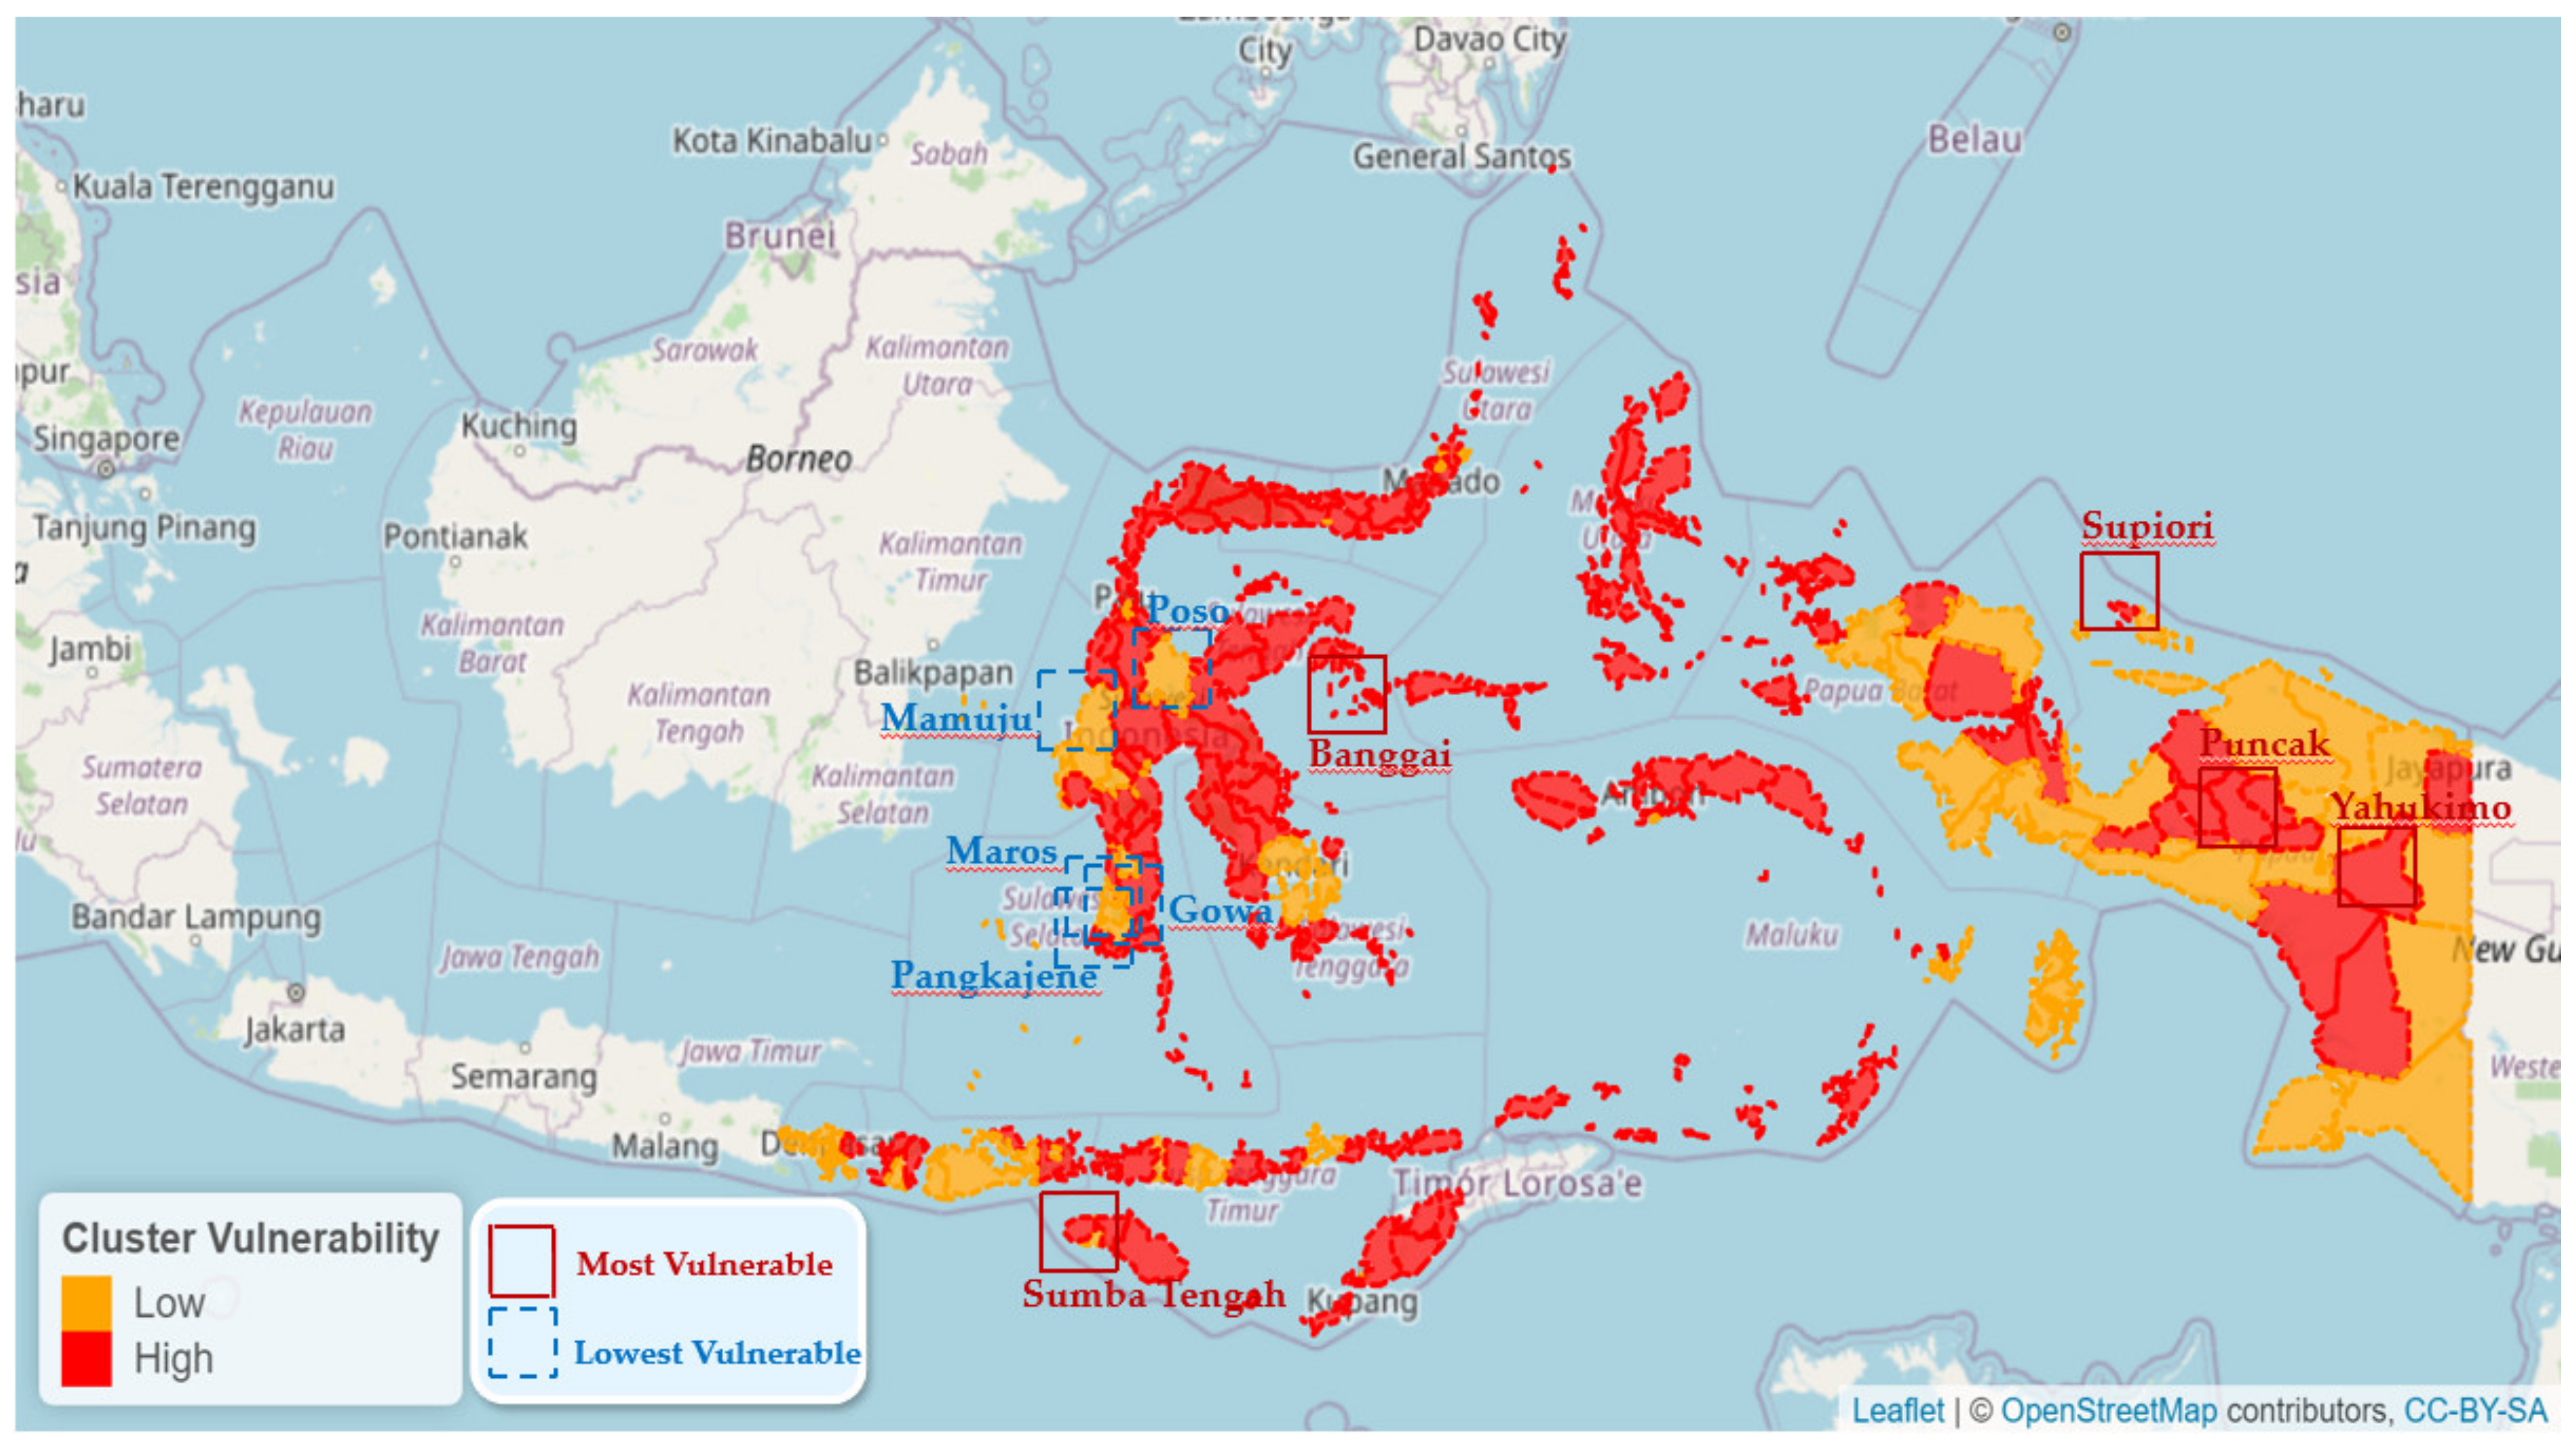
It can be seen in
Figure 10 that there are the first 5 locations with a low level of vulnerability, such as Maros, Gowa, Mamuju, Poso, and Pangkajene, which are included in Cluster 2. The ICT index for the Province of South Sulawesi (Maros, Gowa, Pangkajene, Indonesia) in 2020 has an ICT index value of 5.59 (Publication of BPS Indonesia). For the first five locations with high vulnerability, such as Central Sumba, Supiori, Yahukimo, Puncak, Banggai, which are included in Cluster 1 with lower ICT index values (Papua [3.35]: Supiori, Yahukimo, Puncak, Indonesia; Central Sulawesi [5.27]: Banggai, Indonesia; NTT [4.49]: Sumba Tengah, Sumba Tengah).
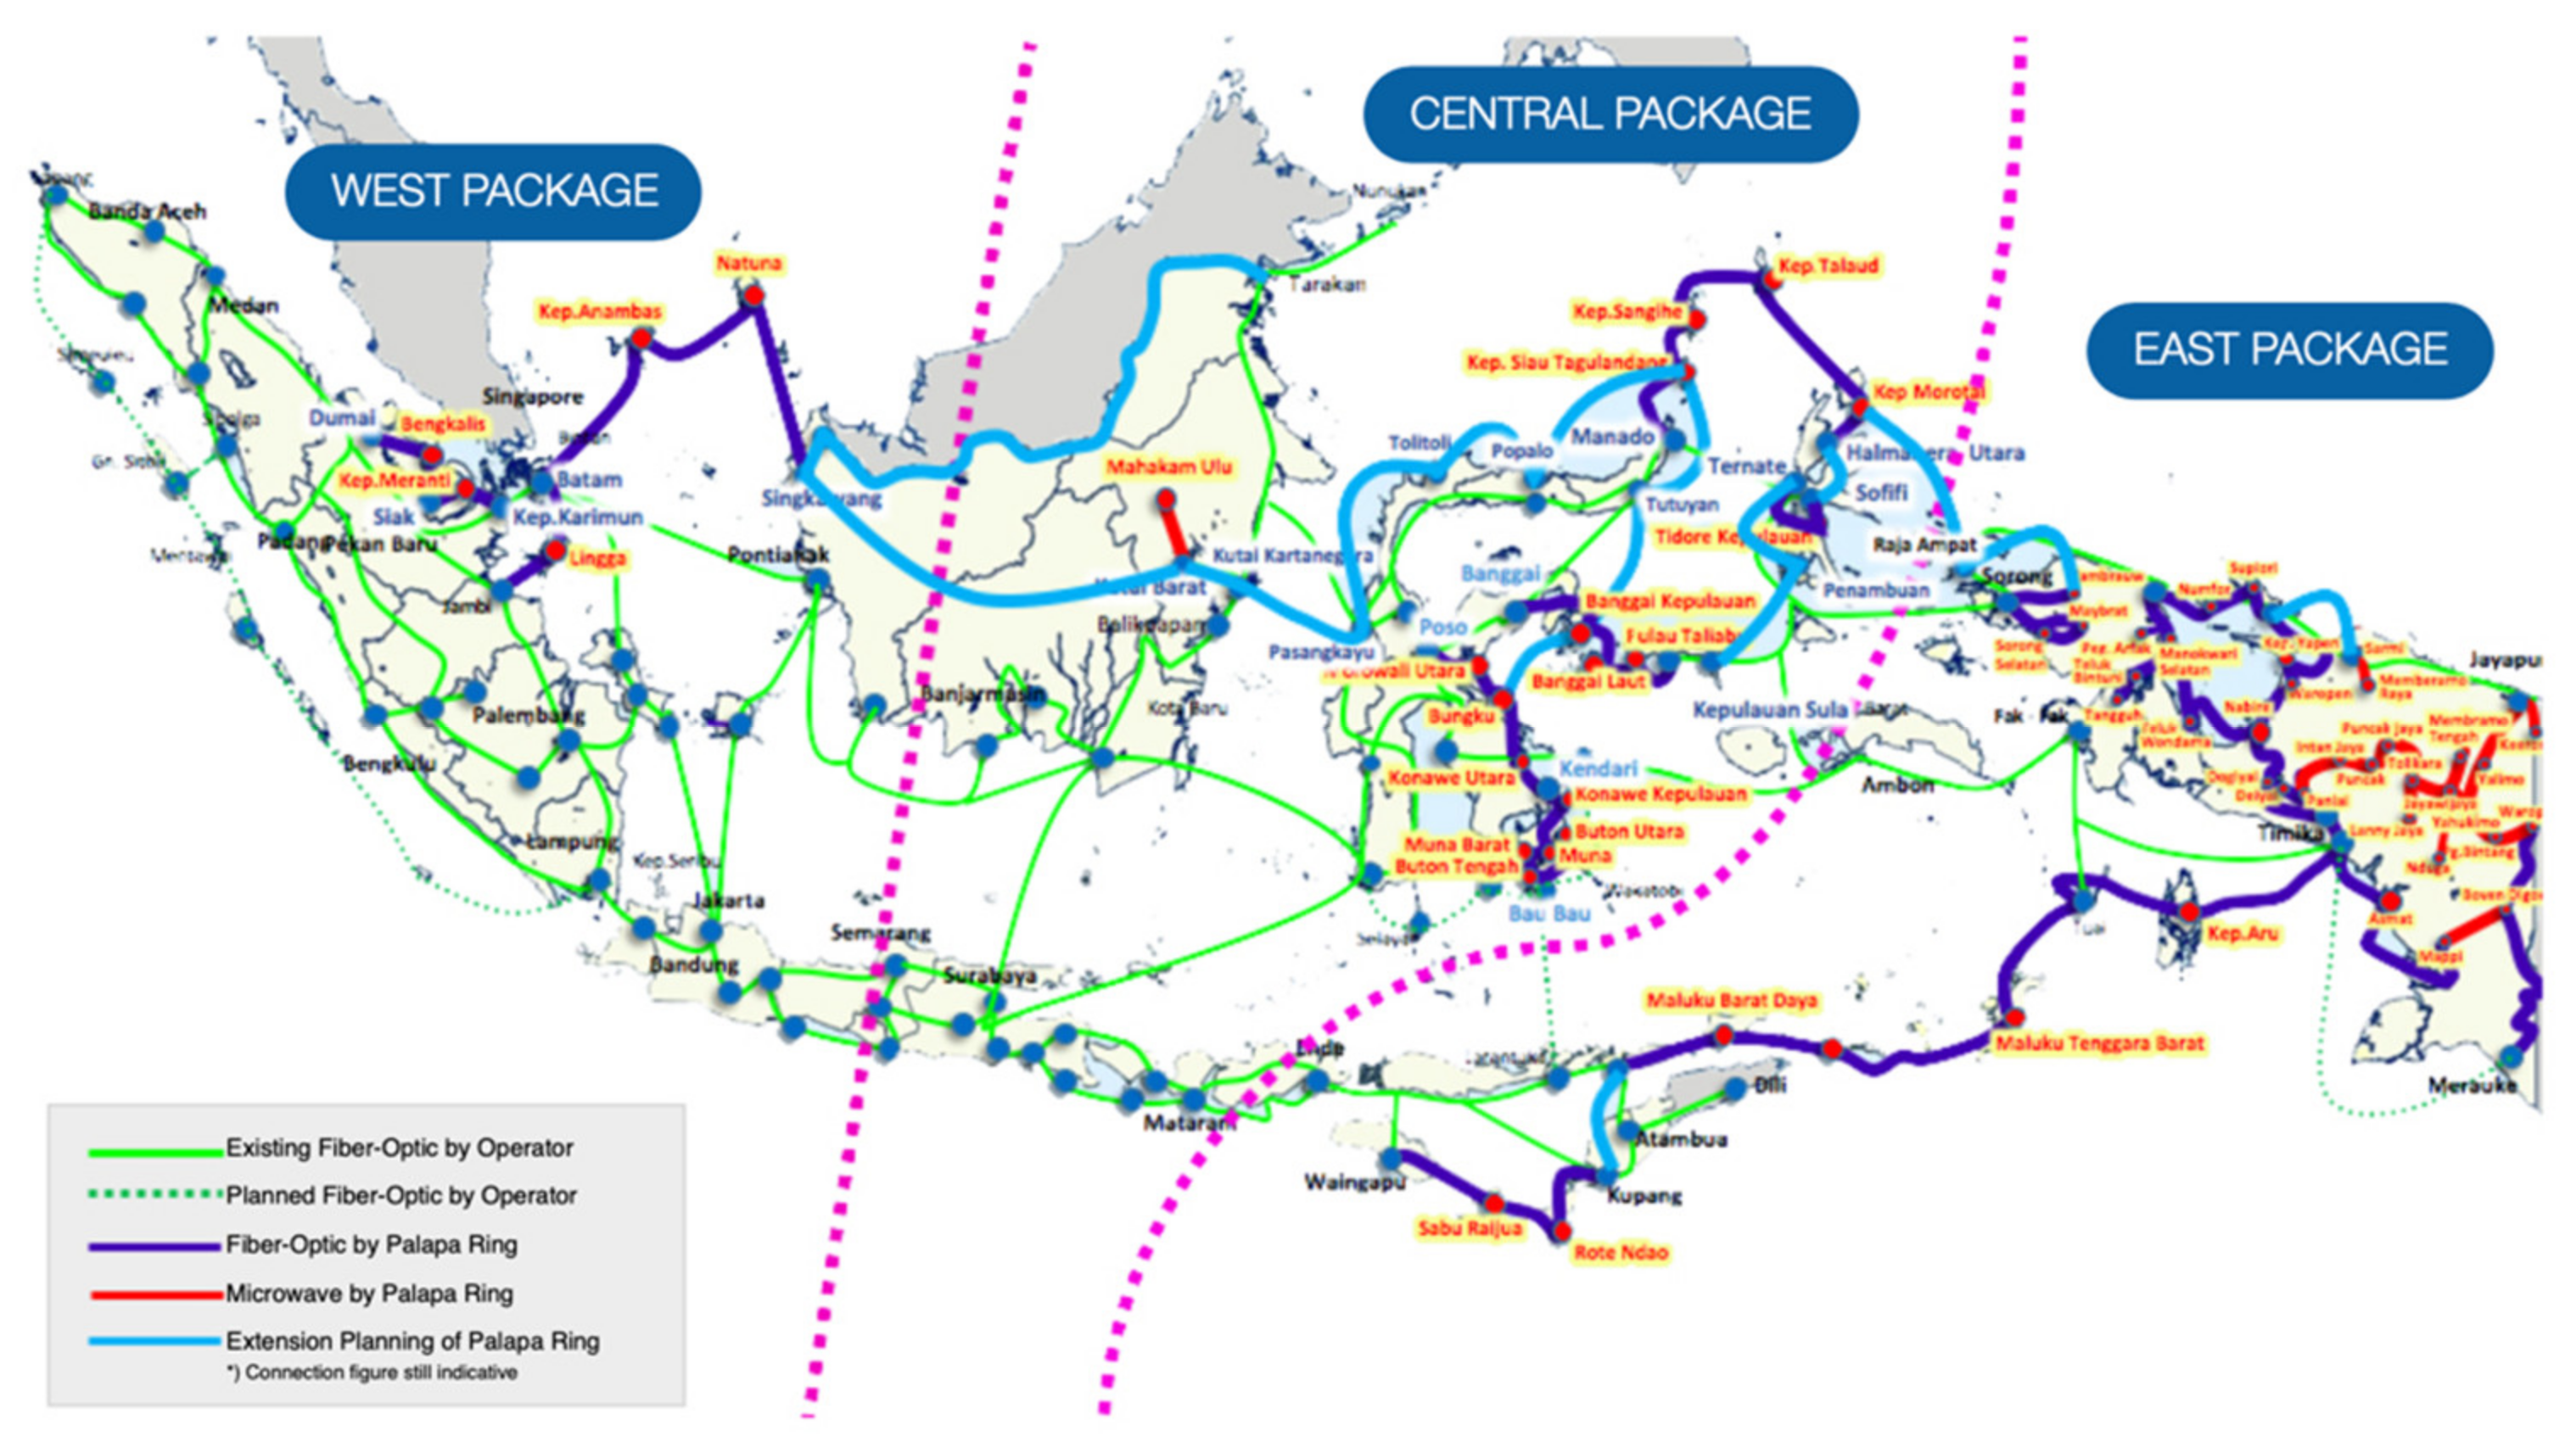
The Indonesian government already has an ICT development plan written in the Ministry of Communication and Information Technology Strategic Plan (RENSTRA KOMINFO), which seeks to support the establishment of a national digital foundation, one of which is the construction of the Palapa Ring, which has been running for the 2015–2019 period. The Palapa Ring program is a national strategic project to build a national fiber-optic backbone network in non-commercial. More detail in frontier, outermost and least developed regions often referred to as 3T ( terdepan, terluar, tertinggal ) regions as a step towards realizing an integrated telecommunications infrastructure. This project also aims at equal distribution of access and prices for broadband internet services in all cities/districts in Indonesia. As of 2019, the construction carried out by the PT Telkom Indonesia Tbk, also simply known as Telkom, is an Indonesian multinational telecommunications conglomerate. Telkom has completed connecting the national backbone network to 457 regencies/cities, and the construction by Public Private Partnership (PPP) has been completed in 57 regencies/cities so that a total of 514 regencies/cities have available a national backbone network shows in
Figure 11. The purple line in
Figure 11 shows the separation of the western Indonesian time (WIB), central Indonesian time(WITA), and eastern Indonesian time (WIT).
This research will significantly help answer the challenges in the Ministry of Communication and Information Technology Strategic Plan (RENSTRA KOMINFO) for the next period to ensure that the Palapa Ring coverage is well integrated, and there is great hope that the community can take advantage of broadband access with a deeper level of regional granularity, namely the districts.
Therefore, the Indonesian government is working optimally to minimize the risks caused [
38,
39,
40]. ICT has an essential role in disaster mitigation, especially in the face of the new normal. In certain situations, especially threat situations such as COVID-19, information needs to be communicated and worked on as soon as possible. Delays in receiving information can trigger more significant problems and harm. Information and Communication Technology (ICT) has become an innovative strategy for penta-helix contributors to assist services, delivering services to produce sustainable competitive advantages. Meanwhile, ICT is all forms of computer-based technology used to process data. The processing includes processing, obtaining, compiling, storing, and manipulating data in various ways to produce quality information. This form of technology is facilities and infrastructure or products and services in the state of desktop computers, laptops, handled services, wired or wireless intranets, software, data storage, network security, and others. At the same time, the ICT is also information technology in the form of hardware, software, and user systems used as media in obtaining, transmitting, processing, interpreting, storing, organizing, and manipulating to produce quality and meaningful use, including the relevant information accurate and timely.
4. Conclusions
Although there are many benefits derived from the application of ICT. Nevertheless, the utilization of ICT by the eastern regions in Indonesia is still relatively low, even though ICT. For example, MSMEs cases can also provide opportunities to market their products and services so that MSMEs can expand the market. This could be due to the lack of financial resources owned by MSMEs, thus influencing MSMEs’ decisions in implementing ICT. The influence of MSME owners in all decision-making in the use of ICT is also one of the obstacles in using ICT. The importance of appropriate economic policies is really needed so that a large productive age population is truly became a demographic bonus. Entering the industrial revolution era 4.0 (IR 4.0), the Eastern of Indonesia also needs to develop a business sector that absorbs human labor. In line with this, the Eastern of Indonesia must have a wide range of job opportunities, and human resources have the education, skills, and competencies needed to enter the labor market. In the digital era, the younger generation must obtain a comprehensive education, especially in soft skills. Thus, the critical aspect is IT readiness. This concept is applied to assess IT infrastructure development in eastern Indonesia. Willingness to use IT in this research is seen from the use of a series of infrastructures as strategic media to support business activities, MSMEs business strategies and disaster mitigation so that Penta-helix contributors can also fully utilize ICT potential. In other words, IT readiness tries to see how much the Penta-helix contributor can gain strategic benefits through investment in the use of ICT to improve its ability to utilize ICT continuously.


 ,
, 


