1. Introduction
During the COVID-19 pandemic, the forced closure of workplaces since 2019 (including universities, where thousands of faculty staff and students meet regularly), were undeniable. Consequently, higher education methods have suddenly changed from on-site to remote learning, in order to avoid the spread of the coronavirus among people. Educators, especially in the sciences, have had the most frustrating experiences because they had to design remote learning lessons for theoretical and practical classes, aiming to achieve scientific learning outcomes. Laboratory practice is essential in chemistry education because graduates in chemistry need laboratory skills for their careers, i.e., the abilities to conduct experiments, analyze experimental data, and interpret the results.
Kelley has recently reviewed articles reporting the laboratory learning in chemistry and closely related disciplines during the COVID-19 pandemic [
1]. She aimed to determine the findings about the types of adjustments made to laboratory curricula and the immediate effect of these adjustments on students. The 91 reviewed articles illustrated the experiences of sudden transmission of teaching and learning methods from January 2020–June 2021 in a variety of institutions in and outside the US, e.g., Australia, Germany, Mexico, Slovakia, Spain, and the UK. Types of laboratory curricular adjustments that were diverted, for example, include (1) adapting experiments to be hands-on, at-home activities with household/school/commercial kit supplies, followed by some form of analysis (29.7%); (2) distributing procedures and non-interactive videos/pictures of experiments, from which students might or might not collect data themselves (50.5%); and (3) using digital simulations, models, augmented reality/virtual reality (AR/VR), games, or interactive videos, from which students might or might not collect simulated/real data themselves (45.1%). The findings evidenced that hands-on experience may improve technical performance (i.e., analyzing data, proposing a procedural step) but did not necessarily impact non-technical performance, such as writing a lab report and answering conceptual questions. Lower comprehension of data and procedures, as well as greater discomfort or poorer quality of interpretation, was found among students without hands-on experience compared with students assigned to perform the hands-on laboratory experiments. Moreover, students commented that performing hands-on work was more helpful for learning than remote alternative activities; however, doing hands-on experiments in a face-to-face laboratory was required. Therefore, to develop students’ technical skills efficiently during the closure of the university, chemistry education curricular adjustments with hands-on laboratories were undeniable.
The diversity of hands-on, at-home laboratories for chemistry and related fields, i.e., analytical chemistry, organic chemistry, inorganic chemistry, biochemistry, general chemistry, and chemical engineering, has been reported [
2,
3,
4,
5,
6,
7,
8,
9,
10]. Since we could not avoid using chemicals in the chemistry laboratory, the chemicals used in the designed hands-on, at-home laboratories must be safe for students and their family members as well as friendly to the environment, so that those chemicals could be discarded as household waste. Therefore, the chemicals used in those proposed laboratories were either kitchen chemicals or chemicals available at pharmacies that were disposable after use.
Analytical chemistry laboratories, especially for second-year-up undergraduate students, aim to encourage students to learn the principles of the analytical process, the steps for performing an analysis, i.e., (1) define the problem, (2) select an analytical method, (3) obtain a representative sample, (4) prepare the sample for the analysis, (5) perform any necessary separations, (6) perform the measurement, and (7) calculate the results and report [
11] the analytical characteristics, e.g., accuracy, precision, calibration graph, etc., as well as the principles of instrumental analysis, for example, colorimetry, advanced spectrophotometry, chromatography, and electrochemistry. To meet the learning outcomes in analytical chemistry during the closure of universities, the instructors of analytical chemistry subjects have to design hands-on laboratories that students could perform at home. It should, again, be emphasized that the chemicals used must be less toxic, or even non-toxic, and disposable as household waste. Nevertheless, in general, chemical analyses require chemical reagents to react with analytes, resulting in chemical reaction products that are detected using an analytical method. Thus, the hands-on analytical chemistry experiments for at-home laboratories have been challenging to design. Natural extracts are alternative environmentally friendly chemical reagents that were proposed for a variety of green chemical analyses [
12]. However, to date, only one article reported the use of natural extracts for hands-on, at-home analytical chemistry laboratories. Caraballo et al. proposed using natural extracts, i.e., curcumin and red cabbage extracts, as indicators for an acid-base equilibrium experiment, in which students would learn the main concepts of acid−base equilibrium, buffer capacity, and titration curves, as well as titrimetric analysis [
7]. However, the natural extracts they used were exploited as indicators and were indirectly involved in the main acid-base reactions.
Our previous work suggested that using the natural extracts from guava leaves as a reagent for colorimetric determination of iron worked successfully [
13]. The phenolic compounds in guava leaf extract played a spot role as the reagent binding to or chelating with iron ions (Fe(III)), resulting in a dark purple complex that could be detected colorimetrically. The use of guava leaf simple extract as the natural reagent for iron assay was developed further as a natural-reagent iron assay kit that was implemented in on-site analytical chemistry laboratories at six Thai universities [
14]. The dried and ground guava leaf powder was packed in a tea bag and sealed in an airtight opaque package that was convenient to use. Other nonhazardous reagents, i.e., Fe(III) stock standard solution and acetate/acetic acid buffer solution, both with mild concentrations, as well as the necessary equipment including a vial for extracting the natural reagent and a 96-well microplate as a reaction platform, were provided in the kit. Detecting the color complex, the product of the reaction could be performed using a smart device (a smartphone or a tablet) with a built-in camera. Since the intensity of the color of the product solution indicated the concentration of the Fe(III) ion, compared with a standard calibration graph, the photo of the reacted sample/standard solution was simply processed to obtain the color intensity using an image processing program on a computer or an application on a smart device. Therefore, the use of the natural-reagent iron assay kit is not only promising for hands-on, at-home laboratories but also for promoting sustainability in analytical chemistry education, supporting the Sustainable Development Goals (SDGs) identified by the United Nations (UN) in 2015, namely good health (SDG3), quality education (SDG4), reduced inequalities (SDG10), and responsible consumption and production (SDG12).
Herein, we present the development of a Lab-at-Home (LAH) box set, as the second article in the series to develop the natural-reagent iron assay kit based on Thai local wisdom, for new normal, analytical chemistry experimentation. This work aimed to design and implement the LAH for the remote learning of an analytical chemistry laboratory, i.e., colorimetry experiment, for foundation chemistry students at the Department of Chemistry, Faculty of Science, King Mongkut’s University of Technology Thonburi (KMUTT), Bangkok, Thailand. Students (group/individual) received the LAH box set about one week before the synchronous experiment class via Zoom, where the instructors and teaching assistants (TAs) were prompt to advise and answer questions. The student learning outcome achievements including the comprehension of analytical characteristics and colorimetry principles, as well as the ability to analyze statistical data, were evaluated using a post-lab quiz and laboratory report. The satisfaction of the LAH used for new normal, analytical chemistry experimentation was also assessed using questionnaires and focus group discussions.
2. Materials and Methods
2.1. LAH Box Set
The LAH box set was adapted from the natural-reagent iron assay kit that was implemented as a tool in an analytical chemistry experiment (determination of iron by colorimetric method) for undergraduate science students at six Thai universities, as reported previously [
14]. Non-toxic chemicals were provided in the LAH box set, similar to the iron assay kit. The guava leaf extract was used as a natural reagent for complexing with the Fe(III) ion. A series of working Fe(III) standard solutions with mild concentrations were provided. A weak acid in vinegar (acetic acid) was used to prepare the acetic/acetate buffer solution, also provided in the box set. A 96-well plate was exploited as a reaction platform. However, instead of the micropipet used in the previous assay kit for measuring the volumes of the solutions, disposable syringes were employed because they are low cost and more readily available in Thailand. In addition, a series of dye solutions were given to practice the calibration graph construction from the data obtained using a smart device camera, followed by processing with an image analyzing application/program.
Therefore, the LAH box set consisted of eight items (
Figure 1), i.e., (i) a sachet of Nat Pow Iron (guava leaf powder), (ii) vials containing Fe(III) standard solutions (with different concentrations) and a sample solution, (iii) a bottle of acetic/acetate buffer solution, (iv) vials containing dye solutions with various concentrations, (v) a glass bottle for extracting the natural reagent, (vi) a 96-well plate, (vii) a 10-mL disposable syringe, and (viii) 1-mL disposable syringes. To reduce the inequalities (supporting SDG10) and control the analytical parameters, the LAH box set with equal quantities and qualities of chemicals and materials was sent to all students.
2.2. The Design of the LAH Experiment
The LAH was especially designed to suit the foundation analytical chemistry experiment at the undergraduate level in Thailand. In general, the foundation course has a large number of students, for example, 800 students per course, in 20 sections (40 or more students/section) at the Department of Chemistry, Faculty of Science, KMUTT, with a tendency to have more students. A face-to-face on-site laboratory for the large foundation course would consume a large amount of chemicals and budget, require numerous laboratory facilities, and generate a significant amount of chemical waste. The LAH was created to reduce the number of people encountering COVID-19 during the pandemic, and also to address the challenges of large foundation courses using online synchronous experimentation allowing the experiment to be conducted conveniently and safely at a student’s residence. All students could conduct the experiment synchronously via a virtual meeting application/program such as Zoom, Microsoft Teams, and Google Meet, and/or a LINE broadcast, where the instructor and TAs were ready to give advice and answer questions. Moreover, other online tools, including Mentimeter, Microsoft Office, and Google Drive, were applied to share ideas and analytical data, facilitating rapid communication, data transmission, and traceability.
For colorimetry experiments, detecting the color intensity is, obviously, important. The LAH experiment used a built-in camera of a smart device (a smartphone/a tablet) as a detector. A photo of the solutions in the 96-well plate was taken as one shot. The intensity (Red-Green-Blue or RGB value) of the color of each solution was evaluated using an image processing application/program, i.e., Color Grab (Loomatix, Haifa, Israel) for Android or Pixel Picker for iOS.
In addition, the LAH was designed to encourage the learning of colorimetry principles and analytical characteristics as well as to practice statistical data analysis skills. The LAH employed the natural reagent because of its ease of use, safety, and waste management, in which the goals of green chemical analysis and sustainability were achieved.
2.3. Course Characteristics
The LAH experiment was implemented in an analytical chemistry experiment for undergraduate students in two sections at the Department of Chemistry, Faculty of Science, KMUTT, in the second semester of academic year 2020 (2nd/2020), from March to April 2021, and the first semester of academic year 2021 (1st/2021), from August to September 2021. Altogether, 38 and 65 students were enrolled in sections of the 2nd/2020 and 1st/2021 semesters, respectively. During the 2nd/2020 semester, classrooms and laboratories were closed due to the moderate level of COVID-19 pandemic in Thailand, but students were permitted to stay at the university dormitories for online remote learning. Furthermore, no more than five students were allowed to meet face-to-face. Thus, the students in sections during the 2nd/2020 semester were divided in ten groups (three to four students/group), and each group conducted the experiment at the dorms using one LAH box set. During the 1st/2021 semester, the university was closed due to the severity of the pandemic, forcing students to leave the dormitories and stay at home. In this latter case, students performed the experiment individually at home. It should be noted that the basic knowledge in chemistry of these two student groups was comparable. Both groups of students had completed previous chemistry courses (General Chemistry and General Chemistry Laboratory).
2.4. Teaching and Learning Method
The goal of the designed teaching and learning approach in this work was to limit the risk of COVID-19 infection and spread, and to solve the challenges of a large foundation course that could occur in the near future, as previously noted. As a result, the proposed method was designed for 100% remote foundation chemistry education, as well as achieving students’ learning outcomes.
The experiment employing the LAH was entitled “Determination of iron by modern green chemical analysis employing a natural reagent and with a smartphone”, with three objectives, requiring students to be able to (1) explain colorimetry principles and analytical characteristics, e.g., accuracy and precision, and apply the knowledge to perform quantitative analysis, (2) use a smart device for colorimetric detection and analytical data acquisition for chemical analysis, and (3) briefly describe the importance of the green analytical chemistry (GAC) and the benefits of the novel and modern green chemical analysis.
The experiment was divided in two parts: part 1—Determination of a dye solution concentration and part 2—Colorimetric determination of iron. Part 1 was designed for practicing color detection using a smart device, so that students would be familiar with the use of a smart device as an analytical detector as well as the concept of colorimetric detection, before performing the iron analysis. In part 2, students would learn how to perform colorimetric determination and the green analytical chemistry concept. Moreover, students would learn how to handle analytical data and assess analytical characteristics from both parts.
Figure 2 illustrates the stepwise method of the experiment. An online lab briefing session via Zoom was held two weeks before the experiment date to discuss the methods of the online class using a synchronous model, guidelines of the experimental data and report submission, to introduce the concept of the experiment and to discuss the GAC concept and principles related to this experiment. Then, one week before the day of the experiment, LAH box sets were sent to students at their home addresses and the group representative at his/her dormitory, in cases of individual and group assignments, respectively. Students were assigned to self-study the concept and experiment instructions and write up the experiment plan. Students were required to submit the experiment plan to the instructor via Google Drive at least five days before the experiment date, for the instructor’s approval.
On the experiment date, the students performed the experiment synchronously at their respective locations using Zoom, while instructors and TAs were available online to advise and answer questions as needed by the students. The students were required to activate the video mode on the device connected to Zoom to show their activities during the LAH experiment. The students engaged in a hands-on experiment at home. After the experiment, the analytical data were immediately submitted online via Google Doc/spreadsheet, whereas the experiment report submission due date was one week after the experiment. Finally, another synchronous session was conducted via Zoom to discuss the analytical results and the comprehension of colorimetry principles, analytical characteristics, and GAC principles, to take the post-lab quiz, and to evaluate the use of the LAH.
2.5. Experimental Procedures
The instruction of the experiment (see
Supplementary Material: File S1) was included in the LAH box set, so that students could self-study the procedure before the experiment date. The experiment was designed for two parts, with specific objectives as detailed in
Section 2.4.
Part 1—Determination of a dye solution concentration
Firstly, the given dye solutions with various known concentrations and a blind sample solution were dropped in designated positions of the 96-well plate (
Figure 3). Secondly, a photograph of the plate was taken using the lighting technique that students preferred or found convenient, and the color intensities of the solutions were evaluated using an application on a smart device. Finally, a calibration graph for each row (B, C, D, E, F, and G,
Figure 3) of the 96-well plate was constructed by plotting the color intensities against the concentrations of the dye standard solutions.
Supplementary Material: Video S1 shows a demonstration of determining the concentration of a dye solution. The colorimetric principle according to the RGB channel was applied. A proper color channel for the measurement was determined based on the slope and the correlation coefficient (R
2) of the calibration graph. The influence of the lighting conditions was discussed.
Part 2—Colorimetric determination of iron
The natural reagent containing polyphenolic compounds was, firstly, extracted from the provided guava leaf powder in a sachet (Nat Pow Iron (G)) by adding 60 mL hot (60–100 °C) clean water in the extraction bottle, already containing the sachet. Secondly, 9 mL of the extract was brought to the buffer bottle containing the buffer solution, and the natural reagent was obtained. Thirdly, the standard Fe(III) solutions, with a series of concentrations and some known concentration samples, were dropped in the 96-well plate at the designated wells (
Figure 3). The natural reagent was, fourthly, dropped into the standard and sample solutions. The dark-purple polyphenolic-Fe(III) complex was obtained with different color intensities, proportional to the amount of Fe(III). Finally, for each row, the color intensity against the concentration of Fe(III) was plotted as a calibration graph. The Fe(III) concentrations in the samples were evaluated using the calibration graph.
Supplementary Material: Video S2 shows a demonstration of colorimetric determination of iron. Some parameters affecting the analytical results were discussed.
2.6. Evaluation and Statistical Analysis of Student Outcomes
Post-lab quizzes as well as lab report scores were used to evaluate the student learning outcome achievements including comprehending the analytical characteristics and colorimetry principles, and the ability to perform statistical data analysis. The LAH experiment used for remote learning was evaluated using a satisfaction survey with a 5-point Likert scale (1 = least satisfied, 2 = less satisfied, 3 = moderately satisfied, 4 = very satisfied, 5 = most satisfied) and focus group discussion. The student learning outcome achievements and satisfaction with the LAH experiment evaluated by students assigned to perform the experiment as a group (see
Supplementary Material: Video S3) were compared with those assigned individually (see
Supplementary Material: Video S4) to perform the experiment, using independent
t-test, with a
p < 0.05 as significant difference. Bonferroni correction was used to adjust the p-value because of multiple comparisons (10 correlations). The significance level or the
p-value (0.05) was then adjusted to 0.05/10 = 0.005.
3. Results and Discussion
The LAH was designed for large foundation chemistry courses with a large number of students, such as the General Chemistry course at KMUTT, which has approximately 800 students/semester. In this work, the LAH was introduced to sessions for feasibility planning. Students performed the experimentation individually or in groups at their location using the LAH under the guidance of the instructor and/or TAs. This led to quality education (SDG4) and reduced inequalities (SDG10). The students were able to practice analytical chemistry skills using a hands-on experiment during the COVID-19 pandemic, and they were able to experience green chemistry practice.
3.1. Design of LAH Box Set
The LAH design changed some equipment of the natural-reagent iron assay kit, as reported previously [
14]. The reagents/materials provided in the LAH box set were safe for users and the environment, as well as readily available locally, not only for economic reasons, but also for the convenience of the box set preparation. The equipment in the LAH box was lower cost and more readily available in stores/pharmacies, such as disposable syringes to measure the volume of solution, instead of using an autopipet, and a glass bottle to extract the natural reagent that could be reused. The reagents used to determine Fe(III) were the same as those used in the previous study. The dye solutions with a series of concentrations, including blind concentration, were included in the newly designed LAH to determine dye concentration. Students could thus practice using their smart devices to take photographs of the solutions in the well plate and evaluate the color intensity of solutions. The LAH box cost only 200 THB (6 USD) per set (110 THB (3.3 USD) for reusable equipment and 90 THB (2.7 USD) for chemicals and reagents). In addition, the LAH was the first green chemical analysis tool, especially for chemistry laboratory, in Thailand that could be easily and safely performed at home because the reagent was extracted from guava leaves, nonhazardous chemicals were down-scaled, the waste was easily eliminated and was deemed environmentally friendly.
3.2. Learning Process
The learning process planned for the LAH experiment began with an online laboratory briefing session using Zoom, followed by a hands-on experiment using the LAH box set, and finally, an online discussion session. Students received the LAH box set with the laboratory instruction so that they studied the concept and procedure before the online briefing session. On the experiment date, they streamed themselves using Zoom while performing the experiment alongside their friends, while the instructor and TAs observed and were available for advising and answering questions (see
Supplementary Materials: Videos S3 and S4). In this way, students felt relieved that they could ask the instructor or TAs for help whenever they needed it, as one student commented: “When we had a serious issue, we could turn on the microphone and ask the instructor. I didn’t feel nervous or anxious at all.” Since Thai students are typically hesitant to criticize and express their opinions, prior-normal experimentation included a discussion session to encourage them. When transforming to new-normal experimentation, the synchronous session could not be neglected. The results showed that in the online discussion session, students shared and exchanged their opinions with friends and the instructor. Critical thinking skills could be improved in this session, as one student stated: “Sharing mistakes and exchanging ideas with friends helped us understand more and gain a broader perspective.” The proposed learning process could be applied in the future to large foundation chemistry courses, which may not have sufficient laboratory space for 800 students. Although the proposed process used synchronous sessions to support the development of Thai students’ learning skills, asynchronous virtual laboratories could be used in some cases, such as when students were mature and/or had sufficient learning skills.
3.3. LAH Experimentation
The analytical chemistry experimentation using the LAH as a tool was divided in two parts. Part 1 determined the dye solution concentration using modern green chemical analysis and a smart device. The concept of colorimetric determination, as well as analytical data analysis, was introduced. Students practiced taking photos of the solutions in the 96-well plate using the camera of a smart device and evaluating the RGB color intensities of the solutions by an image processing application. From the focus group discussion, students were impressed using a smart device with an image processing application for analytical data processing and judged it promising for future chemical analysis due to its simplicity. The effects of the color channel on the color intensity evaluation and the lighting condition were studied. Finally, students plotted the calibration graph and determined the analytical characteristics, including accuracy and precision.
3.3.1. RGB Color Intensities
TechTerms.com (accessed on 10 January 2022) defined that “the RGB refers to three hues of light that can be mixed together to create different colors [
15]. Combining red, green, and blue light is the standard method of producing color images on screens, such as TVs, computer monitors, and smartphone screens.” Levels of R, G, and B can each range from 0% to 100% of full intensity. Each level is represented by the range of decimal numbers from 0 to 255 (256 levels for each color) [
16]. The RGB level of the photograph of the solution was determined by Color Grab for Android and Pixel Picker for iOS systems.
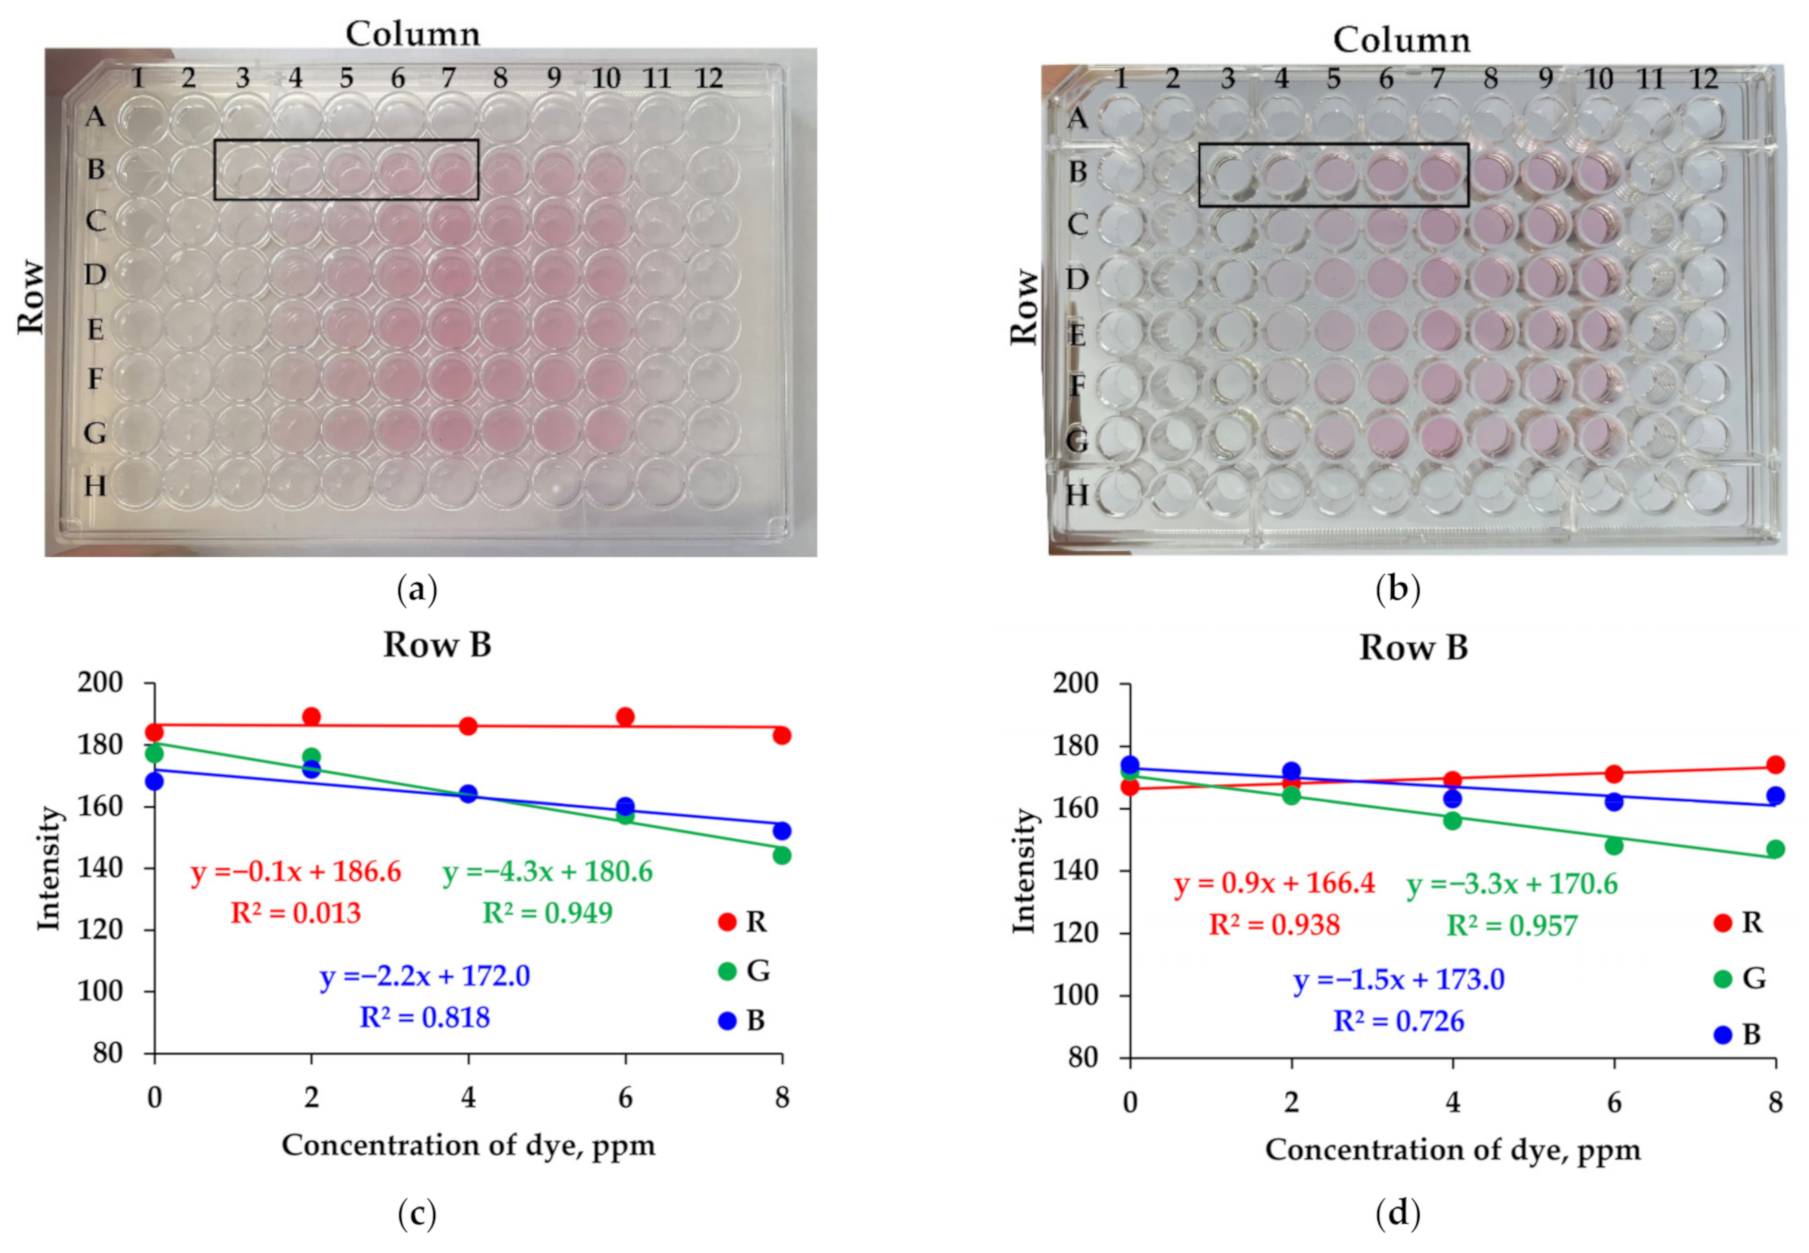
Figure 4a,b illustrate the examples of the images taken under two different lights. One was taken in a student’s room with a fluorescent bulb (
Figure 4a), while the other was taken in a room with a white-light LED lamp (
Figure 4b). Students read the R, G, and B levels of the solutions in the assigned wells and constructed the calibration graphs, plotting the intensity of each color against the concentration of dye solutions.
Figure 4c,d illustrate the examples of the calibration graphs using the R, G, and B levels of standard dye solutions at positions B3 to B7.
According to the sensitivity (the slope of the graph), the linearity (the correlation coefficient, R
2), and the accuracy and precision of the determination, students chose the suitable light color (R, G, or B) for further study. For instance, from
Figure 4c under the fluorescent lamp, the sensitivity obtained by plotting the green light intensity (y = −4.3x + 180.6) was higher than that obtained by plotting the blue (y = −2.2x + 172.0) and red (y = −0.1x + 186.6) light intensity, respectively.
Due to the wide use of standard RGB (sRGB) in, for example, digital photography, graphics, multimedia, and Internet imaging, the image is probably encoded in sRGB colors. The JPEG image that the students took using their smart device camera was opened with ImageJ or Java. The pixel values in the resulting data array were R, G, and B components [
17]. As mentioned earlier, R, G, and B have integer values from 0 to 255. The different shades of pink have specific integer values of R, G, and B. For example, the RGB integer values for pink, light pink, and hot pink are RGB(255,192,203), RBG(255,182,193), and RGB(255,105,180), respectively [
18]. Notably, the integer value of R is 255 for all shades of pink. This could explain the lower slope of the calibration graph obtained by plotting the red intensity. The highest linearity was found when the green light intensity was applied. Interestingly, the highest slope of the calibration graph obtained by plotting the green intensity could have resulted from the largest difference of the G values. Similar findings were obtained under the white-light LED lamp (
Figure 4d). In this case, the calibration graph using the green light intensity was selected.
3.3.2. The Effect of the Light Condition
Each student or group used a different light condition depending on their preference or convenience. Some examples of light sources were white-light LED lamp, fluorescent lamp, and the sun (resulting in natural light). To discuss the effect of the light condition, students shared their results during the online discussion session, and compared the accuracy and precision of the determination using the calibration graph of the green light intensity from each row of well plates and dye concentrations. Altogether, 10 groups and 65 individual students, each with six calibration graphs from six rows in the well plate, yielded 450 calibration graphs. However, 130 calibration graphs were not linear due to the effect of the light. Consequently, the concentration range of dye in the blind sample was 1 to 8 ppm (true value = 5 ppm), with the average and standard deviation (SD) of 5 and 2 ppm (n = 320), respectively. The overall precision of the determination was low (%RSD = 36). The comparison indicated that the colorimetric determination using a smart device as a detector had been greatly influenced by the light condition. In theory, the sRGB was developed with the goal of creating a precisely specified color space for computer-based and display-oriented applications. This means that precise specifications of factors, such as the white reference point and the ambient lighting conditions, are important [
3]. From the results, students would be aware that light condition affects the precision and accuracy of the color intensity when performing the colorimetric determination using a smart device as a detector in the future.
Aside from the light condition effect, the small size of the wells on the reaction plate was another cause of non-linear calibration graphs. When dropping solutions, a student said they had trouble finding the assigned wells on the plate, resulting in the solutions being dropped in the wrong order. Students had to focus intensely on the experiment. However, working from home could involve interruptions by family members and household pets; one student mentioned that their grandmother was so concerned for their safety that she came to see them frequently. These constraints should be kept in mind for future work.
3.3.3. Colorimetric Determination of Iron
In part 2 of the experiment, the dark purple polyphenolic-Fe(III) complex was obtained as the product of the chemical reaction. Its intensity depends on the concentration of Fe(III) ion. Higher Fe(III) concentrations produce higher color intensities.
Figure 5 illustrates the examples of images of the polyphenolic-Fe(III) complex solutions in the well plate under different lights and calibration graphs plotting the green color intensity against the Fe(III) concentration. The concentration of Fe(III) in the blind sample in each row was determined using a calibration graph of the same row. For example, the Fe(III) concentration of the sample at positions B8 to B10 was determined using the calibration graph plotting the color intensities of the standards at the position B3–B7. Unsurprisingly, the Fe(III) concentration was strongly affected by light condition during the photographing. Altogether, 127 nonlinear calibration graphs resulted in 323 linear calibration graphs determine Fe(III) concentration. The range of Fe(III) concentration determined by the students was 1 to 8 ppm (n = 323), with an average, SD, and %RSD of 5 ppm, 2 ppm, and 38%, respectively. The students again noticed the influence of light condition and RGB colors on colorimetric determination. They learned the principles of colorimetry as well as analytical characteristics. Students’ comprehension was assessed by quiz scores and lab reports.
3.4. Learning Outcome Achievement
At the end of the experiment, students submitted the raw analytical data, calibration graphs, and concentrations of the dye and Fe(III) in blind samples using Google Drive. The students then worked in groups of three to four students to write the lab report. The report must be submitted using Google Drive within one week after the experiment. Students took the post-lab quiz in the online discussion session using Zoom (Zoom Video Communications, Inc., San Jose, USA). To evaluate the learning outcome achievements, the post-lab quiz assessed for the student’s comprehension of colorimetry principles, analytical characteristics, statistical analysis of the analytical data, and the green analytical chemistry concept.
3.4.1. Post-Lab Quiz Scores
The average post-lab quiz scores of students who conducted the LAH experiment individually and in groups were 7.00 ± 1.54 (n = 65) and 6.68 ± 1.12 (n = 38), respectively, out of 10 points. The difference between the scores of students who performed the LAH experiment individually and in groups was without statistical significance (
p = 0.951). When these scores were compared with those of students performing the colorimetry experiment at the university in the first semester of 2019 (August to November 2019), before the COVID-19 pandemic (6.18 ± 1.68 points, n = 79), the average score of students performing the LAH experiment in groups did not significantly differ (
p = 0.283). However, the average score of students performing the LAH individually was significantly higher (
p = 0.005). Notably, before the COVID-19 pandemic, students performed the colorimetry experiment in groups. This suggested that individual rather than group work could be used to improve student comprehension. It contrasted with the findings reported by Rawas et al. (2020), that the group-based activities resulted in better test scores compared with the design comprising individual activities for face-to-face flipped classroom [
19]. However, results agreed with studies by Achuthan et al. (2021), reporting that providing and enabling a learning environment promoting effective individualized learning and comprehension of experimental concepts and skills could improve educational outcomes in remote laboratories [
20].
3.4.2. Lab Report Scores
To write a lab report, students worked in groups of three to four, discussing the experiment method, evaluating the analytical results, and drawing conclusions. Thus, the number of reports composed by students who performed the experiment individually (65 students) and in groups (38 students) was 18 and 10, respectively. The lab report was used to assess (1) the understanding of the influences of the RGB color and lighting conditions as a result of using a smart device as a colorimetry detector, (2) the ability in applying colorimetry principles to determine dye and Fe(III) concentrations, and (3) the ability to apply the statistical data analysis principle to explain the analytical results. Overall report scores of the students using the LAH individually (23.33 ± 2.39 points, n = 18) and the students who performed the colorimetry experiment at the university before the COVID-19 pandemic (23.53 ± 2.24 points, n = 20) were significantly higher than those of the students who conducted the LAH experiment in groups (20.00 ± 2.22 points, n = 10) with
p = 0.01 and < 0.001, respectively. It showed that individualized laboratory practice was just as effective as face-to-face laboratory practice. This was consistent with the studies of Rawas et al. [
19] and Achuthan et al. [
20], above.
The scores of students performing the LAH experiment individually were compared with those in groups for each learning outcome achievement (
Table 1). Students who worked individually and in groups received similar scores, without any statistically significant difference, for their understanding of the influences of the RGB color and lighting conditions, as well as the ability in applying colorimetry principles to determine dye and Fe(III) concentrations. Unexpectedly, students who performed the experiment individually had statistically higher scores for their ability in applying the statistical data analysis principle to explain the analytical results than those who performed the experiment in groups although their basic knowledge of chemistry was likely comparable. To statistically analyze the chemical analysis data, students in groups had to collaborate with peers having different learning styles. The university’s semi-closure due to the COVID-19 pandemic during the second semester of academic year 2020 (March–April 2021) resulted in fewer student meetings and fewer face-to-face activities and, therefore, a lack of social and collaborative skill development for students. Moreover, in a report on the importance of group work in mathematics, Koçak et al. (2009) discovered that the efficiency of group work increases with the intensity of the communication that is established among the group members, which is free of teacher-centered studies. The group work that is carried out through a planned and programmed activity and healthy communication among group members are the most important factors. When students are not directed toward a goal, and without planning in place, group work will be nonbeneficial [
21].
3.5. Evaluation of Using the LAH for the Analytical Chemistry Experiment
The use of the LAH for the analytical chemistry experiment, i.e., colorimetric determination of Fe(III), was evaluated using a satisfaction survey. Students using the LAH both individually and in groups for the experimentation were asked to rate the satisfaction level of ten issues, using a Likert scale from 1 to 5 (1 = least satisfied, 2 = less satisfied, 3 = moderately satisfied, 4 = very satisfied, 5 = most satisfied). In general, both groups of students were very satisfied with the use of the LAH in all aspects, as shown in
Figure 6, with satisfaction scores greater than 3.80. The satisfaction levels rated by students who experimented individually were slightly higher than those rated by students who experimented in groups. When a statistical independent t-test with Bonferroni correction was applied, it was found that the satisfaction scores in five aspects, namely items 2, 3, 4, 6, and 7, rated by students experimenting individually were significantly higher than those by students experimenting in groups (
p < 0.005), details as shown in
Table 2. For the other aspects, namely items 1, 5, 8, 9, and 10, there were trends showing the higher scores among individual experimenting than experimenting in groups were without statistical significance (
p > 0.005). A student performed the experiment individually expressed her impression that “I enjoy that I can practice working alone because in the future, when I finish my undergraduate degree and go to work, I won’t have anyone to assist me with my work”.
The overall satisfaction levels rated by the individual and group experiments were 4.35 ± 0.80 and 3.95 ± 0.87, respectively, meaning very satisfied. Many expressed, for example, “I’ve never had any experience like this before. This LAH could be the first of its kind in the world.” and, “Because we see what happens, the hands-on experiment allows us to gain a deeper understanding of concepts. Unlike watching a demonstrated experiment, real-world experience leads to long-term memories.” indicating students’ impressions of the LAH.
Comparing the issues, students were most satisfied with the harmlessness of chemicals in the LAH, exhibiting satisfaction levels of 4.80 ± 0.40 and 4.45 ± 0.50 rated by students working individually and in groups, respectively. A student commented during the focus group discussion, “I was worried about the hazards of chemicals because the elderly and children were residing in the house, and my mother had a congenital disease. After reading the instructions and hearing from the instructor during the online lab briefing session, I discovered that the reagents were safe because one was guava leaf extract and the two others were a kitchen ingredient (vinegar) and a mineral (iron) at much diluted concentrations. So, I was relieved. My mother was also concerned when the LAH box set arrived, wondering if it would cause any harm. I explained that the material was made from guava leaves and that the chemicals used were extremely low in concentration, even lower than the vinegar we used at home. My mother understood and agreed to let me conduct the experiment at home.” Students were impressed not only with the use of non-hazardous chemicals, such as acetic acid, which is less concentrated than the vinegar used in the kitchen, and a natural reagent extracted from guava leaves, but also with the ease of the non-hazardous chemical waste disposal. Moreover, the equipment and containers were reusable. This encouraged students to apply the green analytical chemistry concept in their future work and also supported SDG12 (responsible consumption and production), which is concerned with responsible use of natural resources to avoid harmful effects to the environment.
On the other hand, the least satisfactory issue for the students performing the LAH experiment individually was the interests in online analytical data and report submission (4.23 ± 0.70), whereas for the students performing the LAH experiment in groups, the least satisfactory issue was the ease of selecting a location for the experiment (3.82 ± 0.90). For students working individually, the low satisfaction score of those interested in online submissions could be due to issues with internet connection at their location. Some students reported that their Zoom connection was frequently lost due to a poor Internet signal. Students performing group work had to find one location in the university with sufficient space for experimentation and where the group members could meet easily. As a result, they may have experienced difficulty doing so. However, using LAH for analytical chemistry practice, either individually or in groups, could help develop the expected learning outcomes of the experiment.
3.6. Sustainability
This work has developed a hands-on analytical chemistry experiment that students in higher education could easily and safely conduct at their home on their own. Using locally available equipment/materials in the LAH box set has somehow ensured equal access for all foundation chemistry students to affordable, supporting inclusive and equitable education. The results also showed that students could develop an understanding of the principle of colorimetry, as well as analytical chemistry skills. It indicated that the LAH ensured quality education. The high scores of the laboratory reports showed that students’ lifelong learning skills, such as problem solving, critical thinking, communication, and collaboration, were improved. Thus, the LAH supports sustainable development in quality education (SDG4) to “ensure inclusive and equitable quality education and promote life-long learning opportunities for all” and, particularly, Target 4.3 that states “by 2030, ensure equal access for all women and men to affordable and quality technical, vocational and tertiary education, including university.”
Analytical chemistry laboratories typically require accurate and precise equipment/instruments, which are relatively expensive. Some Thai universities may be unable to provide sufficient and efficient equipment/instruments, limiting students’ opportunities to gain real-world experience with them and practice good chemistry skills. The inexpensive LAH box set means that Thai universities could probably afford to provide each student with one set of the LAH for self-learning anywhere, including in a foundation course having a large number of students, which would help to reduce educational inequalities in Thailand and elsewhere. As a result, Thai universities could be one of the country’s mechanisms for ensuring equal opportunity and reducing outcomes inequalities (Target 10.3 of SDG10—Ensure equal opportunity and reduce inequalities of outcome, including by eliminating discriminatory laws, policies, and practices and promoting appropriate legislation, policies, and action in this regard).
Nevertheless, the impacts of the LAH use on human health and the environment were the primary factors that we considered as we designed the experimentation. All the chemicals in the box set must be safe for students and their family. The waste must be easily managed and environmentally friendly. The coloring reagent is most important in colorimetry and is required in high amount. Thus, a nonhazardous natural extract of guava leaves was used as the coloring reagent in the determination of iron. The other chemicals provided in the LAH box set were also nonhazardous. The diluted acetate buffer for controlling the pH of solutions could be prepared from kitchen vinegar and its salt. Fe(III), which is one of the naturally occurring elements and required for plants [
22], was prepared as the standard solutions at relatively low concentrations. The dye used for part 1 in the experiment was food grade. The LAH use, therefore, encourages students and faculty to aware of the GAC concept and supports SDG12, Target 12.2—by 2030, achieve the sustainable management and efficient use of natural resources, and Target 12.4—by 2020, achieve the environmentally sound management of chemicals and all wastes throughout their life cycle, in accordance with agreed international frameworks, and significantly reduce their release to air, water, and soil in order to minimize their adverse impacts on human health and the environment.
Sustainability, defined by the United Nations Brundtland Commission in 1987 [
23] as “meeting the needs of the present without compromising the ability of future generations to meet their own needs”, could be developed incrementally by all of us. Since we are chemists and educators, we have developed a tool that would meet the needs of chemistry in the present while also encouraging future generations to meet their own.
4. Conclusions
Not only was the university closed during the continuous COVID-19 pandemic, but also a large number of the students in the foundation chemistry course in Thailand stimulated us to develop LAH experimentation. The LAH box set adapted the natural reagent iron assay kit, reported in our previous work, aiming to increase the local availability and reduce the cost of the materials. Thus, the university could produce sufficient LAH box sets for large numbers of students. It supported quality education (SDG4) and reduced inequalities (SDG10). The LAH reagents and materials were nonhazardous, making it safe to perform the experiment at home and also support responsible consumption and production (SDG12). The method of the LAH was so simple that students could perform the experiment by themselves, in this case under the supervision of the instructor/TAs. However, a poor Internet connection might constitute a constraint of the synchronous online sessions, in which case asynchronous sessions could be used instead. When using a smart device as a colorimetric detector, students should be aware of the effects of the color channels for color intensity evaluation and light conditions for photographing. With the proposed LAH hands-on experimentation, the students’ learning outcomes for the colorimetric determination of Fe(III) experiment, i.e., students’ comprehension of colorimetry principles, chemistry principles involving determining Fe(III) concentration, analytical characteristics, statistical analysis of the analytical data, and the green analytical chemistry concept, could be successfully achieved. Although students experimenting individually rated higher satisfaction scores than those experimenting in groups, both were very satisfied with using the LAH in all ten aspects.


 ,
, 


