Article

Enhanced Sonocatalytic Performance of Non-Metal Graphitic Carbon Nitride (g-C3N4)/Coconut Shell Husk Derived-Carbon Composite

1
Department of Chemical Engineering, Lee Kong Chian Faculty of Engineering and Science, Universiti Tunku Abdul Rahman, Kajang 43000, Malaysia
2
Centre for Photonics and Advanced Materials Research, Universiti Tunku Abdul Rahman, Kajang 43000, Malaysia
*
Author to whom correspondence should be addressed.
Sustainability 2022, 14(6), 3244; https://doi.org/10.3390/su14063244
Submission received: 26 December 2021 / Revised: 22 February 2022 / Accepted: 25 February 2022 / Published: 10 March 2022
(This article belongs to the Special Issue Energy Development for Sustainability)

Abstract

:
This study focused on the modification of graphitic carbon nitride (g-C3N4) using carbon which was obtained from the pyrolysis of coconut shell husk. The sonocatalytic performance of the synthesized samples was then studied through the degradation of malachite green. In this work, pure g-C3N4, pure carbon and carbon/g-C3N4 composites (C/g-C3N4) at different weight percentages were prepared and characterized by using XRD, SEM-EDX, FTIR, TGA and surface analysis. The effect of carbon amount in the C/g-C3N4 composites on the sonocatalytic performance was studied and 10 wt% C/g-C3N4 showed the best catalytic activity. The optimization study was conducted by using response surface methodology (RSM) with a central composite design (CCD) model. Three experimental parameters were selected in RSM including initial dye concentration (20 to 25 ppm), initial catalyst loading (0.3 to 0.5 g/L), and solution pH (4 to 8). The model obtained was found to be significant and reliable with R2 value (0.9862) close to unity. The degradation efficiency of malachite green was optimized at 97.11% under the conditions with initial dye concentration = 20 ppm, initial catalyst loading = 0.5 g/L, solution pH = 8 after 10 min. The reusability study revealed the high stability of 10 wt% C/g-C3N4 as sonocatalyst. In short, 10 wt% C/g-C3N4 has a high potential for industrial application since it is cost effective, reusable, sustainable, and provides good sonocatalytic performance.

1. Introduction

Malaysia is a developing country that is currently experiencing economic growth with a rapid transition to an urban and industrialized society. This change has created various environmental problems including water pollution caused by the increase in the discharge of wastewater in Malaysia [1]. Water contamination may affect the welfare of all living things, including humans, and the economy of the country. Water pollution also impacts greatly the sustainability of water resources [2,3]. This implies that the discharge of untreated wastewater is a major challenge which must be monitored strictly in order to establish sustainable development.
With the growth in population, water demand will rise along with the discharge of municipal wastewater. However, the clean water supply for domestic purposes will be limited with the increasing number of polluted rivers in Malaysia. Therefore, water scarcity is going to be a major problem in Malaysia for coming years. The discharge of dye effluent from industry is one of the root causes of water pollution. Organic or synthetic dyes may display noticeable color in the water body even at low concentrations. The presence of dye molecules in water will block the penetration of sunlight which suppresses photosynthesis activities of aquatic plants. This will in turn cause the DO level in the river to decrease and harm the ecosystem [4]. Dyes are carcinogenic and highly toxic which will give rise to health and environmental problems. Living things that consume water from these polluted sources will have an increased risk of cancer while the toxic property of dyes will endanger human health and even animals [5].
With the world transforming towards more sustainable technology, sonocatalytic technology is in the limelight in wastewater treatment due to being environmentally friendly and highly efficient in the degradation of organic pollutants by producing enormous amounts of reactive oxygen species [6,7]. The common semiconductor used for this treatment method is titanium dioxide (TiO2). However, TiO2 has disadvantages of a wide band gap energy that results in unsatisfactory catalytic performance [8]. Since the main focus of treating the wastewater is to overcome water pollution, a metal-free semiconductor is proposed in this research. g-C3N4 is a metal-free sonocatalyst that was discovered recently [9]. With it being metal-free, g-C3N4 will be more cost effective than TiO2 due to the abundance and renewability of raw materials [10]. The main drawback of g-C3N4 is the high recombination rate of photo-induced carriers, which can be countered by incorporating carbon materials [11].
To the best of our knowledge, there is no work reported on the modification of g-C3N4 using carbon materials derived from coconut shell husk. The conversion of unwanted husks into a value-added carbon material can extend the life cycle of biomass waste. Thus, this research focused on the synthesis of g-C3N4 incorporated by carbon material that was obtained from coconut shell husks. In this work, a sonocatalytic technique was also proposed to remove organic pollutants from wastewater using the synthesized g-C3N4 composites. The generation of g-C3N4 doped with carbon derived from coconut shell husk fulfilled the principles of green chemistry including waste prevention, designation for catalytic degradation as well as utilization of less hazardous and renewable raw materials.

2. Materials and Methods

2.1. Materials

Urea (CH4N2O, purity ≥ 99%, CAS-No. 57-13-6), sodium hydroxide pellets (NaOH, 99% purity, CAS-No. 1310-73-2), and malachite green (99% purity, CAS-No. 2437-29-8) were obtained from R&M Chemicals, Malaysia. Hydrochloric Acid (HCl, 37% purity, CAS-No. 7647-01-0) was obtained from Sigma-Aldrich, United States while hydrogen peroxide (H2O2, 30% purity, CAS-No. 7722-84-1) was obtained from SYSTERM, Malaysia. Deionised water was used throughout the study.

2.2. Preparation of Pure Carbon, Pure g-C3N4, and Carbon Composited with g-C3N4

To synthesis carbon material, the coconut shell husk was firstly dried for 2 days at 70 °C to remove the moisture of the husk. The dried husk was then carbonized through pyrolysis at 750 °C for 1 h. The resulting samples were crushed into powder form by using a mortar and pestle. For the preparation of pure g-C3N4, 5 g of urea was placed in an open crucible and heated in a carbolite furnace at 500 °C for 2 h. The resulting g-C3N4 sample was then ground into fine powder. These steps were repeated to synthesize C/g-C3N4 composites. The C/g-C3N4 composites at different weight percentages were prepared by adding a 0.05 g, 0.25 g, 0.5 g, 0.75 g, 1.00 g and 1.25 g of carbon in the urea to obtain 1 wt% C/g-C3N4, 5 wt% C/g-C3N4, 10 wt% C/g-C3N4, 15 wt% C/g-C3N4, 20 wt% C/g-C3N4, and 25 wt% C/g-C3N4, respectively.

2.3. Sample Characterization

Several pieces of equipment were used to characterize the synthesized samples. Characterization is an important step in studying the structure of the catalyst surface, composition of the catalyst, and chemical properties of the catalyst. The characterization of the catalyst could provide the explanation for its catalytic activity. The analysis techniques applied in this research involved X-ray diffraction analysis (XRD), scanning electron microscopy–energy dispersive X-ray (SEM-EDX), Fourier-transform infrared spectroscopy (FTIR), surface analysis and thermogravimetric analysis (TGA). XRD provided information on the crystalline structure and gave an estimation for the crystallite size. The characterization of the samples was carried out by means of Shidmazu Model XRD-6000 (Japan) using Cu-Kα radiation. The X-ray tube was set to the applied current of 25 mA and voltage of 45 kV. The prepared samples were scanned at 2θ starting from 10° and ending at 60°.
SEM-EDX was conducted using the Hitachi S-3400N (Japan). The morphological information of samples could be obtained through SEM. The addition of EDX gave results on the relative abundance of elements present on the surface of the sample. The scanning voltage was set at 5.0 kV. FTIR could provide identification on the functional groups present by detecting the bonding between atoms. The characteristic peaks displayed in the graph were due to specific chemical bonding. In this work, FTIR was carried out using Nicolet Model IS10 from Thermo Scientific (Waltham, MA, USA). Surface analysis was carried out in this study to determine the surface area and porosity of samples using Micromeritics 3Flex (USA). In addition, the thermal stability of the synthesized sample was studied through TGA using Perkin Elmer STA 8000 (USA).

2.4. Sonocatalytic Degradation of Organic Dyes and Analysis of Liquid Samples

Typically, 0.3 g/L of catalyst was added to a beaker containing 100 mL of 15 ppm malachite green aqueous solution. Ultrasonic irradiation was achieved by means of a Hielscher UP400S (Germany) ultrasonic processor, which was operated at an effective output power of 80 W. The treated liquid sample was collected after 10 min of ultrasonic irradiation. The dye solution was separated from the catalyst by using a syringe filter and the residual concentration of malachite green was determined using a UV–Vis spectrophotometer (model CARY 100 from Agilent, Santa Clara, CA, USA). The measurement of maximum absorbance was performed at 617 nm.

3. Results and Discussion

3.1. Sample Characterization
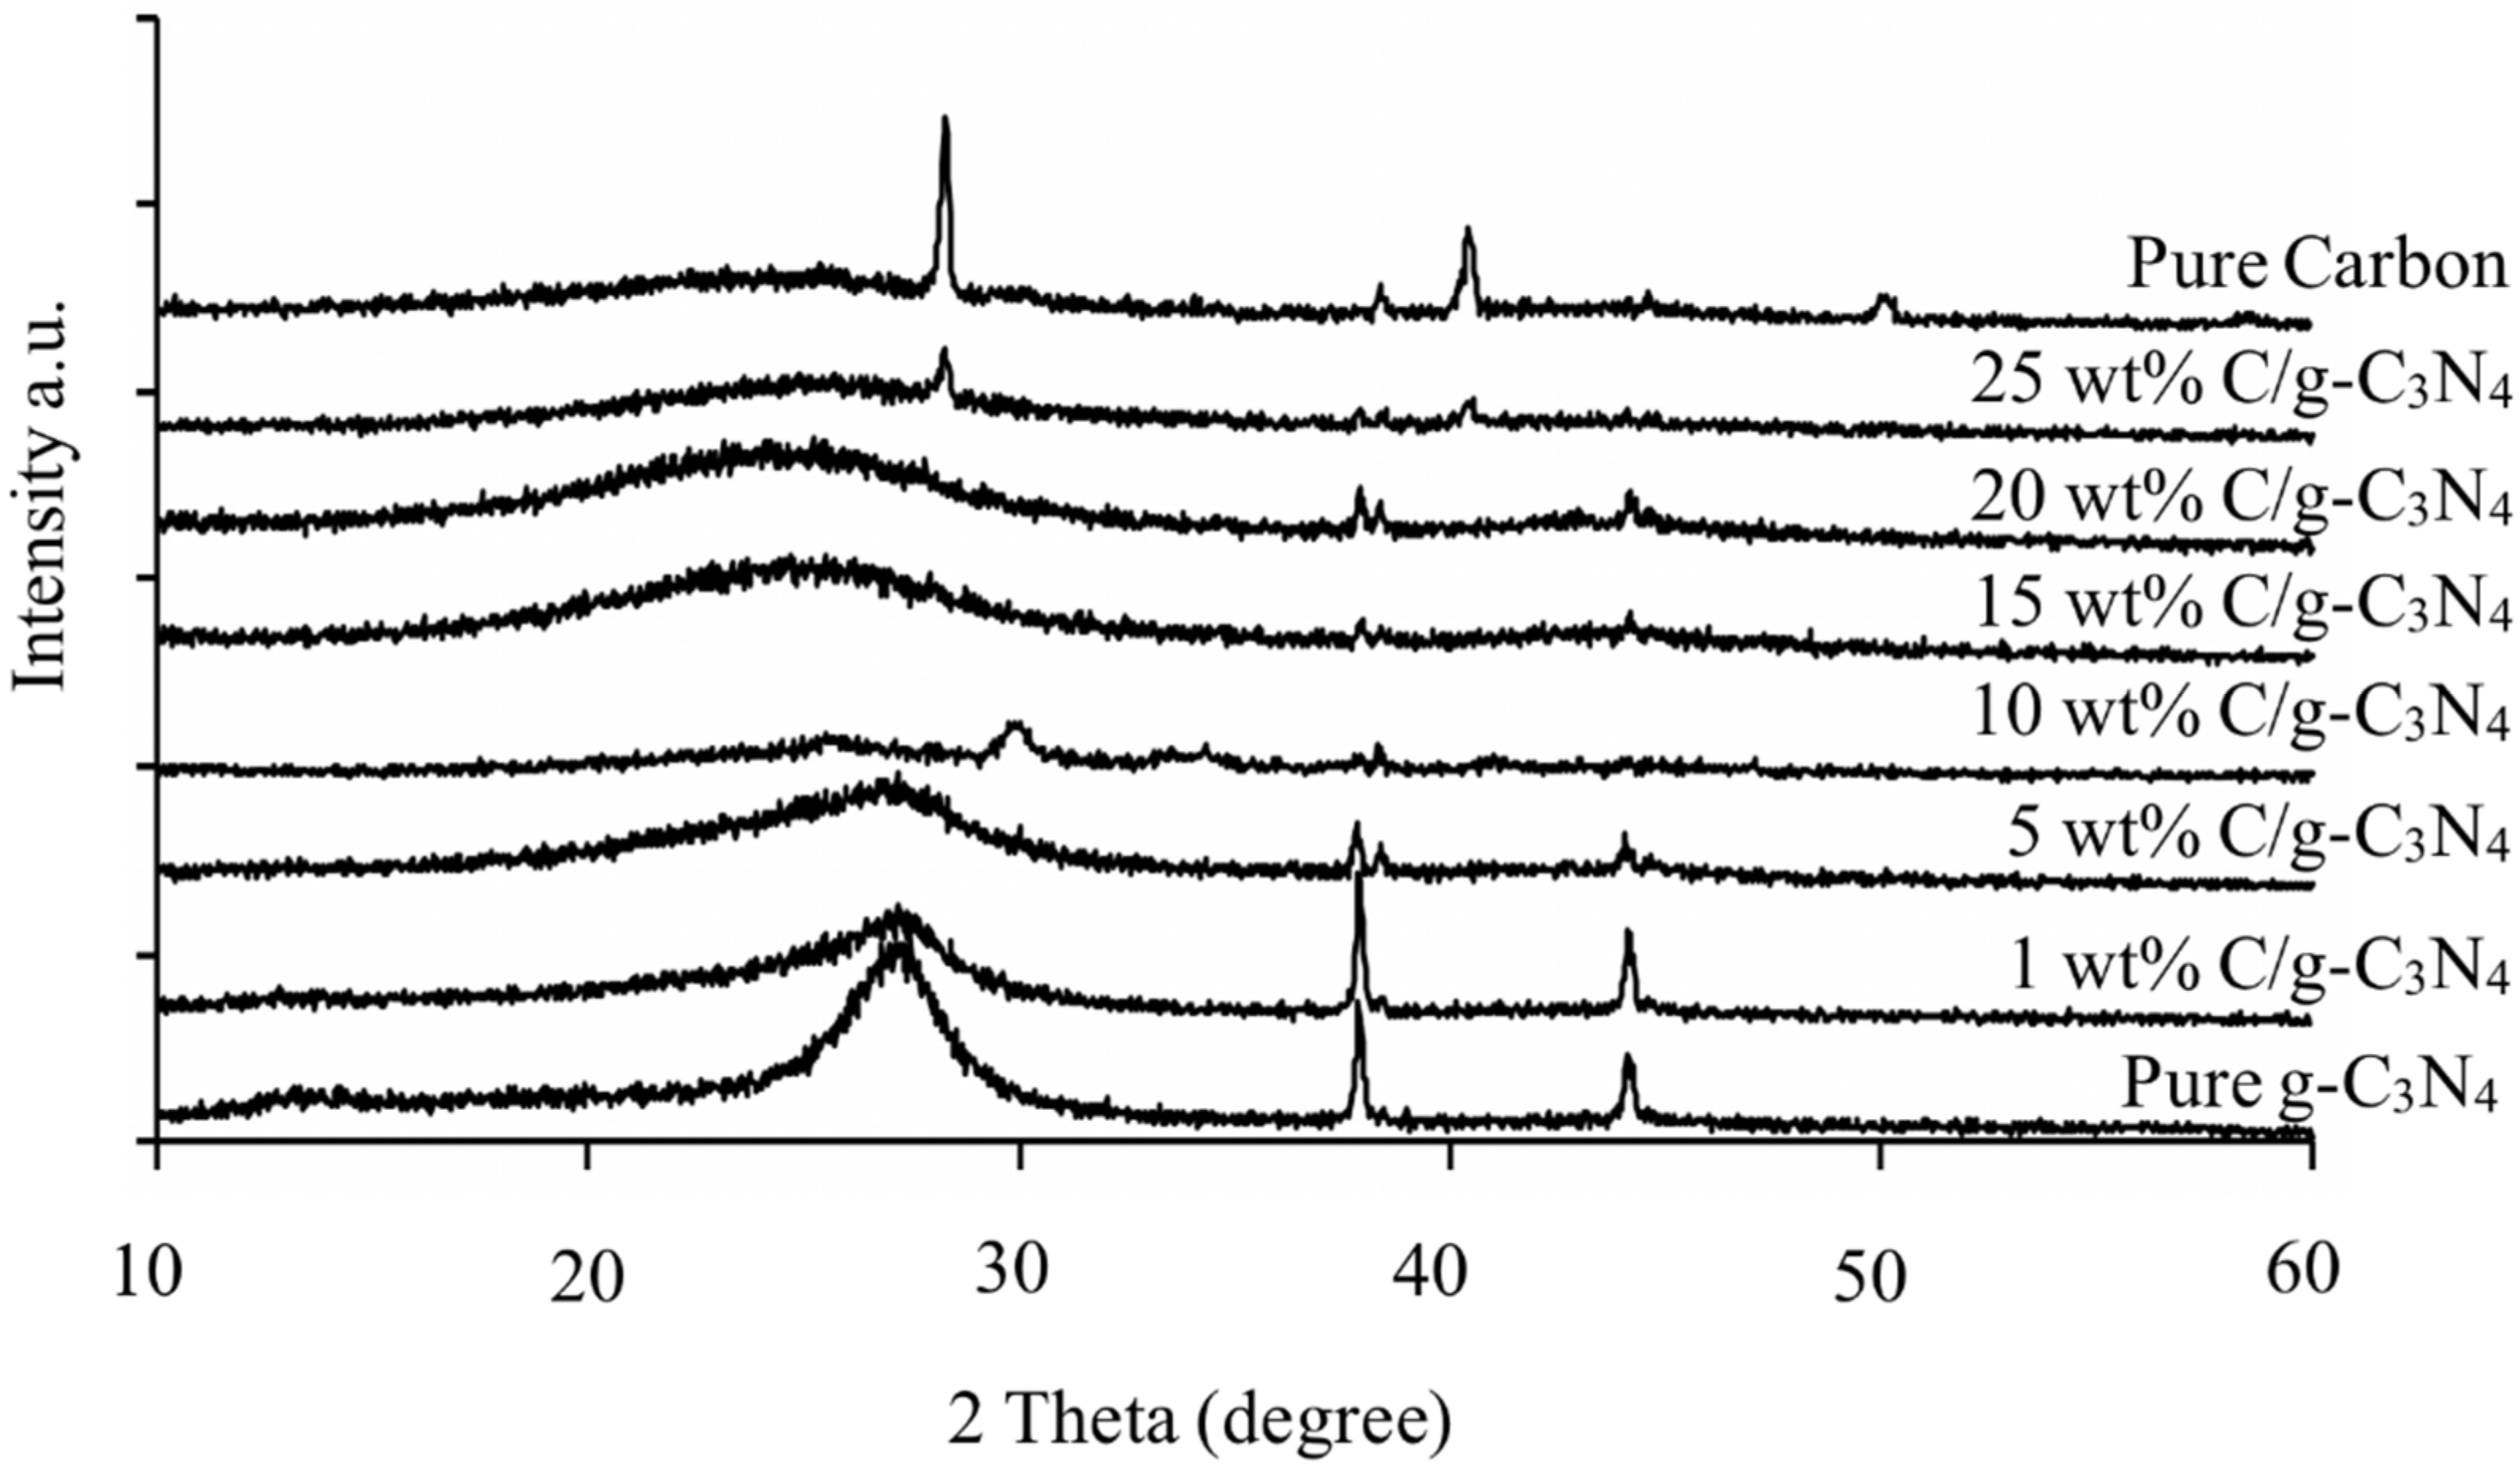
3.1.1. XRD Analysis

XRD results for pure g-C3N4, pure carbon, and C/g-C3N4 composites at different weight percentages are shown in Figure 1. There were three peaks observed at 2θ = 27.5°, 37.9°, and 44.1° in the XRD pattern of pure g-C3N4. The existence of the dominant diffraction peak at 27.5° was due to the (002) plane which represented the interlayer stacking of the conjugated aromatic system [12]. This peak confirmed the presence of the graphitic-like layered structure of carbon nitride. In other words, this finding proved that the sample produced was indeed g-C3N4. Meanwhile, the peak at 44.1° represented the crystallography plane of g-C3N4 at (020) [13]. The XRD pattern for pure carbon showed two significant peaks at 28.3° and 40.4°. The amorphous carbon-based materials were hemicellulose, amorphous cellulose, and lignin. The peaks appearing at the diffraction angle of 28.3° and 40.4° were attributed to the (120) and (100) crystallography planes of carbon, respectively [14,15]. The results reinforced the implication that the biochar produced from coconut shell husk was indeed carbon.
It is worth noting that the characteristic peak of g-C3N4 at 27.5° experienced a decrement in peak intensity and shifted slightly to a lower angle with the increasing amount of carbon incorporated into the lattice of g-C3N4. The peak eventually disappeared when the carbon amount was increased further to 25 wt%. These changes were owing to the substitution of N atoms in the lattice of g-C3N4 by C atoms originating from the coconut shell husk [16]. Hence, the addition of carbon to g-C3N4 induced a decrement in the orderliness of the interlayer stacking structure leading to the shift of characteristic peaks and a decrement in the peak intensity [11]. At carbon weightage equal to 15 wt%, all the characteristic peaks of g-C3N4 were not detected from the XRD analysis. The disappearance of g-C3N4 peaks were due to the presence of an excessive amount of carbon in the sample. As the amount of carbon increased beyond 15 wt%, the characteristic peaks of carbon became dominant as shown in Figure 1. The emergence of peaks at 28.3° and 40.4° in 25 wt% C/g-C3N4 revealed the dominating peaks of carbon over g-C3N4. The broad peak observed in the XRD spectra of 15 wt% C/g-C3N4 and 20 wt% C/g-C3N4 were attributed to the high amount of amorphous carbon material present. The findings were in line with the works reported by Xiao et al. [17] and Lin et al. [18] in which the characteristic peaks of g-C3N4 disappeared and the degree of amorphous structure was enhanced with the addition of carbon material.

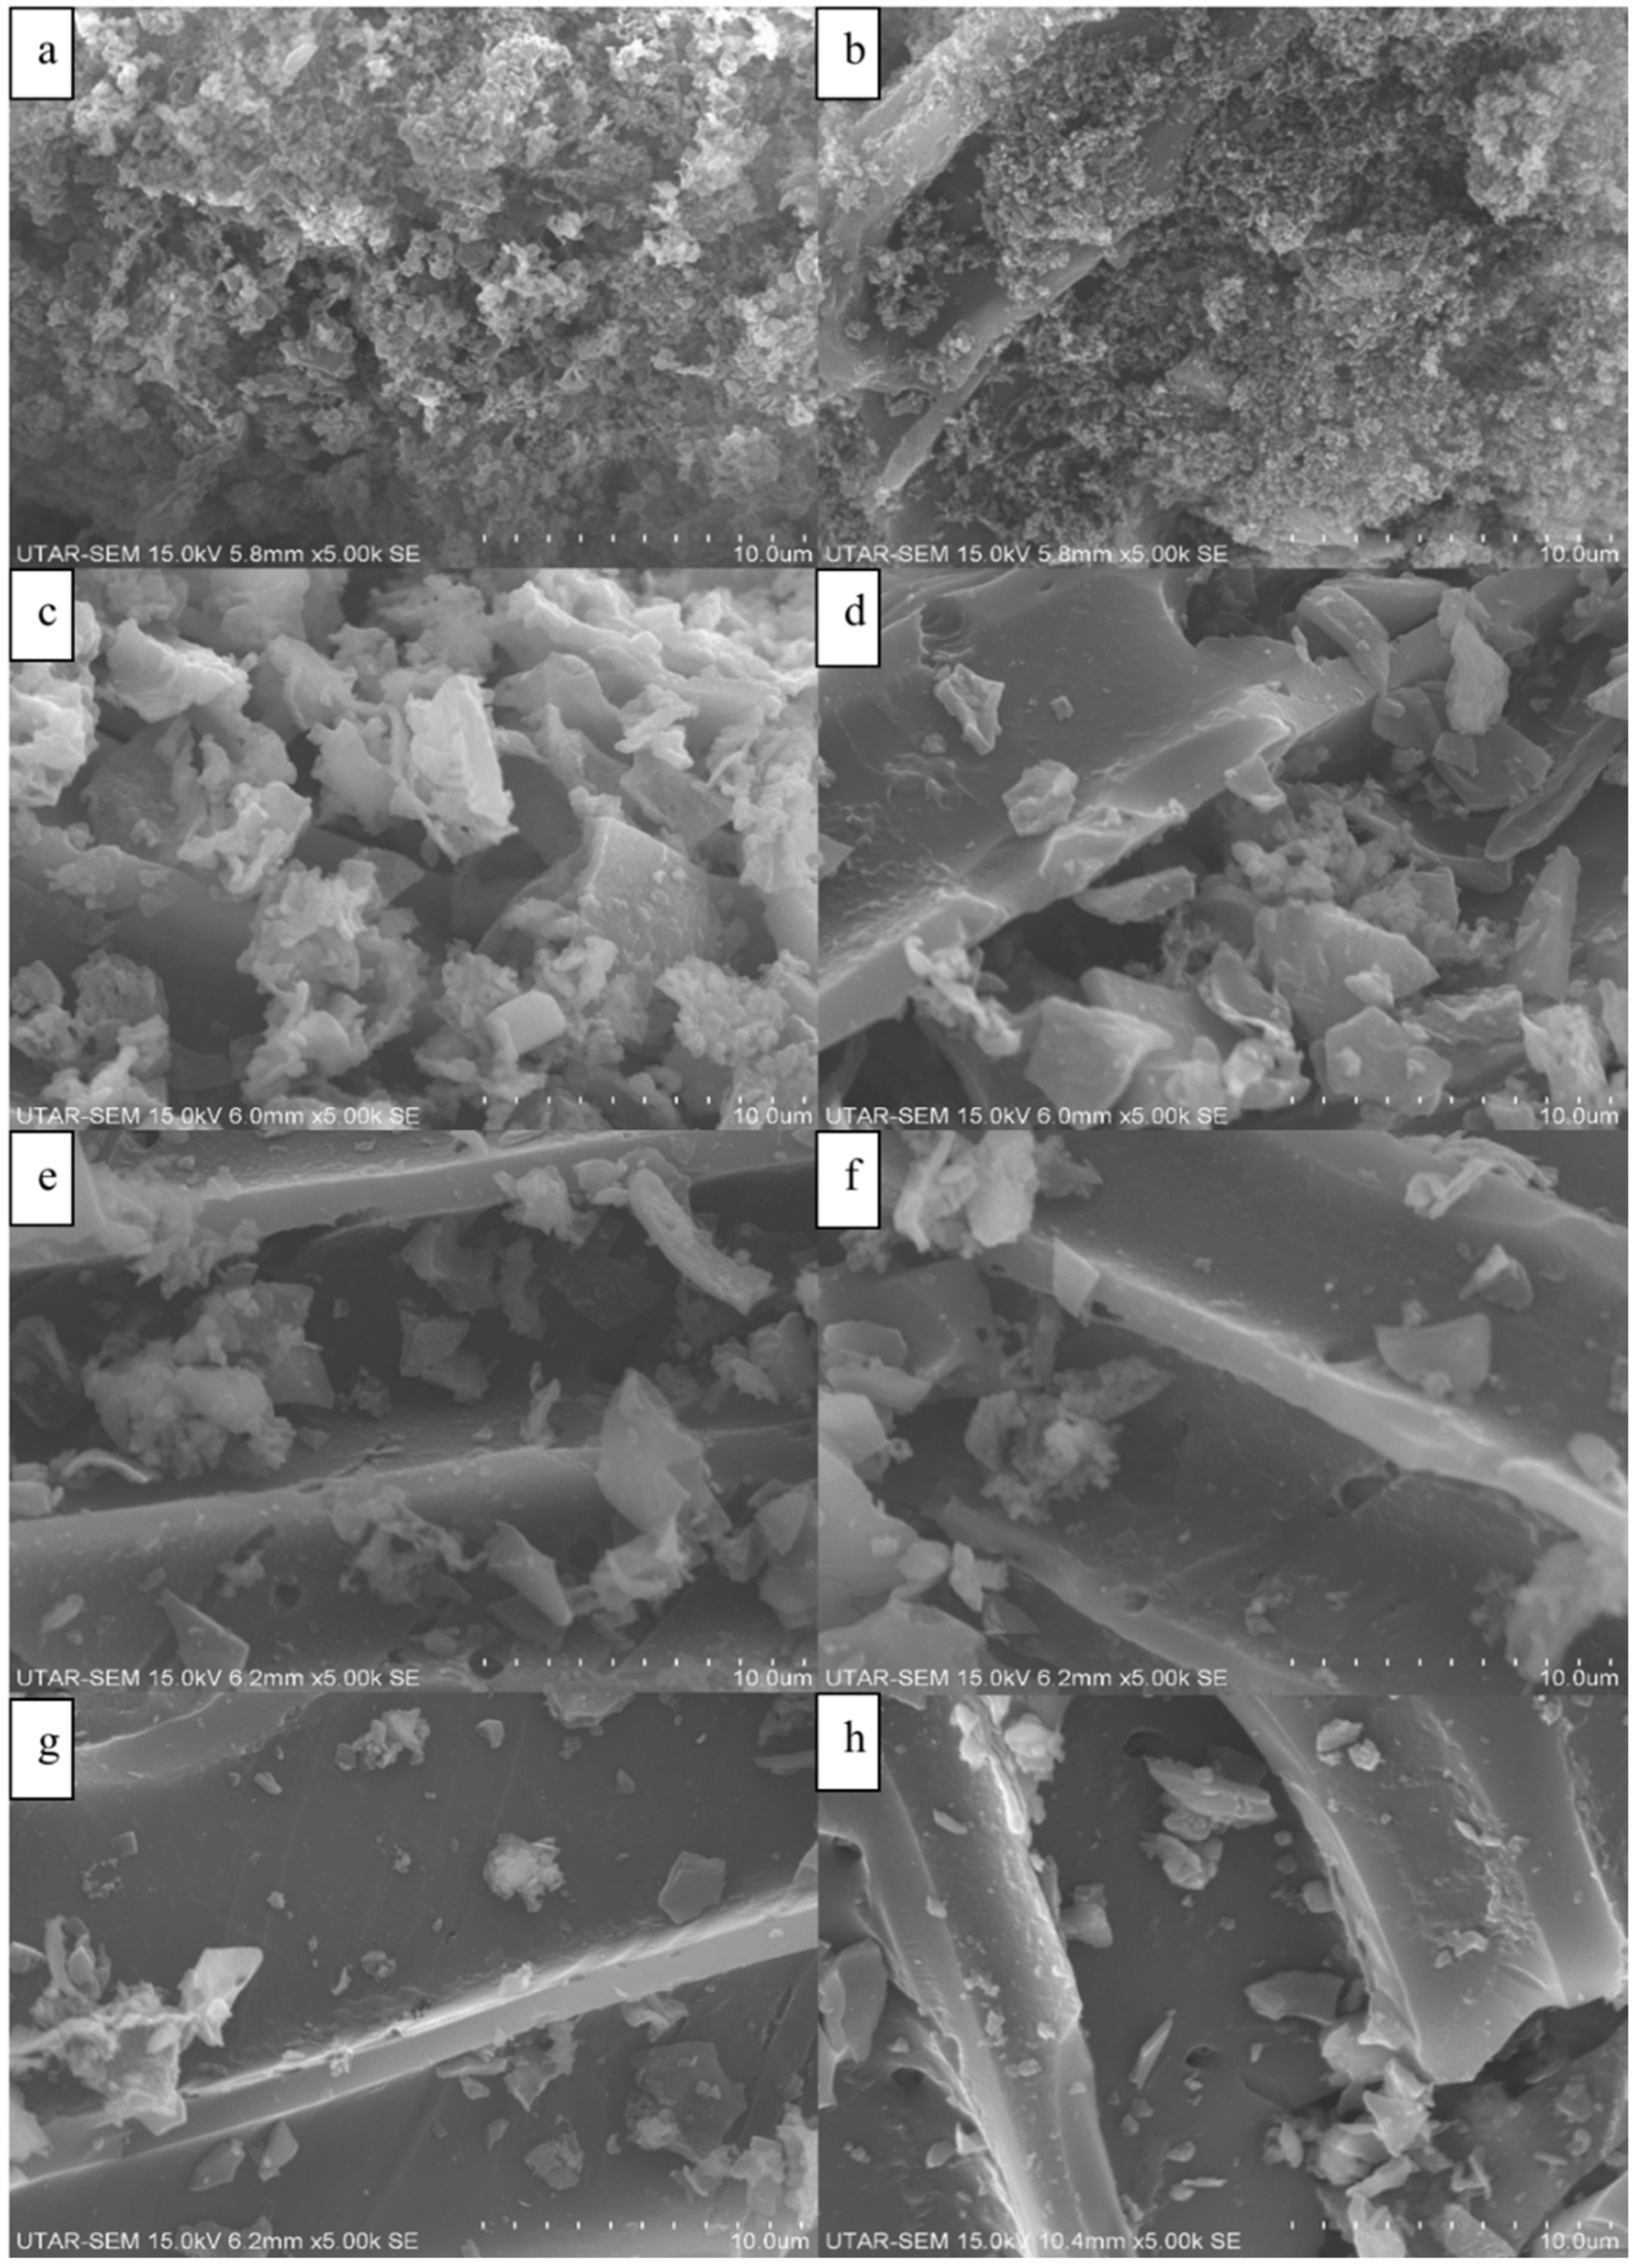
3.1.2. SEM-EDX Analysis

Figure 2 illustrates the surface morphology of pure g-C3N4, pure carbon, and C/g-C3N4 composites at different weight percentages captured at 5000 magnification. Figure 2a shows that pure g-C3N4 exhibited a structure that resembled overlapping flat sheets with irregular shapes. Figure 2b reveals that 1 wt% C/g-C3N4 samples consisted of smoother surface with irregular shapes adhering to it. The smoother surface was attributed to the carbon material. The presence of carbon materials increased the surface area of g-C3N4 and hence enhanced the availability of active sites for sonocatalytic reaction. Figure 2c displays that the smoother surface became more dominant than the irregular aggregation which was observed in the pure g-C3N4.
Based on Figure 2d, the SEM image of 10 wt% C/g-C3N4 shows that fewer irregular shapes were detected, indicating the dominance of the carbon materials over g-C3N4. The SEM images reflect the results obtained from XRD where the characteristic peaks of g-C3N4 were diminished and eventually disappeared with the increasing amount of carbon. As the amount of carbon increased, the presence of the irregular shaped particles decreased as shown in Figure 2e–g which represent the composite samples with carbon amounts of 15 wt%, 20 wt%, and 25 wt%, respectively. The decrement in the irregular-shaped particles implied that there is a decrement in the amount of g-C3N4 attached to the carbonaceous structure. This was caused by the increased amount of carbon material which increased the surface area of the sample. The distribution of g-C3N4 spread out more widely with an increased specific surface area which explained the decreasing amount of g-C3N4 observed per unit area of carbon material. From Figure 2h, it can be seen that there were signs of cracks and residues on the carbon material with no irregular shaped particles present. The observed morphology of pure carbon might be attributed to the results of the heat treatment of coconut shell husks [19].
The EDX results with the composition of carbon and nitrogen elements are displayed in Table 1. Pure g-C3N4 exhibited the carbon-to-nitrogen ratio of 0.78 which was very close to the stoichiometric value of 0.75. The result proved that g-C3N4 was synthesized successfully in this study. The introduction of carbon material to the pure g-C3N4 caused a significant increment in carbon content. As the content of carbon materials increased beyond 5 wt%, the carbon element detected by EDX was capped at a range of 85 wt% to 90 wt%. A decrement in the amount of nitrogen was observed with the increasing amount of carbon added. The finding was in a good agreement with the SEM analysis which implied the wider distribution of g-C3N4 over the carbon surface at higher content of carbon materials. Hence, this resulted in a decrement in the nitrogen content per unit surface area. The observations also confirmed the successful incorporation of g-C3N4 into the carbon materials synthesized using coconut shell husk. Besides, the elementary analysis results showed that the pure carbon had a 2.15 wt% of nitrogen. The small fraction of nitrogen present in the sample was the residual of coconut shell husk remaining after pyrolysis [20].

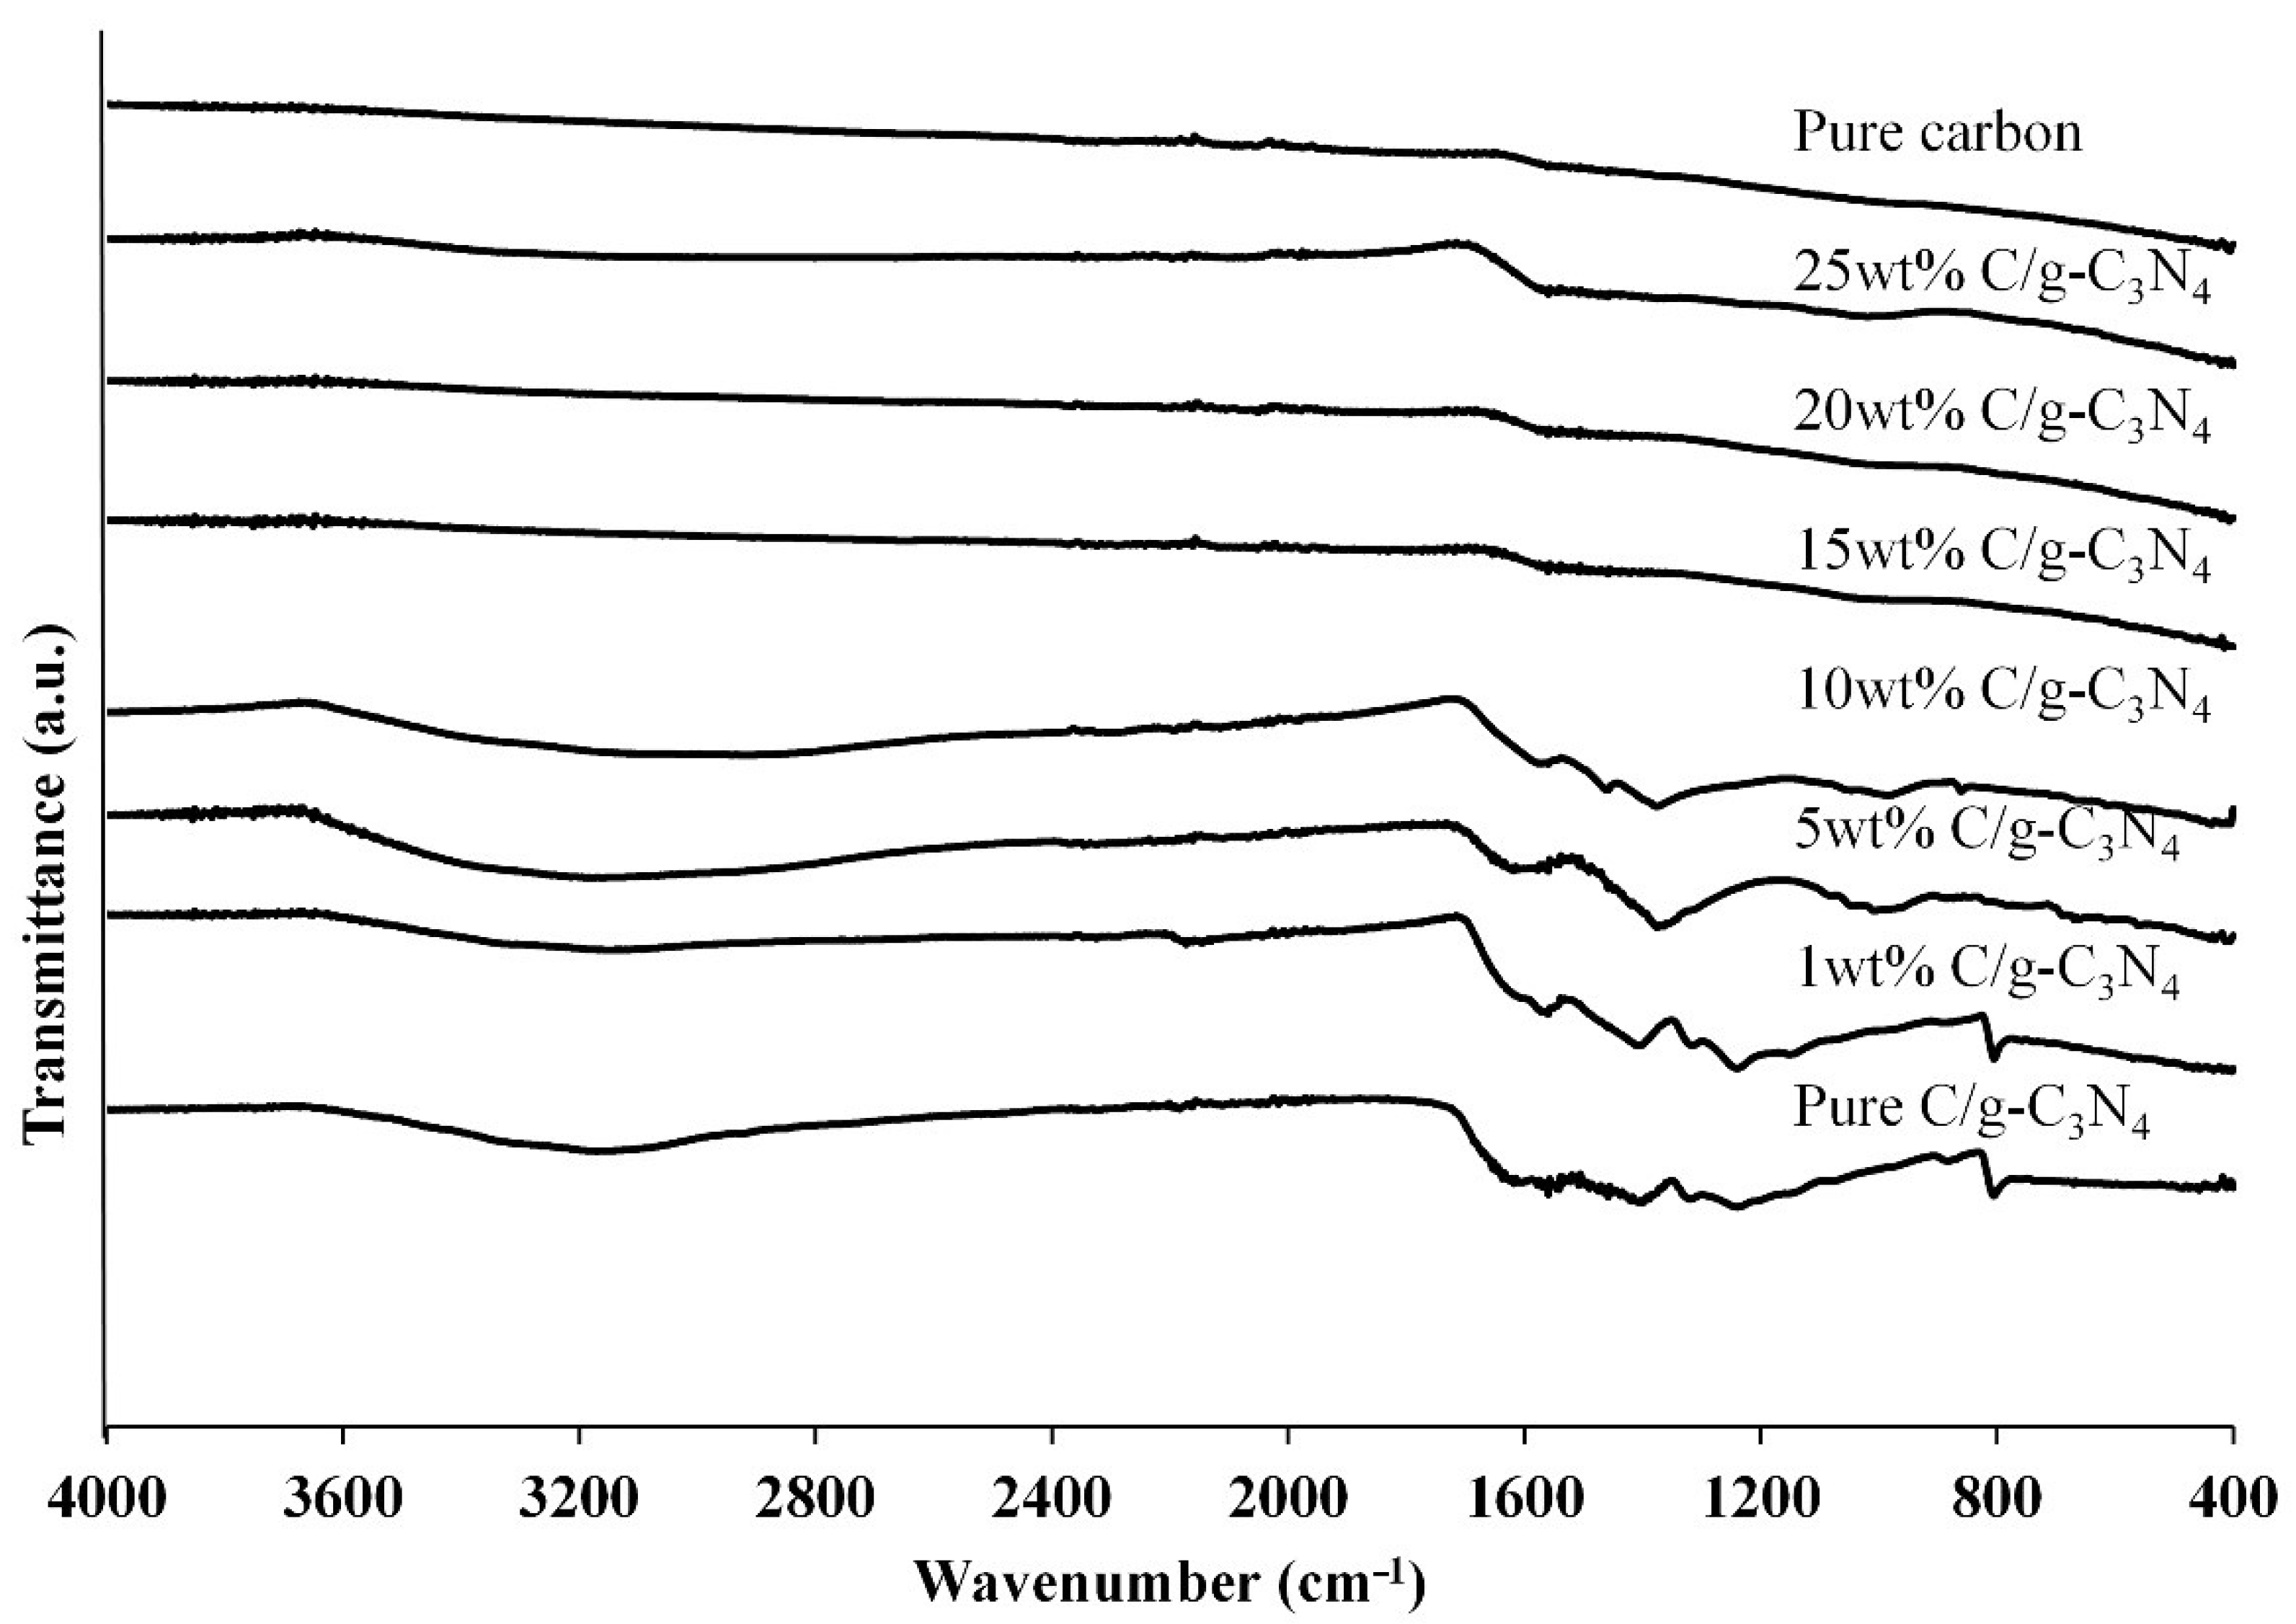
3.1.3. FTIR Analysis

The results obtained from FTIR analysis for pure g-C3N4, pure carbon, and C/g-C3N4 composites are shown in Figure 3. The FTIR band for pure g-C3N4 exhibited a broad, weak band between 2800 cm−1 and 3600 cm−1. The band indicated the stretching vibration modes for the N–H groups. Other than the broad peak, intense bands were observed in the range of 1200 cm−1 to 1700 cm−1. This was due to the stretching vibration of C-N bond in the heterocyclic structure of g-C3N4 [21]. There were also well-defined peaks at 1239.2 cm−1 and 805.6 cm−1. The peak observed at 1239.2 cm−1 represented the presence of tri-s-azine derivatives in the sample [22]. The out-of-plane bending vibration characteristic of heptazine rings was represented by the peak observed at 805.6 cm−1 [12].
With the addition of carbon, the peaks observed in pure g-C3N4 became less obvious. The intensities of characteristic peaks from 1200 cm−1 to 1700 cm−1 decreased in 1 wt% C/g-C3N4. For 5 wt% C/g-C3N4 and 10 wt% C/g-C3N4, both samples showed that the peaks at 1239.2 cm−1 and 805.6 cm−1 disappeared. The results revealed that the addition of carbon to g-C3N4 would minimize the transition energy of composites [18]. The FTIR spectra of 15 wt% C/g-C3N4, 20 wt% C/g-C3N4, and 25 wt% C/g-C3N4 were observed to be similar to the FTIR results of pure carbon. The finding was in line with XRD and SEM results which showed that the composition of excess carbon would dominate the characteristics of composite over g-C3N4.

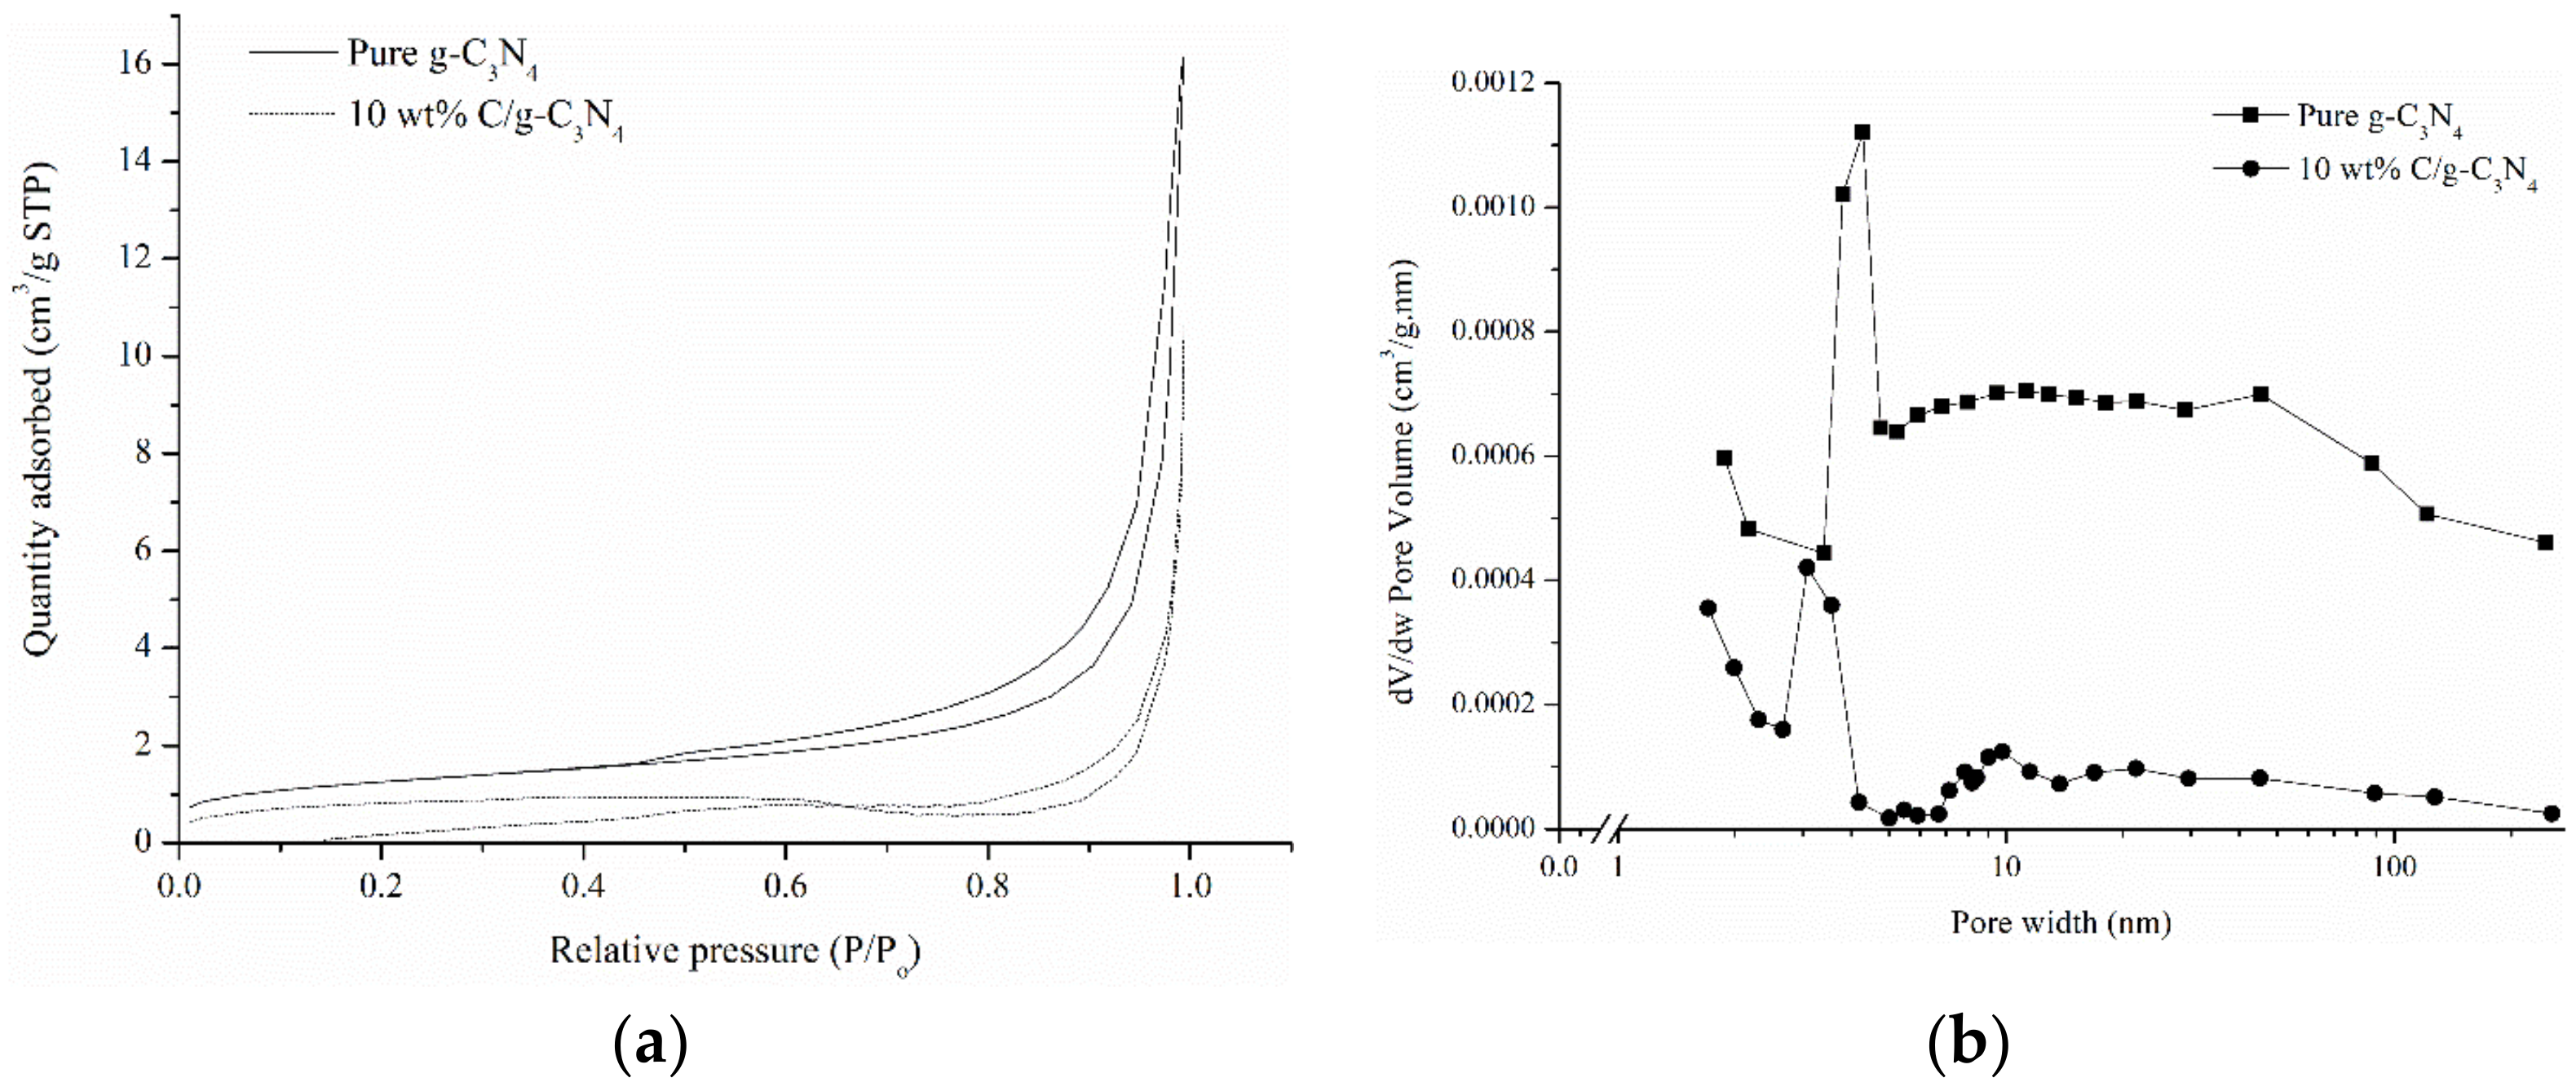
3.1.4. Surface Analysis
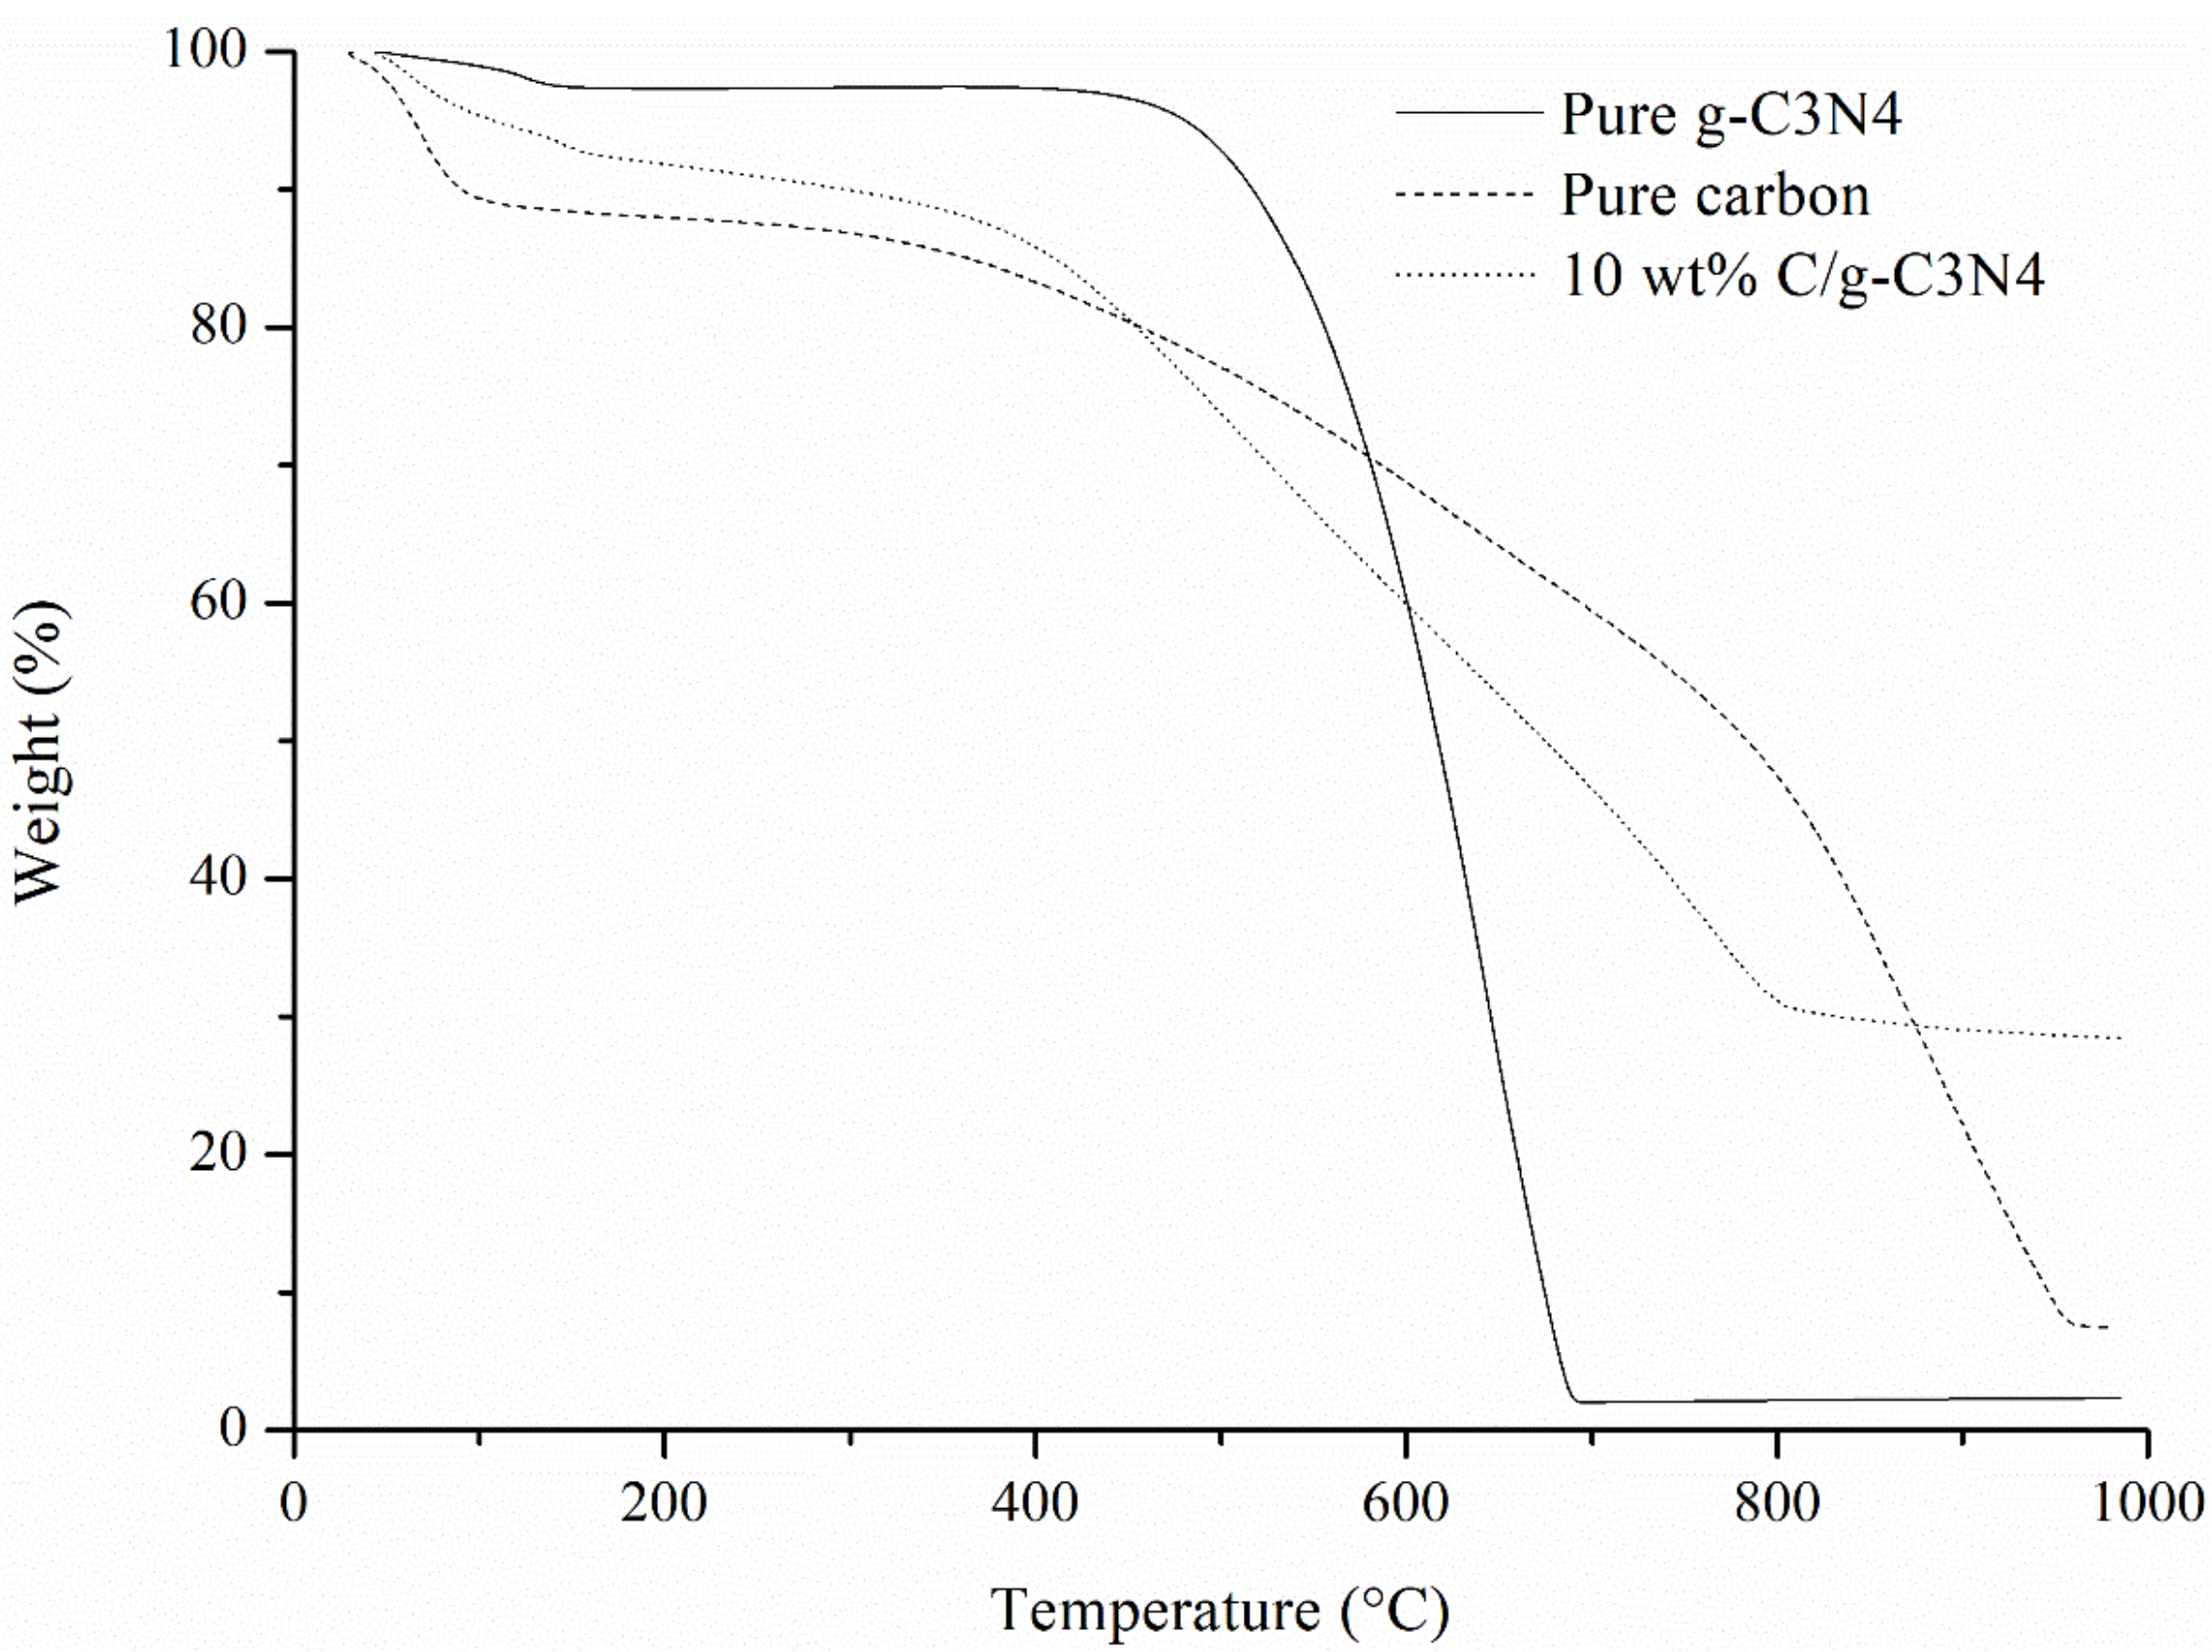
Figure 4a illustrates the nitrogen adsorption-desorption of g-C3N4 and 10 wt% C/g-C3N4. Both the samples exhibited Type IV isotherms with H3 hysteresis loop indicating the mesoporous properties of the samples [23]. The findings revealed that the adsorption capacity of 10 wt% C/g-C3N4 was lower than pure g-C3N4. This was well related to the Brunauer-Emmett-Teller (BET) surface area of samples. According to the results obtained, pure g-C3N4 had a higher surface area (4.4715 m2/g) than 10 wt% C/g-C3N4 (2.9647 m2/g). The reduction of surface area after the addition of carbon could be attributed to the pore blocking of carbon by g-C3N4 [24]. In Figure 4b, the pore distribution plots show that both the samples were mainly consisting of mesopores with the pore size between 2 and 50 nm. Together with the results of nitrogen adsorption-desorption isotherms, the presence of mesopores were confirmed to be dominant in the synthesized samples.

3.1.5. TGA

Figure 5 compares the thermal stability of pure g-C3N4, pure carbon and 10 wt% C/g-C3N4. All the samples experienced weight loss between 30 °C and 250 °C which was due to the removal of moisture content adsorbed on the samples [25]. The results showed that 10 wt% C/g-C3N4 composite decomposed faster than g-C3N4 at temperatures below 600 °C. This could be explained by the addition of carbon which weakened the Van der Waals force present in the π conjugated system of g-C3N4 [15]. However, the weight percentage of pure g-C3N4 declined sharply after 500 °C and the sample was decomposed nearly completely while increasing temperature up to 690 °C. In the range of temperature between 500 °C and 690 °C, the ring structure of g-C3N4 was destroyed to form nitrogen gas, cyanogen and cyanide [12]. As a whole, the total weight loss percentage of pure g-C3N4, pure carbon and 10 wt% C/g-C3N4 were found to be 97.68%, 92.59% and 71.58%. It is worth noting that the thermal stability of pure g-C3N4 was enhanced with the introduction of pure carbon synthesized using coconut shell husk.

3.2. Parameter Study for Sonocatalytic Degradation of Malachite Green

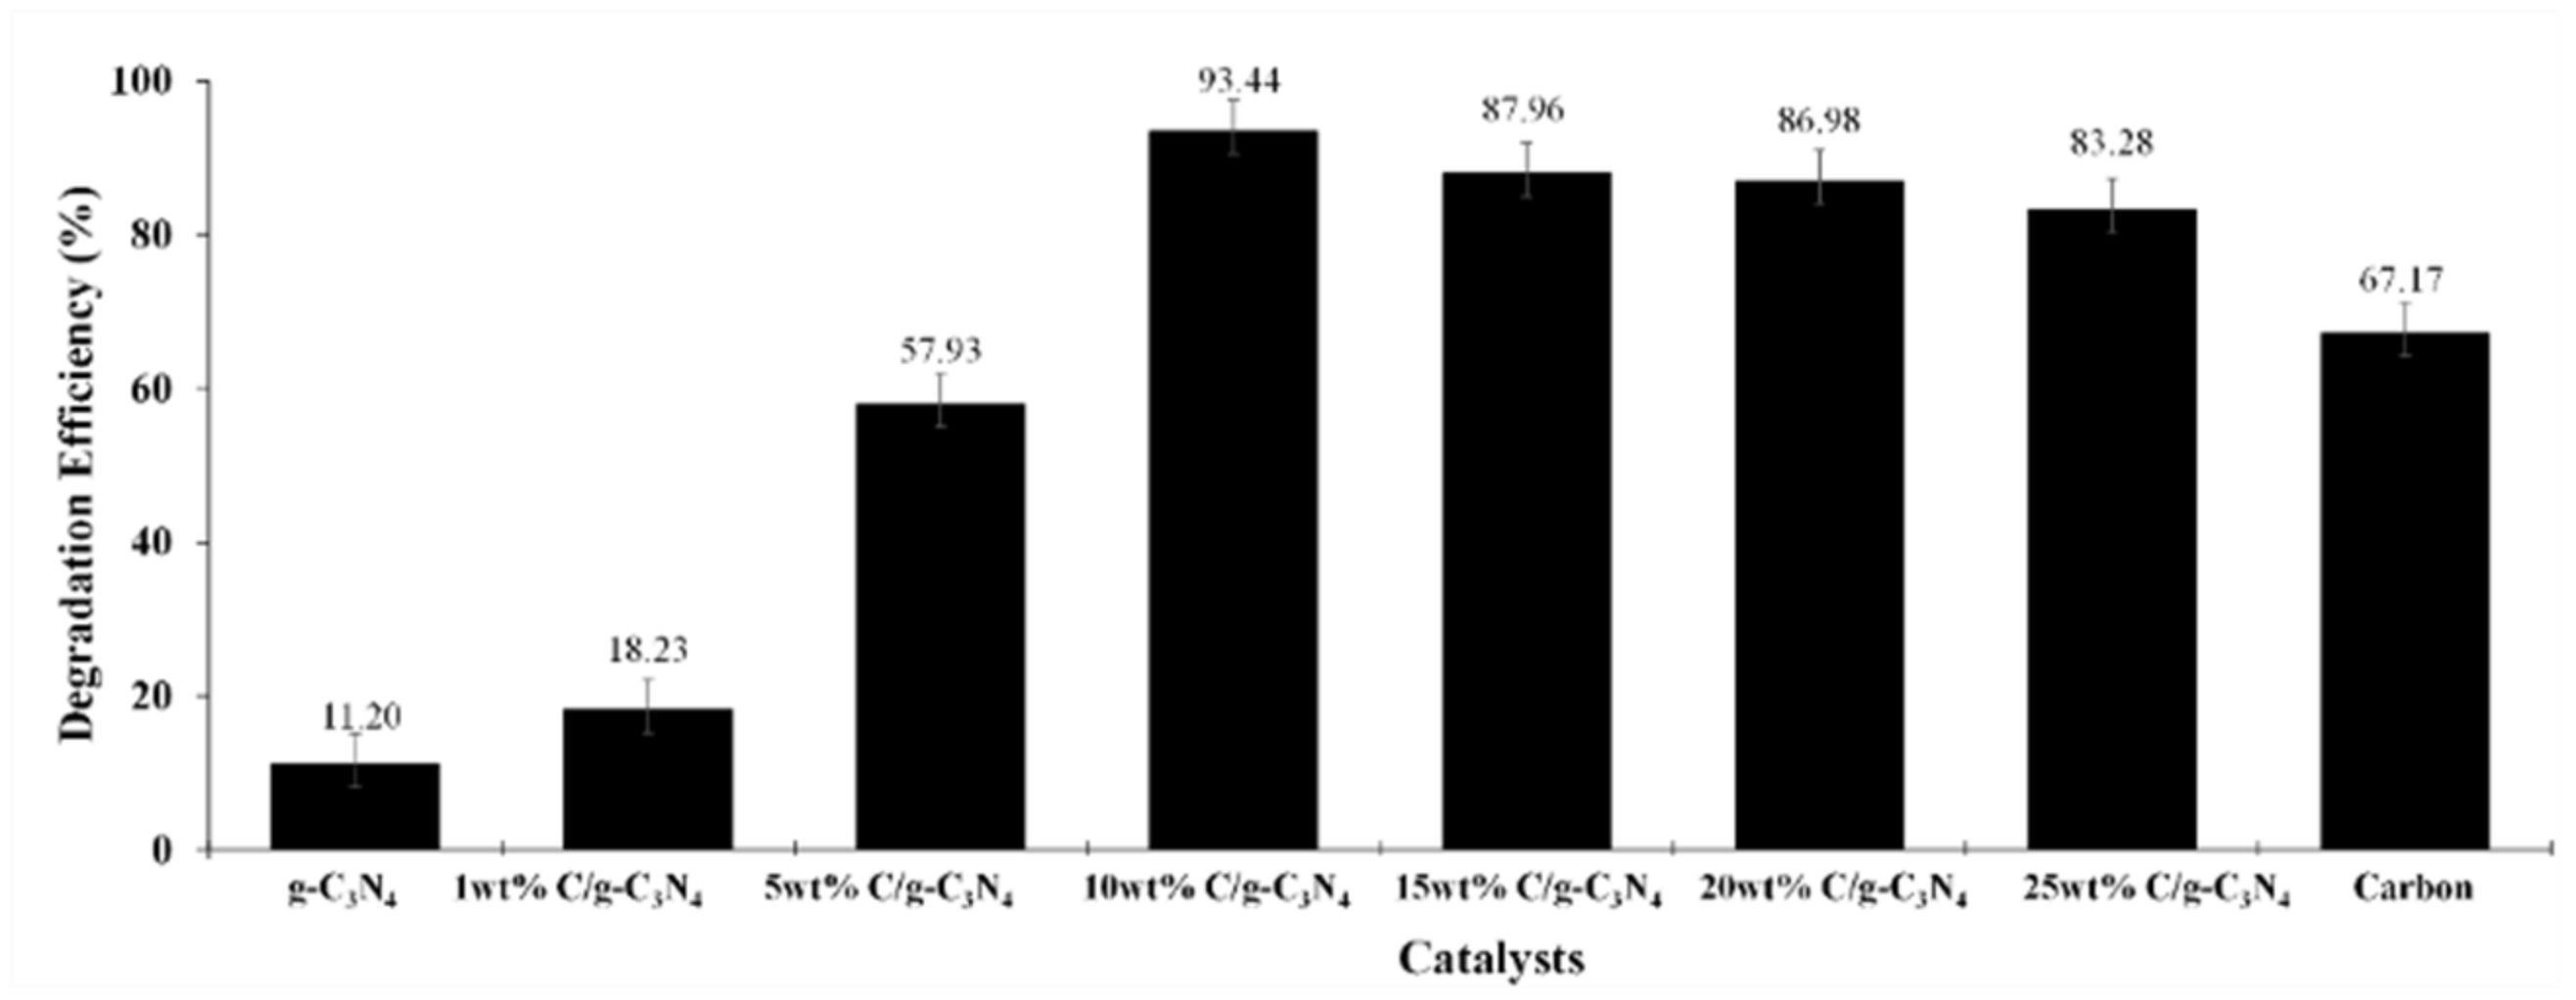
3.2.1. Effect of Carbon Amount Composited with g-C3N4

The effect of different carbon amounts composited with the g-C3N4 on the sonocatalytic performance was studied by comparing the degradation efficiencies of malachite green as shown in Figure 6. The findings showed that 10 wt% C/g-C3N4 exhibited the best degradation efficiency of 93.44%. Pure g-C3N4 only showed the lowest degradation efficiency of 11.20%. The 10 wt% C/g-C3N4 provided around eight times higher degradation efficiency of malachite green as compared to the pure g-C3N4. The composites with increasing amount of carbon showed a positive effect in the degradation efficiency of malachite green until maximum degradation efficiency was achieved by 10 wt% C/g-C3N4. The degradation efficiencies of malachite green were found to be 18.23% and 57.93% in the presence of 1 wt% C/g-C3N4 and 5 wt% C/g-C3N4 respectively. After achieving the optimum value of degradation efficiency, the further addition of carbon amount on g-C3N4 showed a decrement trend in the degradation efficiency of malachite green. The results reveal that 15 wt% C/g-C3N4, 20 wt% C/g-C3N4, and 25 wt% C/g-C3N4 exhibited 86.08%, 87.96%, and 83.28% of degradation efficiencies respectively. Meanwhile, the degradation efficiency of malachite green in the presence of pure carbon was only 67.17%.
Pure g-C3N4 showed a very low catalytic performance due to the rapid recombination rate of the electron-hole pairs and poor light absorption [23]. In a typical sonocatalysis process, the explosion of acoustic bubbles release energy in the form of light which is known as sonoluminescence [26]. The emission of light under ultrasound irradiation will then excite g-C3N4 to form electron-hole pairs leading to the generation of free radicals [27]. Hence, both light absorption and separation of charge carriers were important steps in the sonocatalytic degradation of malachite green in order to activate the sonocatalyst and generate free radicals, respectively. Although the 10 wt% C/g-C3N4 had a smaller area than pure g-C3N4, the presence of carbon in the composite could help to delay the recombination of electron-hole pairs because carbon could serve as the electron collector [11]. By allowing a higher separation efficiency of the charge carriers, the degradation efficiency of the malachite green was enhanced since more free radicals could be generated [15]. The results were in good agreement with Xiao et al. [17] where the catalytic activity of g-C3N4 was enhanced with the introduction of biochar. This implied that the optimum carbon content in C/g-C3N4 for this study was 10 wt%.
A decrement in degradation efficiency could be observed when the amount of carbon composited on g-C3N4 exceeded 10 wt%. This phenomenon occurred because the concentration of carbon composited with g-C3N4 was extremely high. The excessive amount of black carbon would block the light absorption of g-C3N4 that inhibited the sonocatalytic performance [17]. With some of the light being blocked by carbon, the degradation efficiency of malachite green dropped and remained almost constant for the other three composite samples. The results were in line with the work reported by Meng et al. [11] which proposed that the highest catalytic activity was achieved in the presence of g-C3N4 composited with optimum carbon content. The work also reported that the band gap energy of the composites increased with the increasing amount of biochar beyond optimum value. This would in turn reduce the formation of electron-hole pairs since higher energy was required to activate the catalyst [28]. Hence, it was speculated that moderate carbon content would improve light harvesting capacity and band gap narrowing which in turn enhanced the generation of charge carriers commanding a higher catalytic degradation efficiency of the dye.

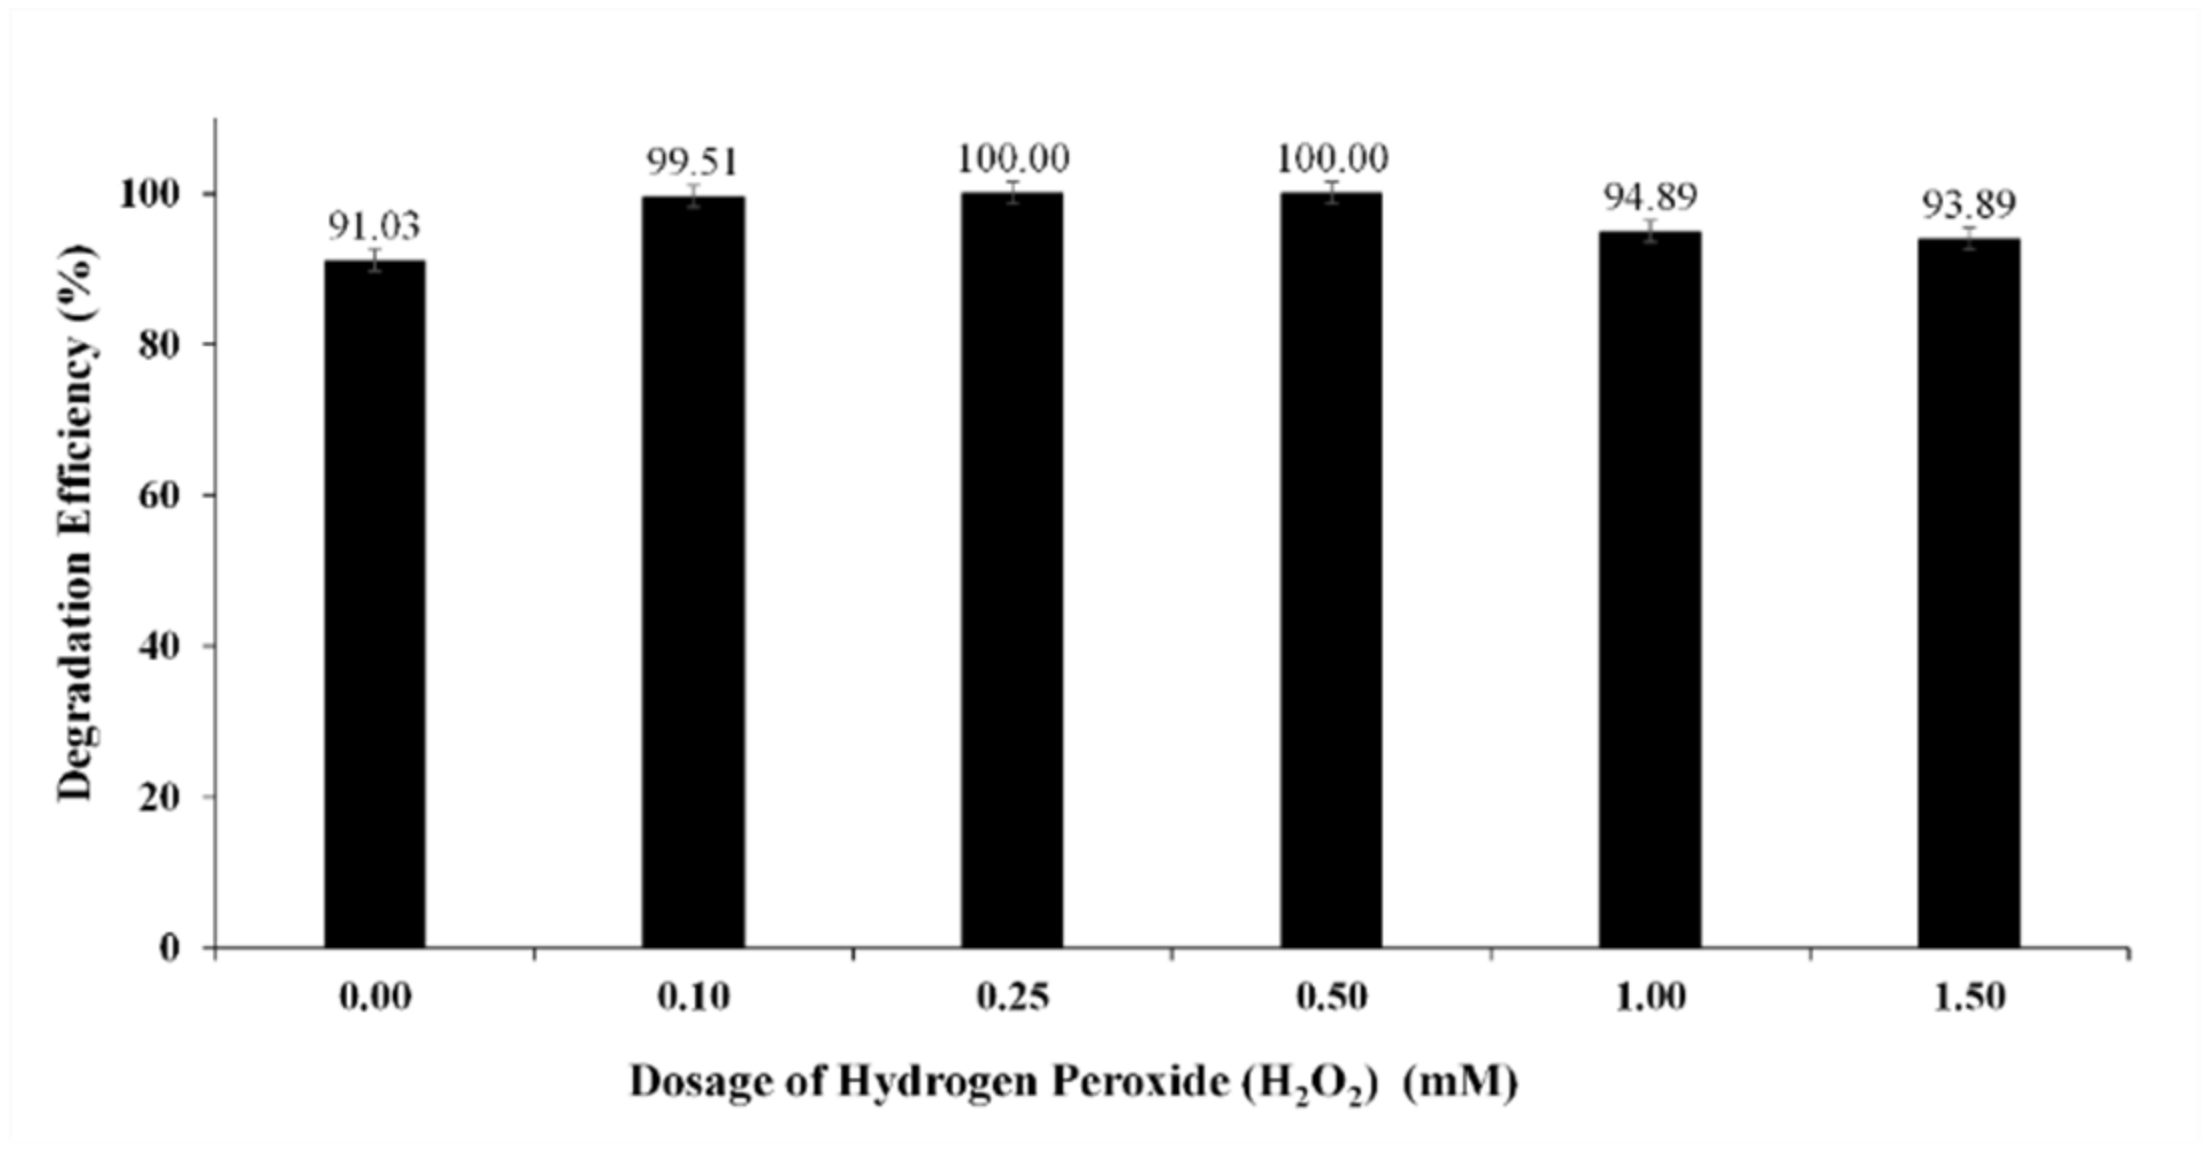
3.2.2. Effect of H2O2 Dosage

The effect of H2O2 dosage (0 to 1.50 mmol/L) on the degradation efficiency of malachite green is shown in Figure 7. It was noted that the degradation efficiency of malachite green was the lowest with 91.03% degradation when there was no H2O2 added. The sonocatalytic degradation efficiency of malachite green increased to 100% with the increasing dosage of H2O2 until 0.5 mmol/L. The degradation efficiency of the malachite green dropped from 100% to 94.89% when H2O2 dosage was increased further from 0.5 mmol/L to 1.5 mmol/L.
The increment in degradation efficiency after the addition of H2O2 implied that H2O2 exhibited a positive effect in the sonocatalytic degradation of dye. This was due to the strong oxidizing power of H2O2 which could promote the generation of •OH radicals by self-decomposition under ultrasonic irradiation [6,29]. Besides, the presence of H2O2 could act as an electron trap to yield more •OH radicals and inhibit the recombination of charge carriers of the catalyst [10]. Therefore, the increased amount of •OH radicals in the solution would improve the degradation performance.
The decrement in the sonocatalytic performance was observed when excessive amounts of H2O2 were utilized. At high concentrations of H2O2, hydroperoxyl radicals (OOH•) with lower oxidation potential would be produced instead of •OH radicals [30]. The scavenging effect would reduce the amount of •OH radicals and holes present in the solution. Since the degradation efficiency of 10 wt% C/g-C3N4 in the absence of H2O2 showed an impressive result of 91.03%, it was decided that no H2O2 would be added for the subsequent studies.

3.3. RSM Modelling

3.3.1. CCD Model

For this study, three factors were taken into consideration for the optimization study which were initial catalyst dosage (g/L), initial dye concentration (ppm), and solution pH. A CCD model was used to analyze the interactive effect of these three parameters on the degradation efficiency of malachite green.
The experimental and predicted degradation efficiency values are presented in Table 2. The experimental degradation efficiency of malachite green by sonocatalytic degradation in the presence of 10 wt% C/g-C3N4 was found to be in the range of 65.91% to 97.11%. The experimental data fitted well into the quadratic vs. 2FI model with coefficient of determination (R2) equal to 0.9862. The modification of the model was made based on the backward elimination method. Since modelling with insignificant model terms would affect the accuracy of the model, it was decided to remove the insignificant interactive term, X1×2 which showed p-value (0.1354) greater than 0.05.
The dependent and independent variables could be correlated by using a second-order polynomial response equation. The empirical relationship between the response and independent variables for the sonocatalytic degradation of malachite green in the presence of 10 wt% C/g-C3N4 is shown in Equation (1) which is presented in terms of coded units.
ypred = 85.69 − 3.09 × 1 + 2.92X2 + 8.31X3 + 1.66X1X3 − 1.79X2X3 + 0.8023X12 + 1.07X22 − 1.76X32
where ypred represents predicted degradation efficiency.
The predicted values of degradation efficiency listed in Table 2 were computed using Equation (1). The small residual values for all the runs indicated the good match between experimental and predicted values. The sign of the terms in Equation (1) implied the effect of that parameter on the degradation efficiency. A positive sign showed the synergistic effect of a particular term on the degradation efficiency of malachite green while a negative term showed its antagonistic effect on the degradation of malachite green. In this study, the terms X2, X3, X1X3, X12 and X22 exhibited a positive effect on the response while X1, X2X3 and X32 showed a negative impact on the degradation efficiency. Based on Table 3, high F value (98.10) indicated that the model constructed was significant with satisfactory p-value (<0.0001). In addition, adequate precision of this model was found to be 34.4670 which reflected a high ratio of signal-to-noise. Together with the insignificant lack of fit value, the model was again proved to be fitted well with the experimental data.

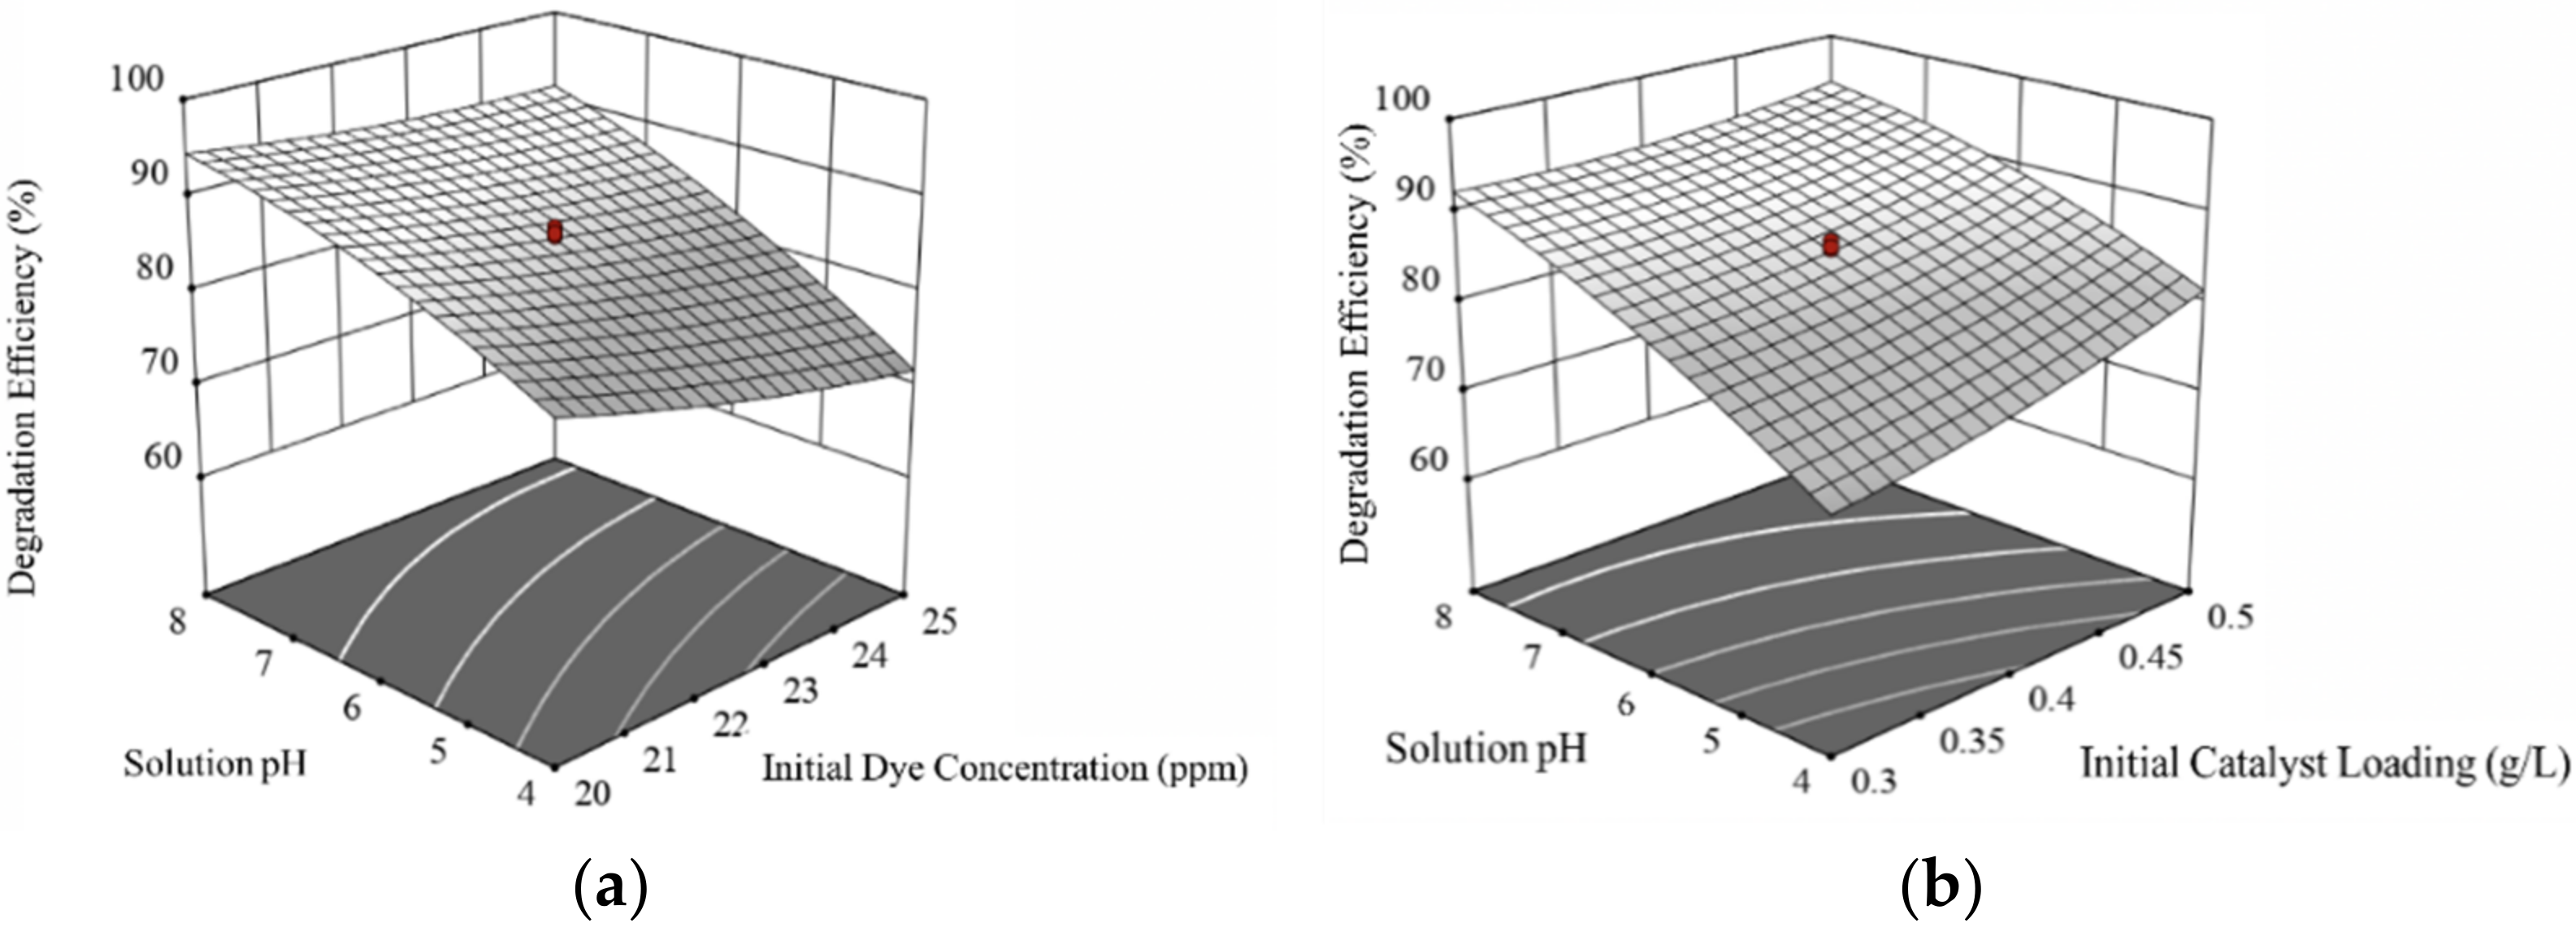
3.3.2. Effect of Experimental Variables on the Degradation Efficiency

Figure 8a shows the response surface plot of the degradation efficiency with solution pH and initial dye concentration. Runs 13 and 14 which had a degradation efficiency of 66.75% and 94.70%, respectively, indicated that the solution’s pH greatly affected the degradation efficiency of malachite green. For the effect of initial dye concentration, Runs 9 and 10 that had the degradation efficiency of 93.16% and 82.75%, respectively, showed that the change in initial dye concentration did not affect the response factor significantly. By comparing Run 1 and Run 6, the interaction between the two factors being studied could be observed. Run 1 was being conducted at a lower solution pH and initial dye concentration demonstrated a degradation efficiency of 77.62%. Meanwhile, Run 6 that was performed at a higher solution pH and initial dye concentration showed a higher degradation efficiency of 91.07%. This comparison showed that solution pH was the major factor that affected the response factor while the initial dye concentration only affected the degradation efficiency by a small fraction as compared to solution pH.
A change in solution pH could affect the electrostatic interaction between the dye molecule and catalyst surface. Solution pH variation could also alter the production of radicals that directly affected the degradation efficiency of malachite green. When solution pH increased towards the alkaline region, the degradation efficiency of malachite green increased greatly. This phenomenon could be explained by the increased production of hydroxyl radicals (•OH). The alkaline conditions implied that more hydroxyl ions were present in the solution [31]. With more hydroxyl ions being converted to •OH radicals, the degradation of malachite green could be improved greatly.
When the solution pH decreased toward the acidic region, the degradation efficiency of malachite green dropped drastically. This was caused by the presence of excess hydrogen ions in the dye solution leading to the deprotonation of the catalyst [32]. In other words, the hydrogen ions would compete with malachite green molecules to adsorb on the catalyst surface. Besides, excessive amount of H+ ions would react with •OH radicals as shown in Equation (2) leading to the decline in the amount of •OH radicals available for degradation of the malachite green [33]. Chloride ions contributed from HCl that was used to adjust the solution pH would also scavenge •OH radicals to form HOCl• with lower oxidation potential [34]. The scavenging effects under acidic condition are displayed in Equations (2) and (3).
•OH + e + H+ → H2O
•OH + Cl → HOCl•
The scavenging effects of •OH radicals and adsorption of hydrogen ions on the catalyst surface explained the reduction of degradation efficiency of malachite green in acidic conditions.
The initial dye concentration was another factor that would affect the degradation efficiency of malachite green. The increment in initial dye concentration would cause a slight decrement in the response factor. This trend could be explained by both physical and chemical processes. The mass transfer between the dye molecules and catalyst surface was the physical process involved in the sonocatalytic degradation of malachite green while the concentration of radical species was the chemical factor. At higher initial dye concentrations, the number of dye molecules present in the solution increased at constant catalyst dosage, indicating the number of adsorption sites was limited with increasing initial dye concentration [35]. In terms of chemical factors, the active sites of the catalyst were occupied by higher numbers of dye molecules. This would in turn prevent the absorption of energy by the catalyst and hinder the yield of charge carriers [7]. Hence, the generation of free radicals decreased at higher initial dye concentrations and was insufficient to degrade the dye molecules present in the solution [36]. In this case, the amount of free radicals became the limiting step that reduced the degradation efficiency. The increment in initial dye concentration would decrease the degradation efficiency of malachite green owing to limiting factors which were attributed to the concentration of radical species present and the availability of adsorption sites on the catalyst surface.
The interaction between solution pH and initial catalyst loading is shown in Figure 8b. The results indicated that solution pH affected the degradation efficiency more than the initial catalyst loading. This relationship was shown in their difference in F values from the ANOVA results. The initial catalyst dosage had the lowest F value among three factors which implied that it might affect the degradation efficiency insignificantly. By comparing Run 11 and Run 12, the degradation efficiency shown by these runs were 83.60% and 94.05%, respectively. The difference between Run 11 and Run 12 was only the initial catalyst dosage used. Based on the surface plot in Figure 8b, the initial catalyst dosage showed the least effect on the response factor when the solution pH was at alkaline condition. The interaction could be done by comparing four runs which were Run 1, Run 3, Run 5, and Run 7. Run 1 and Run 3 showed a degradation efficiency of 77.62% and 88.69% at a constant low solution pH when the initial catalyst loading was varied. Run 5 and Run 7 showed degradation efficiencies of malachite green of 94.23% and 97.11% at solution pH 8, respectively, with the increasing initial catalyst dosage.
The third factor that was studied in this model was the initial catalyst dosage. An increment in initial catalyst dosage would cause an increment in the response factor. This phenomenon could be explained by the increment in surface area of the catalyst to generate more pairs of charge carriers [37]. The increased surface area of the catalyst also provided more active sites for the nucleation of bubbles and the generation of free radicals [38]. This would in turn improved the degradation efficiency of malachite green. The insignificant effect of initial catalyst loading at high solution pH might be due to the presence of hydroxyl ions in the solution. With more hydroxyl ions, the amount of •OH radicals produced could be greatly increased which caused the increment in the catalyst to be redundant. In other words, the increment in catalyst loading would improve the sonocatalytic performance by generating more radicals but the effect would be insignificant once the optimum amount of radicals in the solution was exceeded.

3.3.3. Optimisation and Model Validation

In this study, RSM was used to obtain the optimum conditions for the sonocatalytic degradation of malachite green by the means of the CCD model. The solution selected from the numerical optimization showed the highest desirability of 0.986. The values of the optimum operating parameters for initial dye concentration, initial catalyst loading, and solution pH were 20 ppm, 0.5 g/L, and 8, respectively. The predicted and experimental values for the degradation efficiency of malachite green under optimum conditions were 96.69% and 97.11%, respectively. The percentage error for the predicted and actual value was only 0.43%. The low percentage error between these two values indicated that the applied model was reliable for making predictions on the response factor for real conditions.
Table 4 compares the removal efficiencies of malachite green through different techniques proposed by other works such as heterogeneous catalysis, adsorption and catalysis. Based on Table 4, it is clear that the sonocatalytic process using non-metal g-C3N4/coconut shell husk derived-carbon composites was a novel and potential method to remove malachite green as compared to the literature. It is interesting to note that adsorption using ZIF-8@fe/Ni which was proposed by Zhang et al. [39] could remove 99.0% of malachite green with 50 mg/L initial dye concentration. However, malachite green molecules were not eliminated from the environment but only transferred to another phase without degradation. Hence, an extra post-treatment step was needed in order to decompose malachite green. Furthermore, the results obtained in the current work were comparable to the findings reported by Pandey et al. [40] which proposed the application of g-C3N4/NiO as photocatalyst in the removal of malachite green. In this work, 10 wt% C/g-C3N4 also exhibited a high sonocatalytic performance in the degradation of malachite green within a relatively shorter time. From this point of view, the 10 wt% C/g-C3N4 composite synthesized in this research is a promising material to be applied commercially as a sonocatalyst owing to the fact that it could be categorized as a green material which involves the usage of renewable materials.

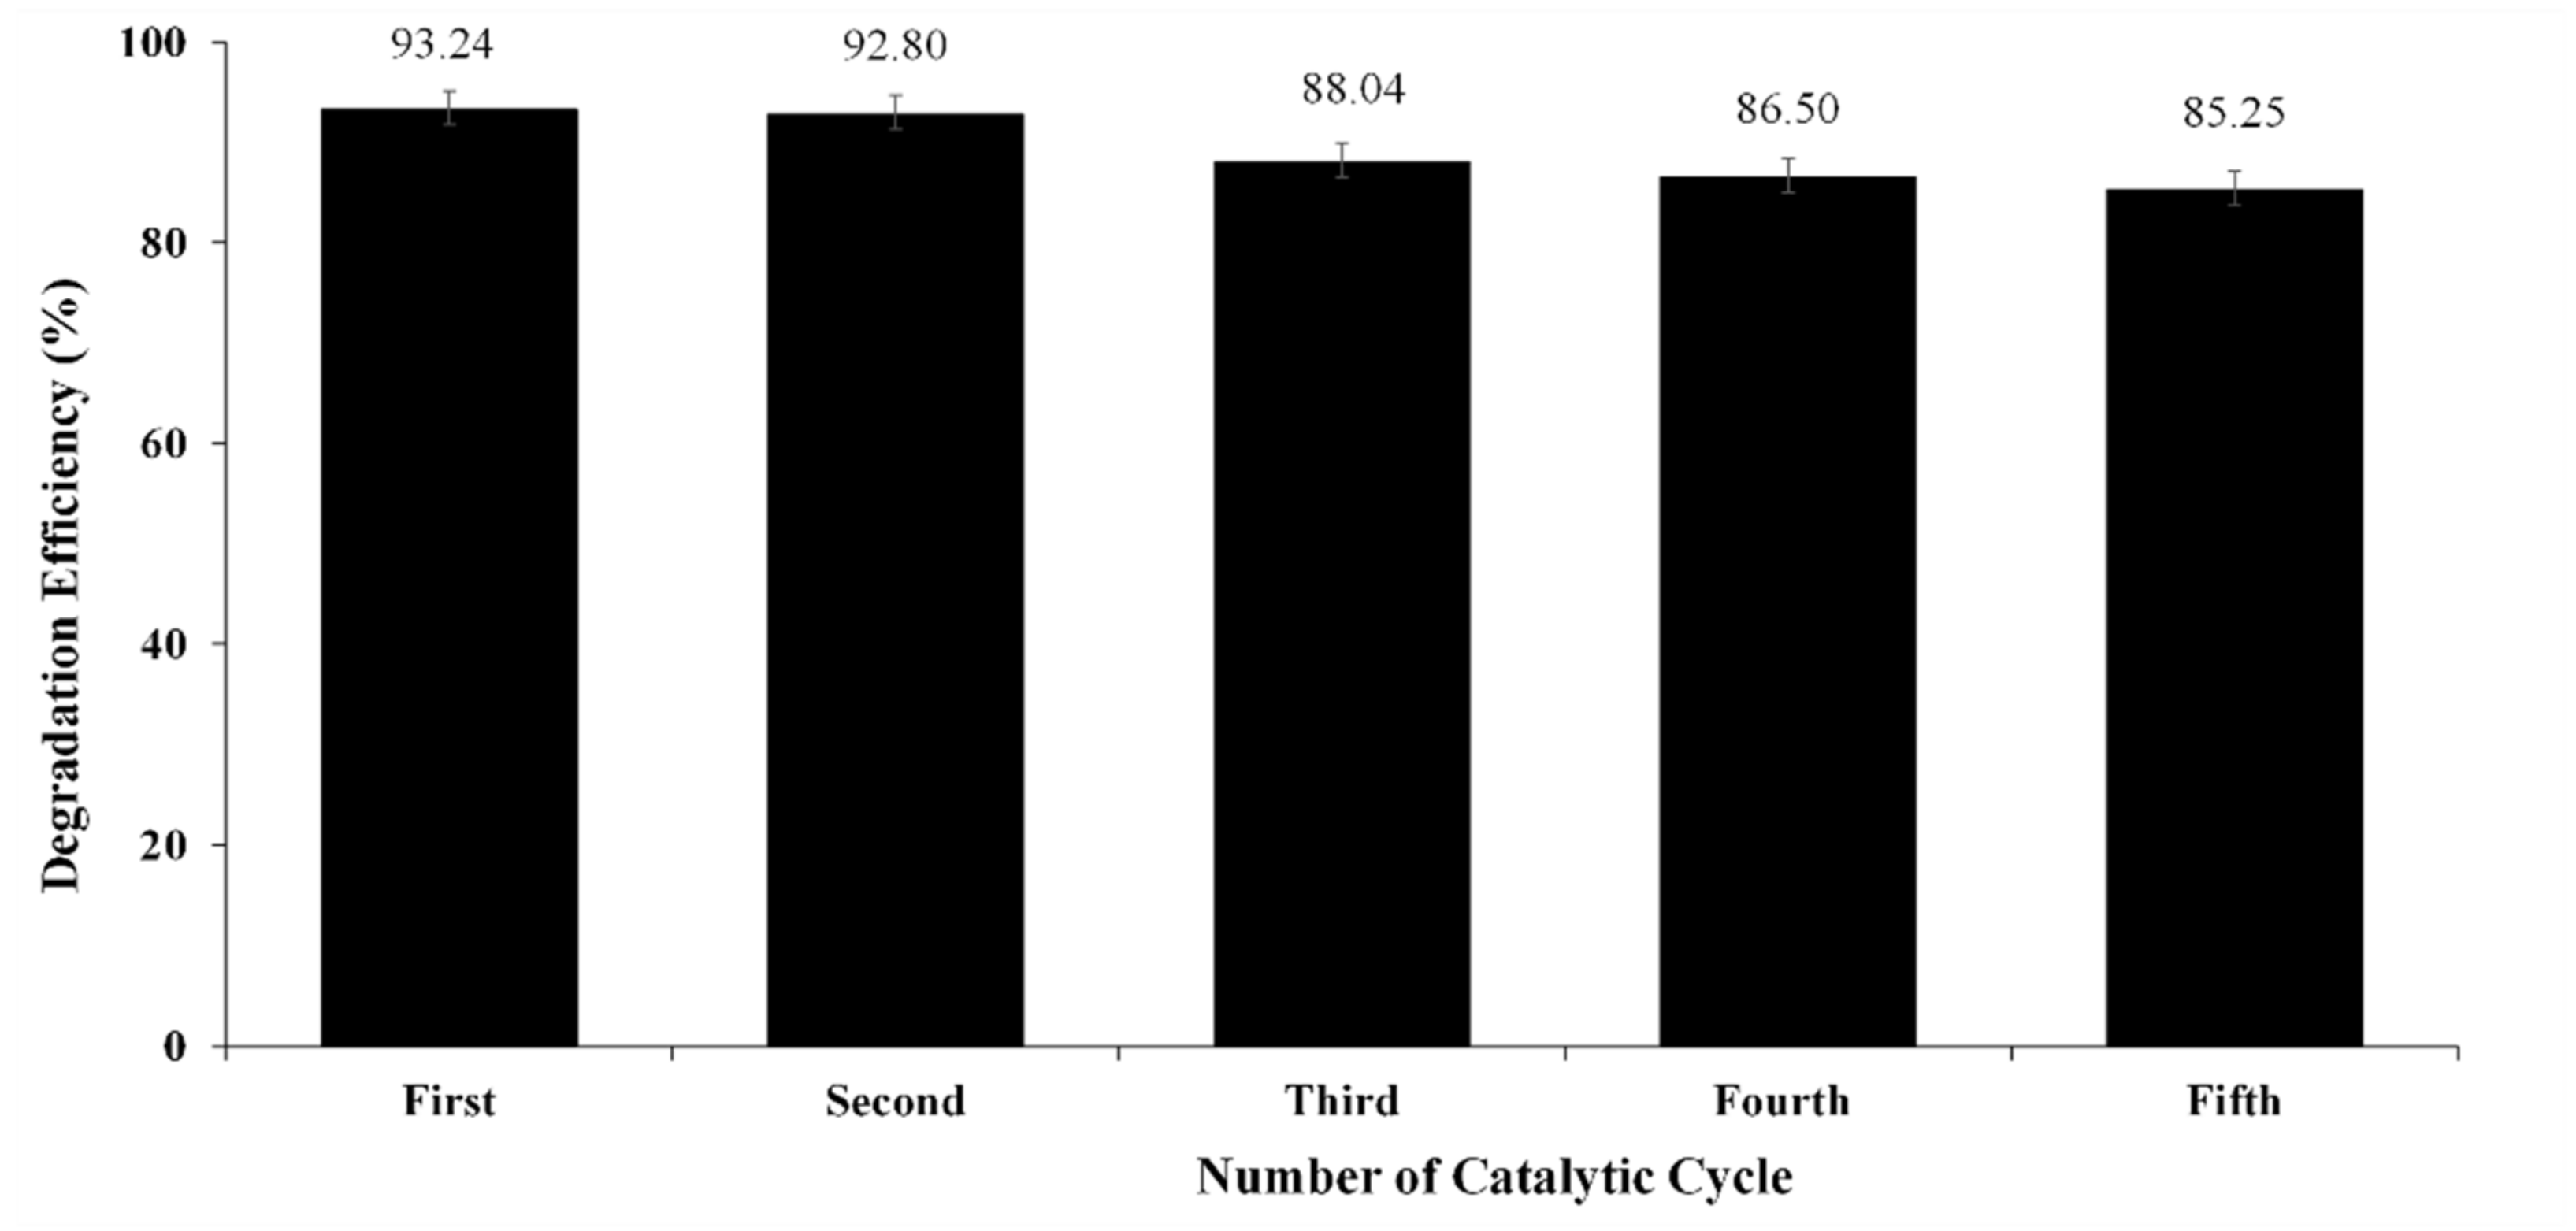
3.4. Reusability Study and Economic Analysis of 10 wt% C/g-C3N4 Catalyst

The reusability of a catalyst was an important factor to determine the stability and practicality of using the studied catalyst for wastewater treatment processes. Although the cost of producing 10 wt% C/g-C3N4 was low since it was derived from biomass and urea, the reusability of the catalyst was still an important factor to reduce waste production.
Figure 9 shows the reusability study of the synthesized composite by carrying out five consecutive runs of the experiment. The degradation efficiency for the first, second, third, fourth and fifth run were 93.24%, 92.80%, 88.04%, 86.50% and 85.25%, respectively. The stability of the prepared 10 wt% C/g-C3N4 as sonocatalyst was confirmed owing to the insignificant decline in the degradation efficiency of malachite green (<10%) after five consecutive runs. The decrement in degradation efficiency for the reused runs could be explained by two factors. The first factor was the loss of catalyst during the centrifugation and rinsing process [43]. The loss of catalyst was caused by the hydrophilicity of the 10 wt% C/g-C3N4. The presence of functional groups such as carbonyl (C = O), hydroxyl (-OH) on the catalyst surface caused the catalyst to be hydrophilic. The reused sample would have a lower initial catalyst loading for each repeated run since it could be washed away easily by forming hydrogen bonds with water molecules [44]. The second factor was the partial disintegration of the catalyst caused by ultrasonic irradiation. The propagation of ultrasound waves created a mechanical force that would partially disintegrate the catalyst surface. The disintegration effect would disrupt the active sites of the catalyst and inhibit the generation of free radicals [45].
The application of the sonocatalysis process on a large economic scale might be hampered by high costs due to a lack of proper reactor design strategies. However, Abdurahman et al. reported that it is an economically feasible decomposition treatment technology if a well-formulated cost objective function involving specific energy consumption per amount of materials is produced. Table 5 shows the cost estimation for the sonocatalytic degradation of malachite green using 10 wt% C/g-C3N4. The production cost of 10 wt% C/g-C3N4 was approximately MYR 1610.72/kg which was equivalent to USD 384.88/kg. The production of 10 wt% C/g-C3N4 was more cost effective as compared to other metal catalysts such as Ag2O/CuO (USD 5435/kg) [46] and Bi2WO6/Au (USD 678/kg) [47]. In addition, the cost for sonocatalytic degradation of malachite green was estimated to be MYR 317.07/m3 or USD 75.77/m3. Together with the relatively low catalyst production cost and sonocatalytic degradation cost, 10 wt% C/g-C3N4 was a promising material that could be applied as sonocatalyst in the commercial wastewater treatment.

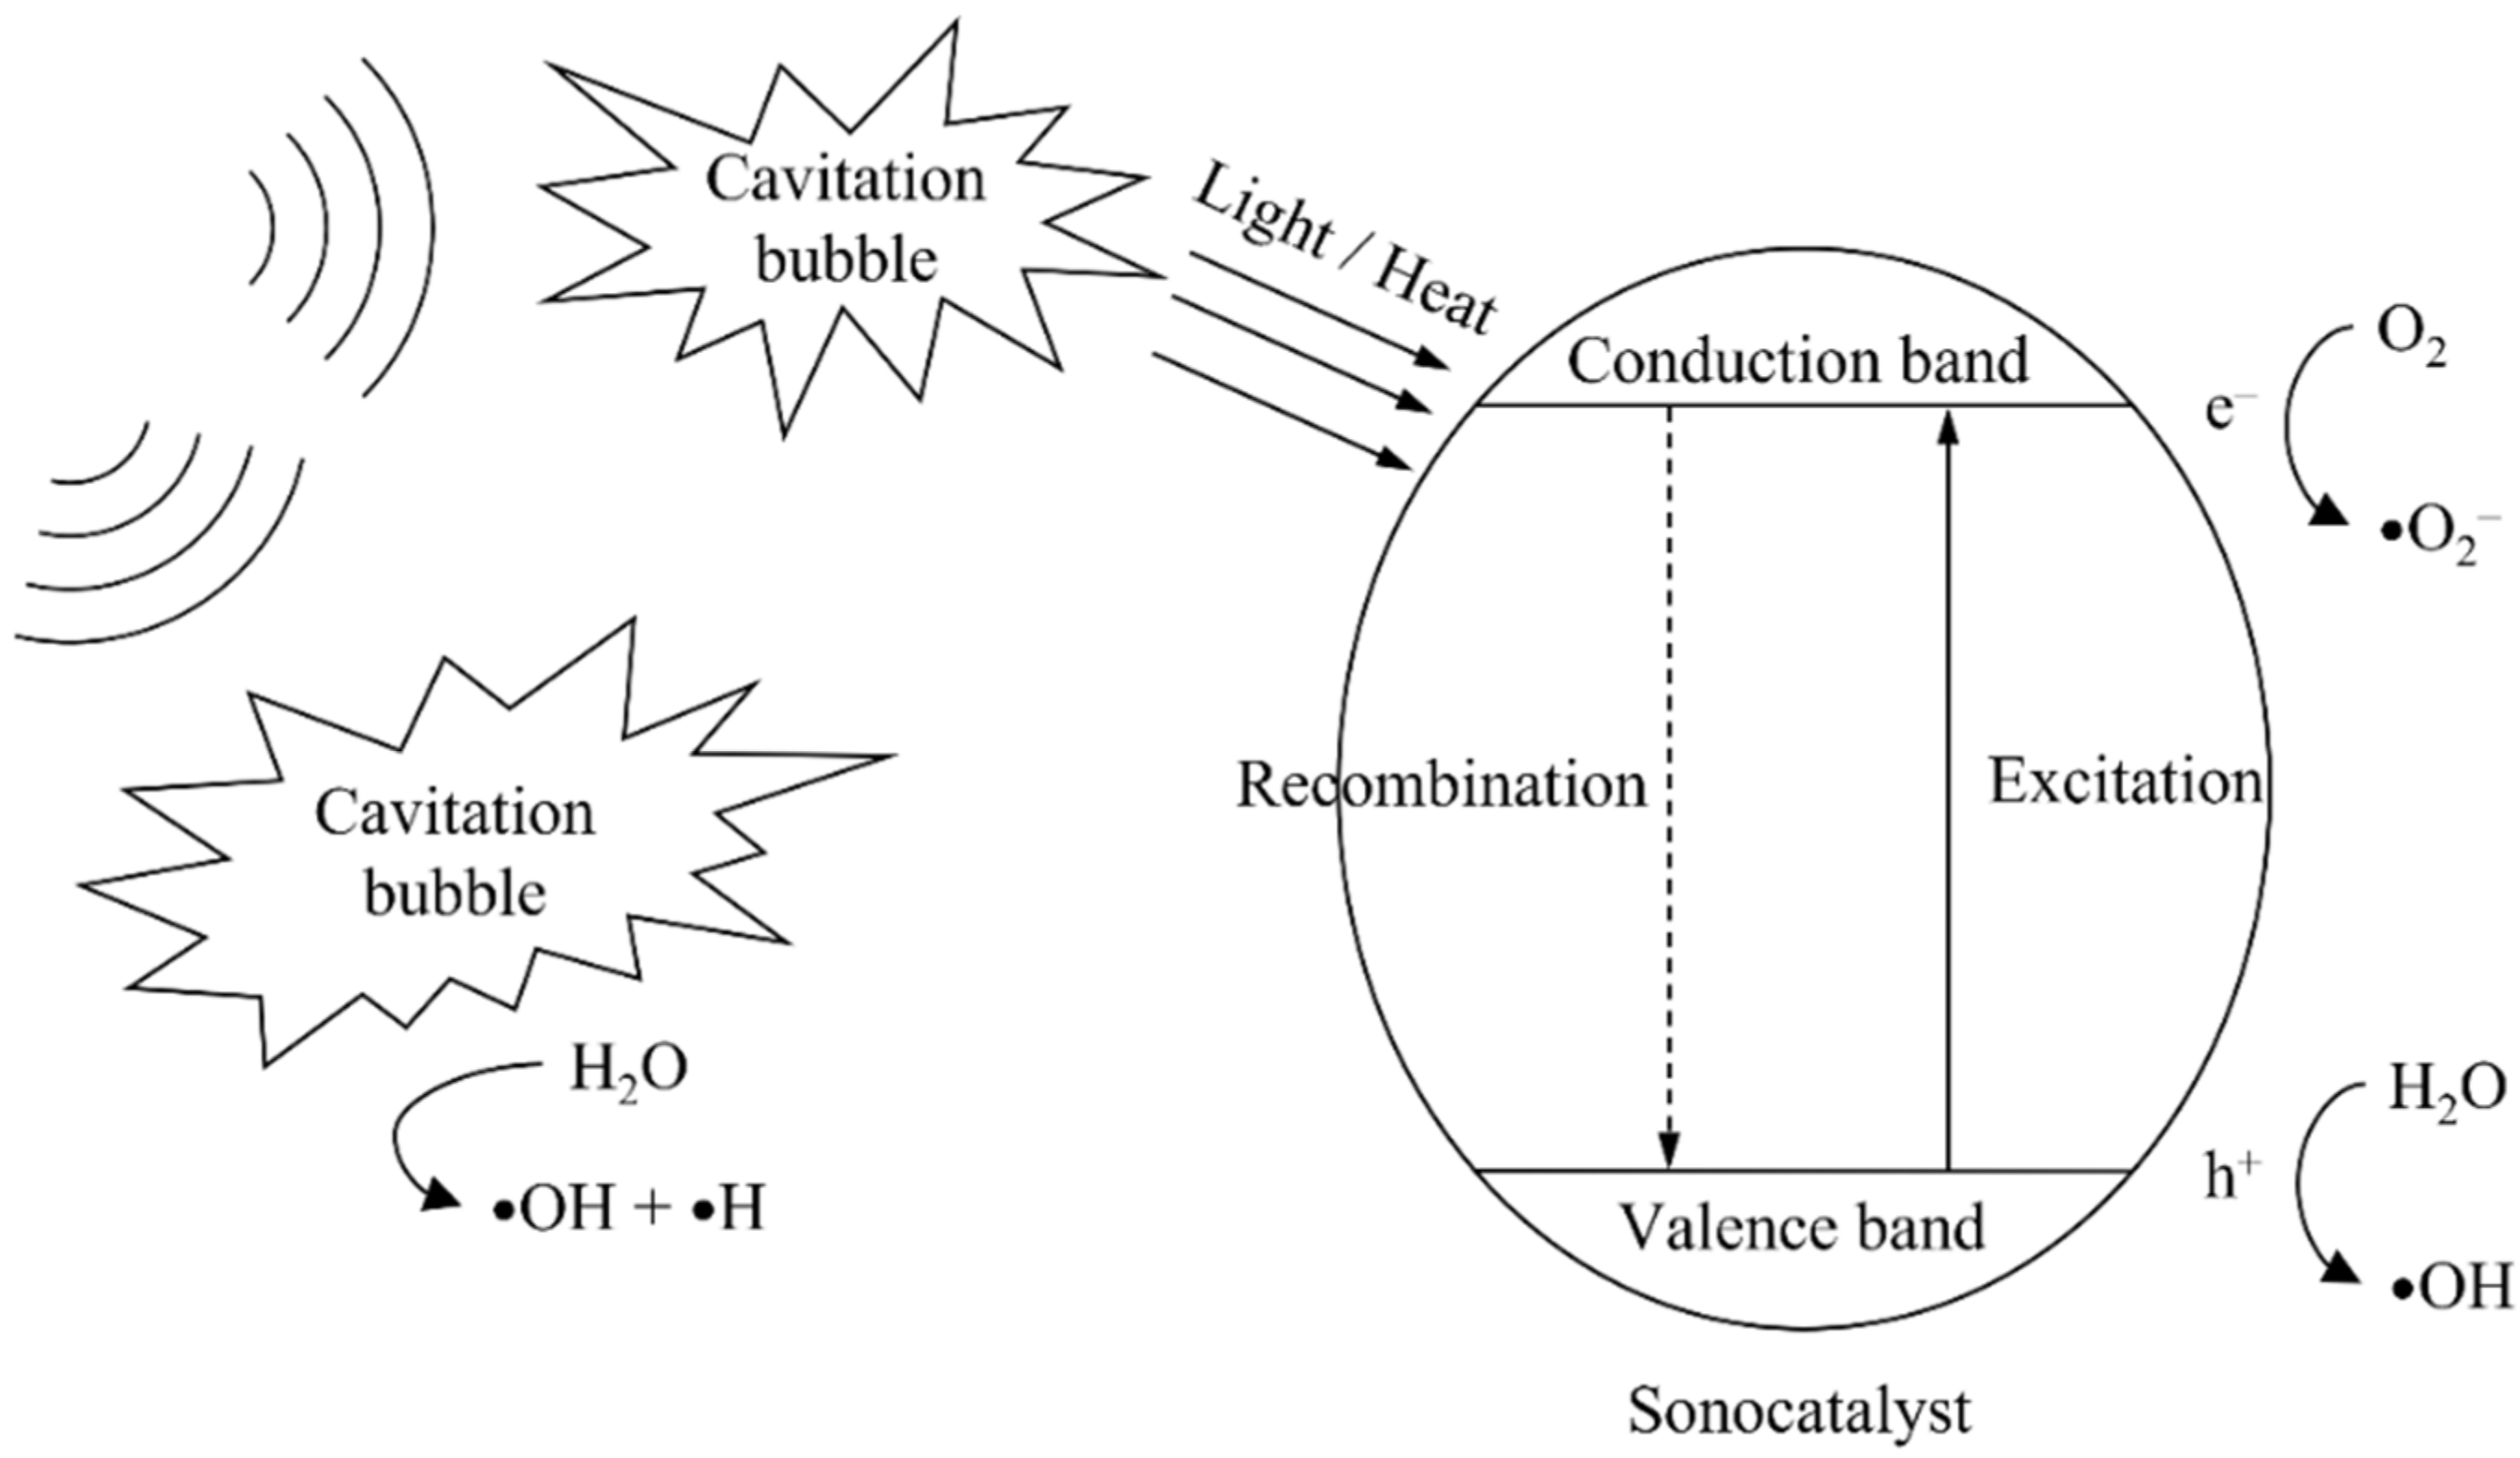
3.5. Possible Mechanisms for Degradation of Malachite Green

Figure 10 shows the possible sonocatalytic degradation mechanism in water. There are two possible mechanisms to degrade the malachite green molecule. The first mechanism requires the presence of 10 wt% C/g-C3N4. The sonocatalyst would absorb the energy released from the collapse of the cavitation bubble in the form of heat and sonoluminescence [6]. Once the energy is absorbed, the electrons in the valence band (VB) of the sonocatalyst would be excited to the conduction band (CB) which would leave a positively charged hole at the VB. This would cause the formation of the electron-hole pair [31]. The electron in the CB has strong reduction potential that would reduce the oxygen present in the solution to a free radical that is known as a superoxide radical (•O2). The holes left in the VB would have high oxidizing potential that would be able to oxidize the water molecules and produce •OH [26]. The free radicals generated would degrade the dye molecule to carbon dioxide and water molecules. The second mechanism is the generation of •OH and •H radicals through water pyrolysis under ultrasonic irradiation which is known as sonolysis [35]. Both mechanisms lead to the generation of radicals which implies that malachite green molecules are degraded by the free radicals in the solution.

4. Conclusions

In this study, pure carbon was synthesized successfully using coconut shell husk. Pure carbon was added to g-C3N4 to form C/g-C3N4 composites at different weight percentages. Among the synthesized samples, 10 wt% C/g-C3N4 showed the best sonocatalytic degradation efficiency of malachite green with a value of 93.44%. The addition of H2O2 during the sonocatalytic degradation of malachite green could accelerate the degradation efficiency up to 100%. By the means of RSM, an optimization study was conducted including three experimental parameters which were initial dye concentration (20 to 25 ppm), initial catalyst loading (0.3 to 0.5 g/L), and solution pH (4 to 8). A CCD model was constructed successfully and fitted well to the experimental data with high R2 value (0.9862). The optimum degradation efficiency of malachite green was found to be 97.11% at 20 ppm of initial dye concentration, 0.5 g/L of catalyst loading and a solution pH of 8. In the reusability test, the sample showed high stability in the sonocatalytic degradation performance even after five catalytic cycles.

Author Contributions

Data curation, S.L.; methodology, Y.L.P.; resources, Y.L.P.; visualization, S.L. and W.C.C.; writing original draft, A.Z.Y.K.; writing review and editing, Y.Y.C. All authors have read and agreed to the published version of the manuscript.

Funding

This research was funded by Ministry of Education (MOE) Malaysia that provided the Fundamental Research Grant Scheme (FRGS/1/2018/TK10/UTAR/02/2), Universiti Tunku Abdul Rahman (UTAR) Research Fund (IPSR/RMC/UTARRF/2020-C2/P01) and Kurita Water and Environment Foundation (KWEF) that provided the Overseas Research Grant (21Pmy076-25K).

Institutional Review Board Statement

Not applicable.

Informed Consent Statement

Not applicable.

Data Availability Statement

The data presented in this study are available on request from the corresponding author.

Acknowledgments

The authors would like to thank the Ministry of Education (MOE) Malaysia that provided the Fundamental Research Grant Scheme (FRGS/1/2018/TK10/UTAR/02/2), the Universiti Tunku Abdul Rahman (UTAR) Research Fund (IPSR/RMC/UTARRF/2020-C2/P01) and Kurita Water and Environment Foundation (KWEF) that provided the Overseas Research Grant (21Pmy076) for the financial support.

Conflicts of Interest

The authors declare no conflict of interest.

References

  1. Razak, M.R.; Aris, A.Z.; Zakaria, N.A.C.; Wee, S.Y.; Ismail, N.A.H. Accumulation and risk assessment of heavy metals employing species sensitivity distributions in Linggi River, Negeri Sembilan, Malaysia. Ecotoxicol. Environ. Saf. 2021, 211, 111905. [Google Scholar] [CrossRef] [PubMed]
  2. Joshi, P.; Sharma, O.P.; Ganguly, S.K.; Srivastava, M.; Khatri, O.P. Fruit waste-derived cellulose and graphene-based aerogels: Plausible adsorption pathways for fast and efficient removal of organic dyes. J. Colloid Interface Sci. 2021, 608, 2870–2883. [Google Scholar] [CrossRef] [PubMed]
  3. Naseeb, F.; Ali, N.; Khalil, A.; Khan, A.; Asiri, A.M.; Kamal, T.; Bakhsh, E.M.; Ul-Islam, M. Photocatalytic degradation of organic dyes by U3MnO10 nanoparticles under UV and sunlight. Inorg. Chem. Commun. 2021, 134, 109075. [Google Scholar] [CrossRef]
  4. Anantha, M.S.; Jayanth, V.; Olivera, S.; Anarghya, D.; Venkatesh, K.; Jayanna, B.K.; Sachin, H.P.; Muralidhara, H.B. Microwave treated Bermuda grass as a novel photocatalyst for the treatment of methylene blue dye from wastewater. Environ. Nanotechnol. Monit. Manag. 2021, 15, 100447. [Google Scholar] [CrossRef]
  5. Göçenoğlu Sarıkaya, A.; Erden Kopar, E. Biosorption of Sirius Blue azo-dye by Agaricus campestris biomass: Batch and continuous column studies. Mater. Chem. Phys. 2022, 276, 125381. [Google Scholar] [CrossRef]
  6. Sadeghi Rad, T.; Ansarian, Z.; Khataee, A.; Vahid, B.; Doustkhah, E. N-doped graphitic carbon as a nanoporous MOF-derived nanoarchitecture for the efficient sonocatalytic degradation process. Sep. Purif. Technol. 2021, 256, 117811. [Google Scholar] [CrossRef]
  7. Yang, F.; Jiang, G.; Chang, Q.; Huang, P.; Lei, M. Fe/N-doped carbon magnetic nanocubes toward highly efficient selective decolorization of organic dyes under ultrasonic irradiation. Chemosphere 2021, 283, 131154. [Google Scholar] [CrossRef]
  8. Yu, Y.; Zhu, Z.; Fan, W.; Liu, Z.; Yao, X.; Dong, H.; Li, C.; Huo, P. Making of a metal-free graphitic carbon nitride composites based on biomass carbon for efficiency enhanced tetracycline degradation activity. J. Taiwan Inst. Chem. Eng. 2018, 89, 151–161. [Google Scholar] [CrossRef]
  9. Mandal, A.; Mandi, S.; Mukherjee, B. Ultrasound aided sonocatalytic degradation of Rhodamine B with graphitic carbon nitride wrapped zinc sulphide nanocatalyst. Ceram. Int. 2021, 48, 10271–10279. [Google Scholar] [CrossRef]
  10. Eshaq, G.; ElMetwally, A.E. Bmim[OAc]-Cu2O/g-C3N4 as a multi-function catalyst for sonophotocatalytic degradation of methylene blue. Ultrason. Sonochem. 2019, 53, 99–109. [Google Scholar] [CrossRef]
  11. Meng, L.; Yin, W.; Wang, S.; Wu, X.; Hou, J.; Yin, W.; Feng, K.; Ok, Y.S.; Wang, X. Photocatalytic behavior of biochar-modified carbon nitride with enriched visible-light reactivity. Chemosphere 2020, 239, 124713. [Google Scholar] [CrossRef]
  12. Chhabra, T.; Dhingra, S.; Nagaraja, C.M.; Krishnan, V. Influence of Lewis and Brønsted acidic sites on graphitic carbon nitride catalyst for aqueous phase conversion of biomass derived monosaccharides to 5-hydroxymethylfurfural. Carbon N. Y. 2021, 183, 984–998. [Google Scholar] [CrossRef]
  13. Tyborski, T.; Merschjann, C.; Orthmann, S.; Yang, F.; Lux-Steiner, M.; Th, S. Crystal Structure of Polymeric Carbon Nitride and the Determination of Its Process-Temperature-Induced Modifications. J. Phys. Condens. Matter 2013, 25, 395402. [Google Scholar] [CrossRef] [Green Version]
  14. Luo, S.; Li, S.; Zhang, S.; Cheng, Z.; Nguyen, T.T.; Guo, M. Visible-light-driven Z-scheme protonated g-C3N4/wood flour biochar/BiVO4 photocatalyst with biochar as charge-transfer channel for enhanced RhB degradation and Cr(VI) reduction. Sci. Total Environ. 2022, 806, 150662. [Google Scholar] [CrossRef]
  15. Karpuraranjith, M.; Chen, Y.; Ramadoss, M.; Wang, B.; Yang, H.; Rajaboopathi, S.; Yang, D. Magnetically recyclable magnetic biochar graphitic carbon nitride nanoarchitectures for highly efficient charge separation and stable photocatalytic activity under visible-light irradiation. J. Mol. Liq. 2021, 326, 115315. [Google Scholar] [CrossRef]
  16. Liu, Y.; Zhao, S.; Zhang, C.; Fang, J.; Xie, L.; Zhou, Y.; Zhuo, S. Hollow tubular carbon doping graphitic carbon nitride with adjustable structure for highly enhanced photocatalytic hydrogen production. Carbon N. Y. 2021, 182, 287–296. [Google Scholar] [CrossRef]
  17. Xiao, Y.; Lyu, H.; Yang, C.; Zhao, B.; Wang, L.; Tang, J. Graphitic carbon nitride/biochar composite synthesized by a facile ball-milling method for the adsorption and photocatalytic degradation of enrofloxacin. J. Environ. Sci. 2021, 103, 93–107. [Google Scholar] [CrossRef]
  18. Lin, M.; Li, F.; Cheng, W.; Rong, X.; Wang, W. Facile preparation of a novel modified biochar-based supramolecular self-assembled g-C3N4 for enhanced visible light photocatalytic degradation of phenanthrene. Chemosphere 2021, 288, 132620. [Google Scholar] [CrossRef]
  19. Ahmad, A.; Al-Swaidan, H.M.; Alghamdi, A.H.; Alotaibi, K.M.; Alswieleh, A.M.; Albalwi, A.N.; Bajuayfir, E. Efficient sequester of hexavalent chromium by chemically active carbon from waste valorization (Phoenix Dactylifera). J. Anal. Appl. Pyrolysis 2021, 155, 105075. [Google Scholar] [CrossRef]
  20. Verma, R.; Maji, P.K.; Sarkar, S. Comprehensive investigation of the mechanism for Cr(VI) removal from contaminated water using coconut husk as a biosorbent. J. Clean. Prod. 2021, 314, 128117. [Google Scholar] [CrossRef]
  21. Ragupathi, V.; Madhu babu, M.; Panigrahi, P.; Ganapathi Subramaniam, N. Scalable fabrication of graphitic-carbon nitride thin film for optoelectronic application. Mater. Today Proc. 2021. [Google Scholar] [CrossRef]
  22. Lu, Y.; Wang, W.; Cheng, H.; Qiu, H.; Sun, W.; Fang, X.; Zhu, J.; Zheng, Y. Bamboo-charcoal-loaded graphitic carbon nitride for photocatalytic hydrogen evolution. Int. J. Hydrog. Energy 2021, 47, 3733–3740. [Google Scholar] [CrossRef]
  23. Guo, F.; Shi, C.; Sun, W.; Liu, Y.; Shi, W.; Lin, X. Pomelo biochar as an electron acceptor to modify graphitic carbon nitride for boosting visible-light-driven photocatalytic degradation of tetracycline. Chin. J. Chem. Eng. 2021, 47, 3733–3740. [Google Scholar] [CrossRef]
  24. Li, K.; Huang, Z.; Zhu, S.; Luo, S.; Yan, L.; Dai, Y.; Guo, Y.; Yang, Y. Removal of Cr (VI) from water by a biochar-coupled g-C3N4 nanosheets composite and performance of a recycled photocatalyst in single and combined pollution systems. Appl. Catal. B Environ. 2019, 243, 386–396. [Google Scholar] [CrossRef]
  25. Wu, H.; Zhang, W.; Zhang, H.; Pan, Y.; Yang, X.; Pan, Z.; Yu, X.; Wang, D. Preparation of the novel g-C3N4 and porous polyimide supported hydrotalcite-like compounds materials for water organic contaminants removal. Colloids Surf. A Physicochem. Eng. Asp. 2020, 607, 125517. [Google Scholar] [CrossRef]
  26. Hassandoost, R.; Kotb, A.; Movafagh, Z.; Esmat, M.; Guegan, R.; Endo, S.; Jevasuwan, W.; Fukata, N.; Sugahara, Y.; Khataee, A.; et al. Nanoarchitecturing bimetallic manganese cobaltite spinels for sonocatalytic degradation of oxytetracycline. Chem. Eng. J. 2022, 431, 133851. [Google Scholar] [CrossRef]
  27. Yadav, A.A.; Hunge, Y.M.; Kang, S.-W. Porous nanoplate-like tungsten trioxide/reduced graphene oxide catalyst for sonocatalytic degradation and photocatalytic hydrogen production. Surf. Interfaces 2021, 24, 101075. [Google Scholar] [CrossRef]
  28. Alexpandi, R.; Abirami, G.; Balaji, M.; Jayakumar, R.; Ponraj, J.G.; Cai, Y.; Pandian, S.K.; Ravi, A.V. Sunlight-active phytol-ZnO@TiO2 nanocomposite for photocatalytic water remediation and bacterial-fouling control in aquaculture: A comprehensive study on safety-level assessment. Water Res. 2022, 212, 118081. [Google Scholar] [CrossRef]
  29. Lee, S.; Park, J.-W. Hematite/graphitic carbon nitride nanofilm for fenton and photocatalytic oxidation of methylene blue. Sustainability 2020, 12, 2866. [Google Scholar] [CrossRef] [Green Version]
  30. Xin, S.; Ma, B.; Liu, G.; Ma, X.; Zhang, C.; Ma, X.; Gao, M.; Xin, Y. Enhanced heterogeneous photo-Fenton-like degradation of tetracycline over CuFeO2/biochar catalyst through accelerating electron transfer under visible light. J. Environ. Manage. 2021, 285, 112093. [Google Scholar] [CrossRef]
  31. Khataee, A.; Fazli, A.; Zakeri, F.; Joo, S.W. Synthesis of a high-performance Z-scheme 2D/2D WO3@CoFe-LDH nanocomposite for the synchronic degradation of the mixture azo dyes by sonocatalytic ozonation process. J. Ind. Eng. Chem. 2020, 89, 301–315. [Google Scholar] [CrossRef]
  32. Sadeghi Rad, T.; Khataee, A.; Arefi-Oskoui, S.; Sadeghi Rad, S.; Orooji, Y.; Gengec, E.; Kobya, M. Graphene-based ZnCr layered double hydroxide nanocomposites as bactericidal agents with high sonophotocatalytic performances for degradation of rifampicin. Chemosphere 2022, 286, 131740. [Google Scholar] [CrossRef] [PubMed]
  33. Cheng, Z.; Luo, S.; Li, X.; Zhang, S.; Thang Nguyen, T.; Guo, M.; Gao, X. Ultrasound-assisted heterogeneous Fenton-like process for methylene blue removal using magnetic MnFe2O4/biochar nanocomposite. Appl. Surf. Sci. 2021, 566, 150654. [Google Scholar] [CrossRef]
  34. Bampos, G.; Frontistis, Z. Sonocatalytic degradation of butylparaben in aqueous phase over Pd/C nanoparticles. Environ. Sci. Pollut. Res. Int. 2019, 26, 11905–11919. [Google Scholar] [CrossRef]
  35. Karaca, S.; Önal, E.Ç.; Açışlı, Ö.; Khataee, A. Preparation of chitosan modified montmorillonite biocomposite for sonocatalysis of dyes: Parameters and degradation mechanism. Mater. Chem. Phys. 2021, 260, 124125. [Google Scholar] [CrossRef]
  36. Samanta, M.; Mukherjee, M.; Ghorai, U.K.; Bose, C.; Chattopadhyay, K.K. Room temperature processed copper phthalocyanine nanorods: A potential sonophotocatalyst for textile dye removal. Mater. Res. Bull. 2020, 123, 110725. [Google Scholar] [CrossRef]
  37. Karim, A.V.; Shriwastav, A. Degradation of amoxicillin with sono, photo, and sonophotocatalytic oxidation under low-frequency ultrasound and visible light. Environ. Res. 2021, 200, 111515. [Google Scholar] [CrossRef]
  38. Ghalamchi, L.; Aber, S. An aminated silver orthophosphate/graphitic carbon nitride nanocomposite: An efficient visible light sonophotocatalyst. Mater. Chem. Phys. 2020, 256, 123649. [Google Scholar] [CrossRef]
  39. Zhang, T.; Jin, X.; Owens, G.; Chen, Z. Remediation of malachite green in wastewater by ZIF-8@Fe/Ni nanoparticles based on adsorption and reduction. J. Colloid Interface Sci. 2021, 594, 398–408. [Google Scholar] [CrossRef]
  40. Pandey, S.K.; Tripathi, M.K.; Ramanathan, V.; Mishra, P.K.; Tiwary, D. Enhanced photocatalytic efficiency of hydrothermally synthesized g-C3N4/NiO heterostructure for mineralization of malachite green dye. J. Mater. Res. Technol. 2021, 11, 970–981. [Google Scholar] [CrossRef]
  41. Li, Y.; Wang, X.; Wang, X.; Xia, Y.; Zhang, A.; Shi, J.; Gao, L.; Wei, H.; Chen, W. Z-scheme BiVO4/g-C3N4 heterojunction: An efficient, stable and heterogeneous catalyst with highly enhanced photocatalytic activity towards Malachite Green assisted by H2O2 under visible light. Colloids Surf. A Physicochem. Eng. Asp. 2021, 618, 126445. [Google Scholar] [CrossRef]
  42. De Andrade, F.V.; De Oliveira, A.B.; Siqueira, G.O.; Lage, M.M.; De Freitas, M.R.; De Lima, G.M.; Nuncira, J. MnFe2O4 nanoparticulate obtained by microwave-assisted combustion: An efficient magnetic catalyst for degradation of malachite green cationic dye in aqueous medium. J. Environ. Chem. Eng. 2021, 9, 106232. [Google Scholar] [CrossRef]
  43. Moradi, S.; Sobhgol, S.A.; Hayati, F.; Isari, A.A.; Kakavandi, B.; Bashardoust, P.; Anvaripour, B. Performance and reaction mechanism of MgO/ZnO/Graphene ternary nanocomposite in coupling with LED and ultrasound waves for the degradation of sulfamethoxazole and pharmaceutical wastewater. Sep. Purif. Technol. 2020, 251, 117373. [Google Scholar] [CrossRef]
  44. Thue, P.S.; Lima, E.C.; Sieliechi, J.M.; Saucier, C.; Dias, S.L.P.; Vaghetti, J.C.P.; Rodembusch, F.S.; Pavan, F.A. Effects of first-row transition metals and impregnation ratios on the physicochemical properties of microwave-assisted activated carbons from wood biomass. J. Colloid Interface Sci. 2017, 486, 163–175. [Google Scholar] [CrossRef]
  45. Chu, J.-H.; Kang, J.-K.; Park, S.-J.; Lee, C.-G. Application of magnetic biochar derived from food waste in heterogeneous sono-Fenton-like process for removal of organic dyes from aqueous solution. J. Water Process Eng. 2020, 37, 101455. [Google Scholar] [CrossRef]
  46. Akram, N.; Guo, J.; Guo, Y.; Kou, Y.; Suleman, H.; Wang, J. Enhanced synergistic catalysis of novel Ag2O/CuO nanosheets under visible light illumination for the photodecomposition of three dyes. J. Environ. Chem. Eng. 2021, 9, 104824. [Google Scholar] [CrossRef]
  47. Tian, Y.; Ma, L.; Tian, X.; Nie, Y.; Yang, C.; Li, Y.; Lu, L.; Zhou, Z. More reactive oxygen species generation facilitated by highly dispersed bimodal gold nanoparticle on the surface of Bi2WO6 for enhanced photocatalytic degradation of ofloxacin in water. Chemosphere 2021, 269, 128717. [Google Scholar] [CrossRef]
Figure 1. XRD patterns of pure g-C3N4, pure carbon, and C/g-C3N4 composites at different weight percentages.
Sustainability 14 03244 g001
Figure 2. SEM images of (a) pure g-C3N4, (b) 1 wt% C/g-C3N4, (c) 5 wt% C/g-C3N4, (d) 10 wt% C/g-C3N4, (e) 15 wt% C/g-C3N4, (f) 20 wt% C/g-C3N4, (g) 25 wt% C/g-C3N4 and (h) pure carbon.
Sustainability 14 03244 g002
Figure 3. FTIR results of pure g-C3N4, pure carbon, and C/g-C3N4 composites at different weight percentages.
Sustainability 14 03244 g003
Figure 4. (a) Nitrogen adsorption-desorption isotherms and (b) pore size distribution curves of g-C3N4 and 10 wt% C/g-C3N4.
Sustainability 14 03244 g004
Figure 5. TGA curves of pure g-C3N4, pure carbon and 10 wt% C/g-C3N4.
Sustainability 14 03244 g005
Figure 6. Degradation efficiency of carbon amount composited with g-C3N4 (initial malachite green concentration = 15 ppm, initial catalyst loading = 0.3 g/L, and natural solution pH for 10 min).
Sustainability 14 03244 g006
Figure 7. Degradation efficiency of malachite green with different H2O2 dosage by using 10 wt% C/g-C3N4 (initial dye concentration = 15 ppm, initial catalyst loading = 0.3 g/L, and natural solution pH for 10 min).
Sustainability 14 03244 g007
Figure 8. Three-dimensional response surface plot of degradation efficiency of malachite green against (a) solution pH and initial dye concentration at constant initial catalyst loading = 0.4 g/L and (b) solution pH and initial catalyst dosage at initial dye concentration = 22.5 ppm.
Sustainability 14 03244 g008
Figure 9. Degradation efficiency of malachite green with five reusability catalytic cycles (initial dye concentration = 15 ppm, initial catalyst loading = 1 g/L, and natural solution pH for 10 min).
Sustainability 14 03244 g009
Figure 10. Mechanism of sonocatalytic dye degradation.
Sustainability 14 03244 g010
Table 1. EDX results of the synthesized samples.
SamplesCarbonNitrogen
wt%at %wt%at %
Pure g-C3N443.8147.6256.1952.38
1 wt% C/g-C3N449.1252.9650.8847.04
5 wt% C/g-C3N485.3187.1414.6912.86
10 wt% C/g-C3N487.4289.0112.5810.99
15 wt% C/g-C3N488.2289.7211.7810.28
20 wt% C/g-C3N486.3088.0213.7011.98
25 wt% C/g-C3N489.7291.0610.288.94
Pure carbon97.8598.152.151.85
Table 2. Three factor CCD matrix and value of degradation efficiency.
Order No.Point TypeActual and Coded Independent Variable LevelsDegradation Efficiency, %Residuals
Initial Dye Concentration, ppm (X1)Initial Catalyst Loading, g/L (X2)Solution pH (X3)Experimental ValuesPredicted Values
1Factorial20.00 (−1)0.300 (−1)4.0 (−1)77.6277.540.08
2Factorial25.00 (+1)0.300 (−1)4.0 (−1)68.8668.030.83
3Factorial20.00 (−1)0.500 (+1)4.0 (−1)88.6986.961.73
4Factorial25.00 (+1)0.500 (+1)4.0 (−1)76.1277.46−1.34
5Factorial20.00 (−1)0.300 (−1)8.0 (+1)94.2394.42−0.19
6Factorial25.00 (+1)0.300 (-1)8.0 (+1)91.0791.55−0.48
7Factorial20.00 (−1)0.500 (+1)8.0 (+1)97.1196.690.42
8Factorial25.00 (+1)0.500 (+1)8.0 (+1)92.2193.82−1.61
9Axial18.30 (−1.682)0.400 (0)6.0 (0)91.8893.16−1.28
10Axial26.70 (+1.682)0.400 (0)6.0 (0)84.2382.751.48
11Axial22.50 (0)0.232 (−1.682)6.0 (0)83.6083.81−0.21
12Axial22.50 (0)0.568 (+1.682)6.0 (0)94.0593.640.41
13Axial22.50 (0)0.400 (0)2.6 (−1.682)65.9166.75−0.84
14Axial22.50 (0)0.400 (0)9.4 (+1.682)95.7394.701.03
15Centre22.50 (0)0.400 (0)6.0 (0)85.6485.69−0.05
16Centre22.50 (0)0.400 (0)6.0 (0)84.1985.69−1.50
17Centre22.50 (0)0.400 (0)6.0 (0)86.8585.691.16
18Centre22.50 (0)0.400 (0)6.0 (0)85.2385.69−0.46
19Centre22.50 (0)0.400 (0)6.0 (0)85.9685.690.27
20Centre22.50 (0)0.400 (0)6.0 (0)86.2285.690.53
Table 3. ANOVA results of sonocatalytic degradation of malachite green.
FactorsSum of SquaresDegree of FreedomMean SquareF ValueProbability,
p-Value
Modified Model1316.118164.5198.10<0.0001Significant
X1130.741130.7477.97<0.0001
X2116.721116.7269.60<0.0001
X3942.971942.97562.31<0.0001
X1X322.01122.0113.130.0040
X2X325.60125.6015.260.0024
X129.2819.285.530.0384
X2216.64116.649.920.0092
X3244.42144.4226.490.0003
Residual18.45111.68
Lack of fit14.2862.382.860.1345Insignificant
Pure error4.1650.83
Corrected Total1334.5519
R2 = 0.9862; adequate precision = 34.4670.
Table 4. Comparison of malachite green removal with other works.
MethodAdsorbent/CatalystInitial Dye Concentration (mg/L)Adsorbent/Catalyst Dosage (g/L)Process Time (mins)Removal Efficiency (%)Reference
AdsorptionZIF-8@fe/Ni501.03099.0[39]
PhotocatalysisBiVO4/g-C3N4301.06098.3[41]
Photocatalysisg-C3N4/NiO100.11296.0[40]
Heterogeneous catalysisMnFe2O4500.660~100[42]
Sonocatalysis10 wt% C/g-C3N4200.51097.11Current work
Table 5. Cost estimation for the production of 10 wt% C/g-C3N4 and sonocatalytic degradation of malachite green.
10 wt% C/g-C3N4 Production Cost
Materials/ProcessUnit CostUnitCost (MYR)
UreaMYR 33/500g5 g0.33
Coconut shell huskMYR 5/500g2.5 g0.03
Drying of coconut shell huskMYR 0.234/kWh1.4 kW; 2 days5.24
Pyrolysis of coconut shell huskMYR 0.234/kWh3.5 kW; 1 h0.82
Synthesis of 10 wt% C/g-C3N4MYR 0.234/kWh3.5 kW; 2 h1.64
Total cost to produce 5 g 10 wt% C/g-C3N48.05
Sonocatalytic Degradation of Malachite Green
10 wt% C/g-C3N4MYR 8.0536/5 g0.05 g for 5 cycles0.08
SonocatalysisMYR 0.234/kWh0.4 kW; 10 min; 5 cycles0.08
Total cost to degrade 500 mL MG0.16
Publisher’s Note: MDPI stays neutral with regard to jurisdictional claims in published maps and institutional affiliations.

