Case Report

Generation Expansion Planning Based on Local Renewable Energy Resources: A Case Study of the Isolated Ambon-Seram Power System

1
Department of Electrical and Information Engineering, Universitas Gadjah Mada, Grafika Street No. 2, Yogyakarta 55281, Indonesia
2
PT PLN (Persero), Trunojoyo Street, Blok M-I No. 135, South Jakarta, DKI Jakarta 12160, Indonesia
*
Author to whom correspondence should be addressed.
Sustainability 2022, 14(5), 3032; https://doi.org/10.3390/su14053032
Submission received: 10 December 2021 / Revised: 23 February 2022 / Accepted: 23 February 2022 / Published: 4 March 2022
(This article belongs to the Special Issue Biomass as a Renewable Power Source)

Abstract

:
Energy sustainability has become one of the main issues in power system planning in the Indonesian archipelago system, which has many small, isolated systems. For that purpose, green and sustainable generation expansion planning (GEP) procedures based on local energy resources is required. GEP is a necessary procedure for fulfilling electricity demand, which determines the generating units to be installed within a specified time horizon with minimal total costs as the objective function. This study uses GEP considering the interconnection option among the existing small scattered generation systems in Maluku: the isolated Ambon, Seram, Haruku, and Saparua systems. With interconnection, the utilization of local renewable energy sources would be increased, especially biomass, which has abundant potential in these areas. The GEP was simulated in the PLEXOS environment using mixed-integer linear programming (MILP). For comparison purposes, there were interconnection and isolated system scenarios. The results showed that the interconnection system would have a high share of a renewable energy source (RES) of up to 54% in 2050, most of which is biomass as the primary local energy source. The interconnection system scenario met the LOLP criteria and had a lower reserve margin and total costs than the isolated scenario, with USD 773.7 million.

1. Introduction

Maintaining energy sustainability has become one of the main issues in electrical power system planning, especially considering the low economic development of some areas and global environmental issues [1]. For these purposes, the utilization of RES for generating units has become a trend in today’s power system. Some countries require their utility companies to produce a specific proportion of RES generation in their generation systems to a certain value of the energy mixed. However, the availability of primary energy sources is crucial for ensuring sustainability, especially since many RES have intermittent characteristics [2], affecting the quality and quantity of the electrical power supply. Inadequate electricity supply would harm the economic activities in that area [3]. In a developing country such as Indonesia, the annual increase in electrical energy consumption reflects the national economic growth. The incremental growth in energy consumption comes from the residential sector, due to population growth, and the industrial and commercial sectors. The annual average economic growth in Indonesia of 6.3% caused the annual electricity sales increment (2012–2016) to increase to 6.7%, as asserted by [4].
GEP is an essential procedure for ensuring sustainable energy and determining the type, size, and quantity of generating units to install during a specified time horizon with minimum total costs as the objective function [3]. In developing countries, GEP has several problems to solve from both the government and the utility perspectives. For example, in archipelagos, the sustainability of the primary energy resource chain should be considered in the GEP procedure. Some primary energy resources are brought in from other regions, such as coal, oil, or liquid gas. For that reason, the electricity supply would also depend on the reliability of the transportation system. Furthermore, the GEP should also be environmentally friendly, as is the case in many countries such as the USA [5], Ireland [6], France [7], China [8,9,10], Brazil [11], Portugal [12], Egypt [13], Pakistan [14], Oman [15], South Africa [16], Bangladesh [17], Malaysia [18] and also in Indonesia [19,20,21,22,23]. For that reason, the composition of the energy mixed should be regulated, which is in line with Presidential Regulation of the Republic of Indonesia No. 61 of 2011, the national action plan for reducing greenhouse gas emissions [24], and Law No. 16 of 2016 [25]. These regulations were formulated on the basis of the Paris Agreement and the Kyoto Protocol, as the Government of the Republic of Indonesia has committed to reducing greenhouse gas emissions by 29% by 2030 [24,25]. Considering these regulations, the Government of Indonesia and PT Perusahaan Listrik Negara (PT PLN) have specified a minimum renewable energy mix of 23% by the end of 2025 and 31% by the end of 2050 based on references [26,27,28]. Moreover, the utilization of RES generating units is encouraged for fulfilling the commitment to reduce greenhouse gas emissions, as presented in [10,12]. For that reason, the proportion of RES in the energy mixed should increase.
Besides environmental issues and the RES energy mixed target, Indonesia also has problems related to geographical conditions, as it consists of at least 17,000 islands. Most of them are in the eastern part of Indonesia. Currently, the electric power system in the east part of Indonesia consists of more than 200 isolated systems. Moreover, most isolated systems are located separately in different islands, and most depend on fossil fuels such as coal or oil. On the other hand, the transportation cost of delivering the oil and coal to these islands is expensive. According to reference [29], East Indonesia is still dominated by diesel generating units with an installed capacity of up to 462.51 MW. For that reason, it is necessary to implement generation expansion planning based on the local green primary energy, such as biomass, wind, and solar energy, to ensure the system’s reliability. In addition, to optimize the full potential of local green primary energy resources, it is necessary to consider the interconnection between the isolated systems to share these primary energy resources among the regions. Moreover, the location of the local energy resources and the load center might be separated quite distantly.
Implementing long term generation expansion planning by considering the various primary energy resources and interconnection options between isolated areas is necessary to increase the full potential of biomass, solar and wind energy so that the development of a sustainable area/region can be ensured, especially in the scattered and isolated system of the eastern part of Indonesia, as presented in [30]. The optimization model of implementing the planning procedure should include reliability indexes such as reserve margin and the loss of load probability (LOLP). In addition, the proportion of RES energy in the mix could also be included in the optimization model as a constraint.
Considering the RES generating unit has intermittent characteristics, the optimization problem is more challenging. Multiobjective approaches for solving this GEP condition were carried out in [11,12]. In this condition, systems should have flexibility through including conventional generating units and transmission systems to achieve a high proportion of RES generation, as presented in [31]. One of the tools used to execute the GEP optimization procedure is OSeMOSYS. Previous research with RES generating units as fixed plant inputs implemented the optimization procedure for the Java–Bali and Sulawesi electricity systems [19,22]. However, the number and size of the generating units could not be determined using the optimization procedure. The optimization procedure could only decide the size and number of thermal generating units. In addition, research on GEP optimization considering RES, including the intermittent characteristics, has been carried out in several countries. Researchers in China developed GEP optimization by considering the integration of renewable energy. The GEP procedure was carried out by considering the external costs from the environmental impact, as presented in [8]. In [10], the researcher solved the problem of long term GEP in China by using a statistical residual load duration curve (S-RLDC). S-RLDC is a technique used to simplify the load duration curve method. In this study, solar and wind energy were included in the planning calculation as a negative load. A GEP procedure also integrated RES generation units in the electricity system of Portugal by considering the inclusion of electrical power generation scheduling, as presented in [12]. The authors of [11] conducted a GEP procedure in Brazil considering several objectives, including RES generating units that were completed simultaneously. The objectives’ function included minimizing the costs, maximizing generation during peak loads, and optimizing the contribution of nonhydro RE generators. As a result, the utilization of nonhydro RES generating units, such as biomass, solar and wind, could be increased in the Brazilian electricity system.
Indonesia’s eastern parts, which consist of Maluku and Papua Province, have a unique characteristic unlike that of the other parts. There are many small islands in these areas, in which the electricity system is isolated. Most of these systems depend on diesel generating units, for which the fuel must be transported from another island, such as Java or Kalimantan. On the other hand, the potential electricity resources in the eastern part of Indonesia are abundant, especially solar, wind and biomass energy. The GEP procedure should include these technologies to make the electrical system more sustainable through using the local energy resources. The electrical system can be more economical and meet the electricity demand by considering the transportation costs of primary energy sources such as coal and oil. The GEP procedure should also include the option of interconnection with the neighboring systems to optimize the potential of the local energy resources and increase the system’s reliability.
Moreover, the transportation of fuel or other forms of energy can be replaced by an interconnection transmission system between these systems [32]. A sustainable energy supply and a highly reliable electrical system would ensure economic growth in that area. In a group of isolated systems, the interconnections between them could be used to formulate the problem. For that purpose, here, the GEP procedure included the generating unit’s variable as the control variable and the interconnection system variable. Some constraints, such as the RES energy mixed target, LOLP and a reserve margin, can be added to satisfy the RES target and to achieve standard system reliability standards [6,33].
Many studies related to GEP have been carried out with various methods and environment solutions such as OSeMOSYS, WASP-IV and PLEXOS. GEP optimization in the OSeMOSYS environment was carried out in [13,19,22,34,35], with several considerations in the GEP, such as the consideration of emissions and RES constraints by different methods. OSeMOSYS is an open source environment for GEP or energy planning [36]. In addition, GEP optimization can also be carried out in the WASP-IV environment, one of the most widely used environments. Several studies have used WASP-IV as an environment for performing GEP optimization, as presented in [23], which performed GEP on the Sulawesi system in Indonesia by considering the high share of hydropower plants.
In addition, WASP-IV was also used in the GEP study in Oman, including large scale wind integration [15]. In another study in Kenya [37], the researcher used WASP-IV to solve GEP problems by carrying out renewable energy integration and least cost GEP to achieve security and continuity in the supply of electrical power systems. In addition, a study of distributed centralized thermal energy generation in the long term planning of the Iranian electricity system used WASP-IV [38]. In a further study, [14] conducted GEP for the electricity system in Pakistan using WASP-IV. The selection of generation units included in the GEP was achieved by using screening curves to determine the type of generator needed to supply the base and peak loads.
Apart from OSeMOSYS and WASP-IV, GEP can also be carried out in the PLEXOS environment. Some researchers have used the PLEXOS environment for GEP or energy planning [18,39,40,41,42]. A comprehensive analysis of how the operating dimensions of a power system can impact the results of the system’s model planning was provided by [43]. A detailed analysis model was used to quantify the impact of the temporal and technoeconomic representations commonly used to increase the penetration of variable renewable energy (VRE) generators. The method was based on the soft-linking methodology, which calculates a long term planning model for different seasons, day, night, and the peak period, then calculates the merit order and unit commitment of the power plant. Meanwhile, other research has conducted some reviews about current regulations regarding how the challenges of integrating VRE generators are represented in long term energy system optimization models (ESOMs) and integrated assessment models (IAMs) [44]. In addition, GEP is also expected to assist future research by presenting and differentiating these methodologies so that future energy system modelers can choose and apply the best methodology that fits their current situation. The optimization method used here was MILP. Moreover, another researcher explained that the representation of the VRE source in the long term model must be chosen carefully to accurately represent the transition of the existing energy system to a decarbonized energy systems with a high portion of VRE. In this study, the bottom up, long term modelling used the Model for Energy Supply Strategy Alternatives and their General Environmental Impact (MESSAGE) tools [45]. In this study, the GEP was simulated in the PLEXOS environment using mixed integer linear programming (MILP). PLEXOS conducts multiobjective decision studies for integrated energy modelling. A multiobjective function allows the simulation to specify additional objectives beyond cost minimization, as in the classic unit commitment/energy dispatch (UC/ED) problem. The PLEXOS environment can perform GEP by considering short term planning for generating operation options. The increase in RE generators in the generating system, as presented in [13,36], were used to determine the least cost GEP, considering the intermittent characteristics of the western European power system. In [18], the authors also consider short term operations or operability constraints in energy planning in Malaysian Borneo.
In this research, the GEP procedure of the Ambon–Seram, Saparua, and Haruku isolated systems were simulated as the test case. These areas have a peak load of 65.5 MW, 14.4 MW, 2.9 MW, and 1.02 MW in 2019 for the Ambon, Seram, Saparua, and Haruku systems, respectively. In 2050, the system’s peak load will become 256.8 MW, 76.7 MW, 18 MW, and 3.43 MW, respectively, so sustainable GEP will be necessary. The load center in the Ambon–Seram region is in the Ambon region, while there is abundant RES potential in the form of biomass in the Seram region. Thus, an interconnection option between these systems was considered in the GEP, including interconnections to Saparua and Haruku. GEP was executed using MILP in the PLEXOS environment. Moreover, the RES energy mixed target and LOLP standard were also included in the model. For comparison, a traditional GEP, which only focused on the isolated system, was also simulated. As a result, the interconnection between the systems resulted in a RES energy mixed of 24% in 2025 which increased to 54% in 2050. The interconnection in 2026 may ensure the reliability of the Ambon–Seram system by meeting the LOLP reliability index of <0.274%. On the other hand, the isolated system scenario resulted in a RES energy mixed of 51% in 2050.

2. Materials and Methods

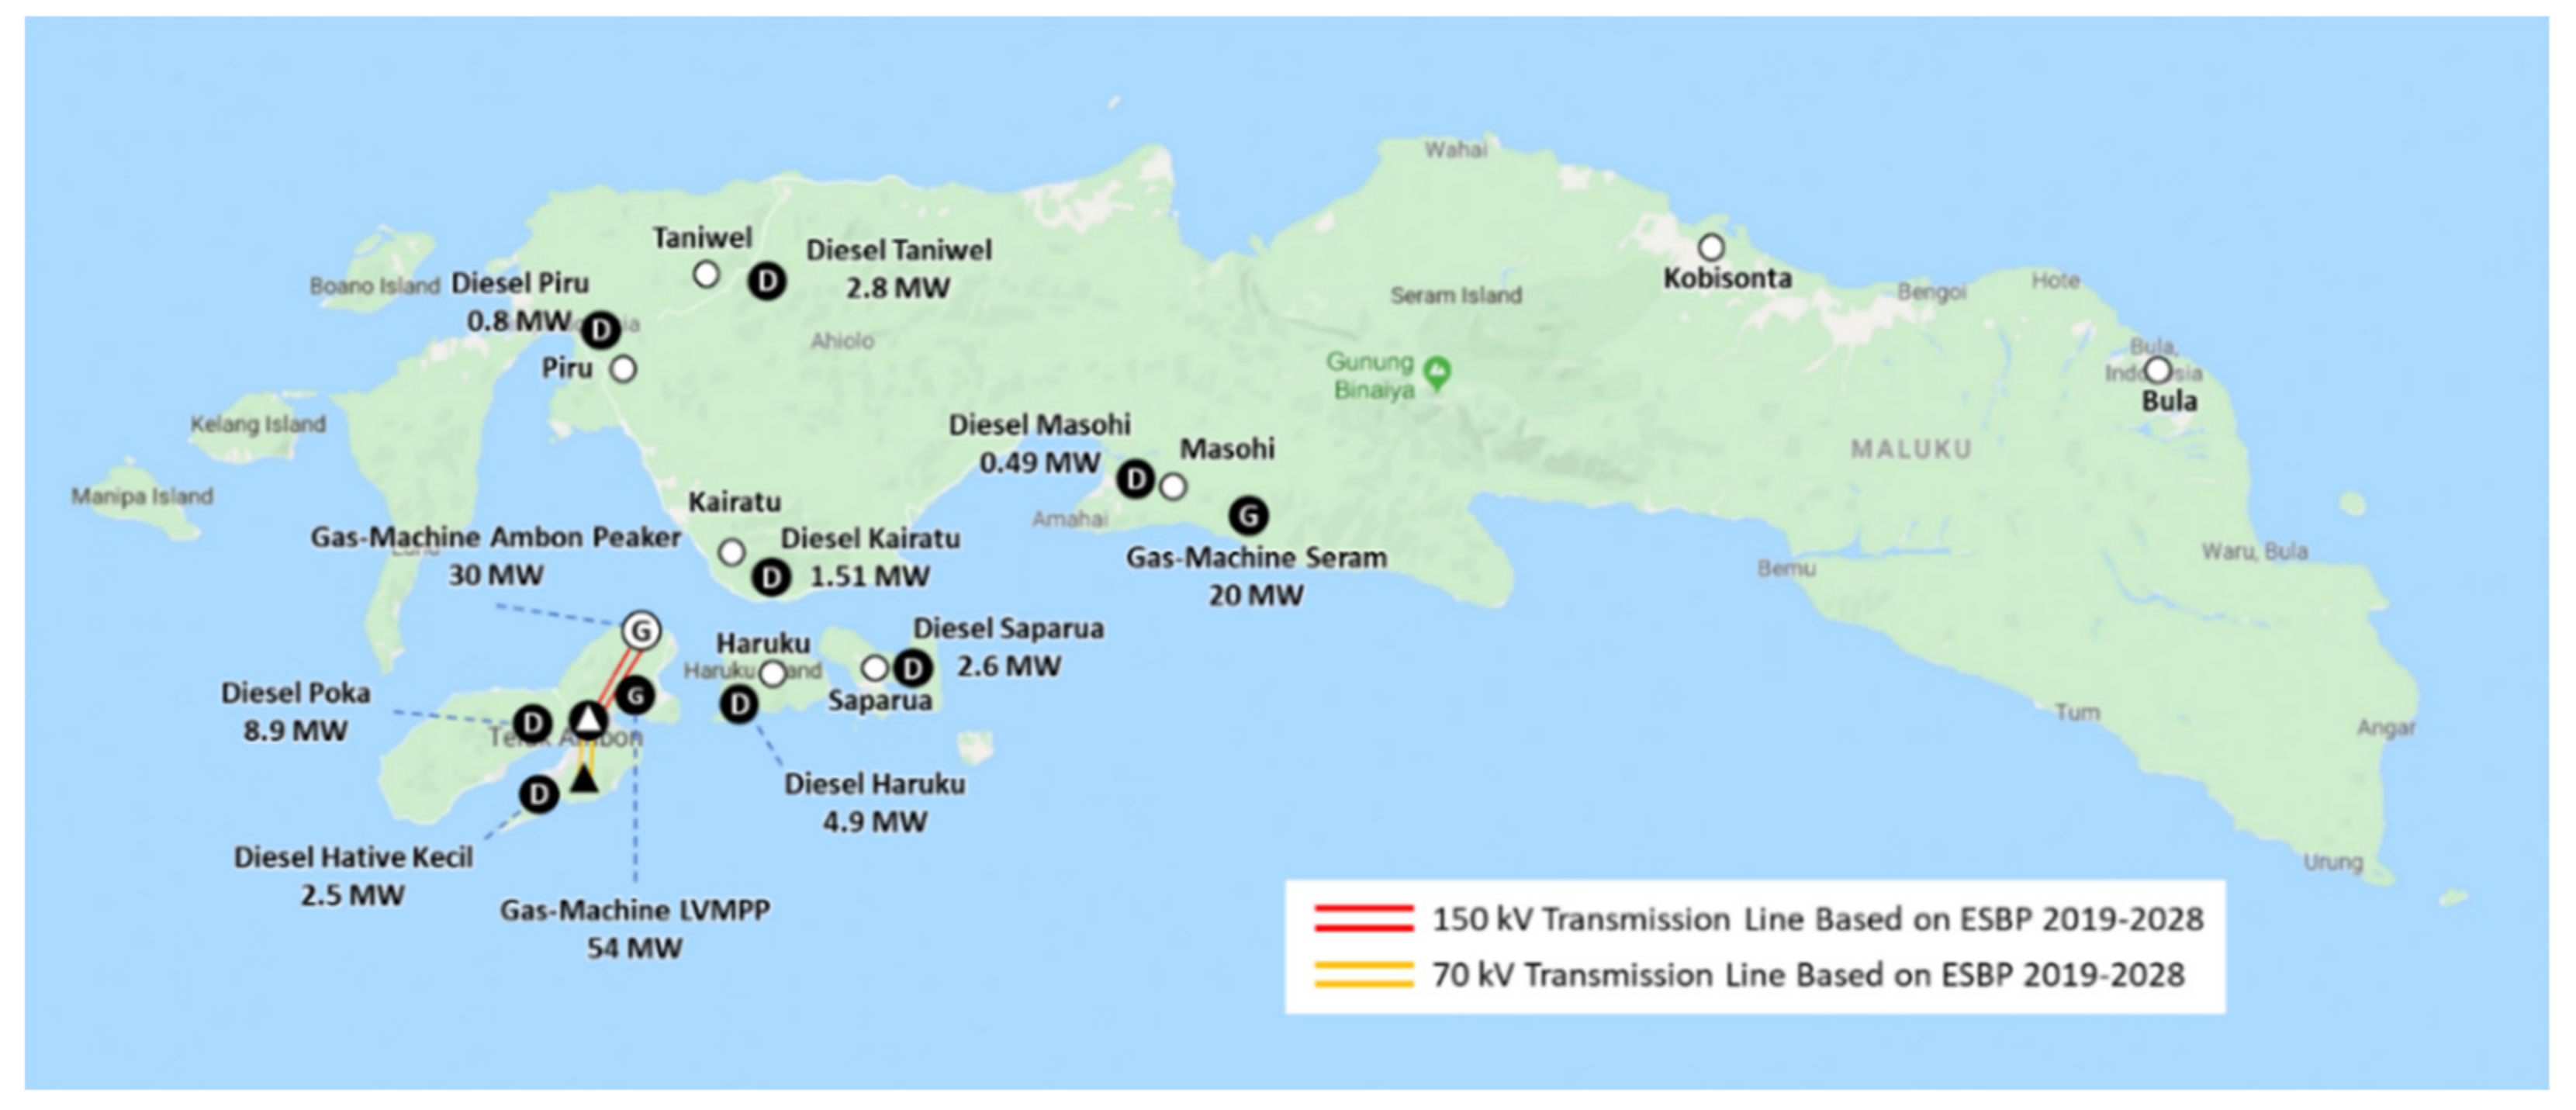
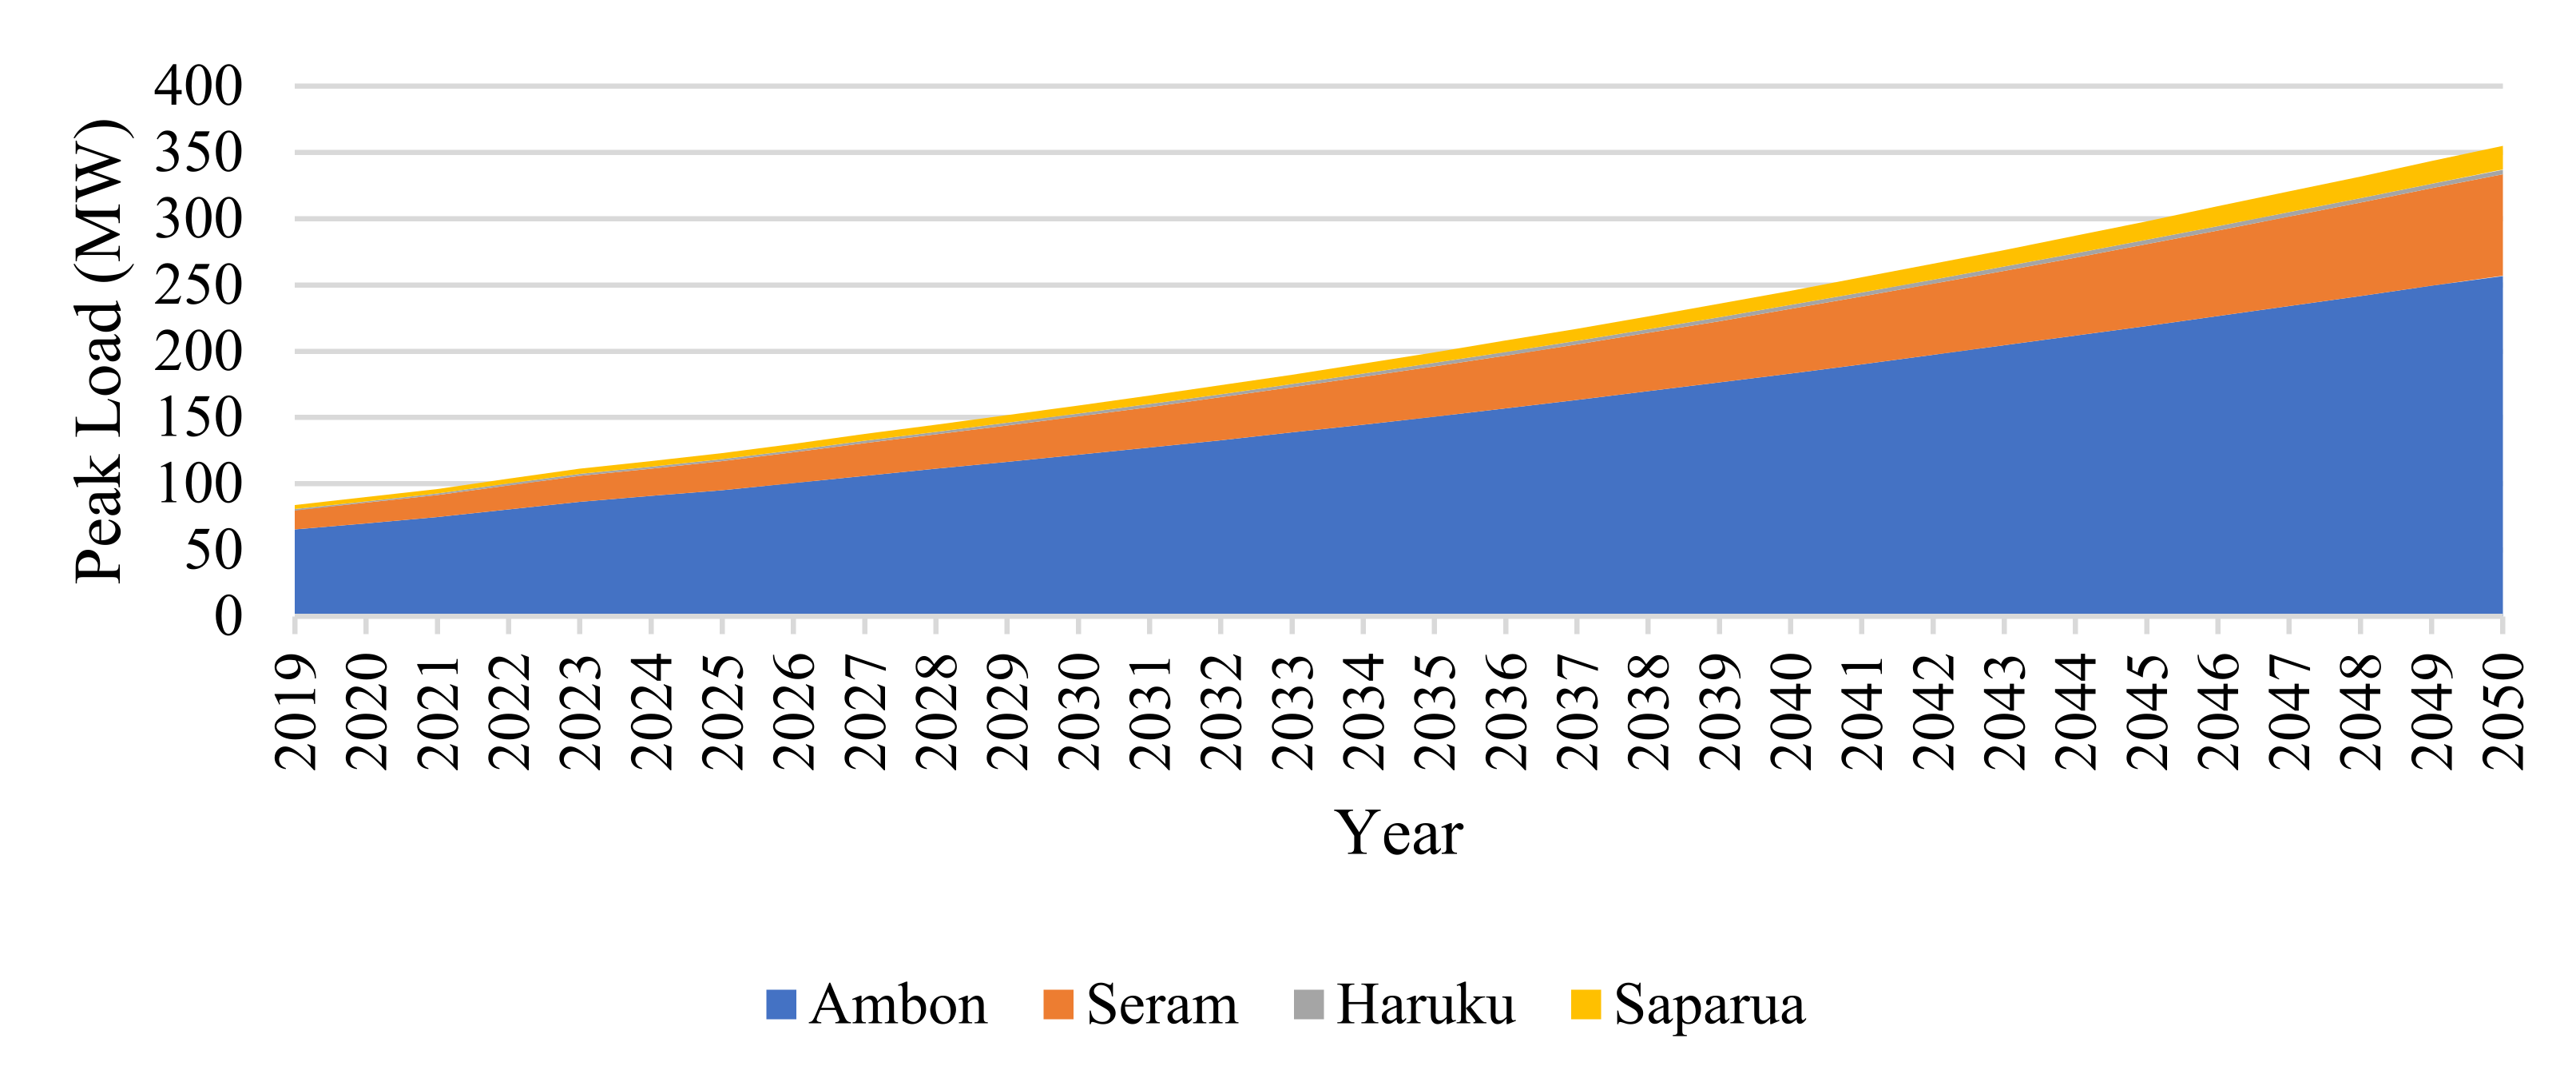
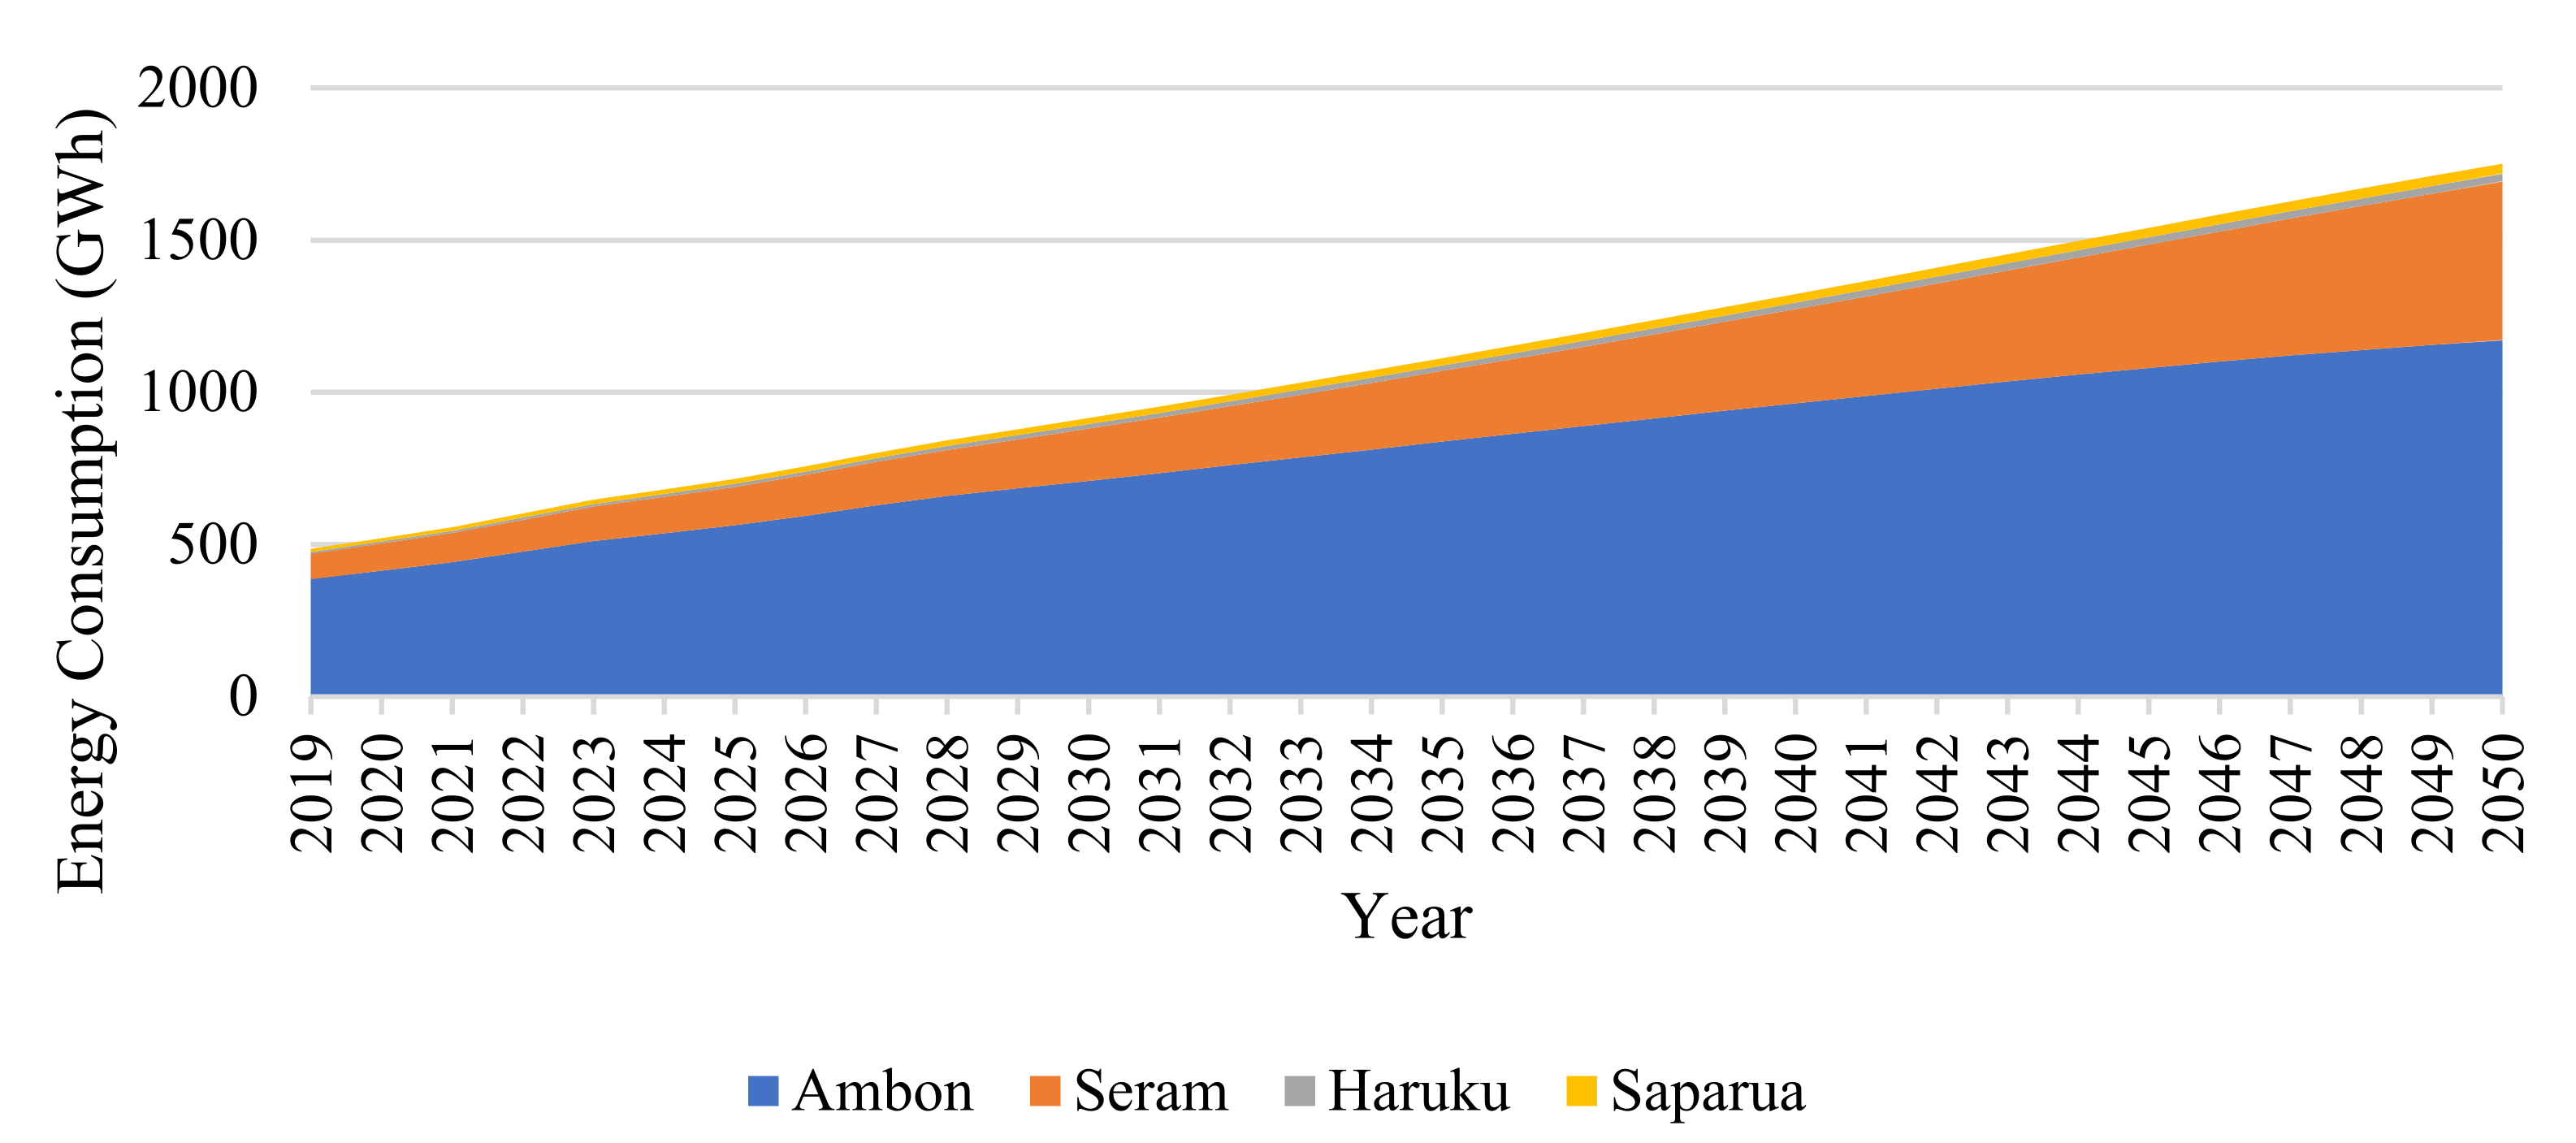
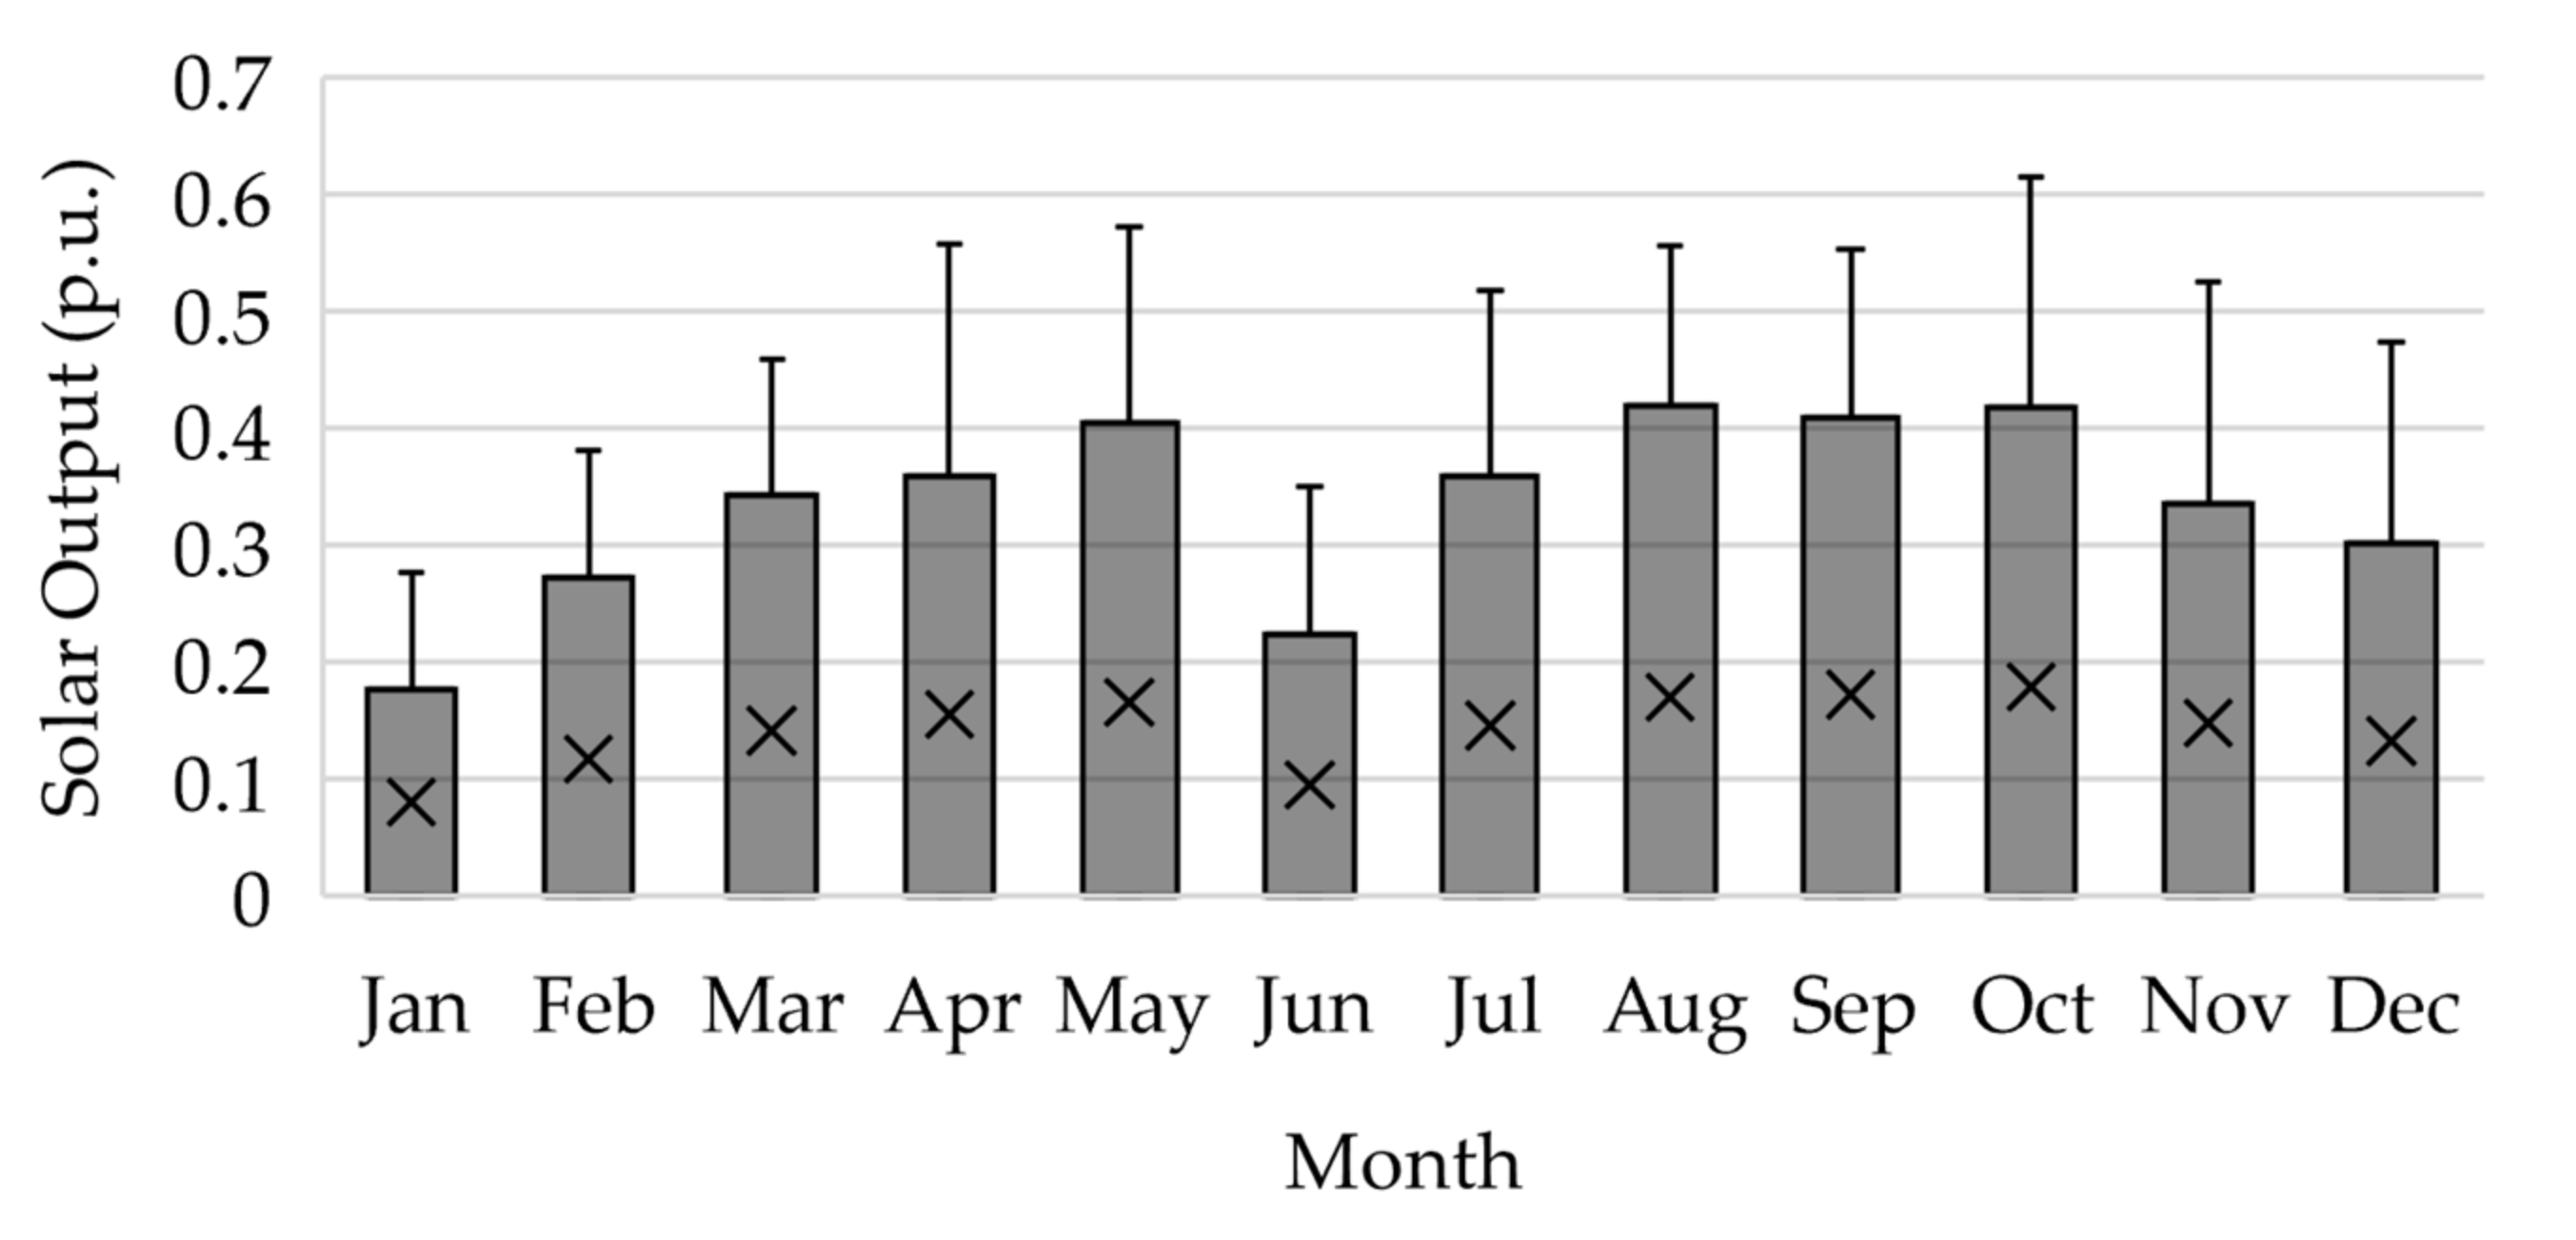
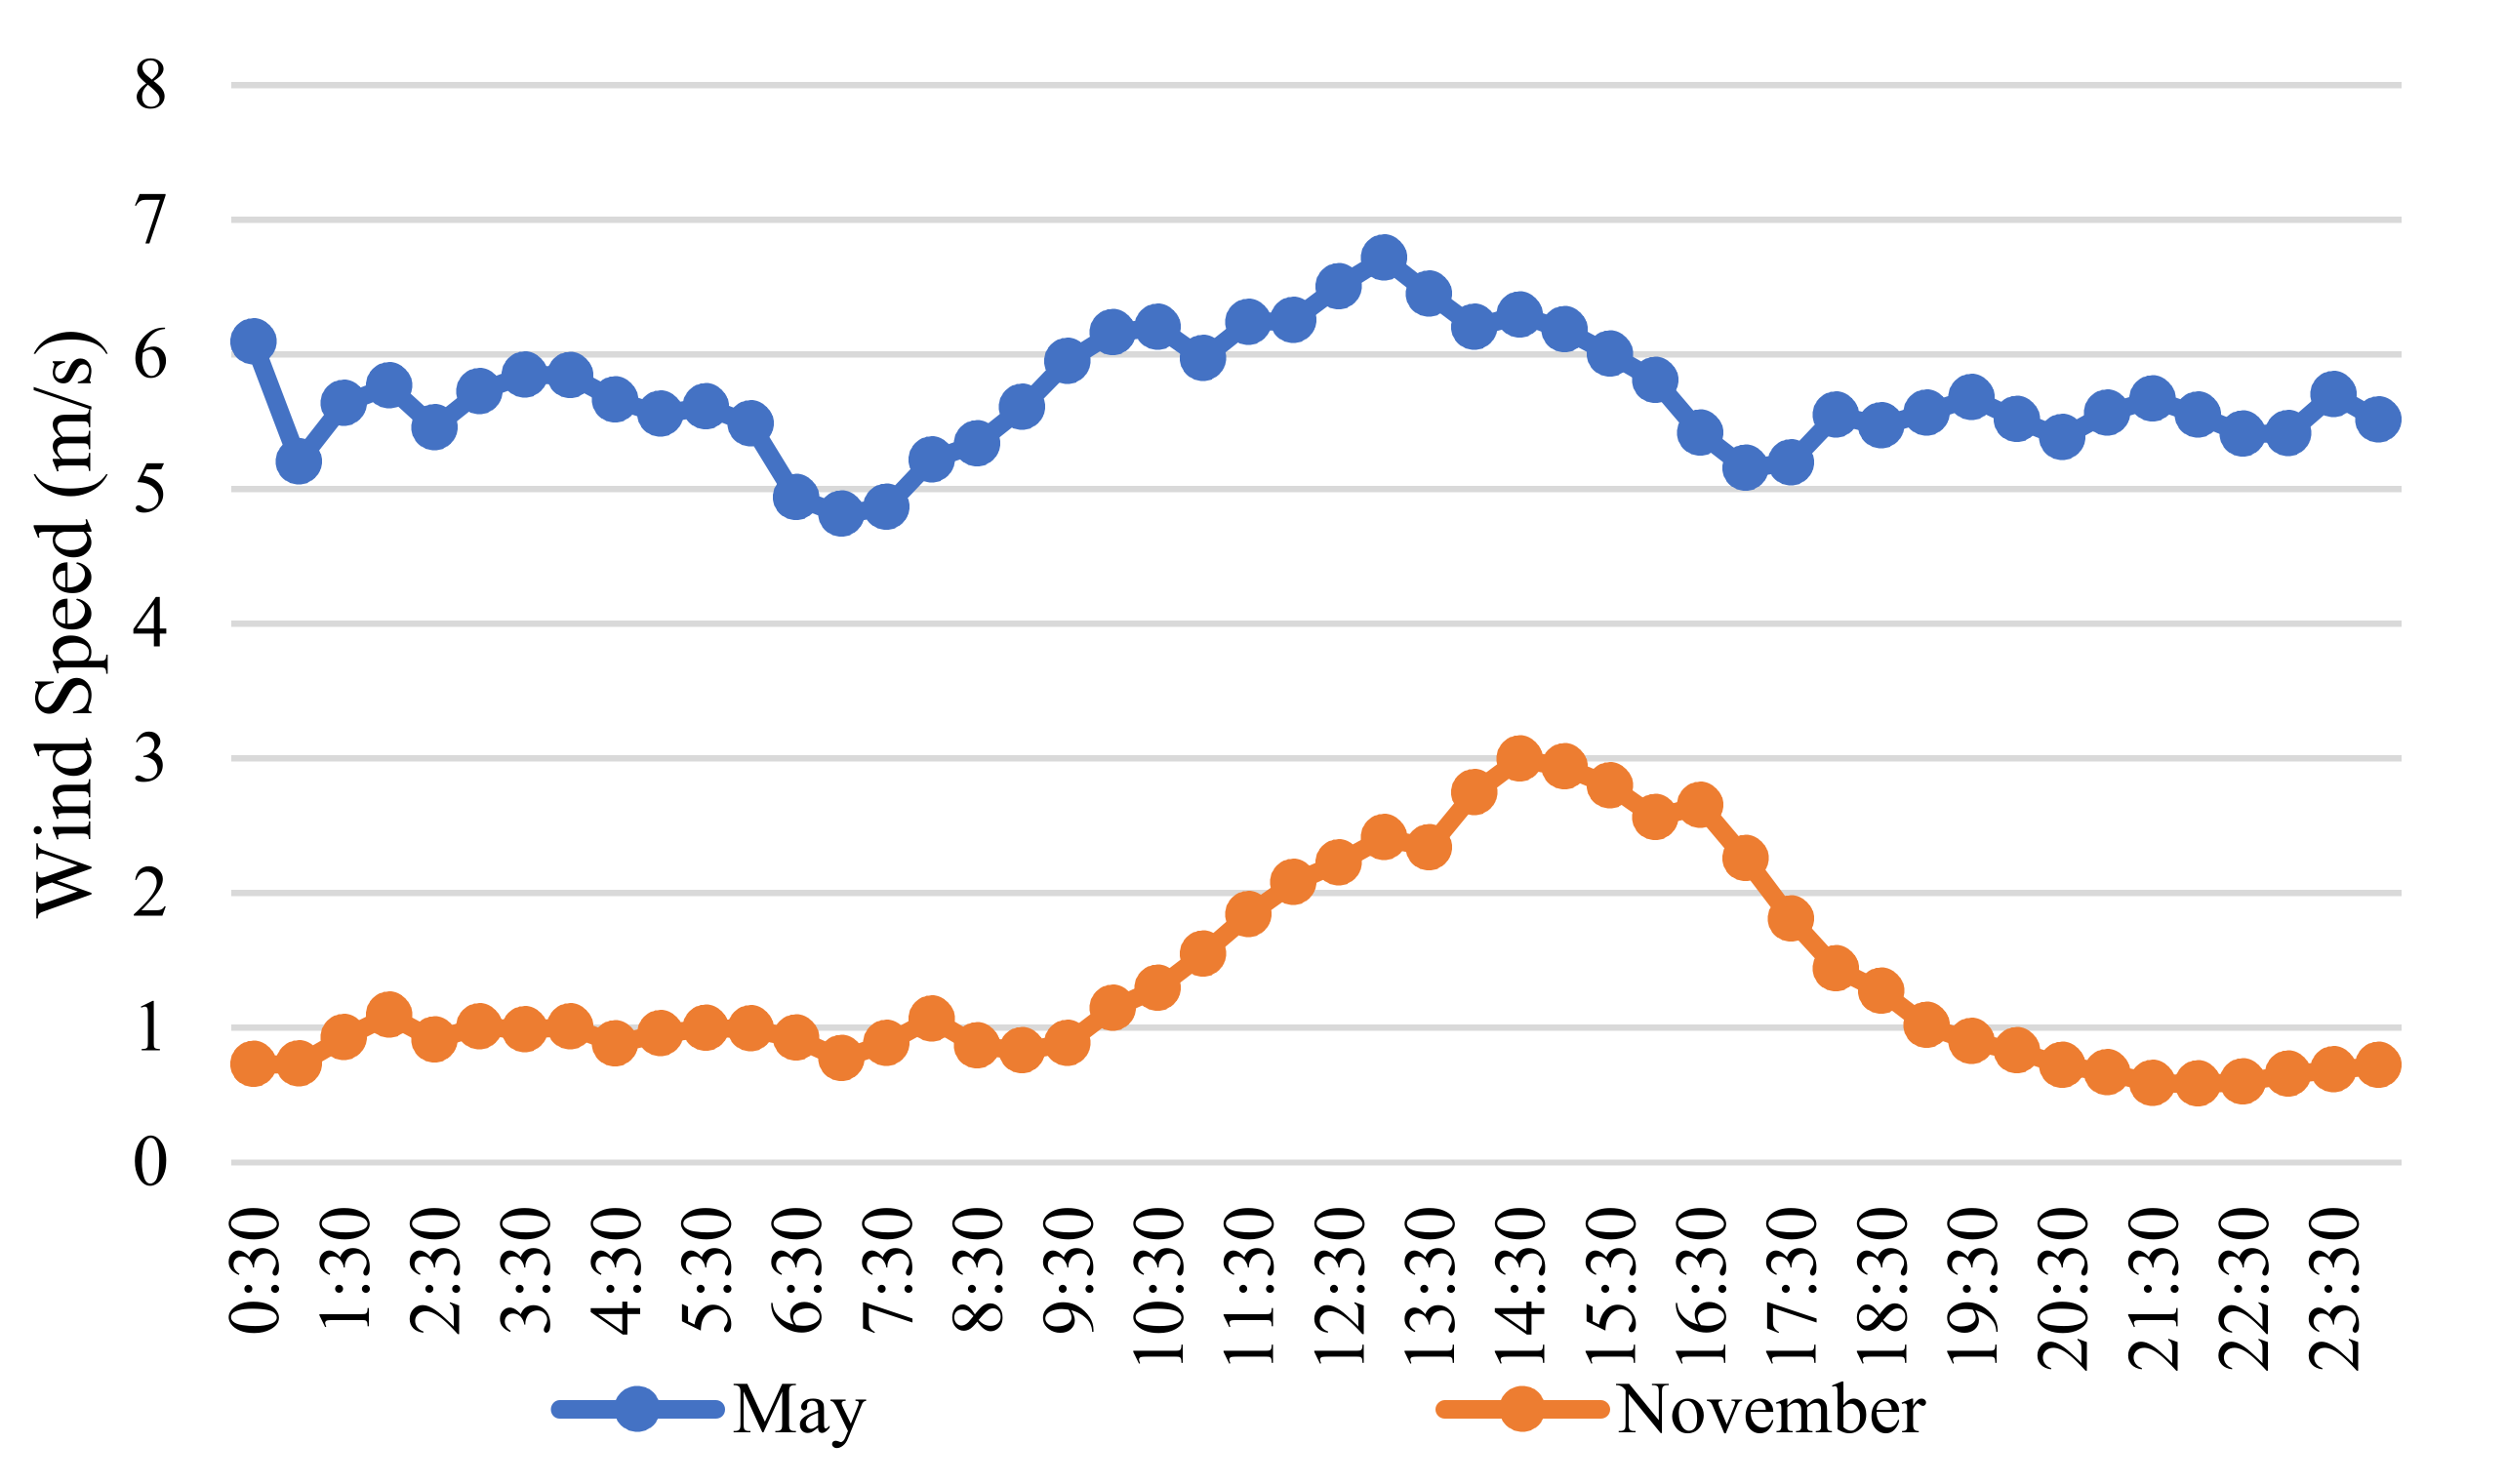
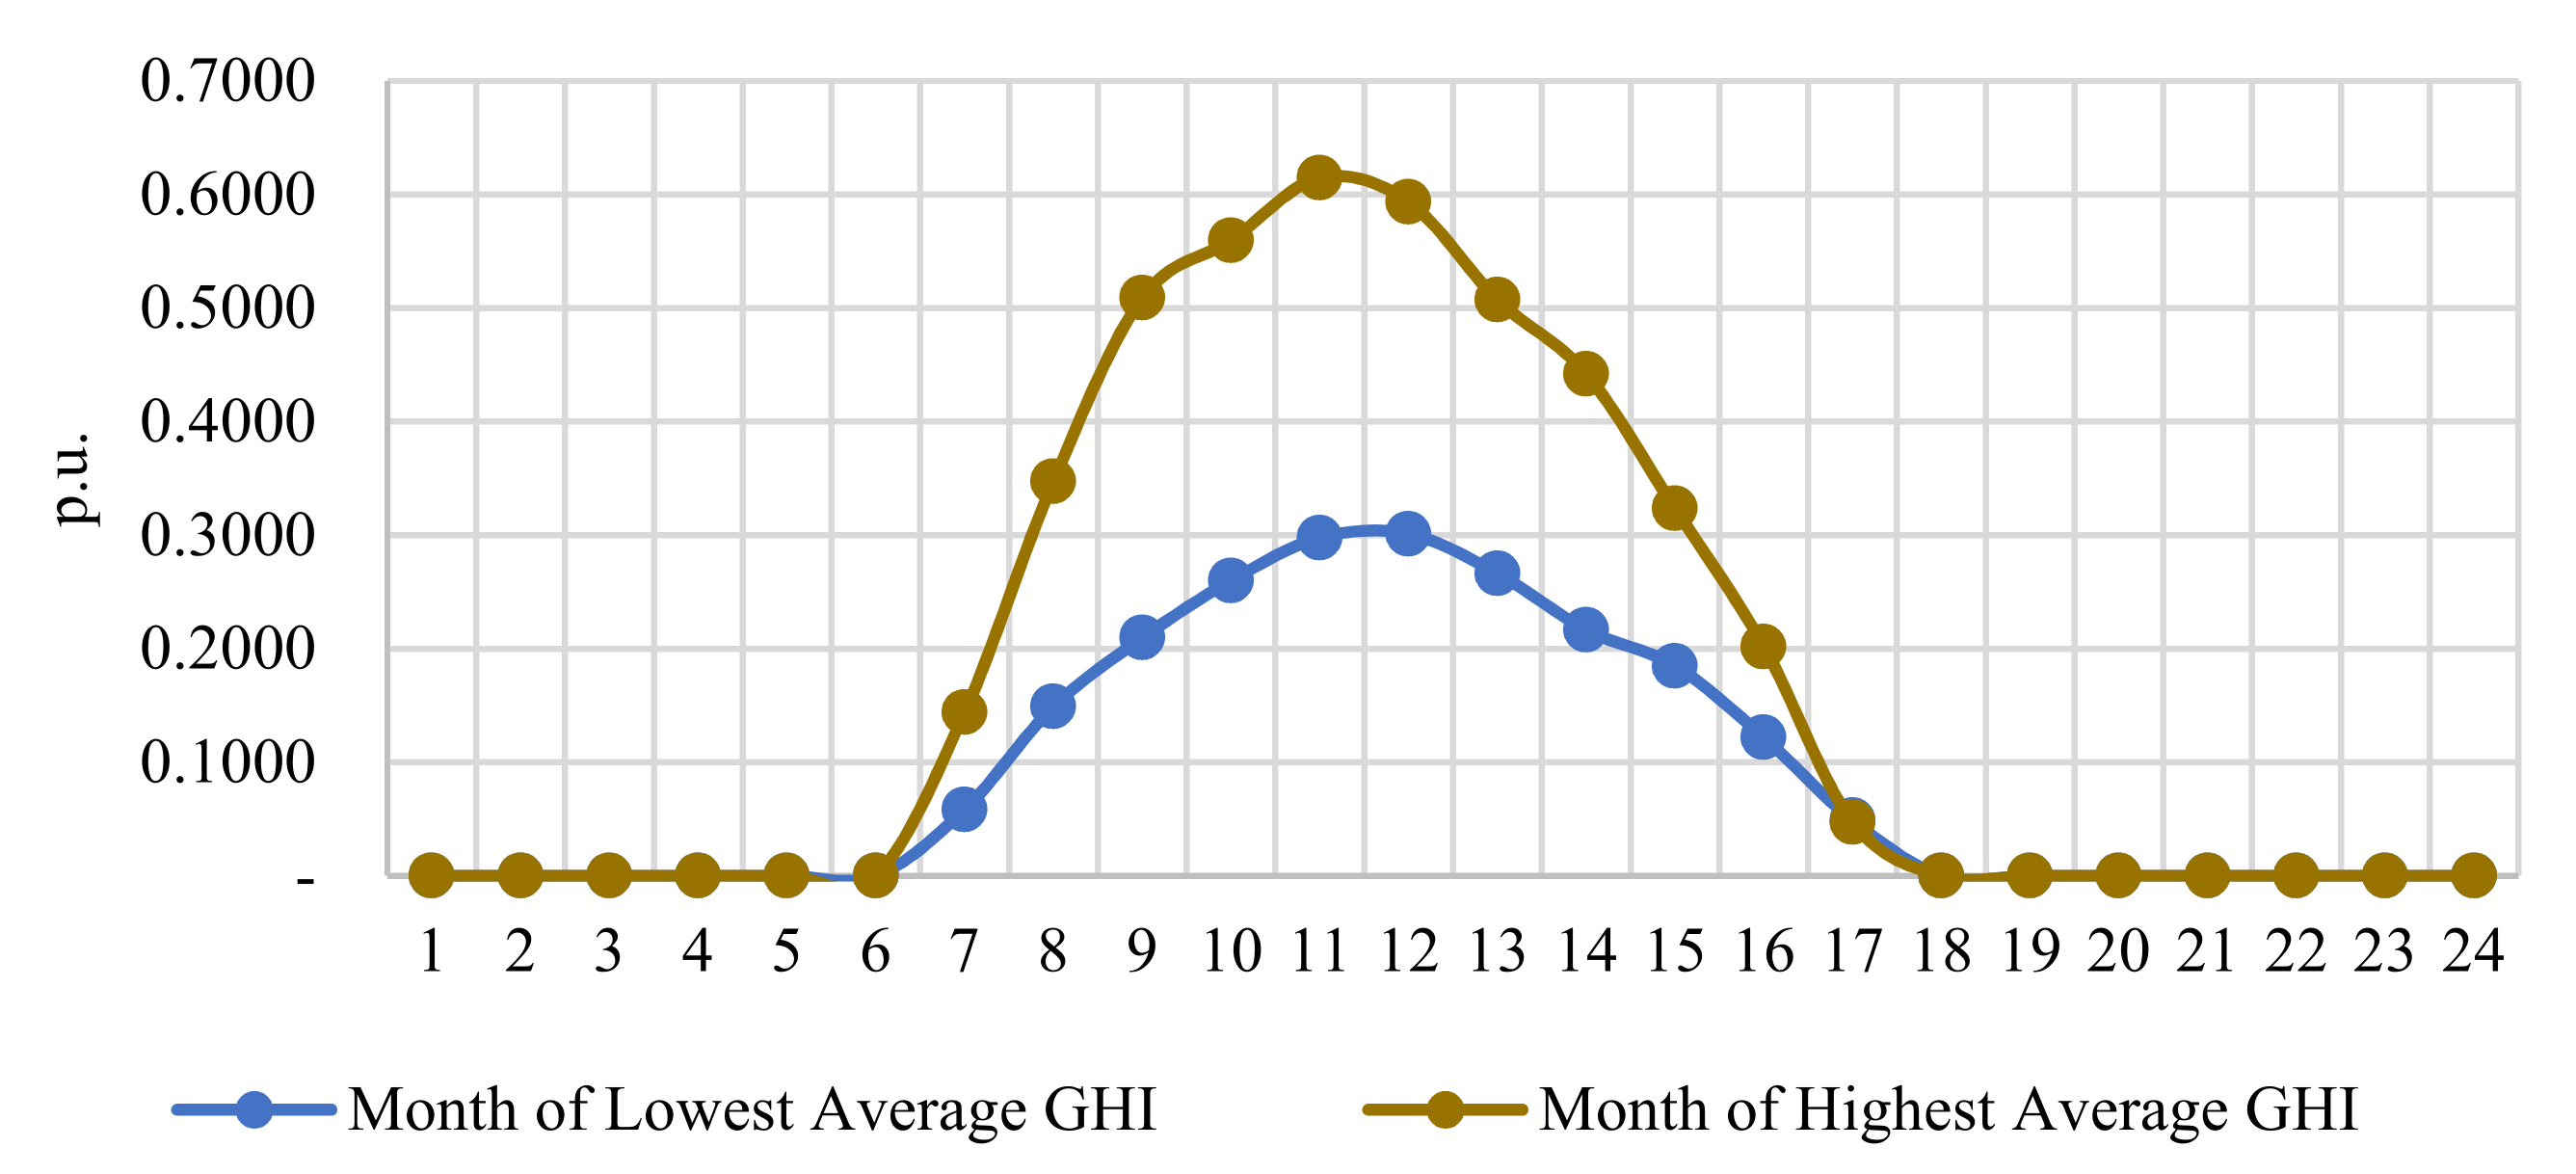
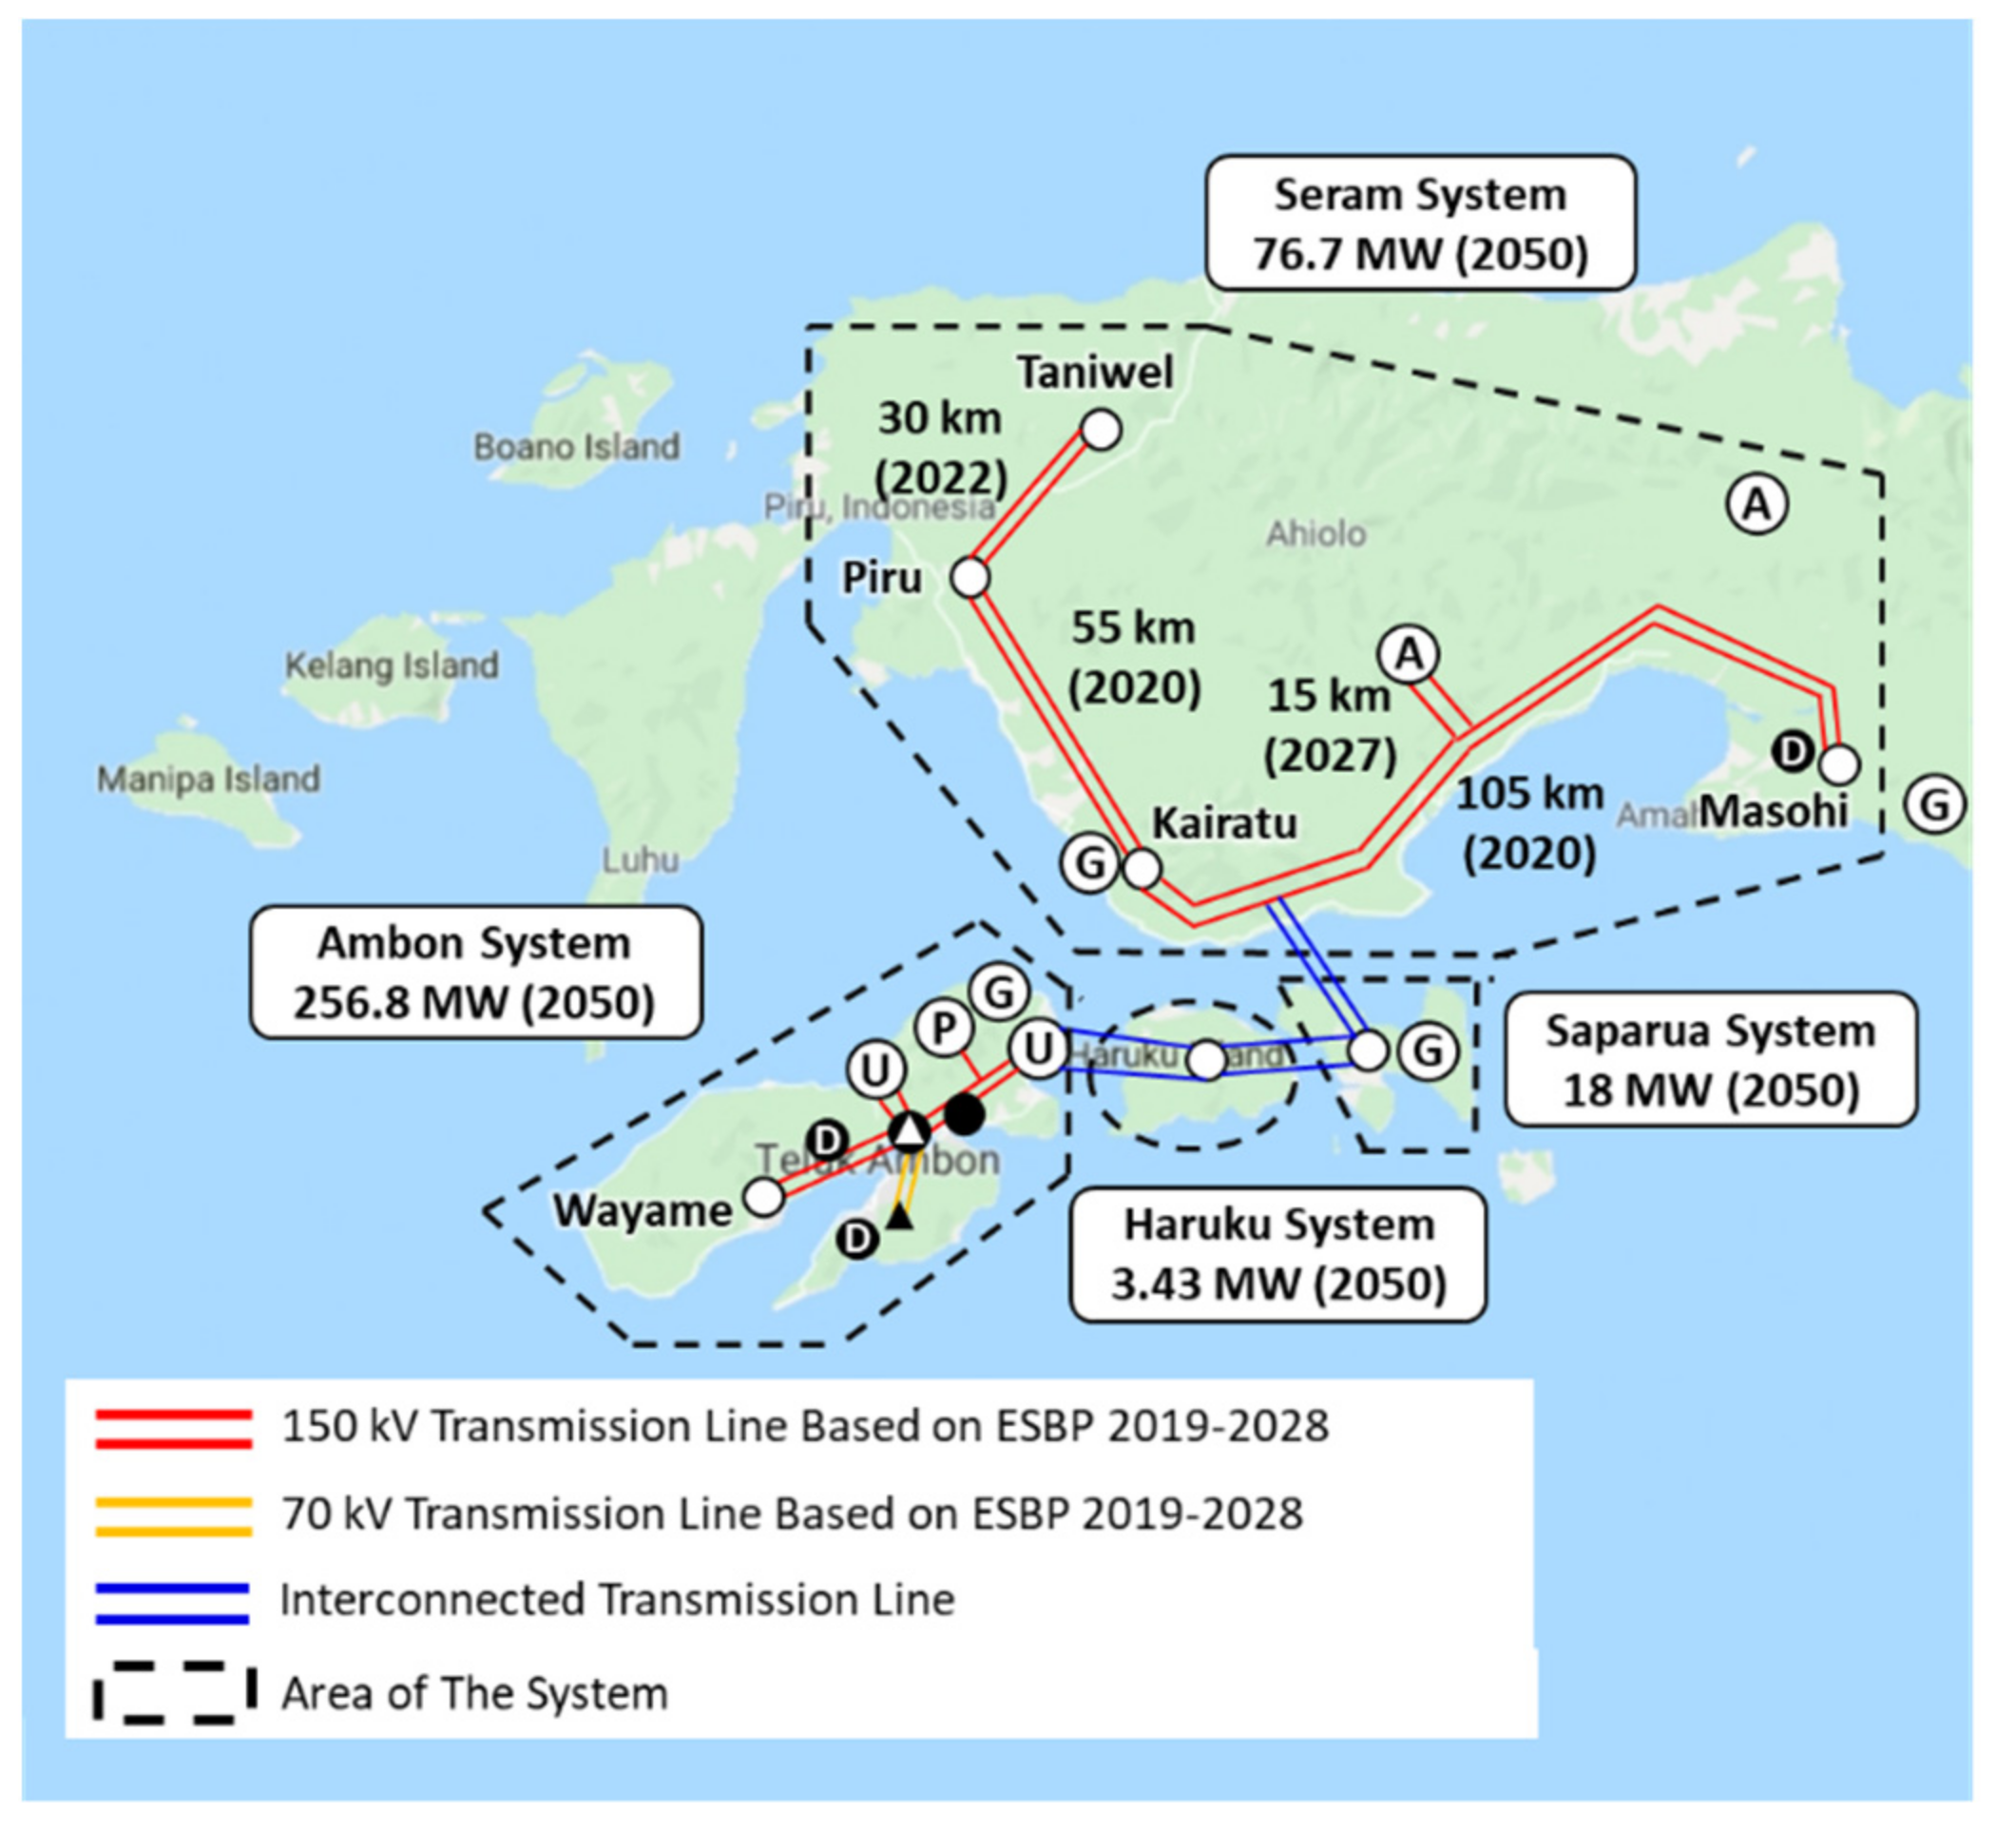
2.1. The Ambon and Seram Systems

The Ambon–Seram Island region consists of many scattered systems on Seram Island and others scattered in the surrounding islands. These scattered systems include Ambon, Seram and other scattered systems with deficient demand. The Ambon–Seram system consists of four separate systems, which include two major systems: the Ambon system and the Seram system, and two small systems: the Haruku and the Saparua systems. However, the Seram system consists of four systems, namely, the Kairatu, Masohi, Piru and Taniwel systems, which are planned to be interconnected. A general description of the Ambon–Seram system is presented in Figure 1, where the four electricity systems are separated across an archipelago. The existing transmission lines have 150 kV and 70 kV voltage levels, as shown in Figure 1. In 2019, the peak loads for the Ambon system, Seram system, Haruku system, and Saparua system were 65.5 MW, 14.4 MW, 1.02 MW, and 2.9 MW, respectively, while the total energy consumption was 385.8 GWh, 83.1 GWh, 5.9 GWh, and 10 GWh with a load factor of 67%.
As presented in Table 1, most of the power plants in the Ambon–Seram system are diesel and gas machines. The Ambon system has four generation units with a total capacity of 95.4 MW, while the Seram system has seven generation units with a total capacity of 31.6 MW. The Saparua and Haruku systems have one generation unit each with capacities of 2.6 MW and 4.9 MW, respectively. Diesel and gas machines have relatively expensive fuel prices and are not environmentally friendly. Furthermore, the existing power plants in Ambon–Seram have not met the target of 23% VRE sources in the energy mixed because all the existing power plants still use fossil fuels. The potential for renewable energy resources in Ambon–Seram is quite large, especially for biomass. Therefore, the new generators to be built will prioritize the use of local renewable energy resources, such as biomass, solar and wind energy, which are more economical and environmentally friendly.

2.2. Parameters of Generation Expansion Planning
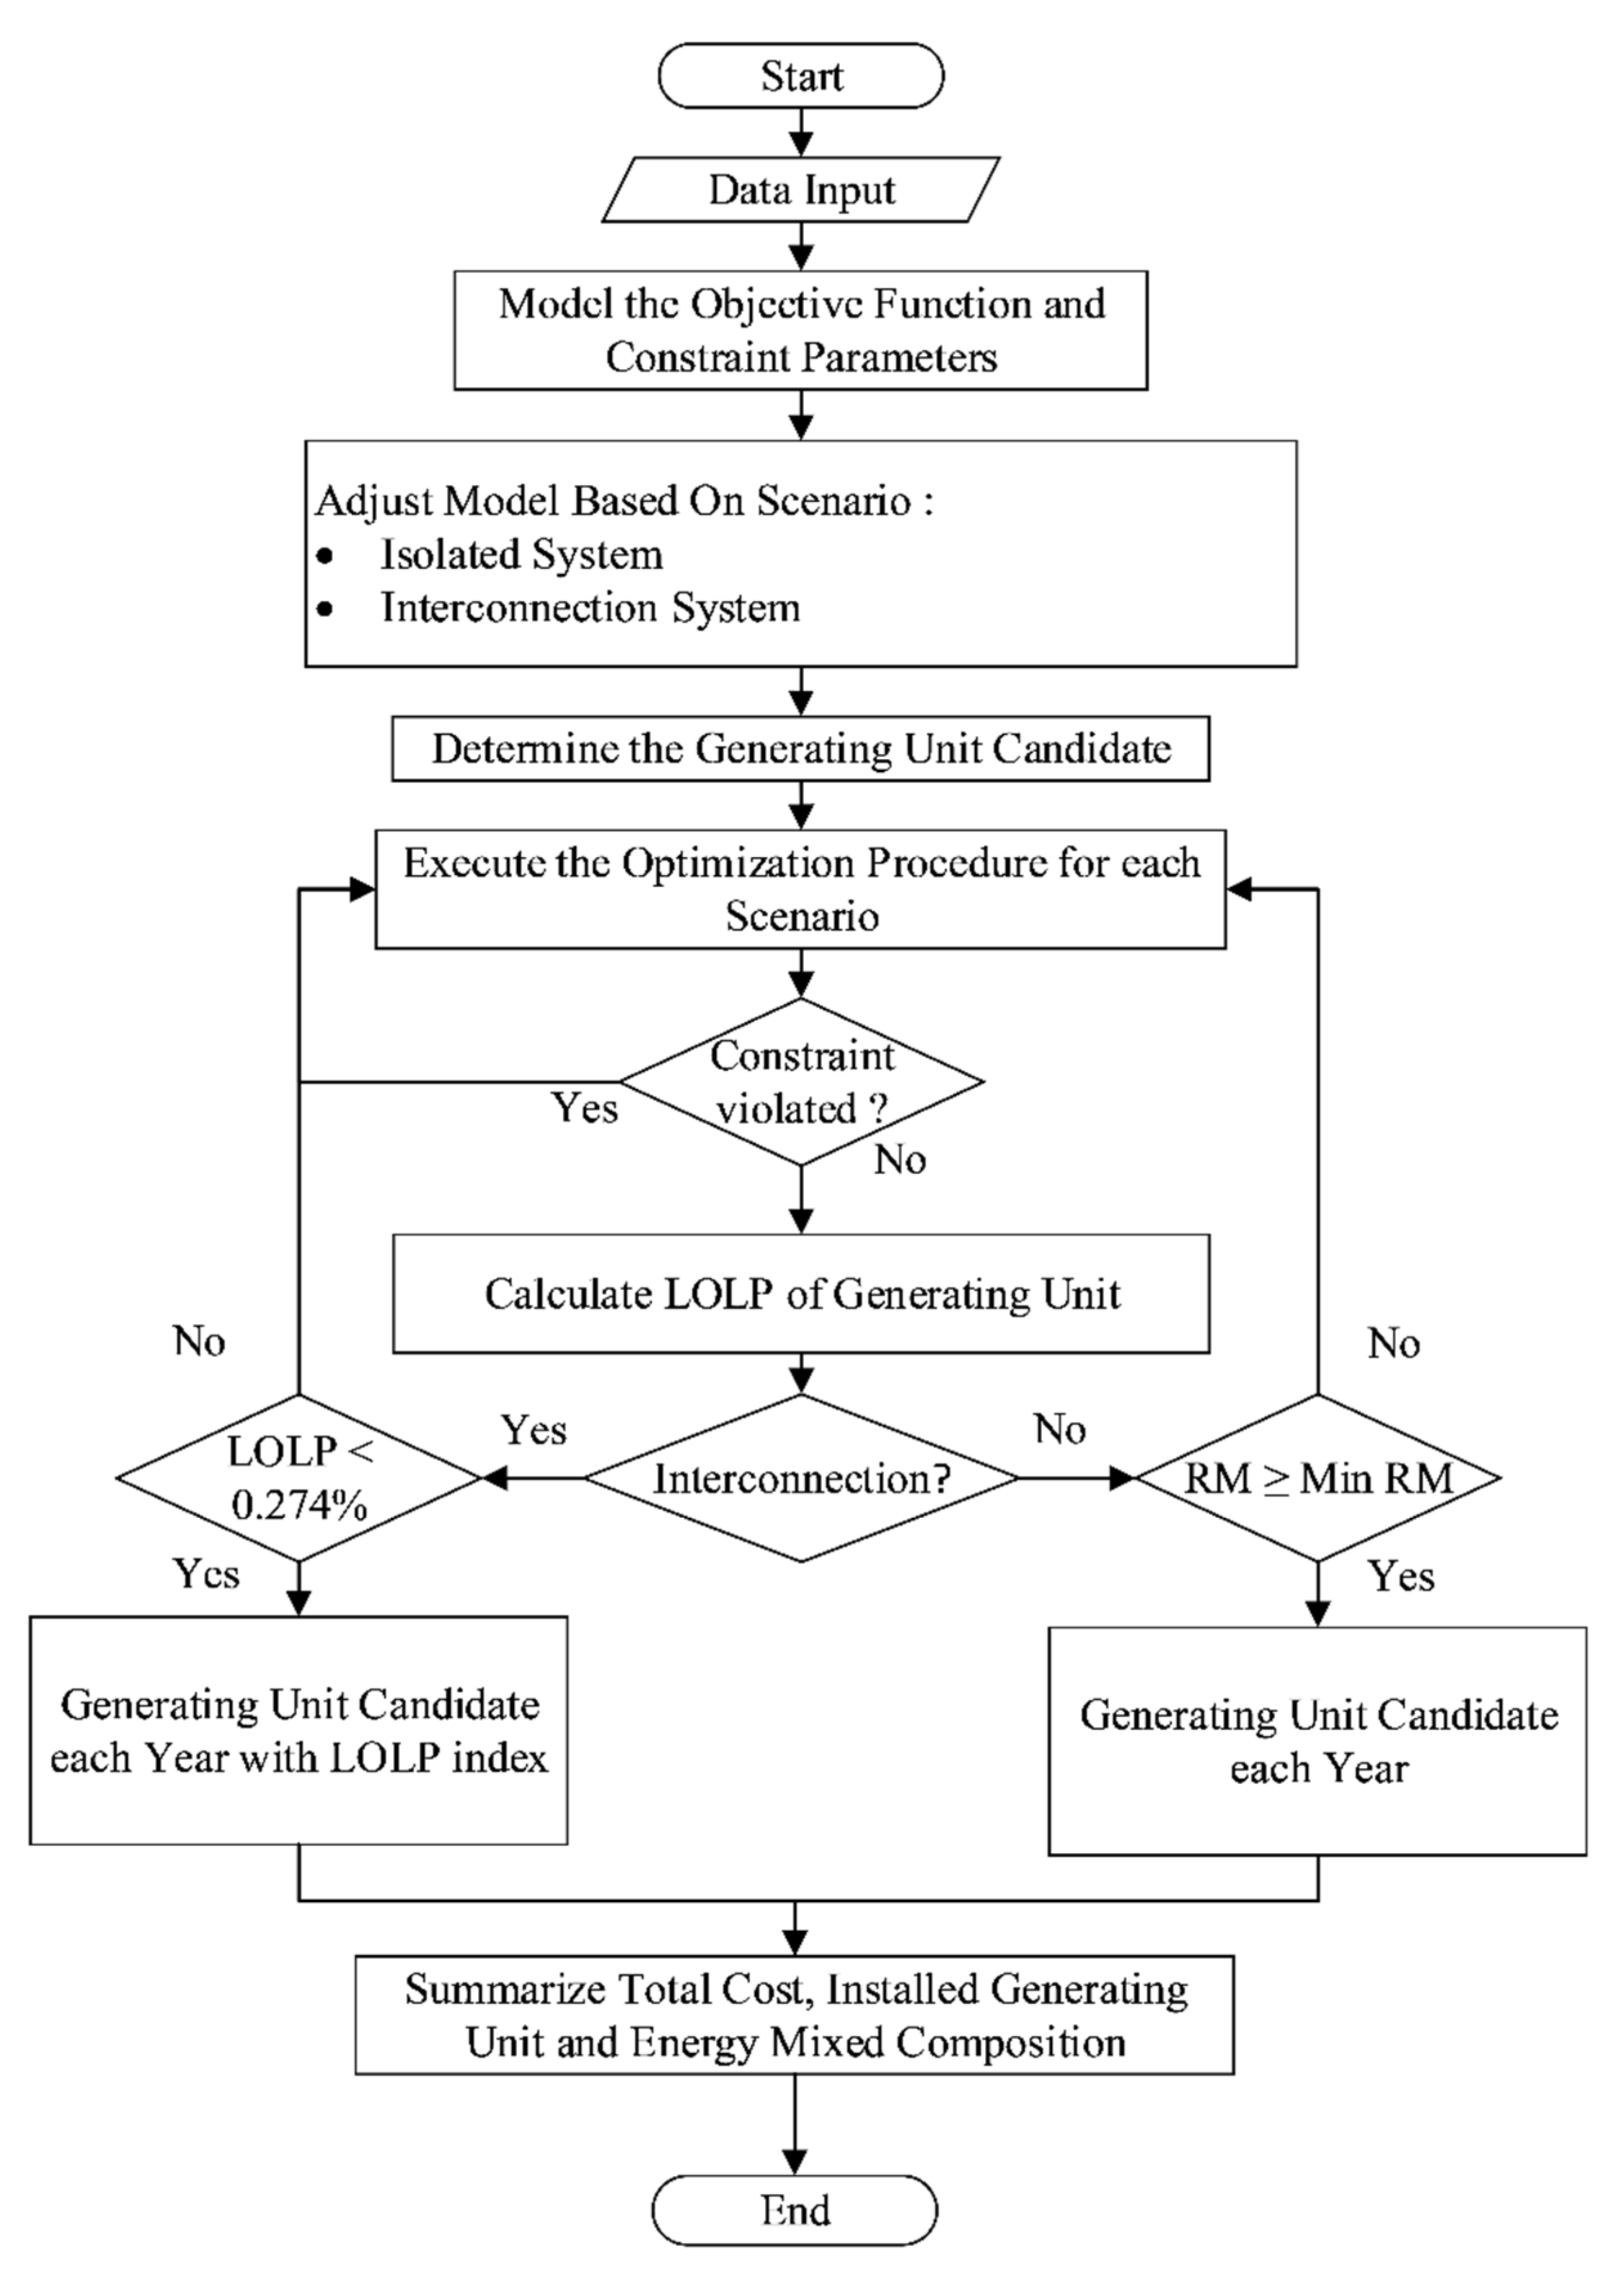
The data and assumptions used in the GEP for the Ambon–Seram system are the load growth data, the primary energy potential and primary energy price assumptions. Load growth was obtained from forecast results for 2020 to 2050. The primary energy potential of RES in the Ambon–Seram system consists of biomass, solar and wind energy. At the same time, the primary energy price assumptions included the price of coal, LNG (liquefied natural gas), HSD (high speed diesel), MFO (marine fuel oil), geothermal energy and biomass.
The electricity demand always increases every year. The load (customers) is divided into several sectors: household, business, public and industry. The growth of load in each sector is strongly influenced by economic growth. The greater the economic growth, the greater the consumption of electrical energy. In performing a load forecast, it is necessary to consider the rate of economic growth. The amount of peak load and the energy consumption are needed to develop the generators and distribution system to provide plans that meet the electricity criteria. Based on the load forecasts in [46,47,48], the peak load (MW) and energy consumption (GWh) of the Ambon–Seram system for 2020–2050 are presented in Figure 2 and Figure 3.
The Ambon–Seram system has RES potential that can be utilized in the GEP, such as biomass, solar and wind energy. Biomass is the most significant potential primary energy in the Ambon–Seram system because most of the land is covered by forest, as shown in Figure 4. Table 2 shows the function of land and its area. Production forest has the largest area, with 9,619,213.95 ha or about 51% of the total land. Despite the large production forest area, not all can be utilized as a supplier for biomass plants. However, there are several forest areas under company ownership that can potentially provide biomass.
Based on [38], five potential crops can be utilized in biomass generation units. The selection of the crops is based on the heating value, crop cycle and soil structure in the area. Potential crop types and land requirement conversions for each biomass generation capacity are shown in Table 3.
The wind and solar data used are calculated through the recapitulation of monthly average data in 1 year. The solar and wind profiles are shown Figure 5 and Figure 6, respectively. Both show the average value, the highest value, and the smallest value for the daily profile in each month. The daily average wind output profile is between 0.13 p.u and 0.6 p.u. The lowest daily average value is in November, while the highest is in May. Meanwhile, the daily average solar output profile is between 0.08 p.u and 0.19 p.u. The lowest daily average value is in January, while the highest is in October. The wind profile has a higher variability than the solar profile, as shown by the range between the maximum/minimum value, and the average is relatively different for each month.
The highest average wind speed is in May, while the lowest average wind speed is in November. The wind and solar profile curves were based on the closest measurement point to the Ambon–Seram system. The wind speed profile curves for May and November are presented in Figure 7, while the details for solar irradiation can be seen in Figure 8.
The highest wind and solar potential conditions are used to represent the best generation conditions, and the lowest conditions are used to represent the worst generation conditions. An example of a wind profile is shown in Figure 8, which shows the daily highs and lows of the wind profiles. The highest daily wind profile used was for May, with an average of 5.69 m/s and a standard deviation of 0.43 m/s, while the lowest daily profile was for November, with an average of 1.33 m/s and a standard deviation of 0.74 m/s. Based on the standard deviation value, it can be seen that, for the highest profile conditions in May, the variation in wind speed is lower than the lowest daily profile in November. This indicates that the intermittency that occurs during low wind speed conditions has a higher variability. The highest solar data has an average value of 0.179 p.u. with a peak generation of 0.61 p.u. and a standard deviation of 0.236 p.u. While the lowest solar potential has an average value of 0.088 p.u., with a peak generation potential of 0.30 p.u. and a standard deviation of 0.114 p.u. For potential solar energy, the value of the standard deviation of the lowest profile is smaller than that of the highest profile, which is also due to the lower peak of generation, when the gap between the generation values for each hour and the average of one day is lower than when the peak generation is high.
Furthermore, the generation of hydro power considered the dry and rainy seasons, which are reflected in the value of the capacity factor. In addition, the capacity factor also represented the type of hydro generator used. If the capacity factor value was in the range of 30–56%, then the storage type was used, while if the value was 65–75%, the run of river type was used [49]. The option used for determining the position of the power plant was to look for the optimal solution based on the lowest cost and the energy requirement constraints, which were grouped into generator categories, namely, peaker, base load, and follower. All these categories were used as candidates, and the results of the optimization determined which category the power plant belonged to.
Table 4 shows the fuel price and heat content assumptions for each type of fuel. The cheapest fuel prices are biomass and coal at 2.5 $/GJ and 3.303 $/GJ, respectively. However, biomass is a local renewable energy resource available throughout the Maluku region. Therefore, biomass will be prioritized because there is no need to transport this fuel from other areas.
The power plant candidates for the Ambon–Seram GEP can be seen in Table 5, where the candidates for the Ambon and Seram systems are different from those for the two small systems of Haruku and Saparua. Each generator candidate has its unique technical characteristics, including capacity factor, heat rate, maintenance rate, FOR (forced outage rate) and technical lifetime. Besides, each generator candidate also has economic characteristics that include the build cost, the FOM cost and the VOM cost. Both the technical and economic aspects were considered in the GEP optimization.
The investment cost of the lines was calculated on the basis of the length and the type of line/cable used. For connecting two islands that are separated by the sea, a combination of overhead lines and submarine cables was used. Overhead lines were used from the closest substation to the connecting offshore substation; between the substations connecting one island to another, submarine cables were used. The typical prices of the lines are shown in Table 6.
The transmission line option for the Ambon–Seram system was a transmission line with two circuits, as presented in Table 7. The transmission line path to be built is shown in Figure 9, which shows three lines used to connect four separate systems with a total length of 75 km. It was assumed that the total cost of building the transmission line is USD 39.59 million.
The reliability of the line was calculated as 1.0 and considered to be reliable. Moreover, the proposed line candidate used two circuits so that it can meet the N-1 contingency criteria. We calculated the reserve margin based on this scenario. For isolated scenarios, we calculated the reserve margin as sum of reserves between Ambon Island and Seram Island. For the interconnected scenario, we calculate the reserve margin as a single power system.

2.3. Methodology

In this study, the GEP procedures for the Ambon–Seram system followed the flowchart shown in Figure 10. Data for the GEP simulation were collected from a literature review, especially from articles related to public policy and existing system operating conditions. Data on the load curve, peak load, energy demand, technical data of the existing generation units and fuel costs for the Ambon–Seram system were obtained from PLN Ltd. and the National Electricity Supply Business Plan (NESBP) document [46]. Demand growth was assumed to have a value of 5.31% in Maluku Province [47,48], which was used in the load forecasting procedure in [15]. In this study, the load curve was divided into time slices, so that changes in load over time or during a period could be seen in the simulation.
In this GEP optimization, the objective function for minimizing the discounted total cost (Cost) was formulated as described in Equation (1). The discounted total cost was the sum of the total investment cost, the fixed operation and maintenance (FOM) cost, the variable operation and maintenance ( VOM ) cost and the total fuel cost ( C Fuel total ), which are described in Equations (2)–(5). The total cost of investment and the total FOM cost were the sum of the total costs of investment and FOM for each year of the study period. Meanwhile, the total costs of VOM and fuel were the sum of the total costs of each dispatch generator period in each year of the study period. The total cost was influenced by the discount factor, as presented in Equation (6).
minCost = C inv total + C FO & M total + C VO & M total + C Fuel total
C inv total = y g DF y × C inv g × 1000 × P max g NB g y
C FO & M total = y g DF y × [ C FO & M g × 1000 × P max g ( N g + i y NB g i ) ]
C VO & M total = t g DF t y × L t × ( C VO & M g × G g t )
C Fuel total = t g DF t y × L t × ( Heat   Rate   ×   C fuel g × G g t )  
DF = 1 1 + D y
where g is a generator of type g, y is year y, i is the year before year y, t is the period of the time slice in the planning period, DF y is the discount factor for year y, D is the discount rate, C inv total is the total generation investment cost ($), C FO & M total is the total FOM cost ($), C VO & M total is the total VOM cost ($), C Fuel total is the total fuel cost ($), C inv g is the investment cost ($/kW), C FO & M g is the FOM cost of generator g ($/kW), C VO & M g is the VOM of generator g ($/MWh), C fuel g is the fuel cost ($/MWh), P max g is the maximum output of generator g (MW), N g is the number of units installed, NB g y is the number of units g that will be built in year y, NB g i is the number of new generator units built, L t is the length dispatch duration of time period t, Heat Rate is the heat rate of the generator and G g t is the dispatch of generator g (MW).
The GEP considered the availability of local energy resources, economic factors, reliability performance and emission constraints. As shown in Equations (7)–(10), other constraints were considered in the GEP procedures.
g L t × G g t + USE t   PD t   t
G g t P max g N g + i y NB g i
i y NB g i NB Max g , i
g P max g N g + i y NB g i + CS y PL y + RM y y
where USE t is the energy not served (MWh), PD t is the energy demand of time period t (MWh), PL y is the peak load of year y (MW), NB Max g , i is the maximum number of candidate generators, CS y is the capacity shortage of year y (MW) and RM y is the reserve margin in year y (MW).
There were two scenarios in the GEP for the Ambon–Seram system, namely, the isolated system and the interconnected system scenarios. In the isolated system scenario, the four existing systems in the Ambon–Seram system remain separate from one another. Meanwhile, in the interconnected system option, the four systems are planned to be linked in the Ambon–Haruku–Saparua–Seram transmission line. For the interconnected system, the objective function of this scenario based on Equation (1) was modified to consider the transmission line investment cost as shown in Equation (11).
minCost = C inv total + C FO & M total + C VO & M total + C Fuel total + C Inv Line
where C Inv Line is the total investment cost of the interconnection line (USD).
GEP optimization for both scenarios was carried out using PLEXOS software with the MILP solver. Based on the GEP procedures, two reliability indexes could be calculated: the reserve margin (RM) and the LOLP. The reserve margin is the difference between the total installed generating capacity in year y and the system’s peak load in year y. The reserve margin was calculated as shown in Equation (12). LOLP is the probability of the available capacity not meeting the load in a certain period (generally one year) [46,50]. The LOLP was calculated using Equation (13) [51].
RM ( % ) y = g ( P max g × N g y )     PL y PL y
LOLP = j Prob   Cap A = Cap j   .   Prob   Load   >   Cap j = j prob j   .   t j 100
where LOLP is the loss of load probability, Prob is the probability, Cap A is the available generation capacity, Cap j is the remaining generation capacity, Load is the expected load, prob j is the probability of capacity outage and t j is the percentage of time when the load exceeds Cap j .
The GEP results for both scenarios were then evaluated via the reliability index. If they did not meet the standard, then the optimization was repeated. For the isolated system scenario, the reserve margin had to meet the N-2 criteria, in which the RM must be greater than the capacity of the two largest generators. Meanwhile, the interconnected system had to have a LOLP of less than 0.274%. If the LOLP value is <0.274%, this guarantees that the probability of not being supplied by the generator is not more or equal to 1 day in a year [46]. After the reliability index criteria were fulfilled, an analysis of the RES energy mixed target, the system’s reliability and the total costs was carried out. Some of the operating regimes for power systems and particular power plants were also used implicitly as constraints for the optimization problem, including the reserve margin, the ramp rate, capacity factors, load curves, and maximum and minimum output of generator. These parameters determined the amount of long-term energy from the generator.

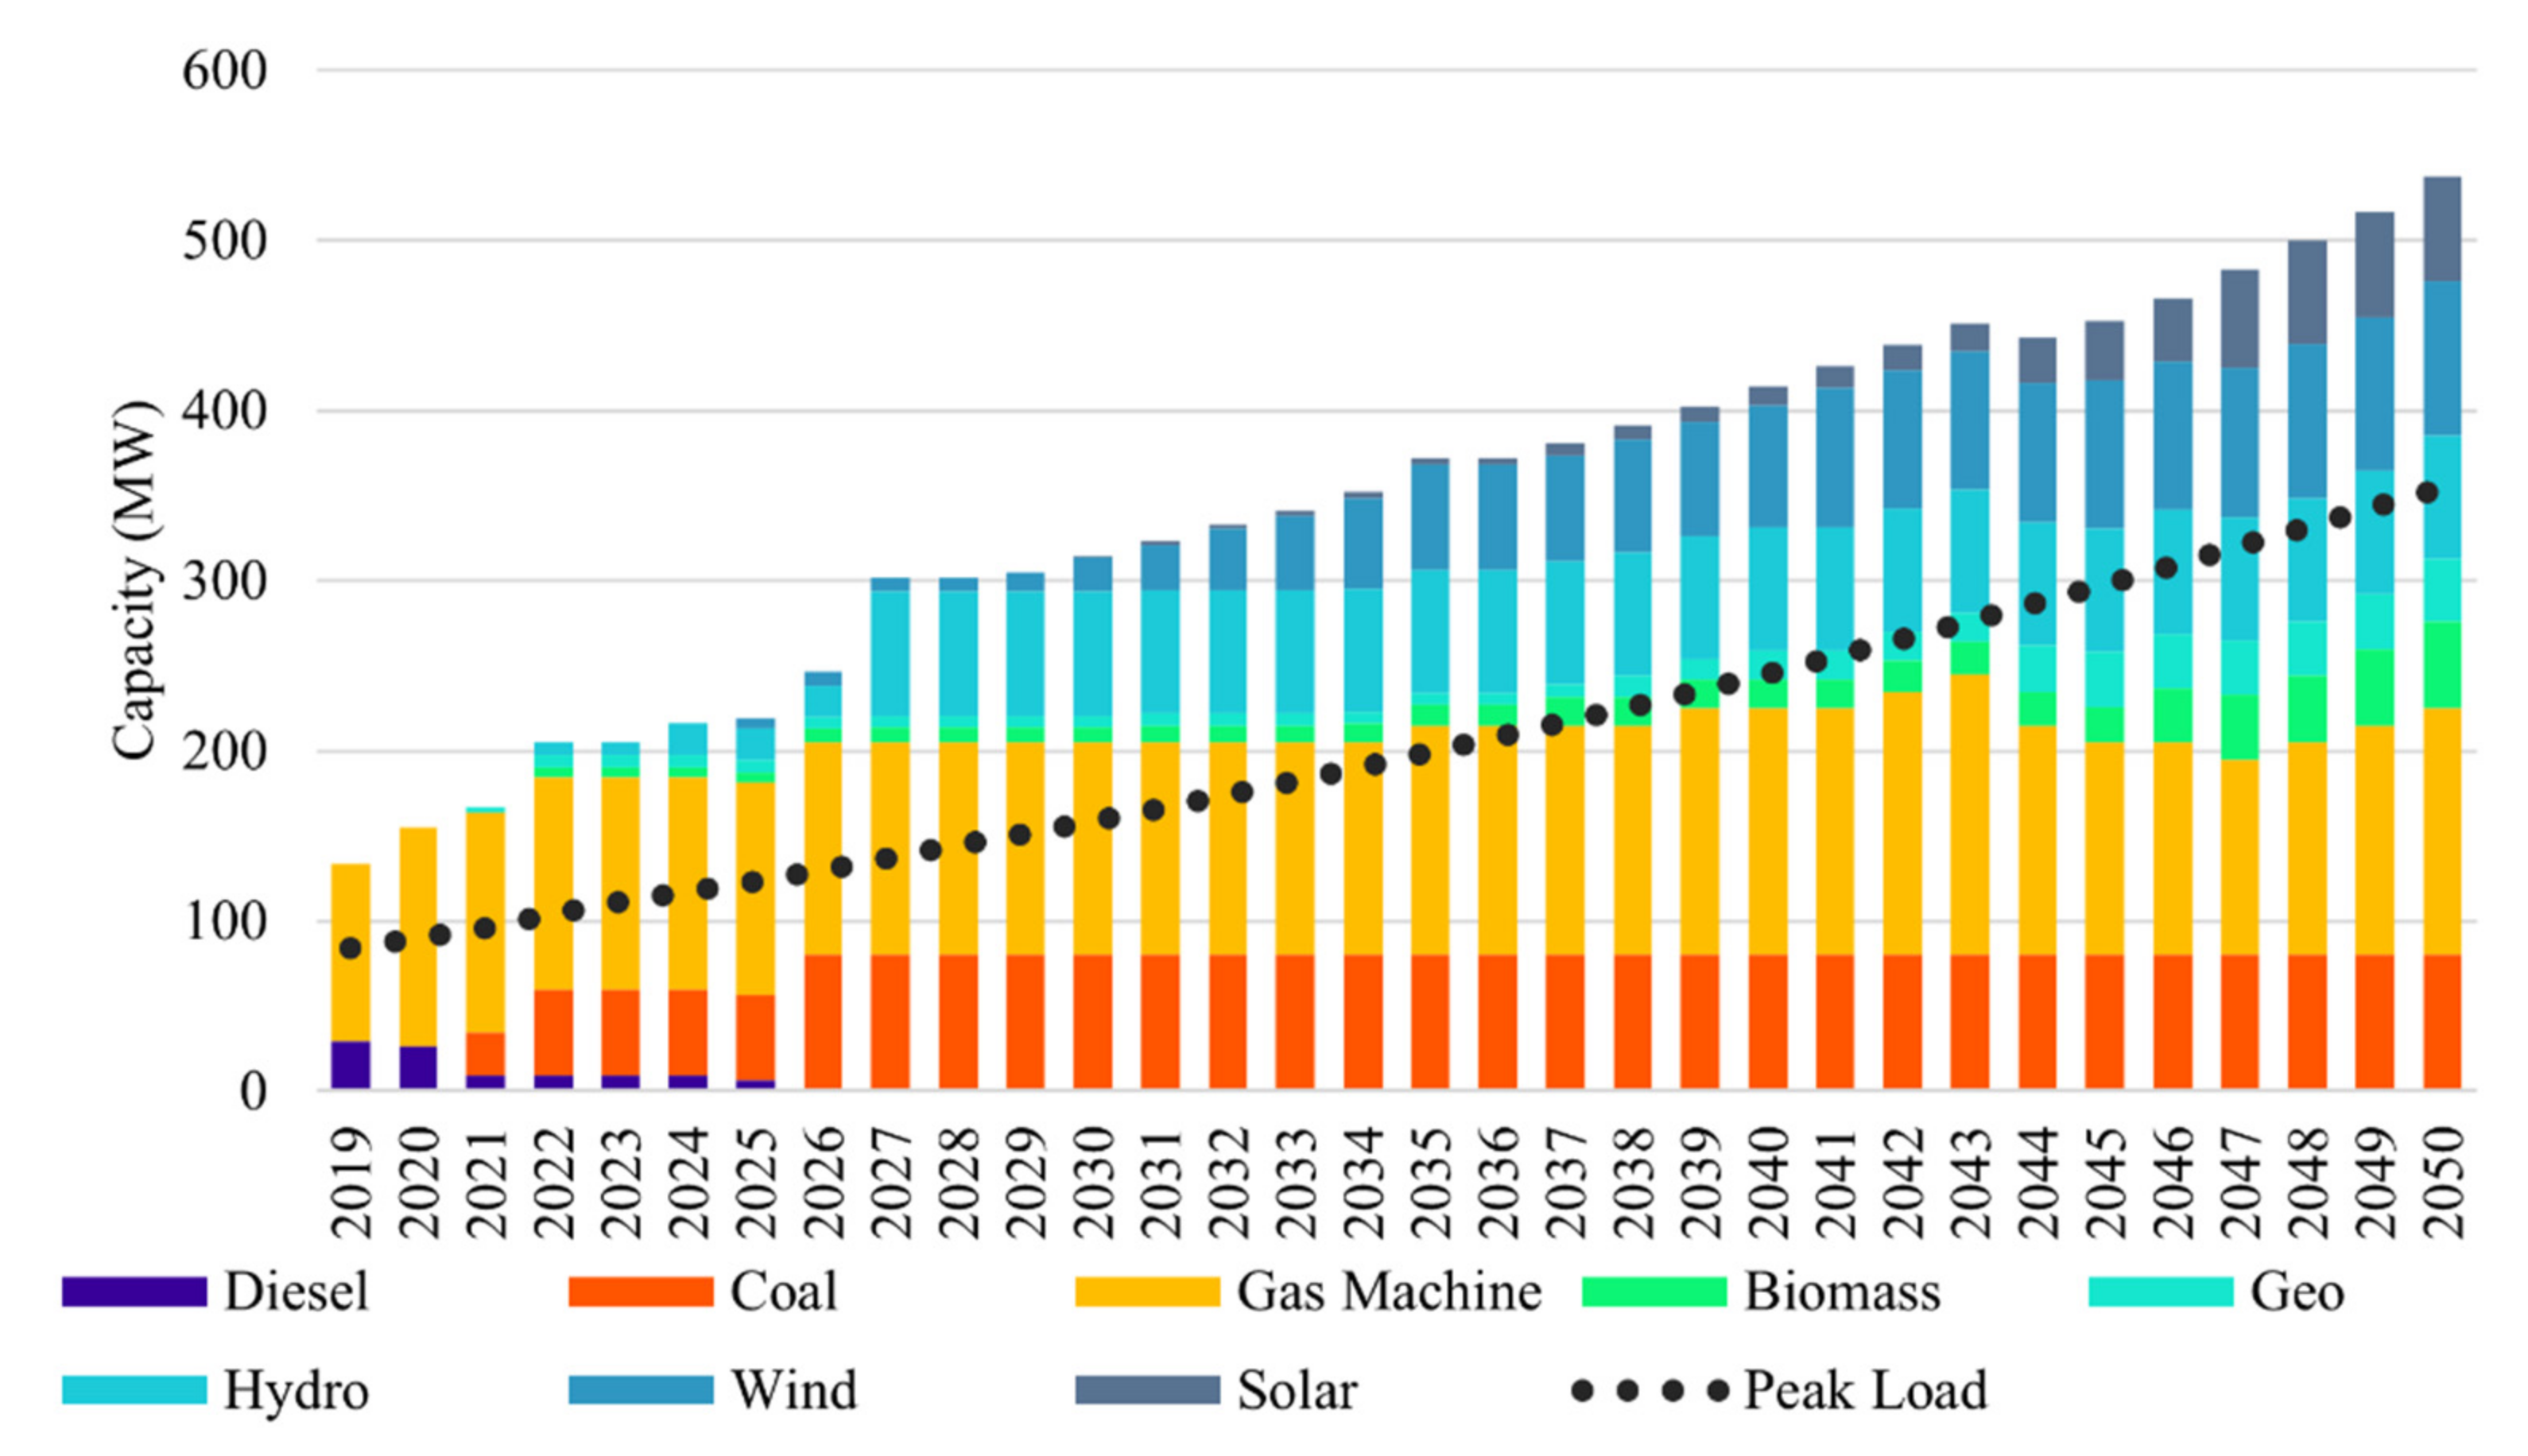
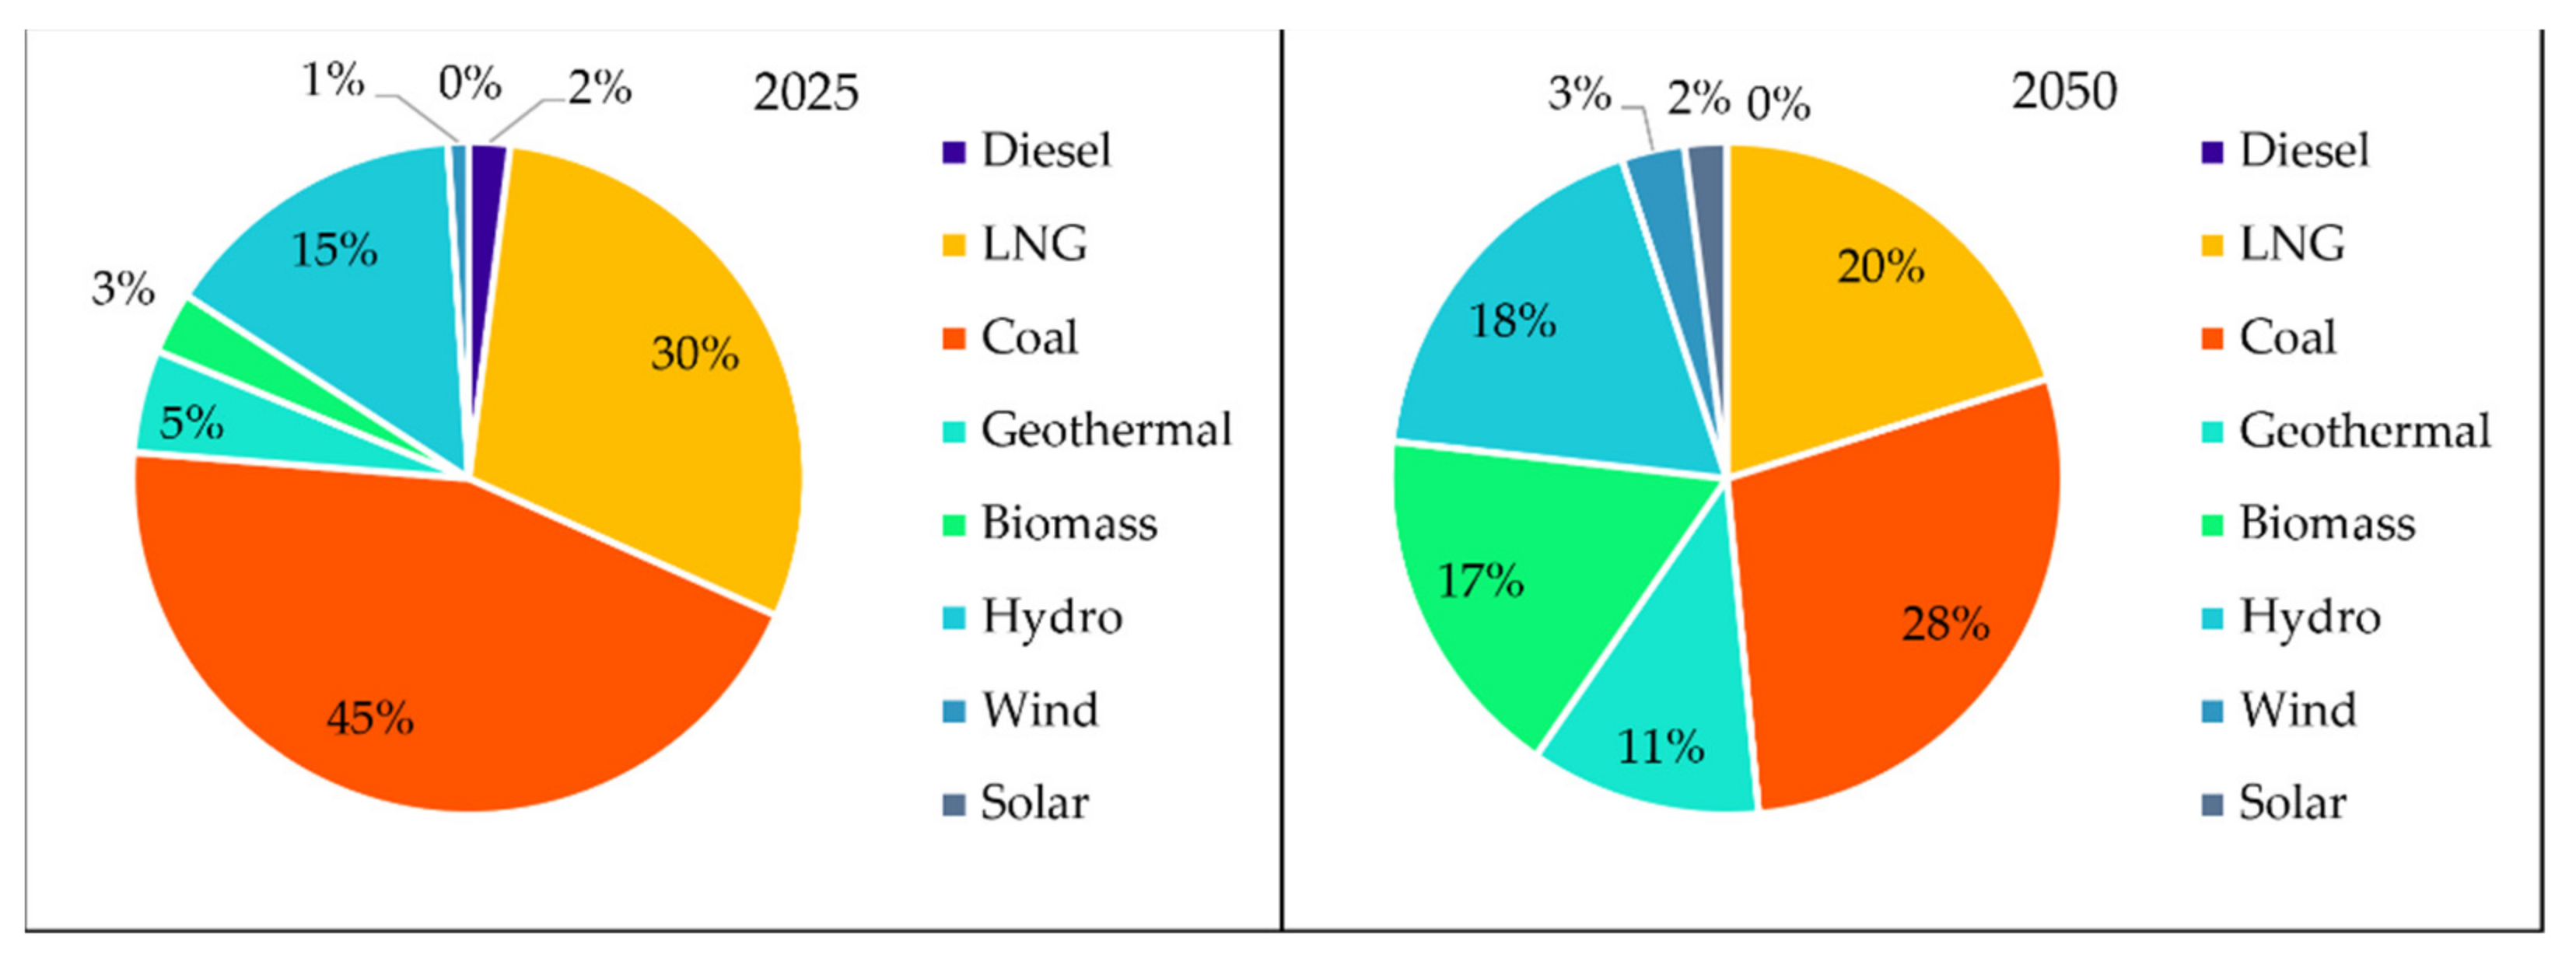
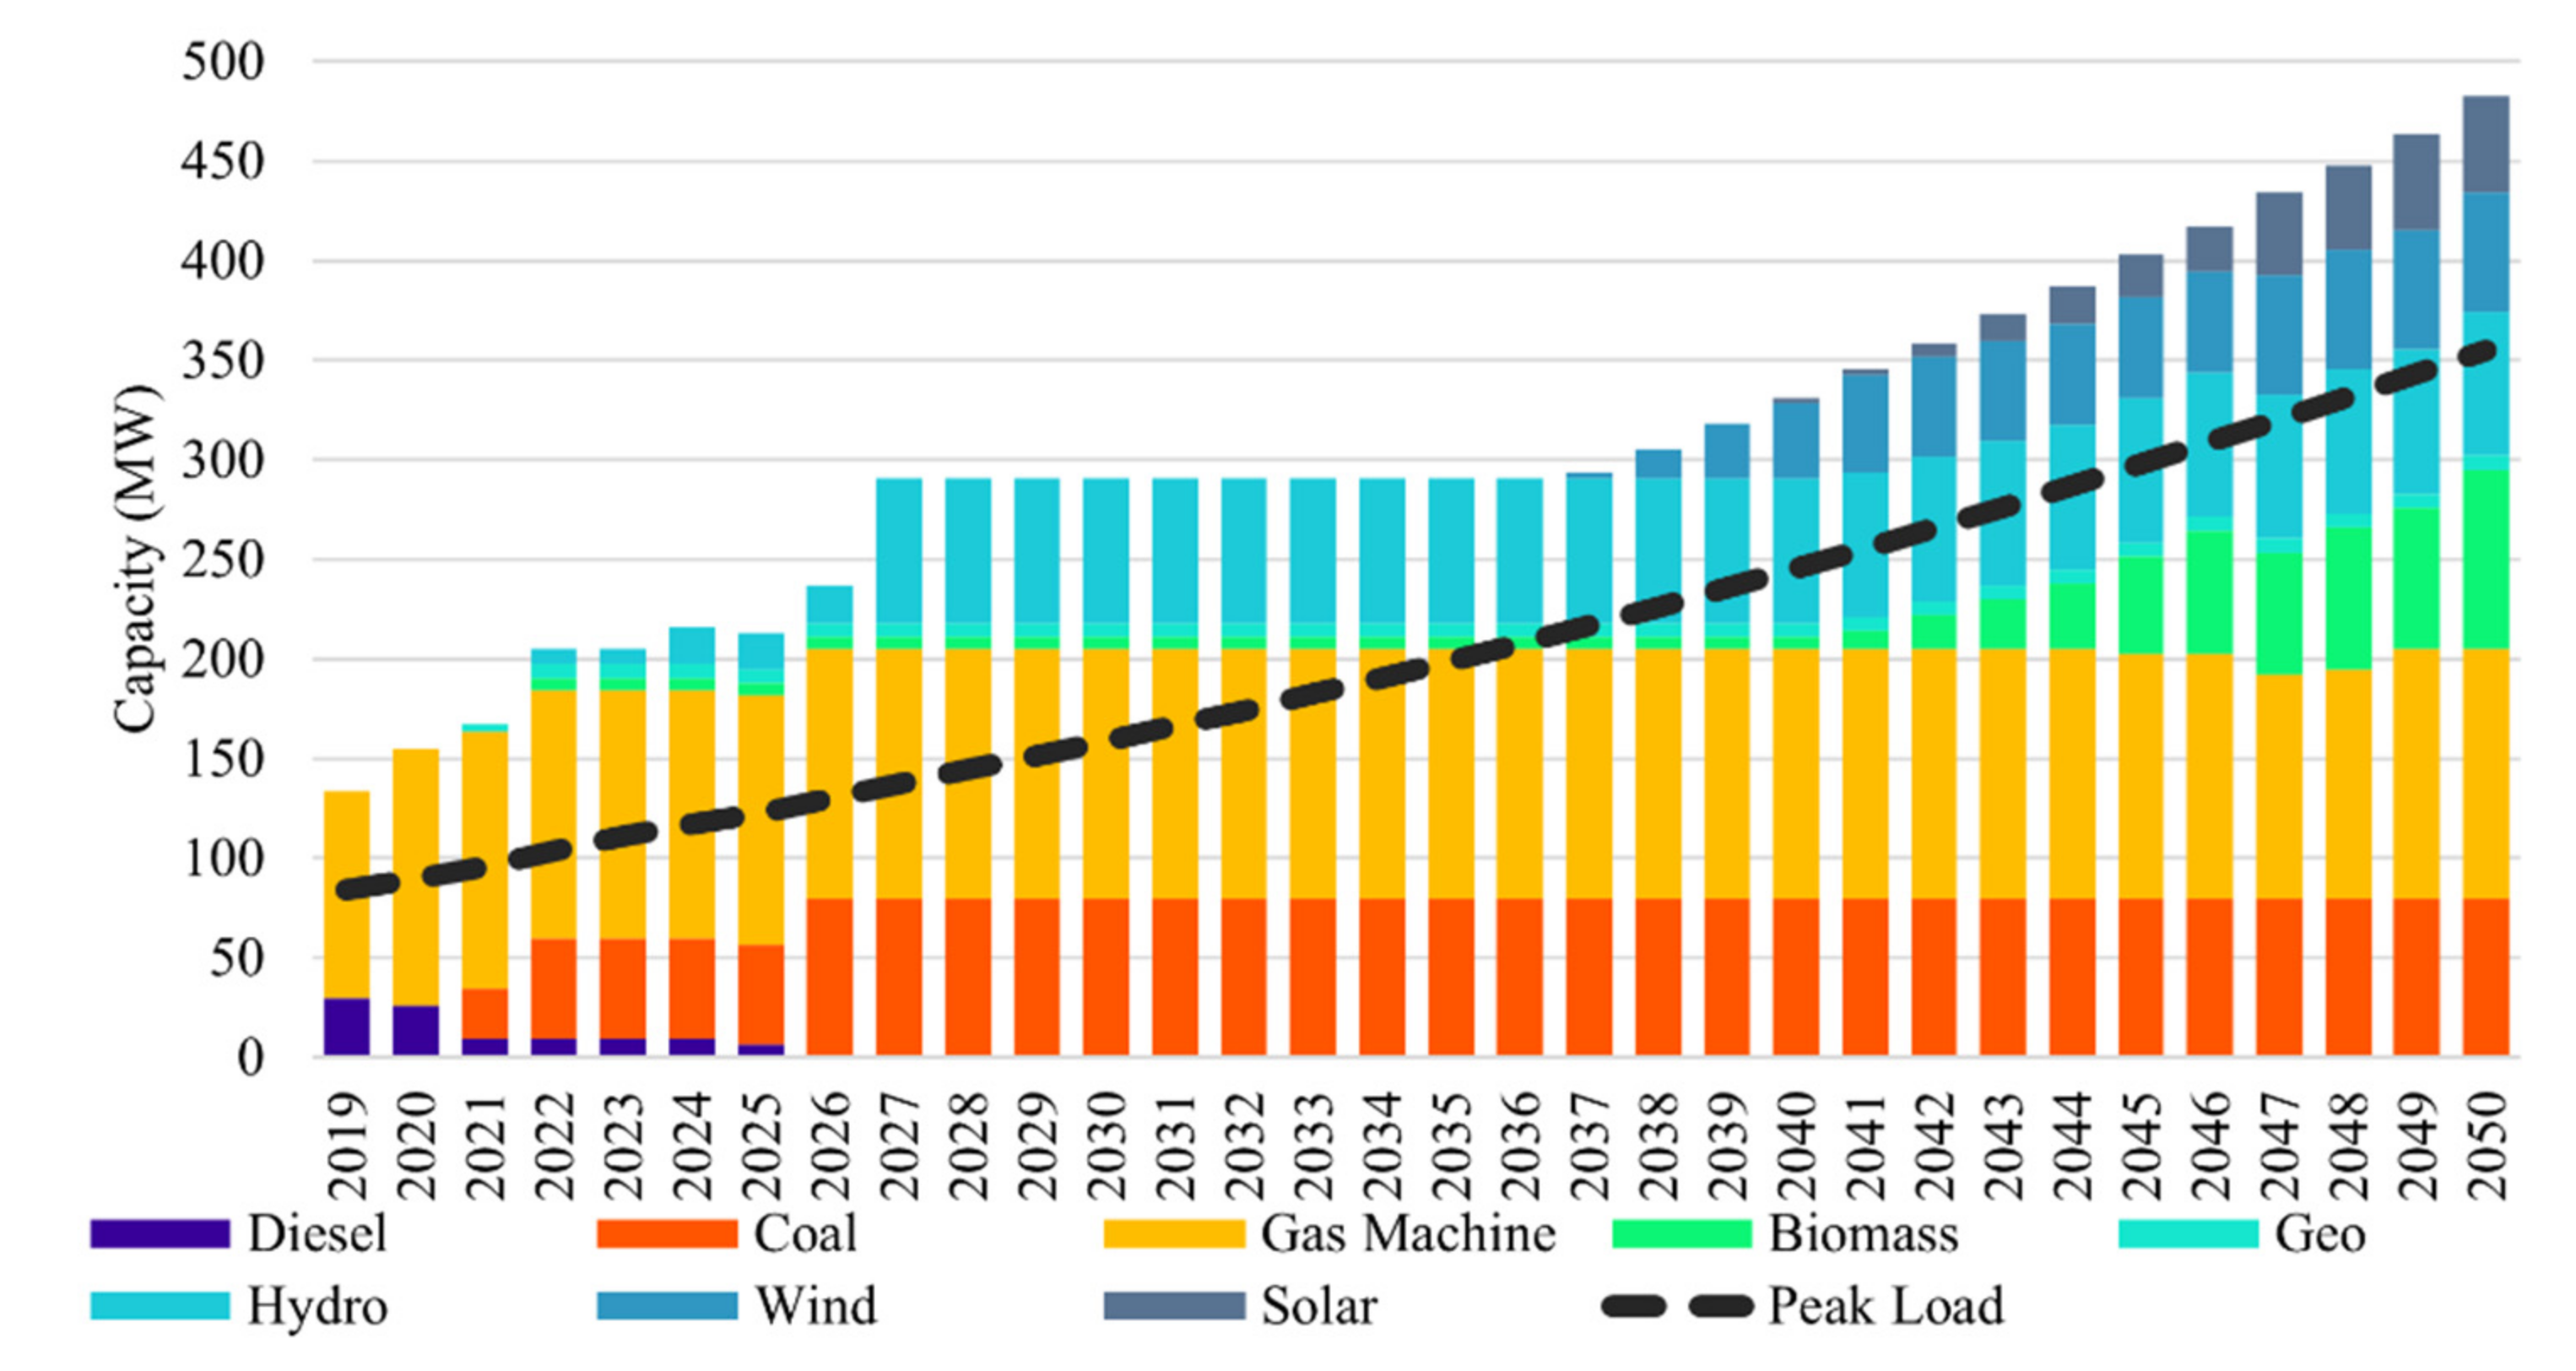
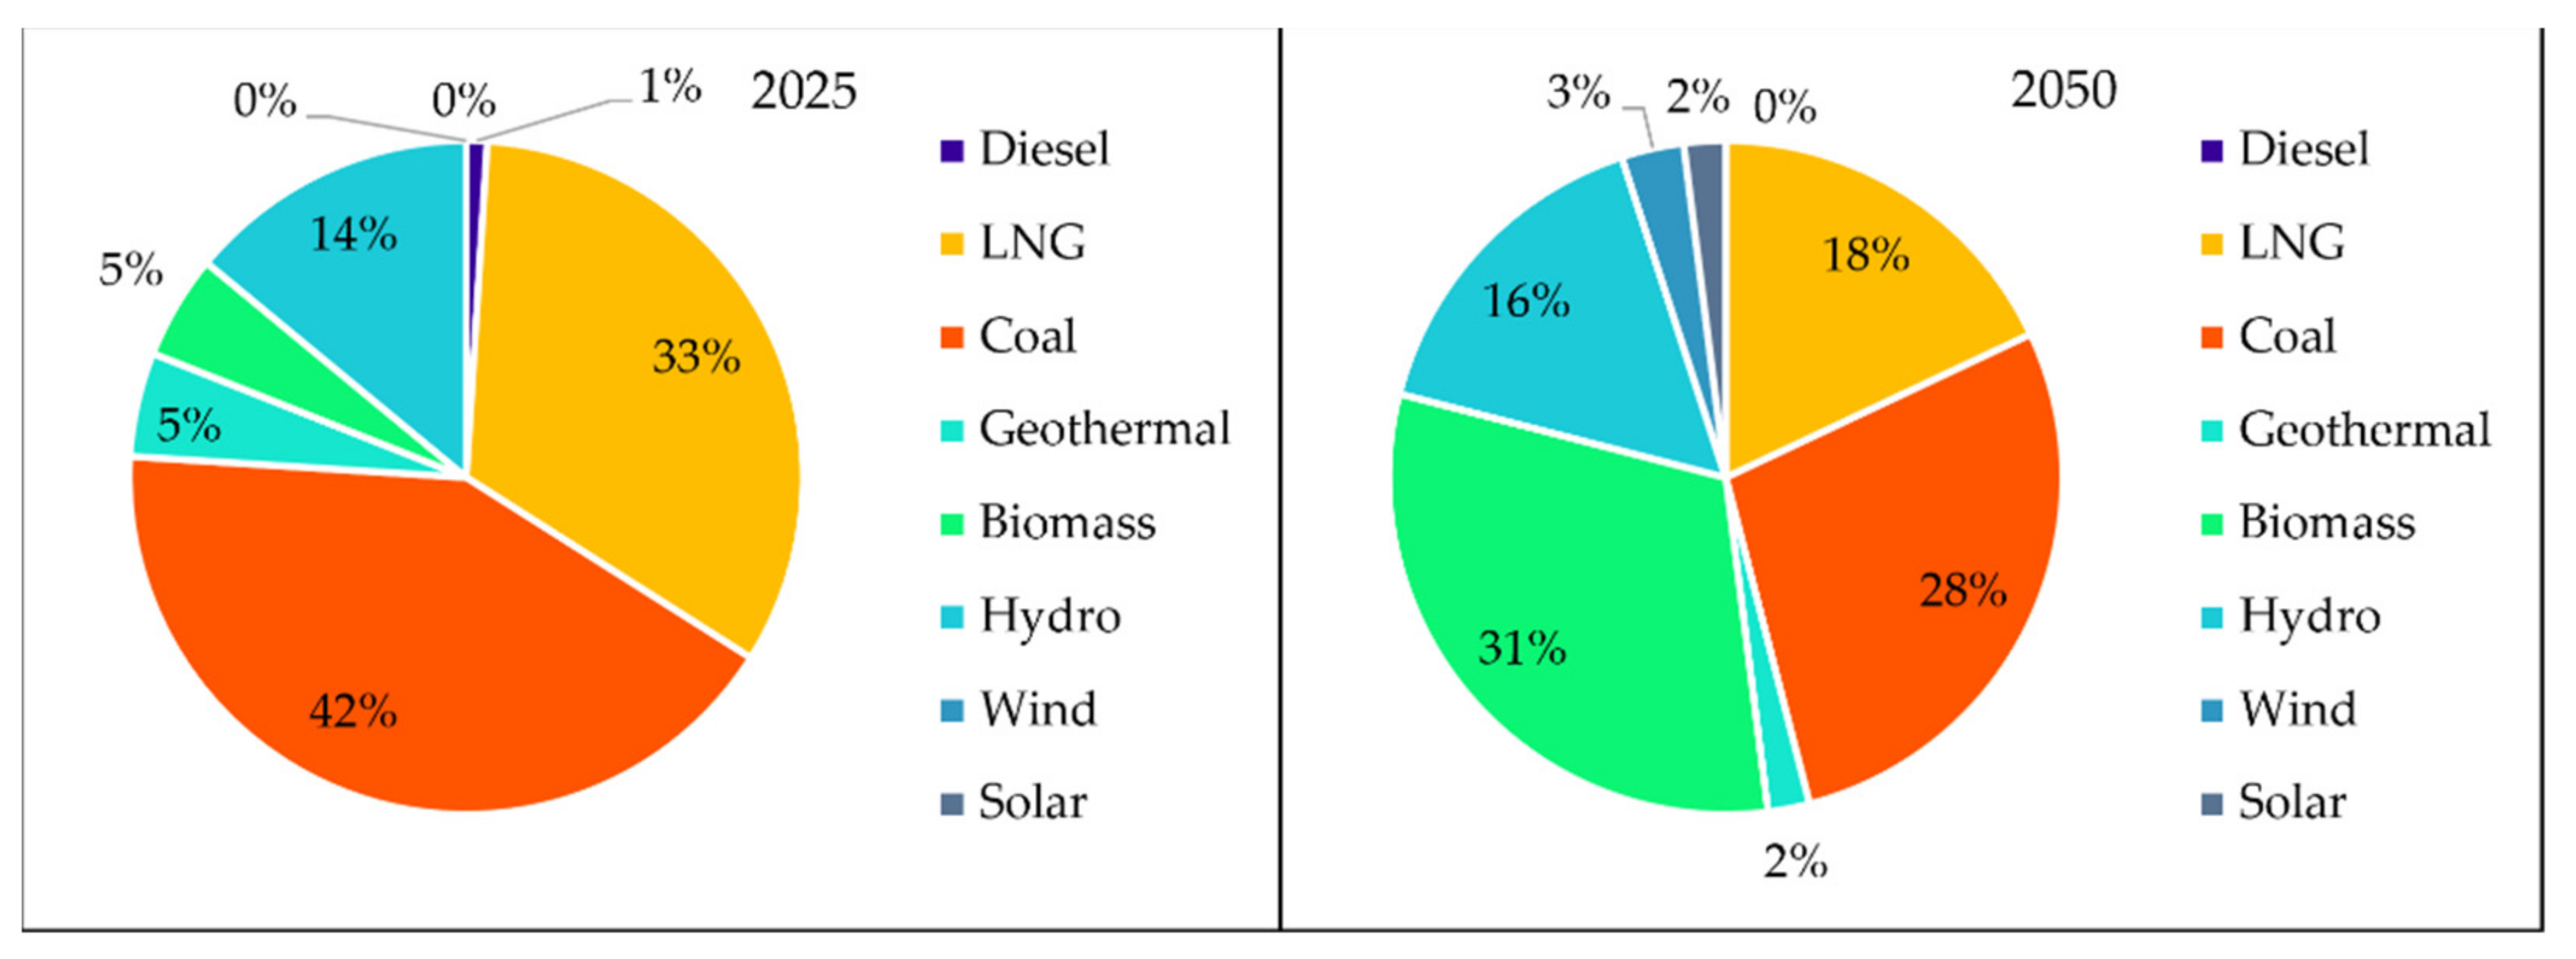
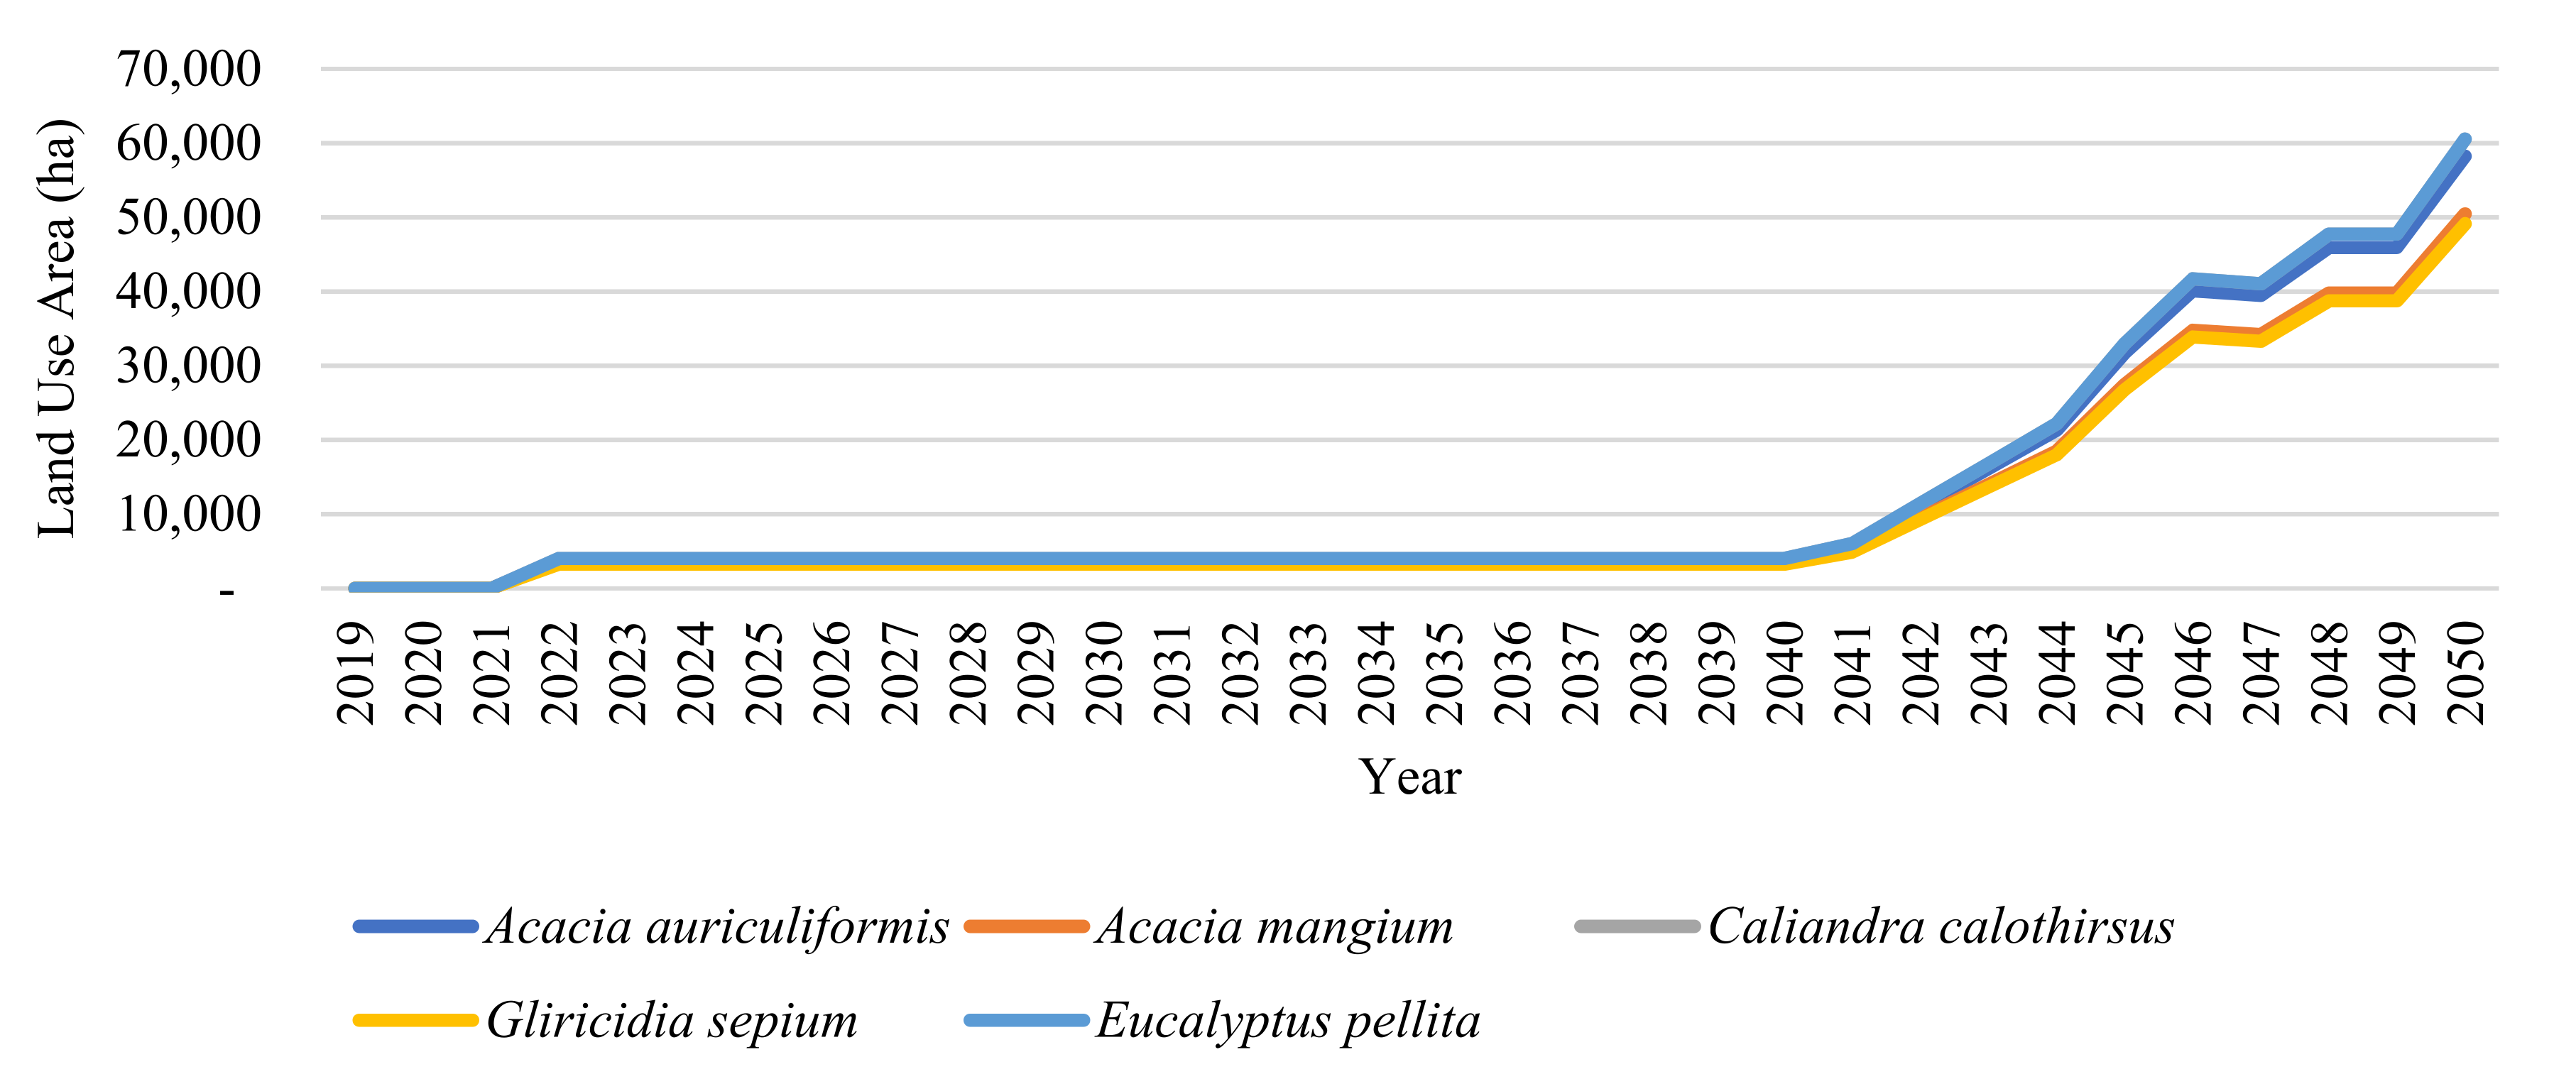
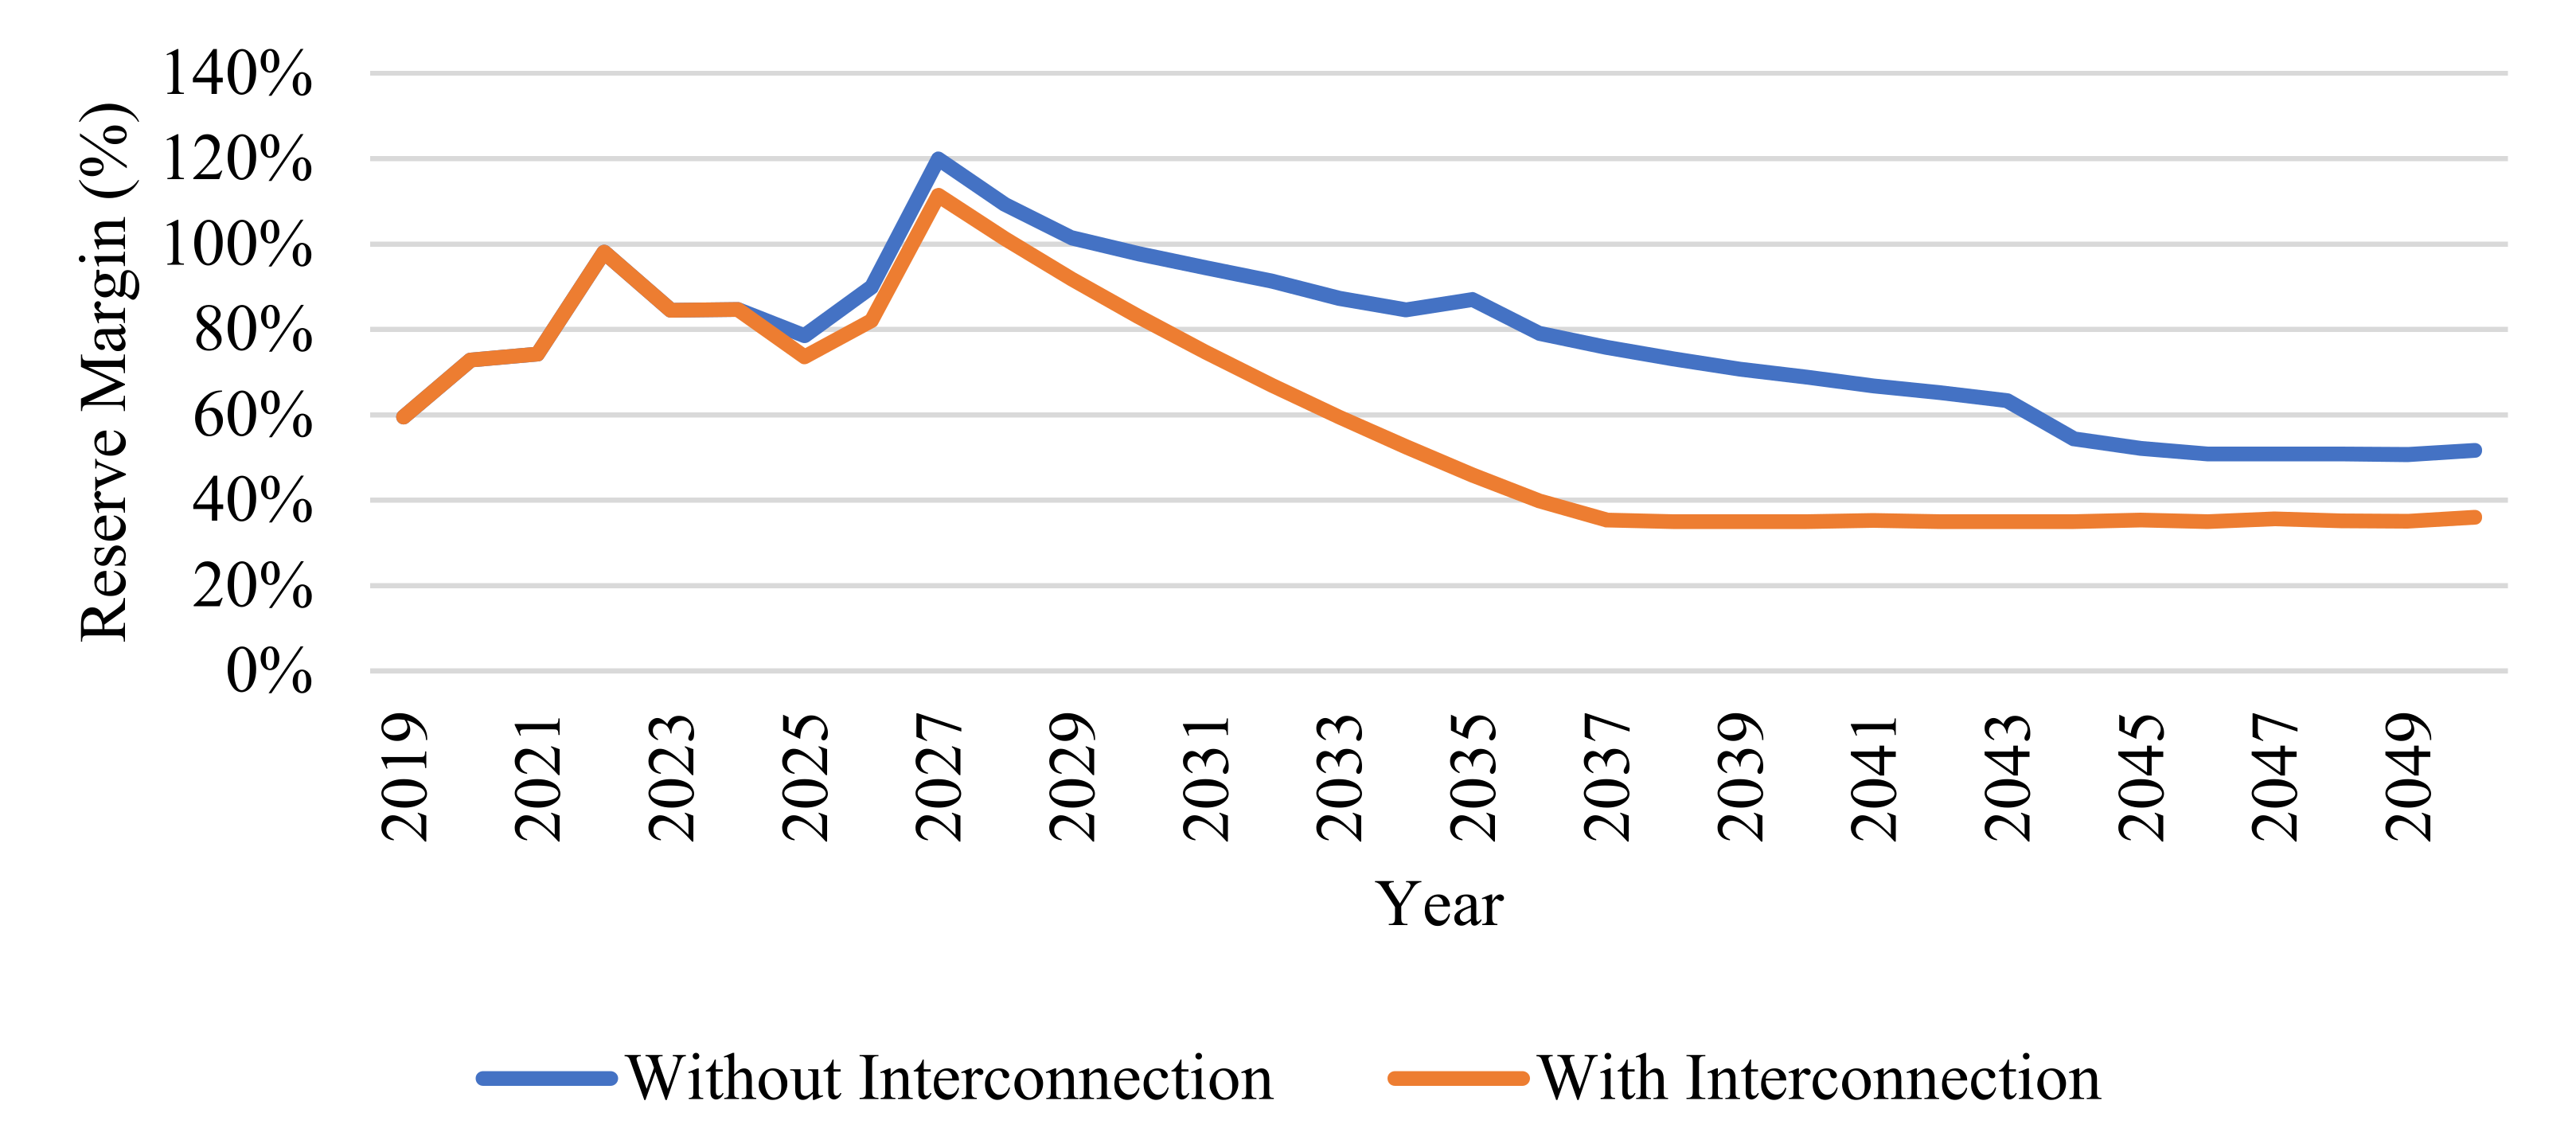
3. Result and Discussions

This section discusses the GEP results of all scenarios for the planning horizon from 2019 to 2050. The results for 2019 to 2024 were obtained from the national electricity supply business plan document [46], while those for 2025 to 2050 were obtained from the GEP optimization. Based on the results of the load forecast, the peak load in 2050 for the Ambon, Seram, Haruku, and Saparua systems is 256.8 MW, 76.7 MW, 3.43 MW, and 18.0 MW, respectively. The total peak load for the entire system would reach 354.7 MW in 2050.
The isolated system scenario produced the annual generating unit composition shown in Figure 11, which requires 537.9 MW of total capacity in 2050, dominated by a gas machine of 145 MW. The RES composition in the system consists of geothermal, biomass, hydro, wind, and diesel energy, with a total capacity of 37 MW, 51 MW, 72.6 MW, 90.5 MW, and 61.8 MW, respectively, for each type of generating unit. The composition of these generating units produced the energy mixed presented in Figure 12, which still meets the Indonesian government’s 31% RES target for 2050. The results show that the share of biomass would increase from 3% in 2025 to 17% in 2050. This increment is the largest of all the sources because biomass is a local renewable energy source available in abundance in the Ambon–Seram area that is cheaper than transporting other primary energy sources from other areas. The generating units’ contributions were based on their function in the system, namely as a baseload, follower or peaker. Baseload power plants included diesel, coal fired, biomass and geothermal power plants. Meanwhile, the follower and peaker power plants included gas machine and hydro power plants. Solar and wind power plants were considered as a must run generating unit.
The interconnected system scenario requires the annual generating unit composition shown in Figure 13, which requires 482.5 MW of total capacity up to 2050, dominated by a gas machine of 125 MW. The interconnection transmission line would be operative in 2026. The RES composition consists of geothermal, biomass, hydro, wind, and diesel energy, with a total capacity of 7 MW, 90 MW, 72.6 MW, 59.8 MW and 48.1 MW, respectively, for each type of power plant. These figures produce the energy mixed shown in Figure 14, which meets the Indonesian government’s target of 31% RES in 2050. It was also found that the share of biomass would increase rapidly from 5% in 2025 to 31% in 2050. The increase in biomass composition is greater than that of the isolated system scenario, as the interconnected system can also optimize the use of local primary RES resources.
The energy mix for the isolated and interconnected scenarios are presented in Figure 12 and Figure 14. In 2025, the RES energy mix was 23% and 24% for the isolated and interconnected scenarios, respectively. Furthermore, in 2050, the RES energy mix is 51% (18% hydro, 17% biomass and 16% other) and 54% (31% biomass, 16% hydro and 7% other) for the isolated and interconnected scenarios, respectively. The potential of biomass in those areas can be optimized by using the interconnected option. Compared to thermal energy, the primary energy of biomass, coal and LNG are presented in Table 8 and Table 9.
Figure 15 and Figure 16 show the land use area needed for biomass production under the isolated system and the interconnected system scenarios, respectively. The production forest should be able to produce biomass from 2022 in both scenarios. In the isolated system scenario, land use showed an increasing trend from 2025 to 2050, while in the interconnected system scenario, land use had a flat trend from 2021 to 2040, then increasing significantly until 2050. This is because when the systems are not interconnected, the electricity needs of each system will be met by local resources, including biomass. With the load increasing each year, the need for biomass generators will also increase. Whereas, in the interconnected system, the electrical energy supply can be obtained from generators in other systems with lower operating costs due to resource sharing. However, along with the increase in load and the retirement of many power plants, additional power plants will be needed, especially renewable energy plants, namely, biomass, which has great potential in Ambon–Seram.
Moreover, the use of biomass at the end of the planning horizon under the interconnected system scenario is more significant than under the isolated system scenario by almost double. This shows that the interconnected system can make more use of the potential of the local biomass resources in Ambon–Seram. The highest land requirement is for using Eucalyptus pellita, which is 60,540 ha in 2050 in the interconnected scenario. The land area still meets the conditions of the existing production forests on Seram and Ambon Islands, which only use about 0.63% according to the forest map in Figure 4.
Figure 17 shows a comparison of the reliability indexes between the isolated and interconnected scenarios. The Haruku and Saparua systems use the N-2 reserve margin criteria for the reliability index, so they were not included in this comparison. The interconnected scenario produced an average reserve margin of 58%. On the other hand, the average reserve margin of the isolated scenarios was 76.2%. This shows that, under the interconnected system scenario, the expansion of power plants is more efficient, which will also impact the cost of electrical generation.
From the economic perspective, the interconnected scenarios provide a more economical generation cost, as presented in Table 10. The isolated system scenario would produce a total cost of USD 809.46 million. At the same time, the interconnected system scenario has a lower total cost of USD 773.7 million. The interconnected system had much better reliability due to resource sharing. If the isolated system needs to achieve the same reliability level as the interconnected system, a higher investment cost of USD 947.03 million would be required.

4. Conclusions

To ensure energy sustainability with an economic total cost and to achieve the RES energy mix target, green and sustainable GEP is needed for the Ambon–Seram system, representing the isolated systems characteristics of the eastern part of Indonesia. For this problem, GEP was modified to consider isolated systems with an interconnection option. In this study, GEP was performed for the isolated and interconnected system scenarios to show the interconnected system’s merit. According to the simulation results, the interconnection scenario requires a smaller reserve margin than the isolated scenario, with an average value of 58%. Moreover, it also meets the LOLP criteria.
Furthermore, the Ambon–Seram system would have a RES energy mix of up to 54% in 2050, which comes from biomass utilization, one of the Ambon–Seram system’s local primary energy sources. In addition, lower generation total costs (a total cost of USD 734.11 million) would be produced under the interconnected scenario. If the investment cost of the interconnection line of USD 39.59 million is included, the total cost of the interconnected system is USD 773.7 million. This is a difference of USD 35.76 million and is more economical than the isolated scenario. This proposed procedure might be applied as a sustainable energy planning procedure for other areas with the same characteristics to ensure system reliability, optimize the local energy resources and obtain the most economical system in terms of cost.
Operating interconnected island systems with a high penetration of intermittent RES generations is challenging, as it is necessary to ensure the compliance to grid operation codes. The operating condition of the interconnected island system keeps changing due to disturbances which are not only from component failures and short circuits but also from variable and intermittent RES generation. For future research, it is necessary to perform power system analysis to ensure the stability and reliability of the systems. In addition, power system analysis should be performed to cover smaller resolution times and more variable loads and weather conditions to reflect real conditions encountered in practical interconnected island systems.

Author Contributions

Conceptualization, T., L.M.P., S. and F.D.W.; methodology, L.M.P., S. and F.D.W.; software, L.M.P. and S.; validation, T., L.M.P., S., F.D.W., A.P. and I.S.; formal analysis, T., L.M.P., S. and F.D.W.; investigation, T., L.M.P., S. and F.D.W.; resources, L.M.P., S., F.D.W., A.P. and I.S.; data curation, T., L.M.P., and I.S.; writing—original draft preparation, T., L.M.P., S. and F.D.W.; writing—review and editing, L.M.P., S. and F.D.W.; visualization, L.M.P., S. and F.D.W.; supervision, T.; project administration, T. and L.M.P. All authors have read and agreed to the published version of the manuscript.

Funding

This research received no external funding.

Institutional Review Board Statement

Not applicable.

Informed Consent Statement

Not applicable.

Data Availability Statement

Not applicable.

Conflicts of Interest

The authors declare no conflict of interest.

References

  1. EIA. International Energy Outlook 2016; U.S. Energy Information Administration (EIA): Washington, DC, USA, 2016; Volume 1.
  2. Lund, H. Renewable energy strategies for sustainable development. Energy 2007, 32, 912–919. [Google Scholar] [CrossRef] [Green Version]
  3. Ebhota, W.S. Power accessibility, fossil fuel and the exploitation of small hydropower technology in sub-saharan Africa. Int. J. Sustain. Energy Plan. Manag. 2019, 19, 13–28. [Google Scholar] [CrossRef]
  4. Kementerian Energi dan Sumber Daya Mineral. Rencana Usaha Penyediaan Tenaga Listrik PT. PLN (Persero) Tahun 2018 s.d. 2027; Kementerian Energi dan Sumber Daya Mineral: Jakarta, Indonesia, 2018. [Google Scholar]
  5. Nguyen, H.T.; Felder, F.A. Generation expansion planning with renewable energy credit markets: A bilevel programming approach. Appl. Energy 2020, 276, 115472. [Google Scholar] [CrossRef]
  6. Fitiwi, D.Z.; Lynch, M.; Bertsch, V. Enhanced network effects and stochastic modelling in generation expansion planning: Insights from an insular power system. Soc.-Econ. Plan. Sci. 2020, 71, 100859. [Google Scholar] [CrossRef]
  7. Seck, G.S.; Krakowski, V.; Assoumou, E.; Maïzi, N.; Mazauric, V. Embedding power system’s reliability within a long-term Energy System Optimization Model: Linking high renewable energy integration and future grid stability for France by 2050. Appl. Energy 2019, 257, 114037. [Google Scholar] [CrossRef]
  8. Khan, A.Z.; Sun, Y.; Ashfaq, A. Generation expansion planning considering externalities for large scale integration of renewable energy. In Proceedings of the 2014 IEEE International Conference on Intelligent Energy and Power Systems (IEPS), Kyiv, Ukraine, 2–6 June 2014; pp. 135–140. [Google Scholar] [CrossRef]
  9. Chen, Q.; Kang, C.; Xia, Q.; Zhong, J. Power Generation Expansion Planning Model Towards Low-Carbon Economy and Its Application in China. IEEE Trans. Power Syst. 2010, 25, 1117–1125. [Google Scholar] [CrossRef] [Green Version]
  10. Shengyu, W.; Lu, C.; Xiaoqing, Y.; Bo, Y. Long-term generation expansion planning under uncertainties and fluctuations of multi-type renewables. In Proceedings of the 2015 IEEE 5th International Conference on Power Engineering, Energy and Electrical Drives (POWERENG), Riga, Latvia, 11–13 May 2015; pp. 612–616. [Google Scholar] [CrossRef]
  11. da Luz, T.J.; Moura, P.; Almeida, A. Multi-objective power generation expansion planning with high penetration of renewables. Renew. Sustain. Energy Rev. 2018, 81, 2637–2643. [Google Scholar] [CrossRef]
  12. Pereira, S.; Ferreira, P.; Vaz, A.I.F. Generation expansion planning with high share of renewables of variable output. Appl. Energy 2017, 190, 1275–1288. [Google Scholar] [CrossRef]
  13. Rady, Y.Y.; Rocco, M.V.; Serag-Eldin, M.; Colombo, E. Modelling for power generation sector in Developing Countries: Case of Egypt. Energy 2018, 165, 198–209. [Google Scholar] [CrossRef]
  14. Shinwari, E.M.F. Optimization Model using WASP-IV for Pakistan’s Power Plants Generation Expansion Plan. IOSR J. Electr. Electron. Eng. 2012, 3, 39–49. [Google Scholar] [CrossRef]
  15. Malik, A.; Kuba, C. Power Generation Expansion Planning Including Large Scale Wind Integration: A Case Study of Oman. Wind. Resour. Future Energy Secur. 2015, 2013, 51–68. [Google Scholar] [CrossRef]
  16. Wright, J.; Bischof-Niemz, T.; Calitz, J.; Mushwana, C.; van Heerden, R. Long-term electricity sector expansion planning: A unique opportunity for a least cost energy transition in South Africa. Renew. Energy Focus 2019, 30, 21–45. [Google Scholar] [CrossRef]
  17. Khan, I. Power generation expansion plan and sustainability in a developing country: A multi-criteria decision analysis. J. Clean. Prod. 2019, 220, 707–720. [Google Scholar] [CrossRef]
  18. Shirley, R.; Kammen, D. Energy planning and development in Malaysian Borneo: Assessing the benefits of distributed technologies versus large scale energy mega-projects. Energy Strat. Rev. 2015, 8, 15–29. [Google Scholar] [CrossRef]
  19. Muttaqien, K.I. Perencanaan Pengembangan Pembangkit Sistem Jawa-Bali Menggunakan Model Optimasi OSeMOSYS; Universitas Gadjah Mada: Yogyakarta, Indonesia, 2017. [Google Scholar]
  20. Budi, R.F.S. Optimasi Pengembangan Pembangkit Sistem Kelistrikan Jawa-Madura-Bali Menggunakan Game Theory: Multi-Period Framework, Bi-Level, dan Multi-Objective Optimization Method; Universitas Gadjah Mada: Yogyakarta, Indonesia, 2017. [Google Scholar]
  21. Muthahhari, A.A.; Putranto, L.M.; Sarjiya; Anugerah, F.S.; Priyanto, A.; Isnandar, S.; Savitri, I. Long-Term Generation Expansion Planning in Sulawesi Electricity System Considering High Share of Intermittent Renewable Energy Resource. In Proceedings of the 2019 11th International Conference on Information Technology and Electrical Engineering (ICITEE), Pattaya, Thailand, 10–11 October 2019; pp. 1–6. [Google Scholar] [CrossRef]
  22. Putrisia, T.I. Perencanaan Sistem Pembangkitan untuk Wilayah Sulawesi dengan Menggunakan OSeMOSYS; Universitas Gadjah Mada: Yogyakarta, Indonesia, 2017. [Google Scholar]
  23. Tumiran; Sarjiya; Putranto, L.M.; Priyanto, A.; Savitri, I. Generation expansion planning for high-potential hydropower resources: The case of the Sulawesi electricity system. Int. J. Sustain. Energy Plan. Manag. 2020, 28, 37–52. [Google Scholar]
  24. Presiden Republik Indonesia. Peraturan Presiden Republik Indonesia No. 61 Tahun 2011 Tentang Rencana Aksi Nasional Penurunan Emisi Gas Rumah Kaca; Presiden Republik Indonesia: Jakarta, Indonesia, 2011. [Google Scholar]
  25. Kementerian Hukum dan Hak Asasi Manusia. Undang-Undang Republik Indonesia No. 16 Tahun 2016 Tentang Pengesahaan Paris Agreement to The United Nations Framework Convention on Climate Change. 2016. Available online: https://peraturan.bpk.go.id/Home/Details/37573 (accessed on 29 June 2021).
  26. The World Bank. Indonesia and Climate Change: Current Status and Policies; The World Bank: Washington, DC, USA, 2007. [Google Scholar]
  27. Indonesian Government. Indonesian Government Law No 79 In 2014 About National Energy Policy; Indonesian Government: Jakarta, Indonesia, 2014; p. 8. [Google Scholar]
  28. Pusat Kajian LKFT Universitas Gadjah Mada (LKFT Study Center Universitas Gadjah Mada). Penyusunan Kajian Masterplan Kelistrikan Sulawesi (The Sulawesi Electricity Master Plan Study); Pusat Kajian LKFT Universitas Gadjah Mada (LKFT Study Center Universitas Gadjah Mada): Yogyakarta, Indonesian, 2018. [Google Scholar]
  29. PT PLN (Persero). Statistik PLN 2019 (PLN STATISTICS 2019); PT PLN (Persero): Jakarta, Indonesia, 2019. [Google Scholar]
  30. de Lima, G.S.C.; Lopes, E.C.; Motta, J.G.; Asano, R.; Valverde, M.; Suyama, R.; Leite, P.T. Sustainable development enhanced in the decision process of electricity generation expansion planning. Renew. Energy 2018, 123, 563–577. [Google Scholar] [CrossRef]
  31. Palmintier, B.S.; Webster, M.D. Impact of Operational Flexibility on Electricity Generation Planning With Renewable and Carbon Targets. IEEE Trans. Sustain. Energy 2015, 7, 672–684. [Google Scholar] [CrossRef]
  32. Koltsaklis, N.; Dagoumas, A.S.; Kopanos, G.M.; Pistikopoulos, E.N.; Georgiadis, M.C. A spatial multi-period long-term energy planning model: A case study of the Greek power system. Appl. Energy 2013, 115, 456–482. [Google Scholar] [CrossRef]
  33. Nemati, H.; Latify, M.A.; Yousefi, G.R. Coordinated generation and transmission expansion planning for a power system under physical deliberate attacks. Int. J. Electr. Power Energy Syst. 2018, 96, 208–221. [Google Scholar] [CrossRef]
  34. Tsai, C.-H.; Figueroa-Acevedo, A.; Boese, M.; Li, Y.; Mohan, N.; Okullo, J.; Heath, B.; Bakke, J. Challenges of planning for high renewable futures: Experience in the U.S. midcontinent electricity market. Renew. Sustain. Energy Rev. 2020, 131, 109992. [Google Scholar] [CrossRef]
  35. Bhuvanesh, A.; Christa, S.J.T.; Kannan, S.; Pandiyan, M.K. Aiming towards pollution free future by high penetration of renewable energy sources in electricity generation expansion planning. Futures 2018, 104, 25–36. [Google Scholar] [CrossRef]
  36. Howells, M.; Rogner, H.; Strachan, N.; Heaps, C.; Huntington, H.; Kypreos, S.; Hughes, A.; Silveira, S.; DeCarolis, J.; Bazillian, M.; et al. OSeMOSYS: The Open Source Energy Modeling System: An introduction to its ethos, structure and development. Energy Policy 2011, 39, 5850–5870. [Google Scholar] [CrossRef]
  37. Simiyu, P. Green-Based Generation Expansion Planning For Kenya Using Wien Automatic Software Package (WASP) IV Model. Int. J. Technol. Enhanc. Emerg. Eng. Res. 2015, 3, 70–79. [Google Scholar]
  38. Rouhani, A.; Varamini, G.; Nikkhah, M. Generation Expansion Planning Considering Renewable Energies. Am. J. Eng. Res. 2013, 2, 276–286. [Google Scholar]
  39. Van Zuijlen, B.; Zappa, W.; Turkenburg, W.; Van Der Schrier, G.; van den Broek, M. Cost-optimal reliable power generation in a deep decarbonisation future. Appl. Energy 2019, 253. [Google Scholar] [CrossRef]
  40. Brouwer, A.S.; van den Broek, M.; Zappa, W.; Turkenburg, W.C.; Faaij, A. Least-cost options for integrating intermittent renewables in low-carbon power systems. Appl. Energy 2016, 161, 48–74. [Google Scholar] [CrossRef] [Green Version]
  41. Cole, W.; Greer, D.; Ho, J.; Margolis, R. Considerations for maintaining resource adequacy of electricity systems with high penetrations of PV and storage. Appl. Energy 2020, 279, 115795. [Google Scholar] [CrossRef]
  42. Al Naimi, M.S.; Ali, M.I.H.; Mogi, G. Abu Dhabi energy mix using PLEXOS as optimization tool. In Proceedings of the 2018 5th International Conference on Renewable Energy: Generation and Applications (ICREGA), Al Ain, United Arab Emirates, 25–28 February 2018; pp. 82–86. [Google Scholar] [CrossRef]
  43. González, P.; Romero-Cadaval, E.; González, E.; Guerrero, M.A. Impact of Grid Connected Photovoltaic System in the Power Quality of a Distribution Network. IFIP Adv. Inf. Commun. Technol. 2011, 349, 466–473. [Google Scholar]
  44. Collins, S.; Deane, P.; Poncelet, K.; Panos, E.; Pietzcker, R.; Delarue, E.; Gallachoir, B.O. Integrating short term variations of the power system into integrated energy system models: A methodological review. Renew. Sustain. Energy Rev. 2017, 76, 839–856. [Google Scholar] [CrossRef] [Green Version]
  45. Norvaiša, E.; Galinis, A.; Neniškis, E. Incorporation of wind power probabilities into long-term energy system development analysis using bottom-up models. Energy Strat. Rev. 2021, 38, 100770. [Google Scholar] [CrossRef]
  46. Kementerian Energi dan Sumber Daya Mineral Republik Indonesia (Ministry of Energy and Mineral Resources Republic of Indonesia). Rencana Usaha Penyediaan Tenaga Listrik PT. PLN (Persero) 2019–2028 (Electricity Supply Business Plan); Kementerian Energi dan Sumber Daya Mineral Republik Indonesia (Ministry of Energy and Mineral Resources Republic of Indonesia): Jakarta, Indonesia, 2019. [Google Scholar]
  47. Ibrahim, M.H.; Sarjiya; Putranto, L.M. Optimisasi Perencanaan Pengembangan Pembangkit Sistem Ambon-Seram Mempertimbangkan Energi Baru dan Terbarukan dan Faktor Lingkungan—Studi Kasus Sistem Ambon; Universitas Gadjah Mada: Yogyakarta, Indonesia, 2020. [Google Scholar]
  48. Triprastowo, B.; Sarjiya; Putranto, L.M. Optimisasi Perencanaan Pengembangan Pembangkit Sistem Ambon-Seram Mempertimbangkan Energi Baru dan Terbarukan dan Faktor Lingkungan—Studi Kasus Sistem Seram; Universitas Gadjah Mada: Yogyakarta, Indonesia, 2020. [Google Scholar]
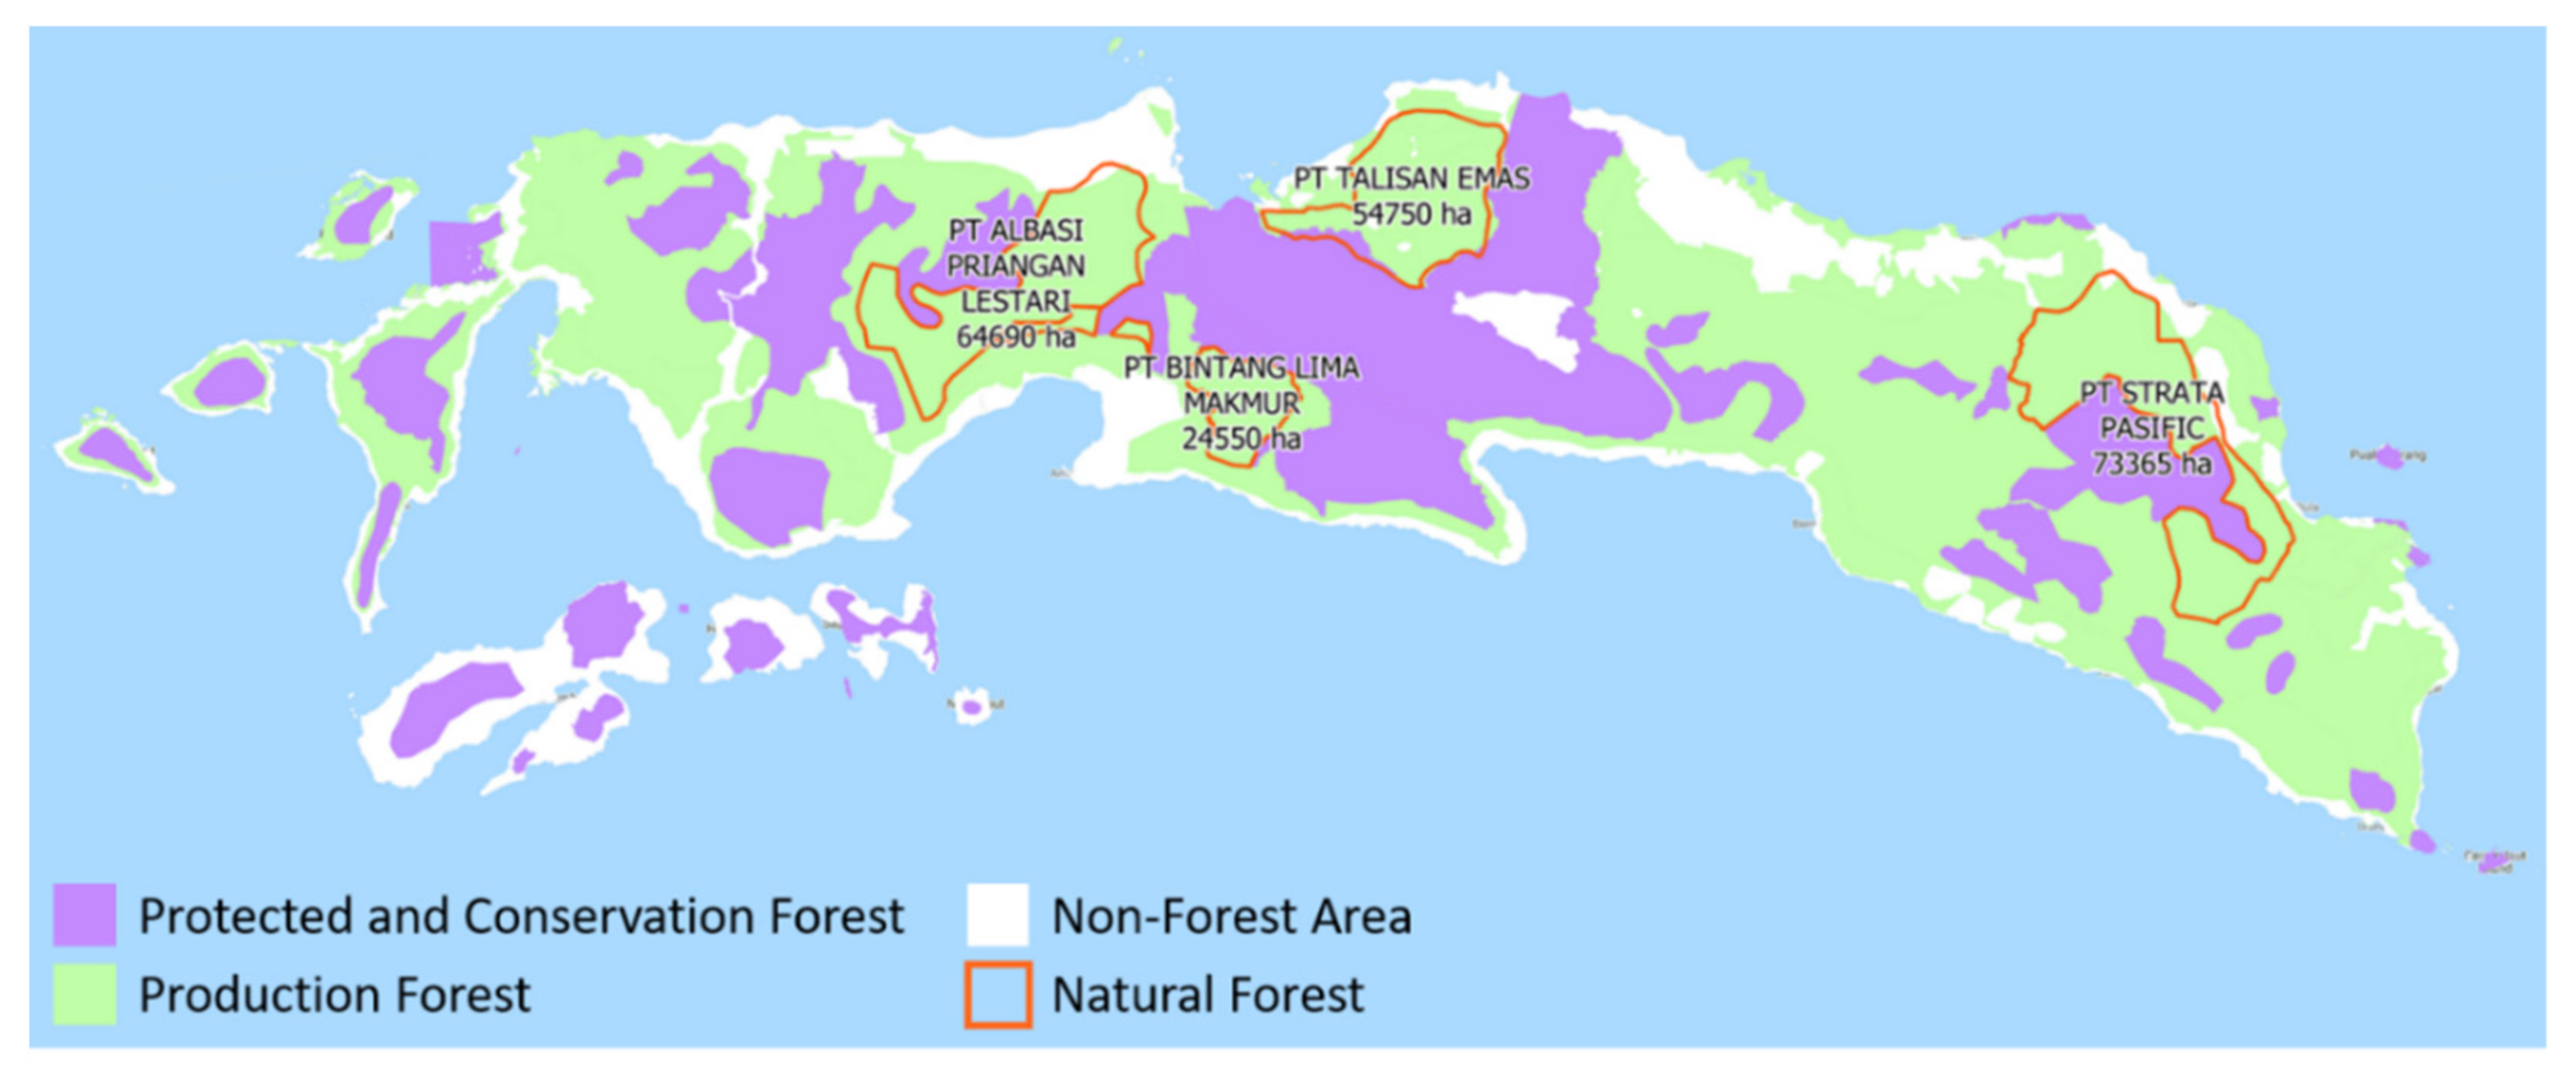
  49. Kementerian Lingkungan Hidup dan Kehutanan Republik Indonesia. Lampiran I Surat Keputusan Menteri Lingkungan Hidup dan Kehutanan Republik Indonesia No. SK.7875/MENLHK-PHPL/KPHP/HPL.0/12/2020. 2020. Available online: https://geoportal.menlhk.go.id/webgis/index.php/en/map/printed-map (accessed on 20 March 2021).
  50. Billinton, R.; Allan, R.N. Reliability Evaluation of Power Systems, 2nd ed.; Plenum Press: New York, NY, USA, 1996. [Google Scholar]
  51. Phoon, H.Y. Generation System Reliability Evaluations with Intermittent Renewables. University of Strathclyde. 2006. Available online: https://www.esru.strath.ac.uk/Documents/MSc_2006/phoon.pdf (accessed on 1 December 2021).
Figure 1. Condition of the existing Ambon–Seram system [46].
Sustainability 14 03032 g001
Figure 2. Peak load of the Ambon–Seram system [46,47,48].
Sustainability 14 03032 g002
Figure 3. Energy consumption of the Ambon–Seram system [46,47,48].
Sustainability 14 03032 g003
Figure 4. Forest area map of Ambon–Seram [49].
Sustainability 14 03032 g004
Figure 5. Average monthly wind profile [47,48].
Sustainability 14 03032 g005
Figure 6. Average monthly solar profile [47,48].
Sustainability 14 03032 g006
Figure 7. Profile of the months with the highest and lowest of average wind speed [47,48].
Sustainability 14 03032 g007
Figure 8. Profile of the months with the highest and lowest average solar output [47,48].
Sustainability 14 03032 g008
Figure 9. Plan for the Ambon–Seram interconnection system [46].
Sustainability 14 03032 g009
Figure 10. GEP optimization flowchart.
Sustainability 14 03032 g010
Figure 11. Installed capacity of the isolated Ambon–Seram system.
Sustainability 14 03032 g011
Figure 12. Energy mixed of the isolated Ambon–Seram system in 2025 and 2050.
Sustainability 14 03032 g012
Figure 13. Installed capacity of the interconnected Ambon–Seram system.
Sustainability 14 03032 g013
Figure 14. Energy mix of the interconnected Ambon–Seram system in 2025 and 2050.
Sustainability 14 03032 g014
Figure 15. Land use area of production forests for biomass under the isolated system scenario.
Sustainability 14 03032 g015
Figure 16. Land use area of production forests for biomass under the interconnected system scenario.
Sustainability 14 03032 g016
Figure 17. Comparison of the reserve margins.
Sustainability 14 03032 g017
Table 1. Existing generation units in the Ambon–Seram system [46,47,48].
NoNameSystemCapacity (MW)
1Diesel Hative KecilAmbon2.5
2Diesel Poka8.9
3Gas Machine LMVPP54
4Gas Machine Ambon Peaker30
5Diesel MasohiSeram0.49
6Diesel Kairatu1.51
7Diesel Piru0.8
8Diesel Sewa Kairatu3
9Diesel Sewa Piru3
10Gas Machine Seram20
11Diesel Taniwel2.8
12Diesel SaparuaSaparua2.6
13Diesel HarukuHaruku4.9
Table 2. Land use in Ambon–Seram [49].
Land UseLand Area (ha)Percentage of Land (%)
Protected and conservation forests5,740,106.3530
Production forests9,619,213.9551
Nonforest area3,666,141.9619
Total19,025,462.26100
Table 3. Biomass plant crop types and land requirements.
Biomass Crop TypesCycle (Year)Biomass Land Requirements for a Biomass Power Plant (ha)
3 MW6 MW10 MW
Acacia auriculiformis5157038825232
Acacia mangium5168233645606
Caliandra calothirsus5201840366727
Gliricidia sepium3163832765460
Eucalyptus pellita4174464695813
Table 4. Primary energy prices and heat content assumptions.
Fuel TypePriceHeat Content
ValueUnitValueUnitValueUnit
Coal65$/Ton3.303$/GJ4700kcal/kg
LNG15$/MMBTU9.478$/GJ252,000kcal/Mscf
HSD0.5$/litre13.123$/GJ9100kcal/litre
MFO0.4$/litre9.849$/GJ9700kcal/litre
Geothermal1141.89IDR/kWh22.657$/GJ2.76MJ/kg
Biomass500IDR/kWh2.5$/GJ3400kcal/kg
Table 5. Generation unit candidates for the Ambon–Seram system.
SystemGenerating UnitUnit SizeCapacity FactorHeat RateMaintenance RateFORTechnical LifetimeBuild CostFOMVOM
MW%GJ/MWh%%years$/kWe$/kWe/y$/MWh
Ambon and
Seram
Coal PP2570–90911.51730140031.32
Gas machine1030–508.372.88325800181
Geothermal560–804.327.6710304000301
Hydro1030–56-11.5145020006.61
Mini hydro165–75-11.5143524006.61
Biomass0.570–90911.51725170047.63
Wind0.5--0.31327220039.550.8
Solar1--5525250024.70.4
Haruku and
Saparua
Gas machine0.530–508.372.88325800181
Biomass0.2570–90911.51725170047.63
Wind0.1--0.31327220039.550.8
Solar0.1--5525250024,70.4
Table 6. Transmission line types and price assumptions.
Line TypeConductor TypeInvestment Cost (USD/kms)
Submarine Cable 150 kVXLPE-CU3 × 300 mm23,660,000
Overhead Line 150 kVACSR 1 × 240 mm2160,000
Overhead Line 70 kVACSR 1 × 240 mm270,000
Table 7. Transmission lines options.
No.LineOnshore
Circuit (km)
Offshore
Circuit (km)
Circuit (km)Total
Circuit
Investment (Million USD)
1Ambon–Haruku11.5819.52 17.98
2Haruku–Saparua18.51.519.52 5.08
3Saparua–Seram297362 16.52
Table 8. The volume of fuel for coal, LNG, and biomass in the isolated system scenario.
YearCoalLNGBiomass
Capacity (MW)Energy (GWh)Volume (Ton)Capacity (MW)Energy (GWh)Volume (MMBTU)Capacity (MW)Energy (GWh)Volume (Ton)
2020000.0129440.953,510,684.9000
202550319.83146,279.3125212.351,690,664.4620.3414,574.4
203080495.02226,405.6125184.851,471,672.8919.1813,742.1
204080507.77232,236.5145318.792,643,384.817106.5276,341.3
205080501.36229,303.2145367.623,092,886.951314.64225,489.0
Table 9. The volume of fuel for coal, LNG, and biomass in the interconnected system scenario.
YearCoalLNGBiomass
Capacity (MW)Energy (GWh)Volume (Ton)Capacity (MW)Energy (GWh)Volume (MMBTU)Capacity (MW)Energy (GWh)Volume (Ton)
2020000.0129439.923,502,494.1000
202550306.60140,228.0125240.971,918,537.5636.7926,367.6
203080490.48224,329.7125117.31933,959.2636.7926,367.6
204080515.70235,863.3125338.982,698,863.8639.1728,074.6
205080496.45227,059.8125331.852,642,032.190565.96405,604.3
Table 10. Comparison of total costs.
Total Component Cost
(Million USD)
Without the
Interconnection Option
With the
Interconnection
Option
Without the Interconnection
Option (LOLP Constrained)
Power Plant Investment Cost326.32278.86424.66
Line Investment Cost-39.59-
FOM Cost50.2944.0563.17
VOM Cost11.3511.5211.15
Fuel Cost421.51399.68448.05
Sub-Total (No Line)809.46734.11947.03
Total809.46773.70947.03
Publisher’s Note: MDPI stays neutral with regard to jurisdictional claims in published maps and institutional affiliations.

