1. Introduction
This paper aims at addressing a sustainable mobility-on-demand problem for enabling fair access to employment, social life, markets, and services to people. It is in line with the 11th Sustainable Development Goal (SDG) of the United Nations for “Making Cities and Human Settlements Inclusive, Safe, Resilient and Sustainable”. The sustainable transport agenda for 2030 aims at enhancing mobility, including urban mobility ensuring access to safe, accessible, and sustainable transportation systems for all at an affordable cost. Therefore, on-demand mobility services should be designed as sustainable transport options for enhancing accessibility to transport, meeting various needs of people in their personal and economic lives. Such systems are part of a growing sector named Mobility as a Service (MaaS) which advocates accessibility to means of transport and personalization of services.
In this study, we focus on a Dial-A-Ride Problem (DARP) which was originally proposed by the authors of [
1]. The DARP is also known as an on-demand transportation problem in the work of [
2], where a transportation demand is a request made by a customer who wants to be transported from an origin to a destination site. A DARP is characterized by the quality of service offered to the customers. The most common features which reflect this service level are both the time windows imposed at different locations and the maximum riding time which is the time needed to fulfil a request of transport. However, new advances are required to deal with other citizens’ needs which are more expressed and varied according to the authors of [
3]. A better customized and effective design of the service quality is highlighted as beneficial for both the service provider and the customer, see the work of [
4].
In this work, our contribution is twofold. On the one hand, we propose a new problem providing more effective on-demand transport plans. In this model, the customers’ requirements are expressed and used to fulfil the expected demand and improve the service quality. More precisely, a customer-oriented design of the time windows is proposed for minimizing passengers’ waiting times. Then, the resulting mixed-integer linear programming (MILP) model is implemented using the CPLEX optimizer tool which uses the branch and bound (B&B) exact method. The experimentation is performed on real-life benchmark data.
On the other hand, as computation times required by CPLEX are too long when solving complex and real-life problems (exponential with regards to the heuristic approaches), a new evolutionary-based approach called the Evolutionary Descent Algorithm (EDA) is developed. With the use of this new EDA, near-optimal solutions are obtained for real-life on-demand transport problems. Two types of experiments are set. In the first part, the lower bounds of the solution space for the studied problem are compared against near-optimal solutions produced by our EDA. Then, a deeper comparison of the EDA algorithm with other existing metaheuristic-based approaches from the literature is achieved.
The paper is organized as follows.
Section 2 presents the relevant literature linked with the studied problem.
Section 3 defines a mathematical formulation of the problem.
Section 4 describes the EDA for the resolution of the problem.
Section 5 reports numerical results obtained by the EDA on real-life instances with a comparative study with existing methods of the literature. Finally, a discussion on the results of the proposed methodology is undertaken in
Section 6, followed by a conclusion.
2. Relevant Literature on Dial-A-Ride Problems
2.1. The Classical Dial-A-Ride Problem
The DARP is a mobility-on-demand problem marked by the quality of service offered to the customers. This problem was initially dedicated to the elderly or those with reduced mobility (e.g., [
5,
6]). Nowadays, this problem is evolving to be applied in new fields like integrated transport in [
7,
8], the healthcare domain in [
9,
10], and ride-sharing transport in [
11]. Many variants are provided in the work of [
2] including two routing transportation issues involving static or dynamic frameworks with single or multiple vehicles. The quality of service is defined in [
3] through several terms which are related to customer perceptions and technical approaches. From the customer perception viewpoint, the quality of service is linked to safety, comfort, reliability, and vehicle access. From the technical perspective, the quality of service is defined with operational terms such as maximum ride time, total travel time, user riding time, and waiting time. These terms are expressed in the form of constraints as in the works of [
12,
13,
14] or directly in the objective function as in the works of [
15,
16]. The different expressions of quality of service come from the variety of models which try to find a balance between the travel costs and the quality of service for the customer.
2.2. The Dial-A-Ride Problem with a Customized Design of the Service Quality
Customers’ access to mobility has evolved rapidly due to technological advancements and changing customer preferences. Several factors such as the price, waiting time, travel time, convenience, and traveller experience are included when selecting the appropriate mode of transport by the mobility service consumers as in [
17]. These factors should be well addressed to ensure the improvement of the quality of service. This quality provided in [
18] is measured through waiting time metrics and riding time according to customers’ preferences for improving both the service quality and the distances travelled by the vehicles. As highlighted by the authors of [
19], the transportation of customers should be improved through the use of new information and communication technologies. Their expectation was to draw new public transport services to customers.
Thus, one way to address the new demands of transport nowadays is to be able to align with the diversified needs of the customers for transport. This is what is highlighted in [
4], fostering the modelling of mobility-on-demand problems according to a customer-oriented design. This issue is thoroughly studied in the survey of [
20] which gathers two main fields of research related to the quality of service levels in DARPs. In the first group of works, the DARP is qualified as classical when it aims at minimizing the travel costs ensuring a common design of the service quality for all the users, (e.g., [
5,
21,
22,
23,
24]). In the second trend of works, the quality of service is studied from a customer-oriented point of view. In this second group of researches, the authors of [
25] assessed the variation of different features related to the quality of service on operational costs. The authors of [
26] proposed time windows, and a maximum riding time for each user. A maximum ride time is specified for each customer and investigated for designing time windows in other works of [
13,
27]. A recent example of another customer-oriented computation of the time windows is made using the maximum riding time and the beginning of service in the work of [
14]. In the problem of [
28], a request is split into a set of groups of persons and has a revenue. Time windows are redefined for only the delivery location using a service time, a transit time and a maximum ride time. Based on multi-criteria models, the authors of [
29] stressed that expanding the size of the time window for a transport service is beneficial for the system provider but not for the customers, which is also emphasized by the authors of [
30].
In this paper, we consider a customer-oriented service quality in which each customer specifies his/her own riding time. In this model, the time windows are designed to minimize the waiting time of the users.
2.3. Resolution Methods for the Dial-A-Ride Problem
The most successful method for solving a wide range of Dial-Ride Problems is the Tabu Search in [
31]. This local-based method is extensively applied for artificial cases of DARP (e.g., [
22,
32,
33]). However, this method needs to be adapted to deal with real-life applications and customized designs of DARPs. Some works (e.g., [
10,
34]) in the literature address the quality of service in DARPs from a customer point of view. The authors in [
34] proposed a Tabu Search based on a neighbourhood strategy that operates a tactical move operation. The latter consists in altering the requests schedule by allocating a random request to its nearest predecessor in another route. An insertion heuristic relies on iterative checks of the constraints. In order to diversify the search, the Tabu list is emptied after a selected number of TS iterations. Real-life cases of on-demand transport are tackled and the results for small instances are promising.
In the field of population-based approaches, few evolutionary algorithms are found in the literature for solving mobility-on-demand problems (e.g., [
35,
36,
37]). Several operators, namely the mutation and the crossover ones, are proposed. In [
35], the crossover consists in randomly incorporating a customer in the current solution. A cluster mutation and a route mutation are used. The artificial instances in [
38] were used for the experimentation. As it was stated by the authors of [
37], a crossover aimed at generating a non-legal solution by randomly selecting a cluster of nodes from two different parents. Then the mutation operation consisted of a local modification in the clusters of nodes. Experiments were performed and compared to instances in [
1].
To the best of our knowledge, the only evolutionary approach devoted to solving DARPs including the customer viewpoint is the Evolutionary Local Search (ELS) of [
13]. The mutation consists in removing a transportation request from a trip to be inserted into another. Next, transportation requests are exchanged between two trips. This action is considered the crossover operator. The crossover is applied to locally alter a mutated solution. Each mutated solution is improved by a local search which is based on six neighbourhood structures. These structures are dynamically managed during the hybridized algorithm iterations. This management is provided by the mean of several probabilities. With this regard, a local search is altered through the evolutionary computations increasing the level of intensification of the search process.
New evolutionary algorithms should be applied on real-life cases of DARPs such as the 96 instances of [
39] considering customer expectations. For these problems, the ELS of [
13] performed well. This is on some of these instances that the new EDA algorithm proposed in this paper is tested (see
Section 5).
3. Problem Definition and Formulation
3.1. The Customer-Oriented DARP
The customer-oriented DARP is an on-demand transport problem. It consists of satisfying a set of prior known transportation requests using a set of homogeneous vehicles with a maximum capacity. A request corresponds to a limited number of people who require to be transported from one location to another. This number is the same on the pickup and the delivery sites. Thus, the set of requests corresponds to that of the pickup nodes. The depot is concerned by the departure and the arrival of all the vehicles and no demand is assigned to it. In addition, a maximum total duration is fixed to limit the total vehicle travel time. Each customer has a riding time which is the time interval from the time of his/her pickup to that of the delivery including waiting times which occurred during the vehicle route.
The customer-oriented DARP is different from classical DARPs in terms of the design of the service quality which is customer oriented. Firstly, a maximum riding time is specified for each customer considering the distance between the customer’s origin and that of the destination. Secondly, new customized bounds are produced for time windows at origin and destination sites separately. The redefinition of the new bounds is based on customers’ expectations including a lower riding time (time spent aboard the vehicle), service time (the time taken to load or discharge people from the vehicle), and a restricted maximum riding time. The major contribution of the customized design of time windows relies on reducing the customers’ waiting times.
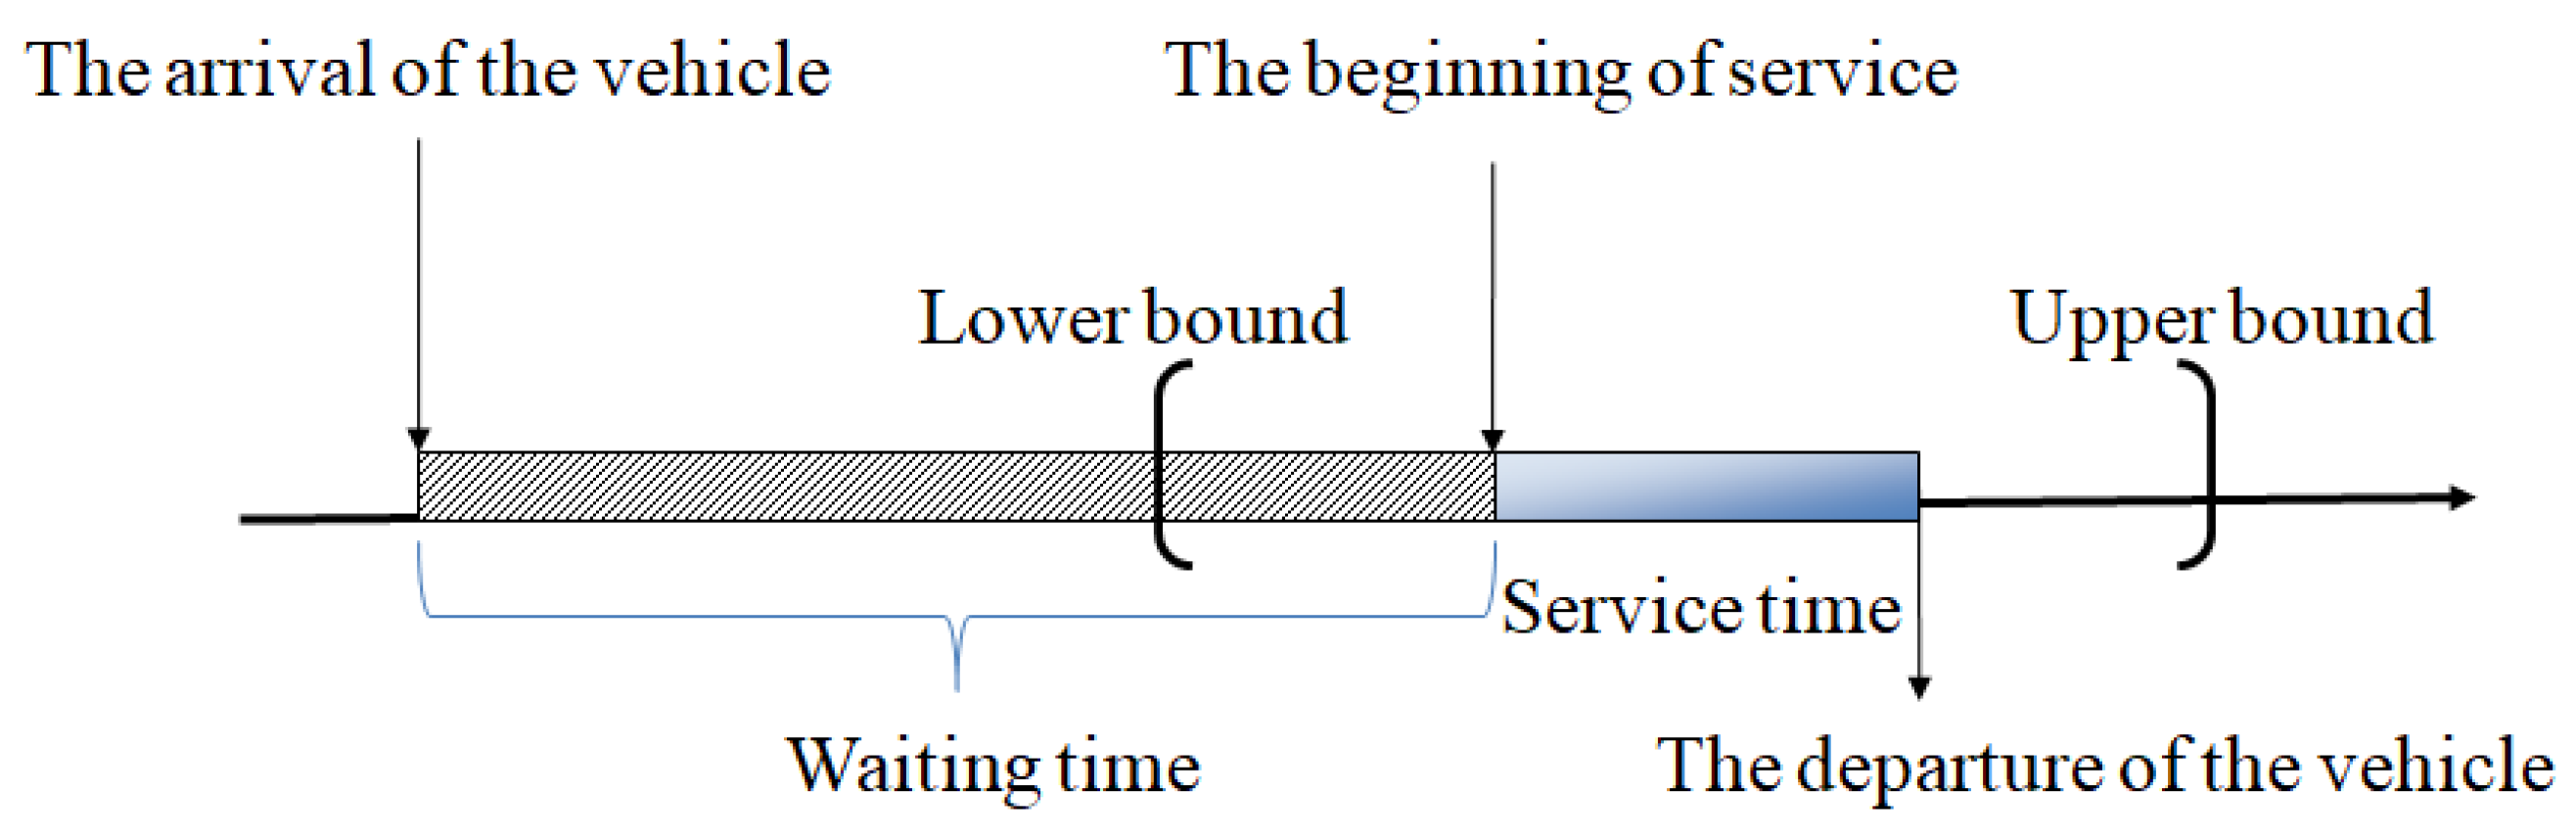
A potential waiting time at a node is illustrated by
Figure 1. In this figure, the time window is defined by its lower and upper bound.
Inside this time window, the beginning of the service is bounded. In addition, the arrival time and the departure time are defined at the node. Note that a beginning of service is always considered as the maximum value between the arrival time and the earliest service bound. The waiting time is the time between the vehicle’s arrival time and the beginning of service at a node. The vehicle’s departure time is the time that starts after the end of the service time for loading or delivering people.
In the studied problem, particular attention is given to the time windows for improving the waiting time as well as the total duration, see the example in
Figure 2.
3.2. Mathematical Formulation of the Customer-Oriented DARP
The customer-oriented DARP is defined on a complete directed graph , where N is the set of vertices and A is the set of arcs. The set of nodes i∈N is defined as which includes the depot in two copies () at the departure and () at the arrival, the set of pickup nodes , and the set of delivery nodes . The set of arcs is defined as with i, j∈N, and . We assume that a fleet of homogeneous vehicles is available at the depot to satisfy a given number of requests. A request is defined by an origin node and a destination one () .
3.2.1. Notations Used in the Formulation
The problem under consideration is NP-Hard, as it was proved by [
40]. It can be modelled as a mixed-integer linear program (MILP) using the following decisions variables: The first one is a routing variable whereas the others are scheduling variables.
is a binary variable equal to 1 if and only if the vehicle v goes from node i to node j, equal to 0 otherwise.
, , , and are real variables that indicate the starting time of service, the arrival time, the waiting time, and the riding time at node i if the latter is visited by a vehicle v.
The set of notations used in the problem formulation is in
Table 1.
The vehicle’s arrival time at node i is the time spent from its departure to this node. Note that this arrival is allowed before the beginning of service but not after. Therefore, only a positive value for the waiting time at node i is considered. It is equal to the time between the arrival time and the starting of the service ∈ where and are the earliest and the lasted service time respectively.
The departure time at node i is = + . In this problem the service time is equal to the passengers’ loading time. Given that no demand is assigned at the depot, the departure time at the depot is equal to the beginning of service; thus and . In addition, the arrival time at the depot is initialized as as well as . Last, we consider that the parameters , , and are the same at the origin and the destination sites of a request.
3.2.2. Mathematical Formulation of the Customer-Oriented DARP
The objective function which has to be minimized, see (
1), consists of the total travel costs generated by the visited arcs in the vehicle tours. A travel cost
on a visited arc (
) is the sum of the transit time
and the service time
at node
i. Besides, the total travel cost includes the total penalties on waiting times when visiting nodes. The value of
is chosen between 0.05 and 0.1 as it is used in [
41]. This variable increases in the event of a waiting time otherwise it decreases. The penalty growth is defined by (
=
∗ (1 +
)). Otherwise, the penalty term follows (
=
∖(1 +
)).
The first constraints of the problem are common with standard DARP constraints. Indeed, in equality (
2), we express that a request is allocated to exactly one vehicle. Besides, Equation (
3) makes sure that each vehicle that visits a node also leaves it. Equation (
4) expresses the balance between the pickups and the deliveries in a vehicle’s tour. Equations (
5) and (
6) assume the depot as the beginning and end of each tour. The constraints (
7) and (
8) ensure that the vehicle’s capacity is respected while charging and discharging persons at the pickup and delivery nodes. A positive load is supposed in the case of a pickup and the load is negative otherwise. The total travel duration is expressed by the set of constraints (
9). Let us note that the travel time of each vehicle starting from the depot and returning to it must respect this common bound.
Other constraints are defined for enhancing the quality of the service provided to the customers. The riding time expressed by (
11) is the time spent between the vehicle’s departure
at the origin and the beginning of service
at the destination. This riding time is limited by a customer-oriented maximum riding time
in (
10). The precedence constraint between the pickup and delivery stations is mentioned in (
13) and that between the nodes is defined in (
12). The arrival time
is computed by (
14).
The time windows are separately designed for the origin nodes and those of the destination. Equations (
15) and (
16) successively present the lower and upper bounds for the beginning of service at the origin sites. The time window at an origin is tightened by taking the minimum value between the initial earliest service time
supposed for a node of pickup, and the new derived one by (
). Consequently, the beginning of service is bounded by a new resulted earliest service time in (
15).
Equations (
17) and (
18) define the lower and upper bounds for the beginning of service at the destinations. The new bounds are the minimal values between the initial time windows
and
and those adjusted to customers’ specifications. These latter are the effective customer riding time
, the service time
, and the maximum ride time
which are used in this redefinition. With this time windows customization, a new beginning of service is calculated leading to a minimization of the waiting time expressed by (
19).
To achieve the linearization of the time window constraints, we use a large constant
M and a Boolean’s variable
. This constant is generally fixed as 1000, see the work of [
1,
42], which used this value successfully for the linearization of their problem constraints. Moreover, Equation (
20) ensures that the binary nature of the decision variables
is respected. Finally, inequality (
21) impose the positivity of the scheduling decision variables.
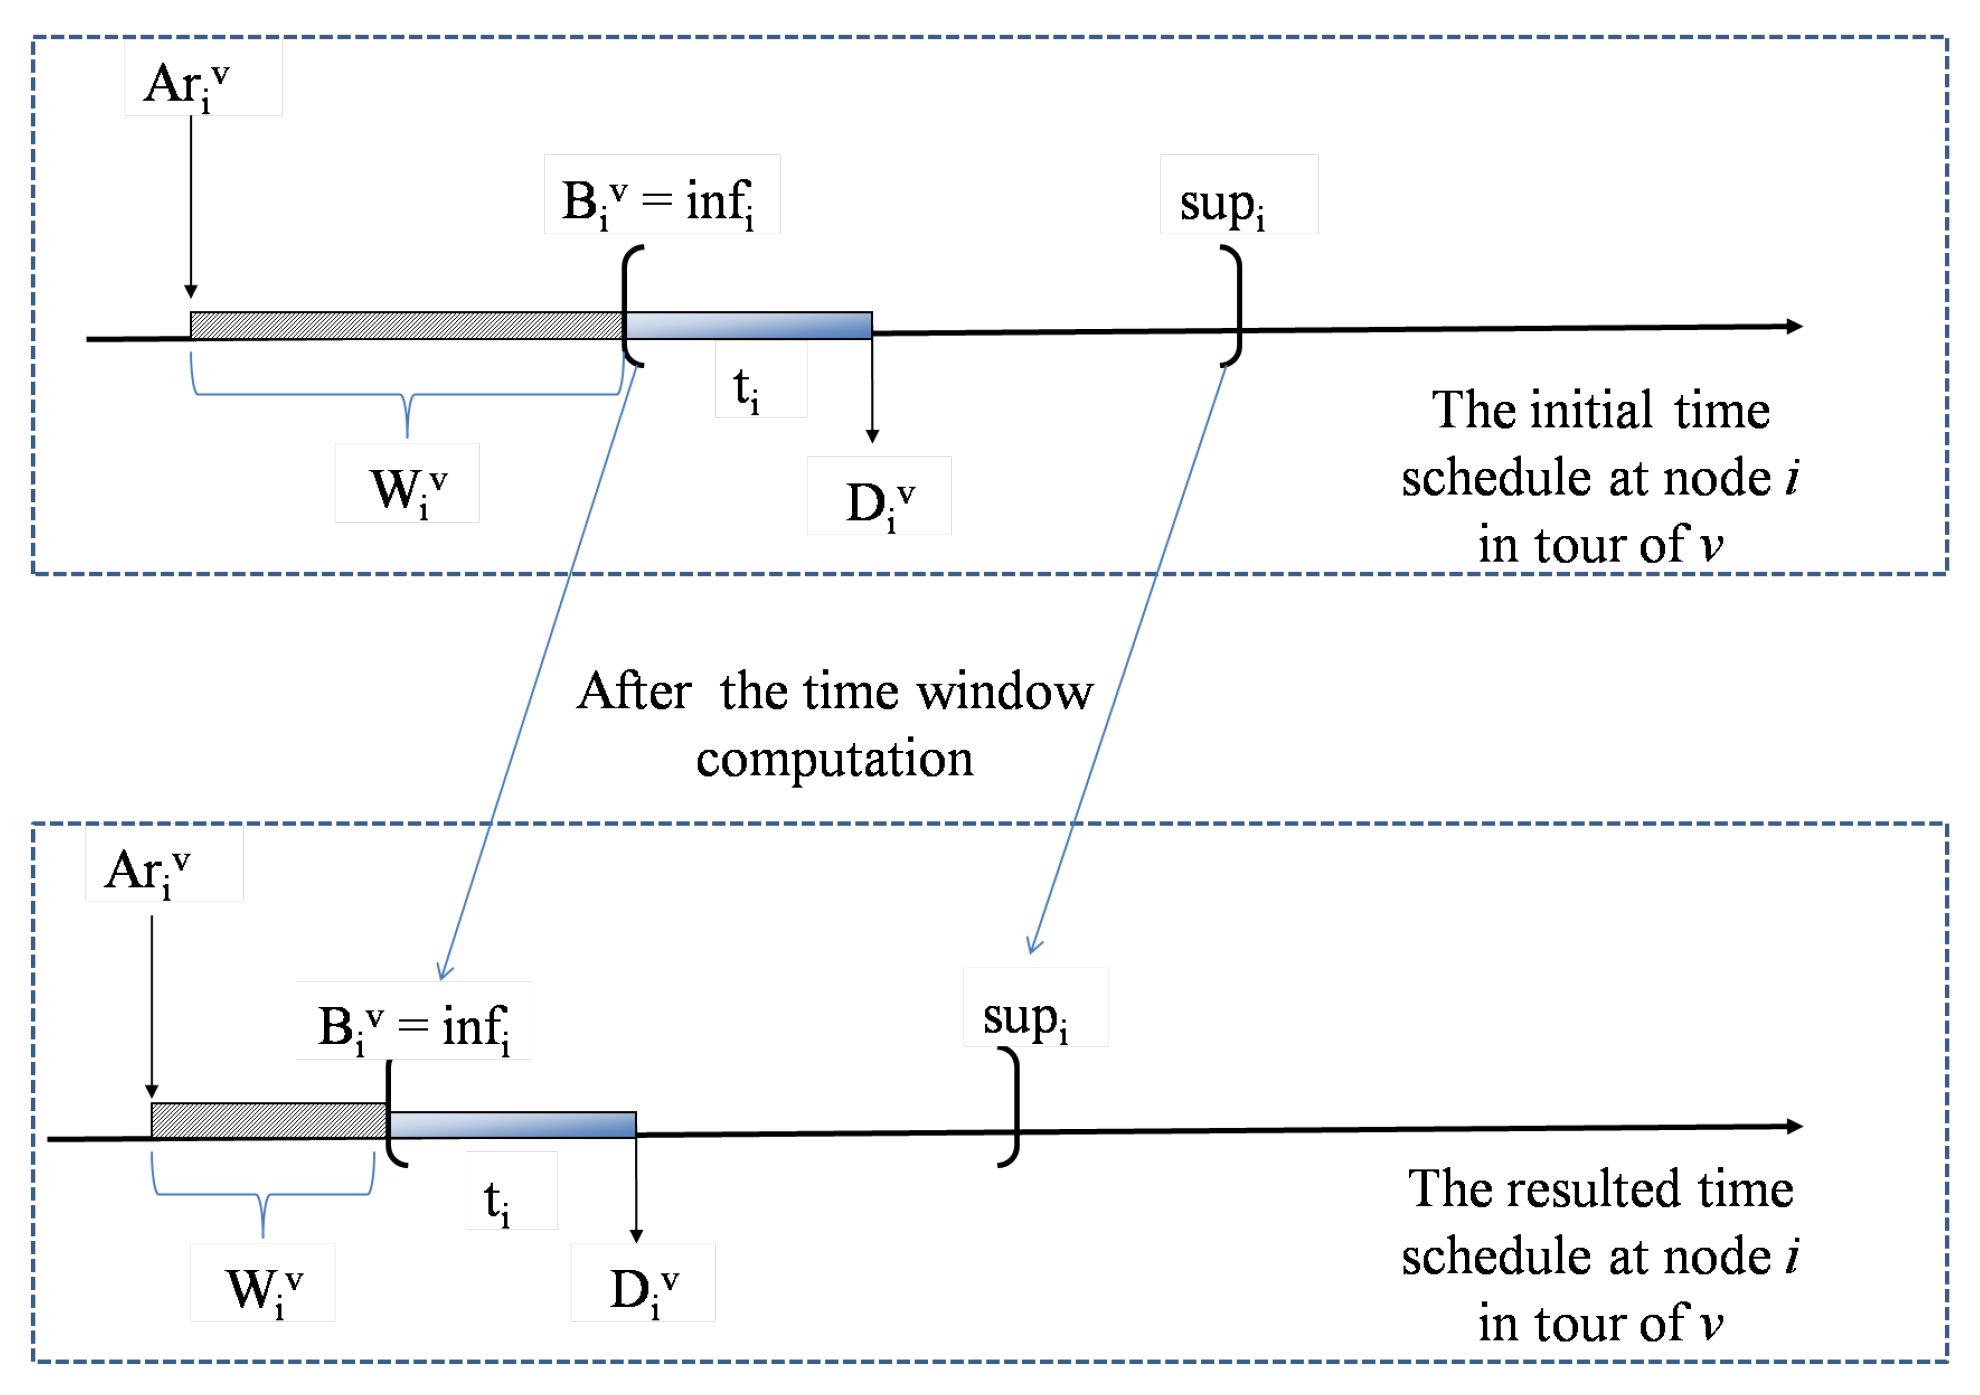
Figure 2 shows two cases of a time schedule at a node
i in a tour of
v: before and after the computation of the time window. In the second case, we illustrate an enhanced lower bound
and upper bound
at the node
i. Thus, for the same arrival time
computed by (
14), an enhanced value of
can be obtained by the time windows Equations (
15)–(
18). Note that we assumed having
at the node
i visited by the vehicle
v.
In addition, the new beginning of service impacts the departure time at node
i and the arrival time at the next visited node
j. Moreover, the total travel duration of the vehicle is also influenced as it is expressed by (
9). As a consequence, both the customer and the service provider may take benefit from the reduction of the waiting times as well as the unnecessary delays during a route.
The equations of the model are further implemented and tested on real instances in the experimental section. Indeed, although metaheuristics [
43,
44,
45,
46] and especially hybrid ones [
47,
48] are effective and fast for solving complex problems such as scheduling and transportation ones, we want here to have a comparative experimentation with an exact resolution [
49,
50] to find the optimal solution of each of the customer-oriented DARP instances foreseen. This exact resolution will be compared to the new evolutionary method which is proposed to solve the problem.
3.3. The Relevance of the Customized Time Windows on a Real-Life Case of On-Demand Transport
This section shows how tightened time windows improve the waiting times of the customers on a real-life example of on-demand transport. Therefore we use a problem instance of [
39]. In this example, we consider a single-vehicle tour that satisfies two requests, one of which generates a long waiting time. This vehicle has a maximum capacity of 8 passengers and a maximum total duration of 480. There are two persons who have to be transported from the origin location to the destination in the first request and four for the second request.
In order to illustrate the influence of the time windows, we present two successive cases with and without the consideration of the new constraints. Two figures are proposed indicating time windows and waiting times.
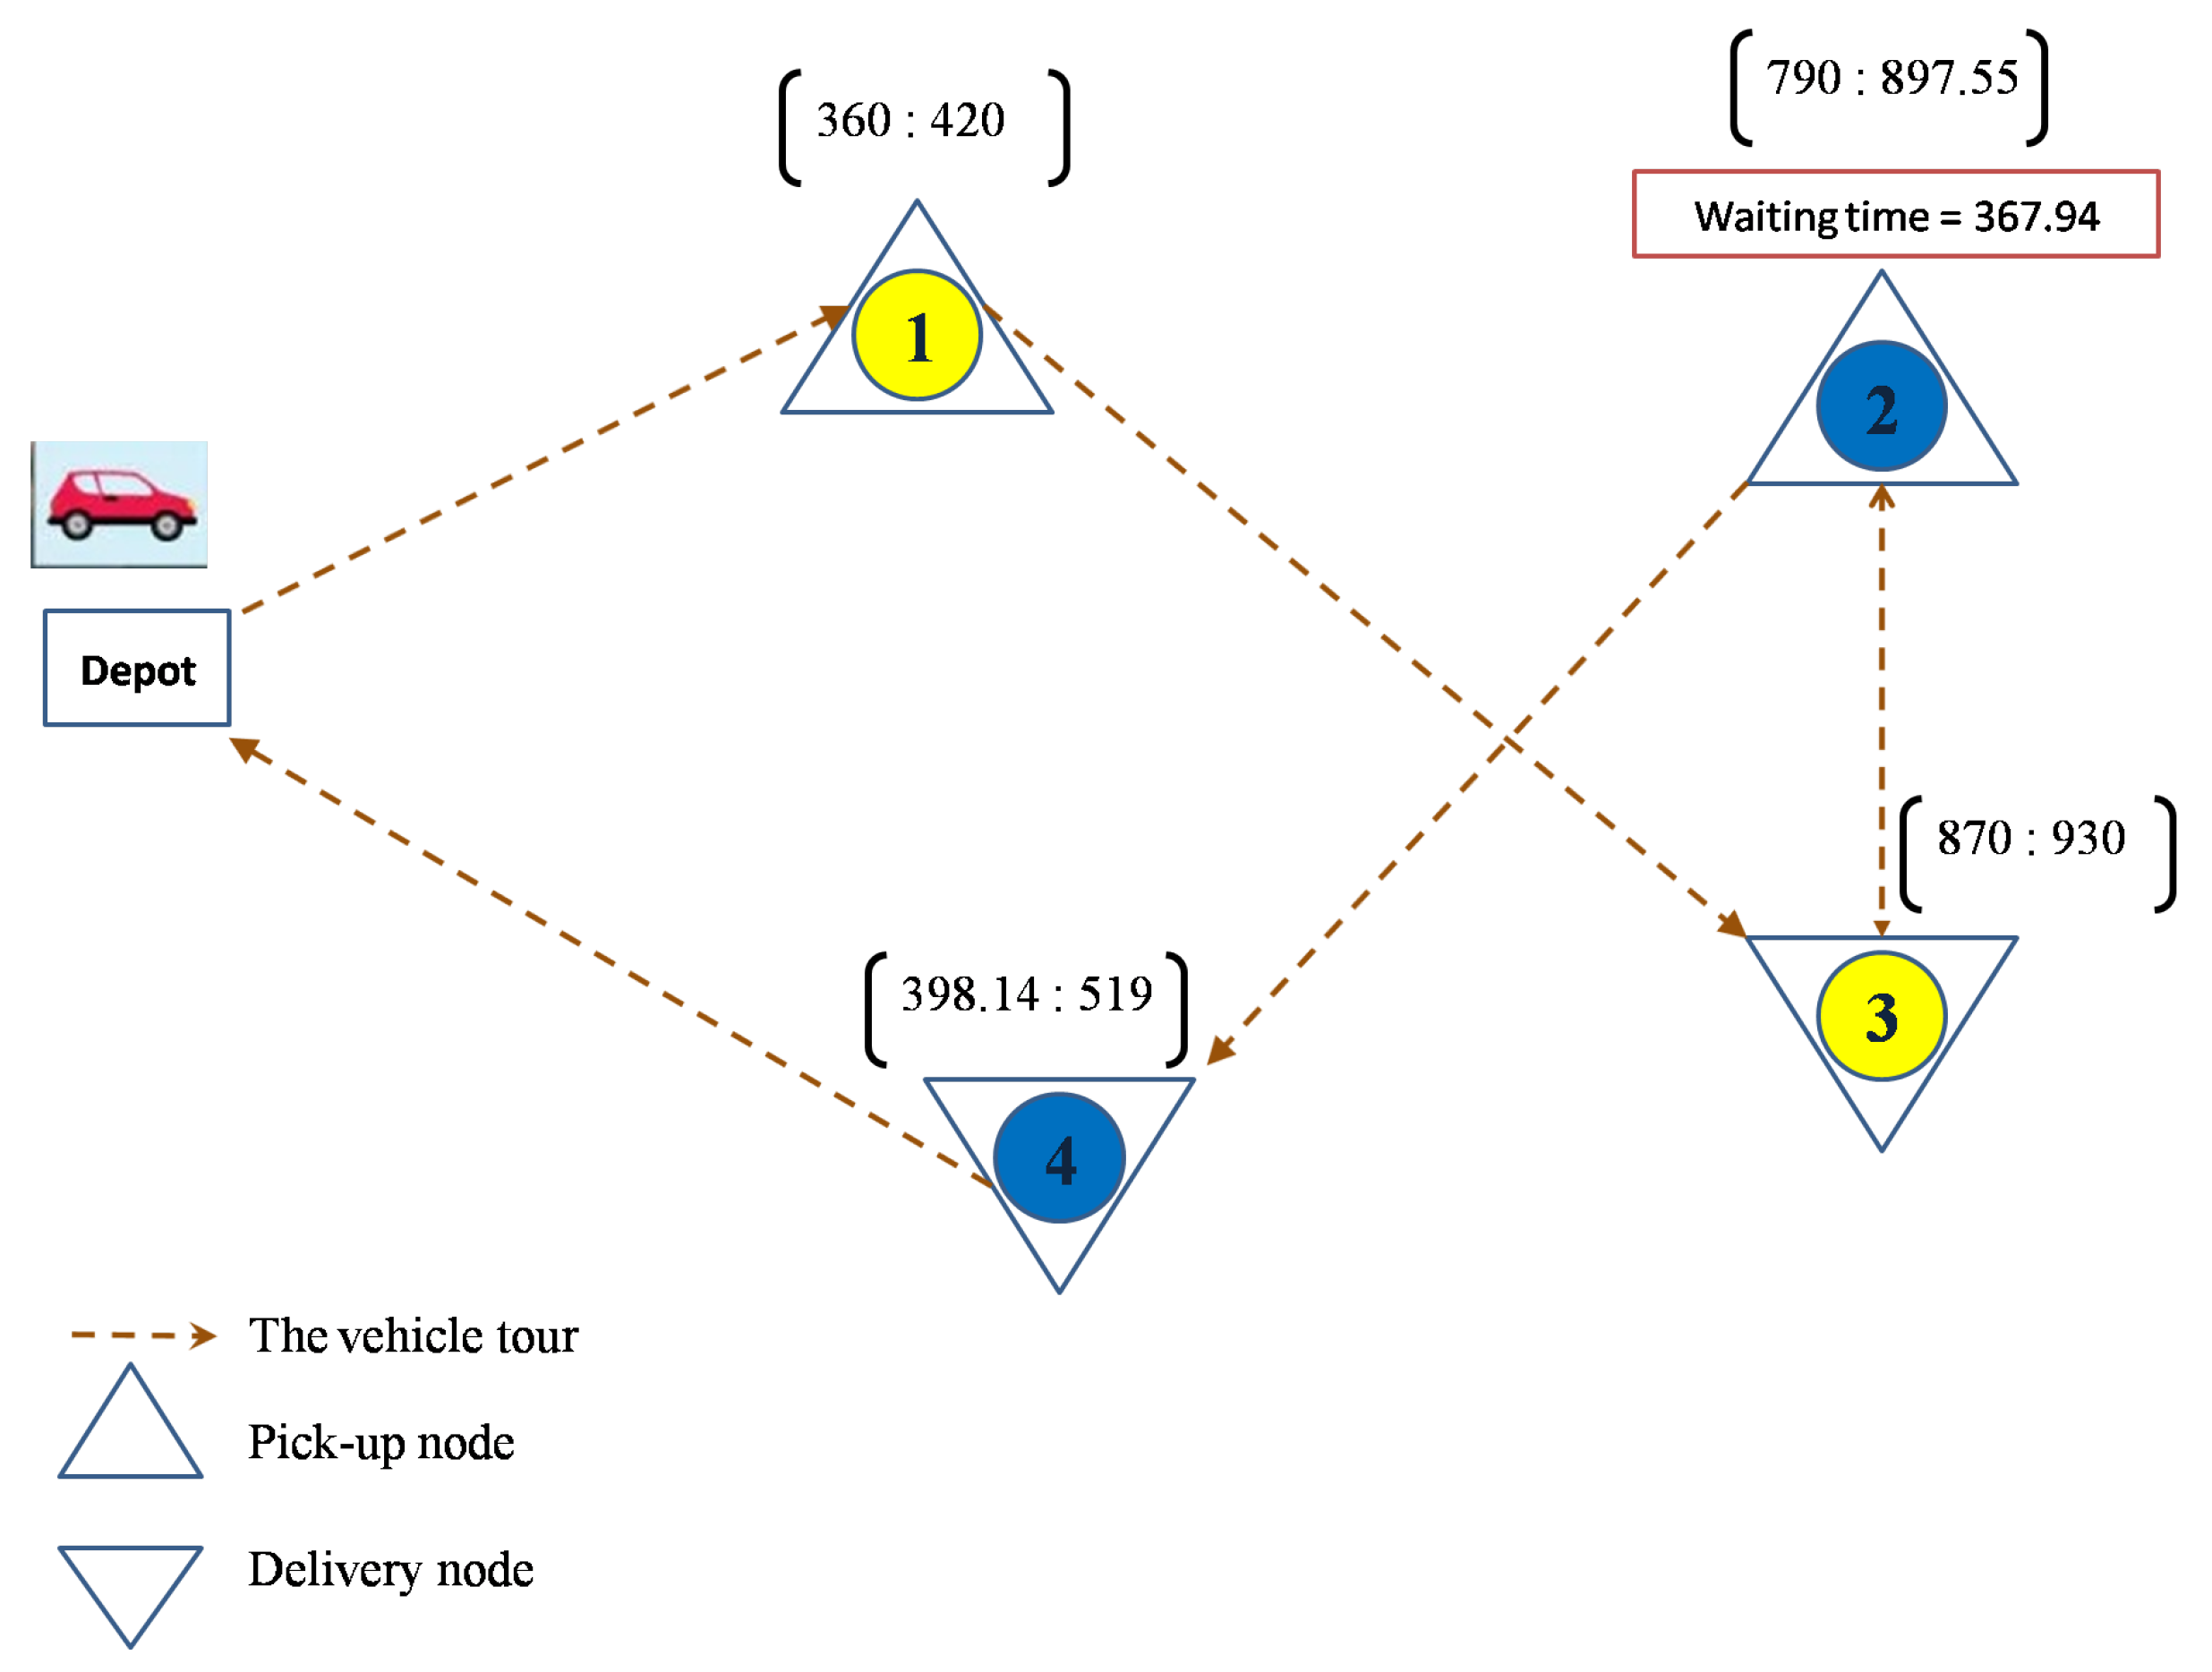
Figure 3 shows the case of a vehicle’s tour satisfying the two requests with the initial time windows proposed in the instance of [
39] and with a waiting time which occurs at node 2.
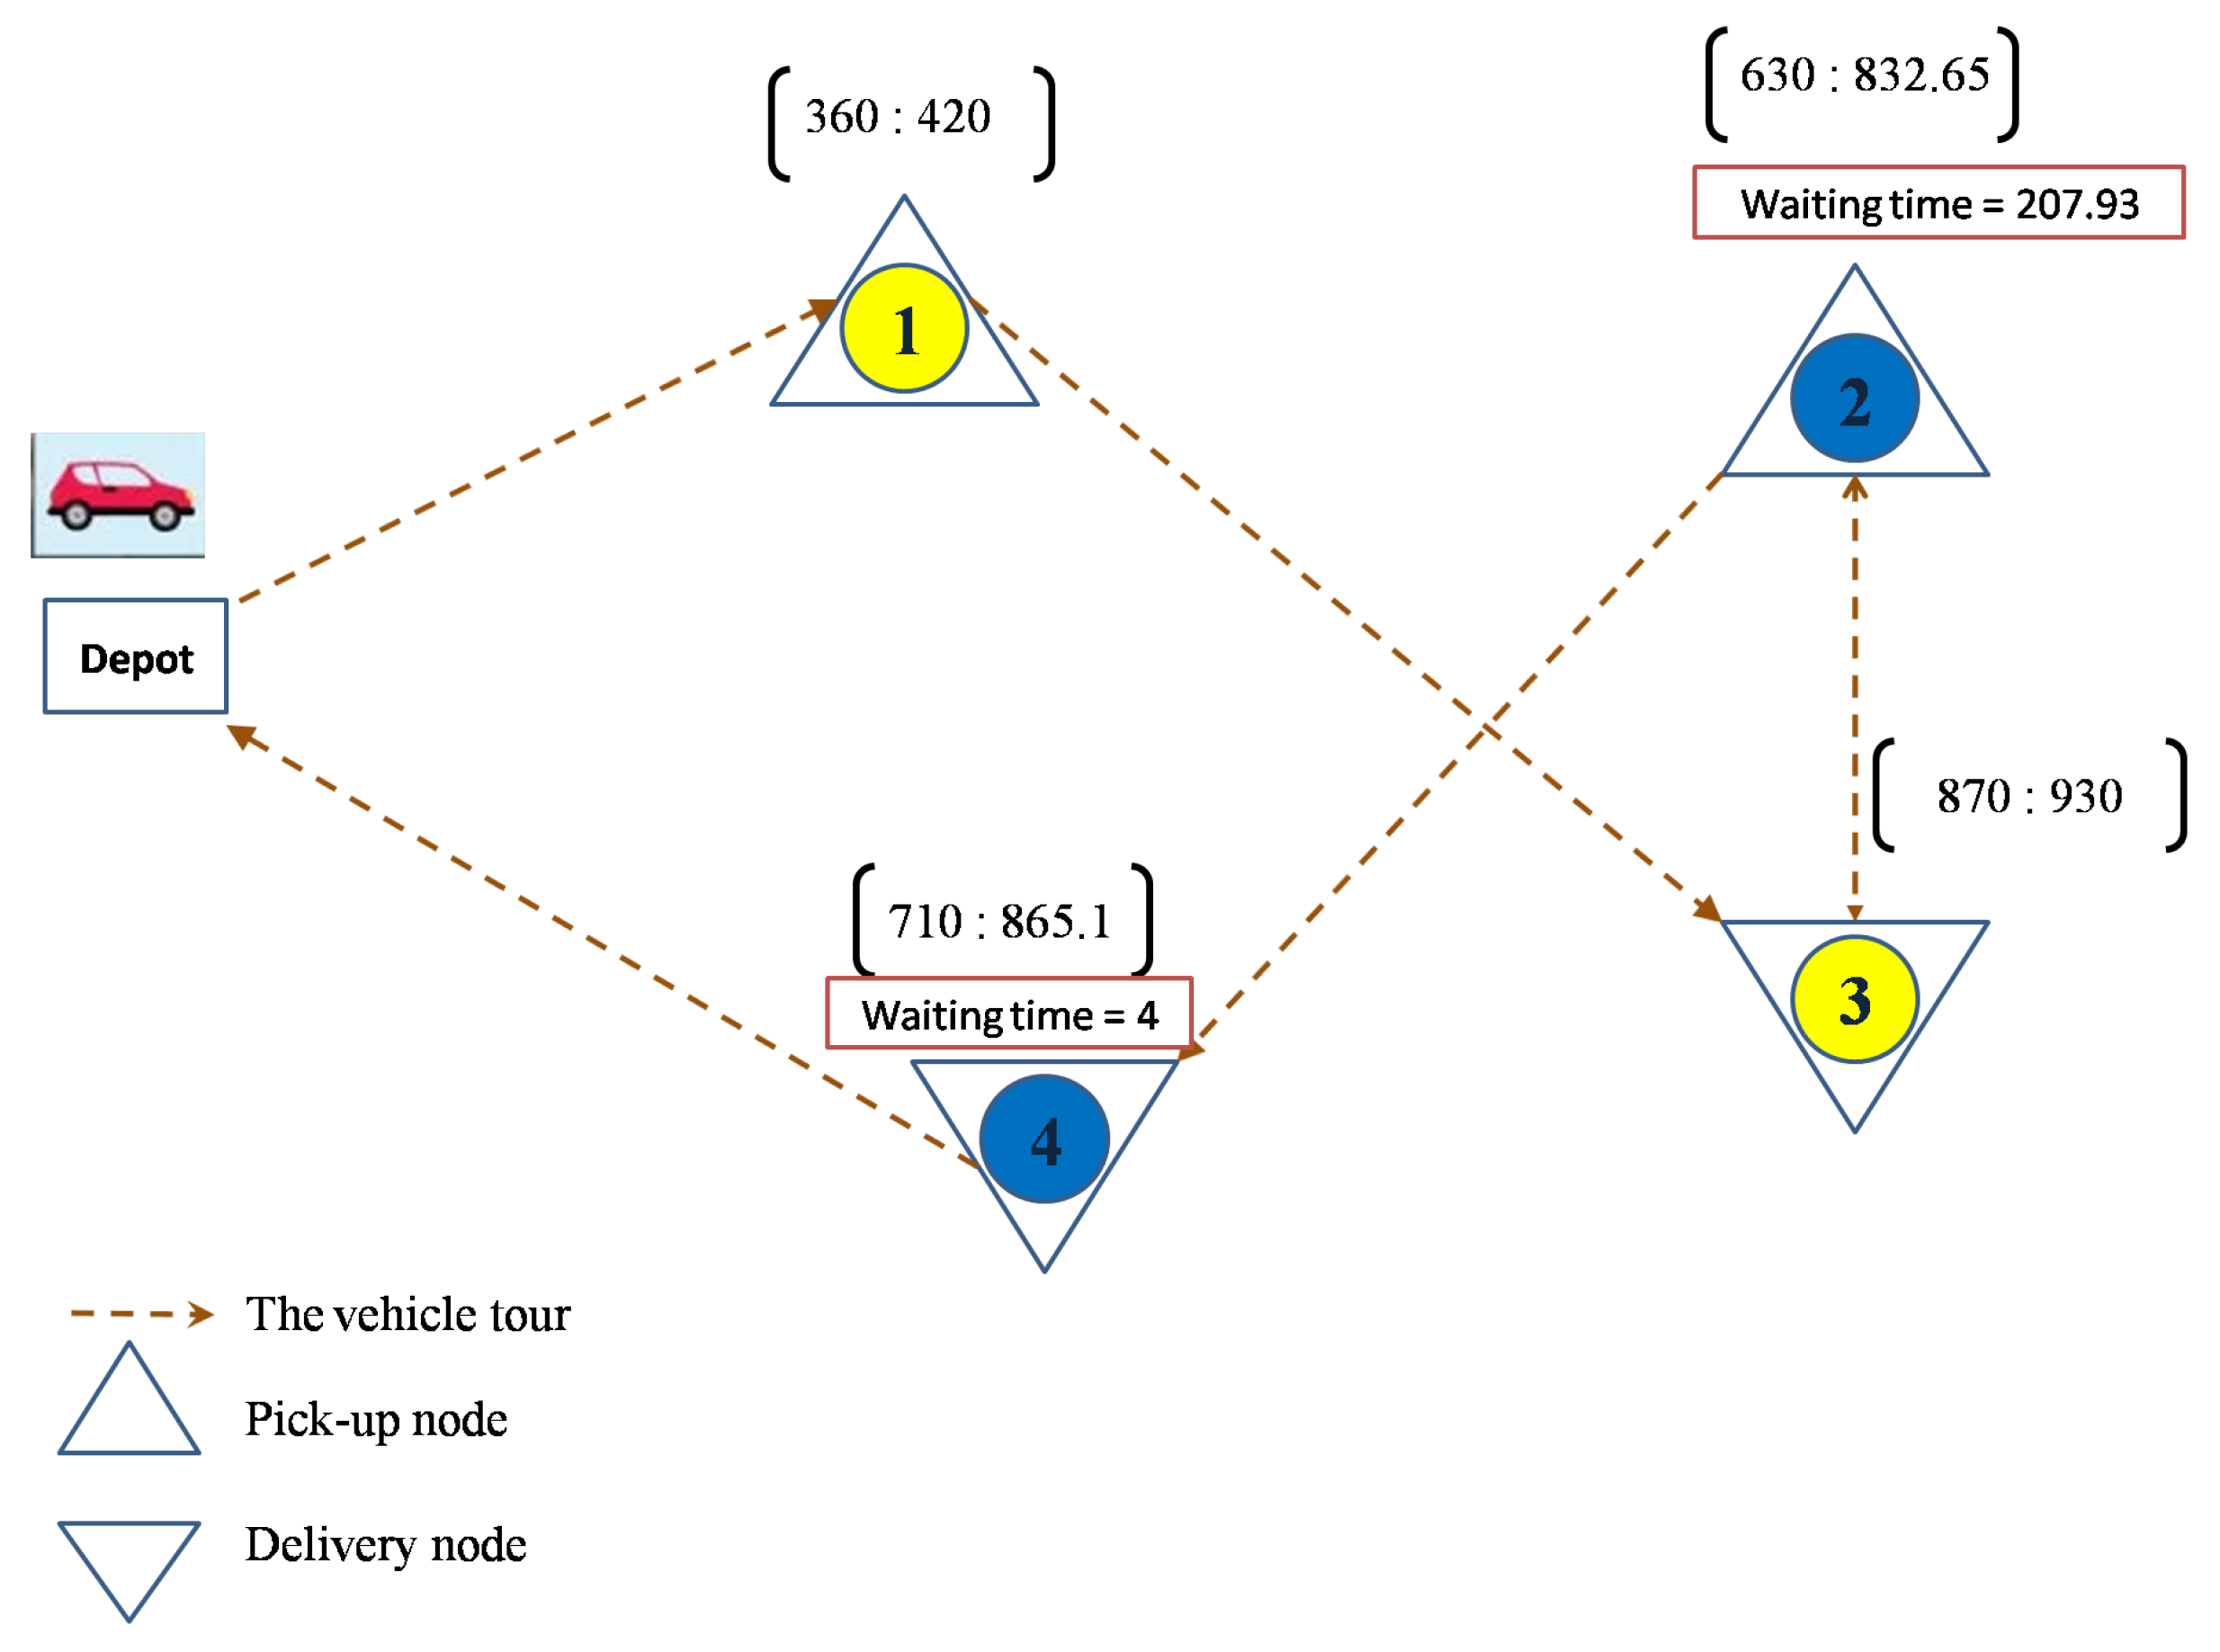
Figure 4 shows the case of the same tour but with the application of the time windows computed by the new Equations (
15)–(
18).
In
Table 2, we indicate the parameters related to the vehicle’s tour example of
Figure 3, especially those linking request 2 with origin node 2 and destination node 4. This request has a maximum riding time equal to 76.
The riding time of request 2 is equal to (). The only node which is concerned by a waiting time is node () where we have (). This waiting time delays the arrival time at the successive visited nodes and thus impacts the total vehicle’s tour duration equal to 470.15.
In order to reduce unnecessary waiting times, new time windows are computed using Equations (
15)–(
18). Given that the time windows are correlated, the bounds on the origin are based on those provided for the destination. Therefore, at node 4, we have
as the lower bound and
as the upper bound. Whereas for node 2,
is computed as the lower bound and
as the upper bound. The beginning of service
is then calculated using Equation (
11) based on the new earliest service time
. As a result,
.
Given Equation (1), the new waiting time
is reduced as (
). Consequently, the arrival time
is changed by (
), with
,
, and
. Then, we obtain (
) and a new lower waiting time at node 4 (
). Globally, with the time windows tightening, the total waiting time is less than the initial one
indicated in
Figure 3. Indeed, we obtain (
).
The vehicle tour after the new time windows calculation is illustrated in
Figure 4.
The minimization of unnecessary waiting times contributes to also minimizing the total duration since the new arrival times at nodes 2, 4, and 5 (the depot) are enhanced.
4. The Evolutionary Descent Algorithm for the Customer-Oriented DARP
To produce good solutions to the problem in shorter computational times, we propose an evolutionary descent approach (EDA). The main steps of the algorithm are as follows.
Step 1: Construct an initial solution of the EDA using the customized insertion heuristic, see
Section 4.2.
Step 2: At each iteration in the EDA, construct a population of individuals by perturbing the initial solution.
Step 3: For each individual in the population, apply the crossover (see
Section 4.3).
Step 4: Evaluate each solution in the population using the objective function (
1) of
Section 3.2 and save the best individual.
Step 5: If the fitness of the best individual is the best encountered one in the overall research, consider it as a new initial solution and save it as a temporary best solution in the search space.
Step 6: If the maximum number of iterations is not reached, then go to step 2; otherwise, go to step 7.
Step 7: Keep the final temporary best solution as the best one in the EDA.
To start the search in the EDA, an initial solution is constructed by the mean of a customized heuristic. Next, in order to create individuals composing the initial population, a simple perturbation procedure is applied to the initial solution. It consists of the prohibition of a random request to be assigned to a dispatched vehicle. This action allows the allocation of the request to other vehicles and permits to produce new feasible solutions in the population.
The population is then diversified by the use of the crossover (see
Section 4.3). The produced solutions are evaluated and the best one is selected for the next iteration in the EDA. The descent mechanism is iteratively repeated through the perturbation to generate the population, the crossover, and the selection. The algorithm is stopped when the number maximum of iterations is reached and the final solution is kept as the best.
4.1. Representation of a Solution
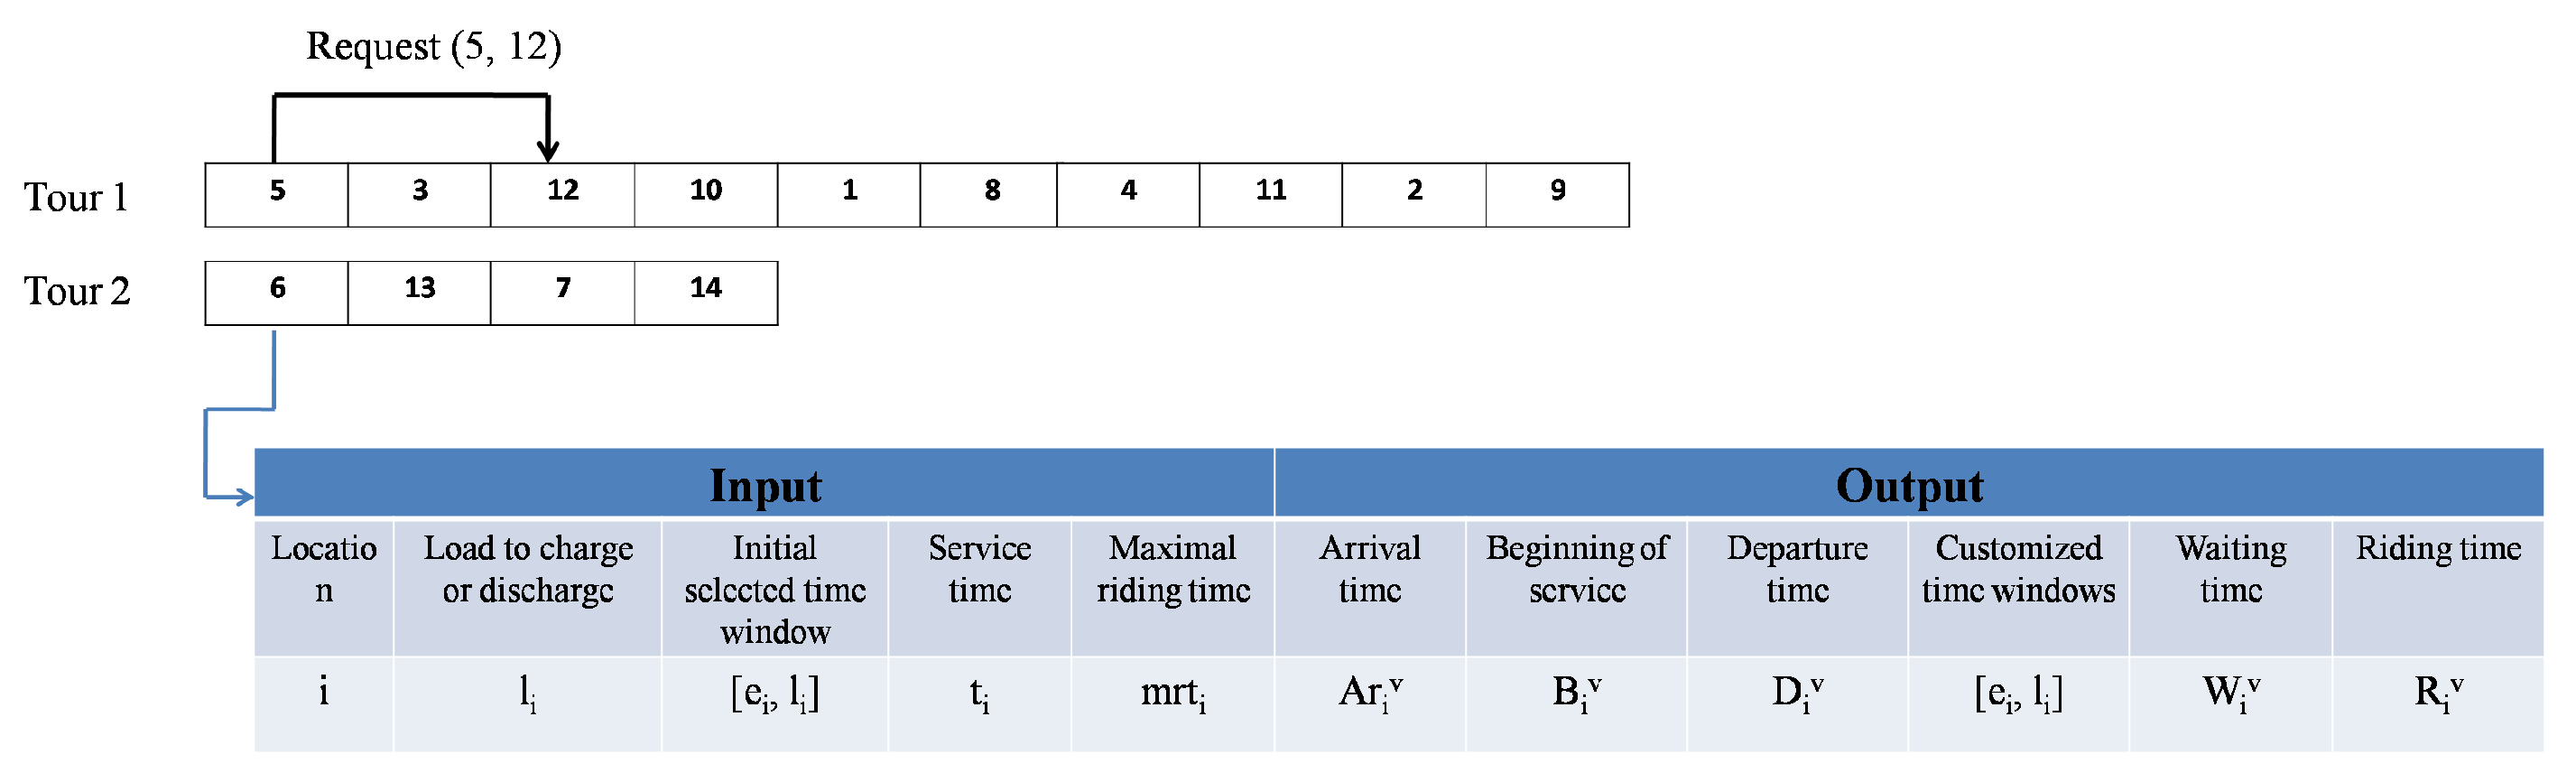
In order to represent a solution to the problem, we use an array of the allocation of the customers to a vehicle. Each vector represents a vehicle’s tour satisfying a set of requests. The number of tours is equal to the number of vehicles. The elements of a vector are a succession of visited nodes from the depot to it. The depot is not represented in
Figure 5, but it is considered in the implementation of the EDA. In this example, seven requests are served by two vehicles. Each satisfied request is represented by a pair of origin and destination nodes such as the pair (5, 12) for request 5 in tour 1.
A solution is said to be feasible if it results in the routes satisfying all the problem constraints. Thus, the output variables present the time schedule for each visited node in a tour as in
Figure 1. In what follows, we explain how these variables are calculated to produce an effective routing plan which considers the customized design of the time windows
4.2. The Customized Insertion Heuristic
The customized insertion heuristic builds a solution that satisfies all the requests using a set of vehicles. Its specific feature relies on the customized design of the transport schedule ensuring the enhancement of the quality of service. The steps of the customized insertion heuristic are as follows.
Step 1: Initially, each tour is empty and all the vehicles are available.
Step 2: Sort the list of non-allocated requests in the increasing order of the upper bound of their initial time window at the pickup nodes.
Step 3: Select a vehicle from the list of available ones, according to its capacity considering the load of the selected request i.
Step 4: Select a request from the ordered list of non-allocated requests.
Step 5: Before any new request’s insertion, check if there are some previous allocated requests in the tour, then execute some deliveries to ensure that the maximum riding time (
10) is respected, and go to step 7.
Step 6: Check the feasibility of the insertion of the request in the tour according to the current time schedule, the customized time window (
15) and (
16) of the request, and the total duration of the vehicle tour.
In the case of a feasible insertion, insert the pickup node of the request in a valid position in the tour.
Update the vehicle’s capacity and total tour duration, delete the request from the list of non-assigned requests and go to step 4.
When the vehicle capacity is completed, deliver some requests in the descending order of their maximum riding times and update the time schedule with new customized time windows (
17), (
18); go to step 7.
Go to Step 3 when the insertion is not feasible.
Step 7: Check the maximum duration of the vehicle tour and set the dispatched vehicle as non-available in the case of a potential violation of the constraint; go to step 3.
The insertion algorithm allocates iteratively customer requests while problem constraints are satisfied. Thus, given a set of requests, the algorithm looks for valid positions on each tour. When the insertion is not possible, the heuristic looks for another vehicle. In addition, the feasibility of the insertion is linked with the maximum total duration of the tour trip. If it is a valid insertion, all the vehicles, requests and schedule parameters are managed and updated. Moreover, to enhance the quality of the routing plan, the time windows are customized. With this regard, new time windows are computed by reducing unnecessary delays. Hence, the customized time windows are computed using Equations (
15)–(
18), see
Section 3.2. Consequently, additional requests can be accepted for insertion into a vehicle’s tour.
4.3. The Crossover Operator for the Customer-Oriented DARP
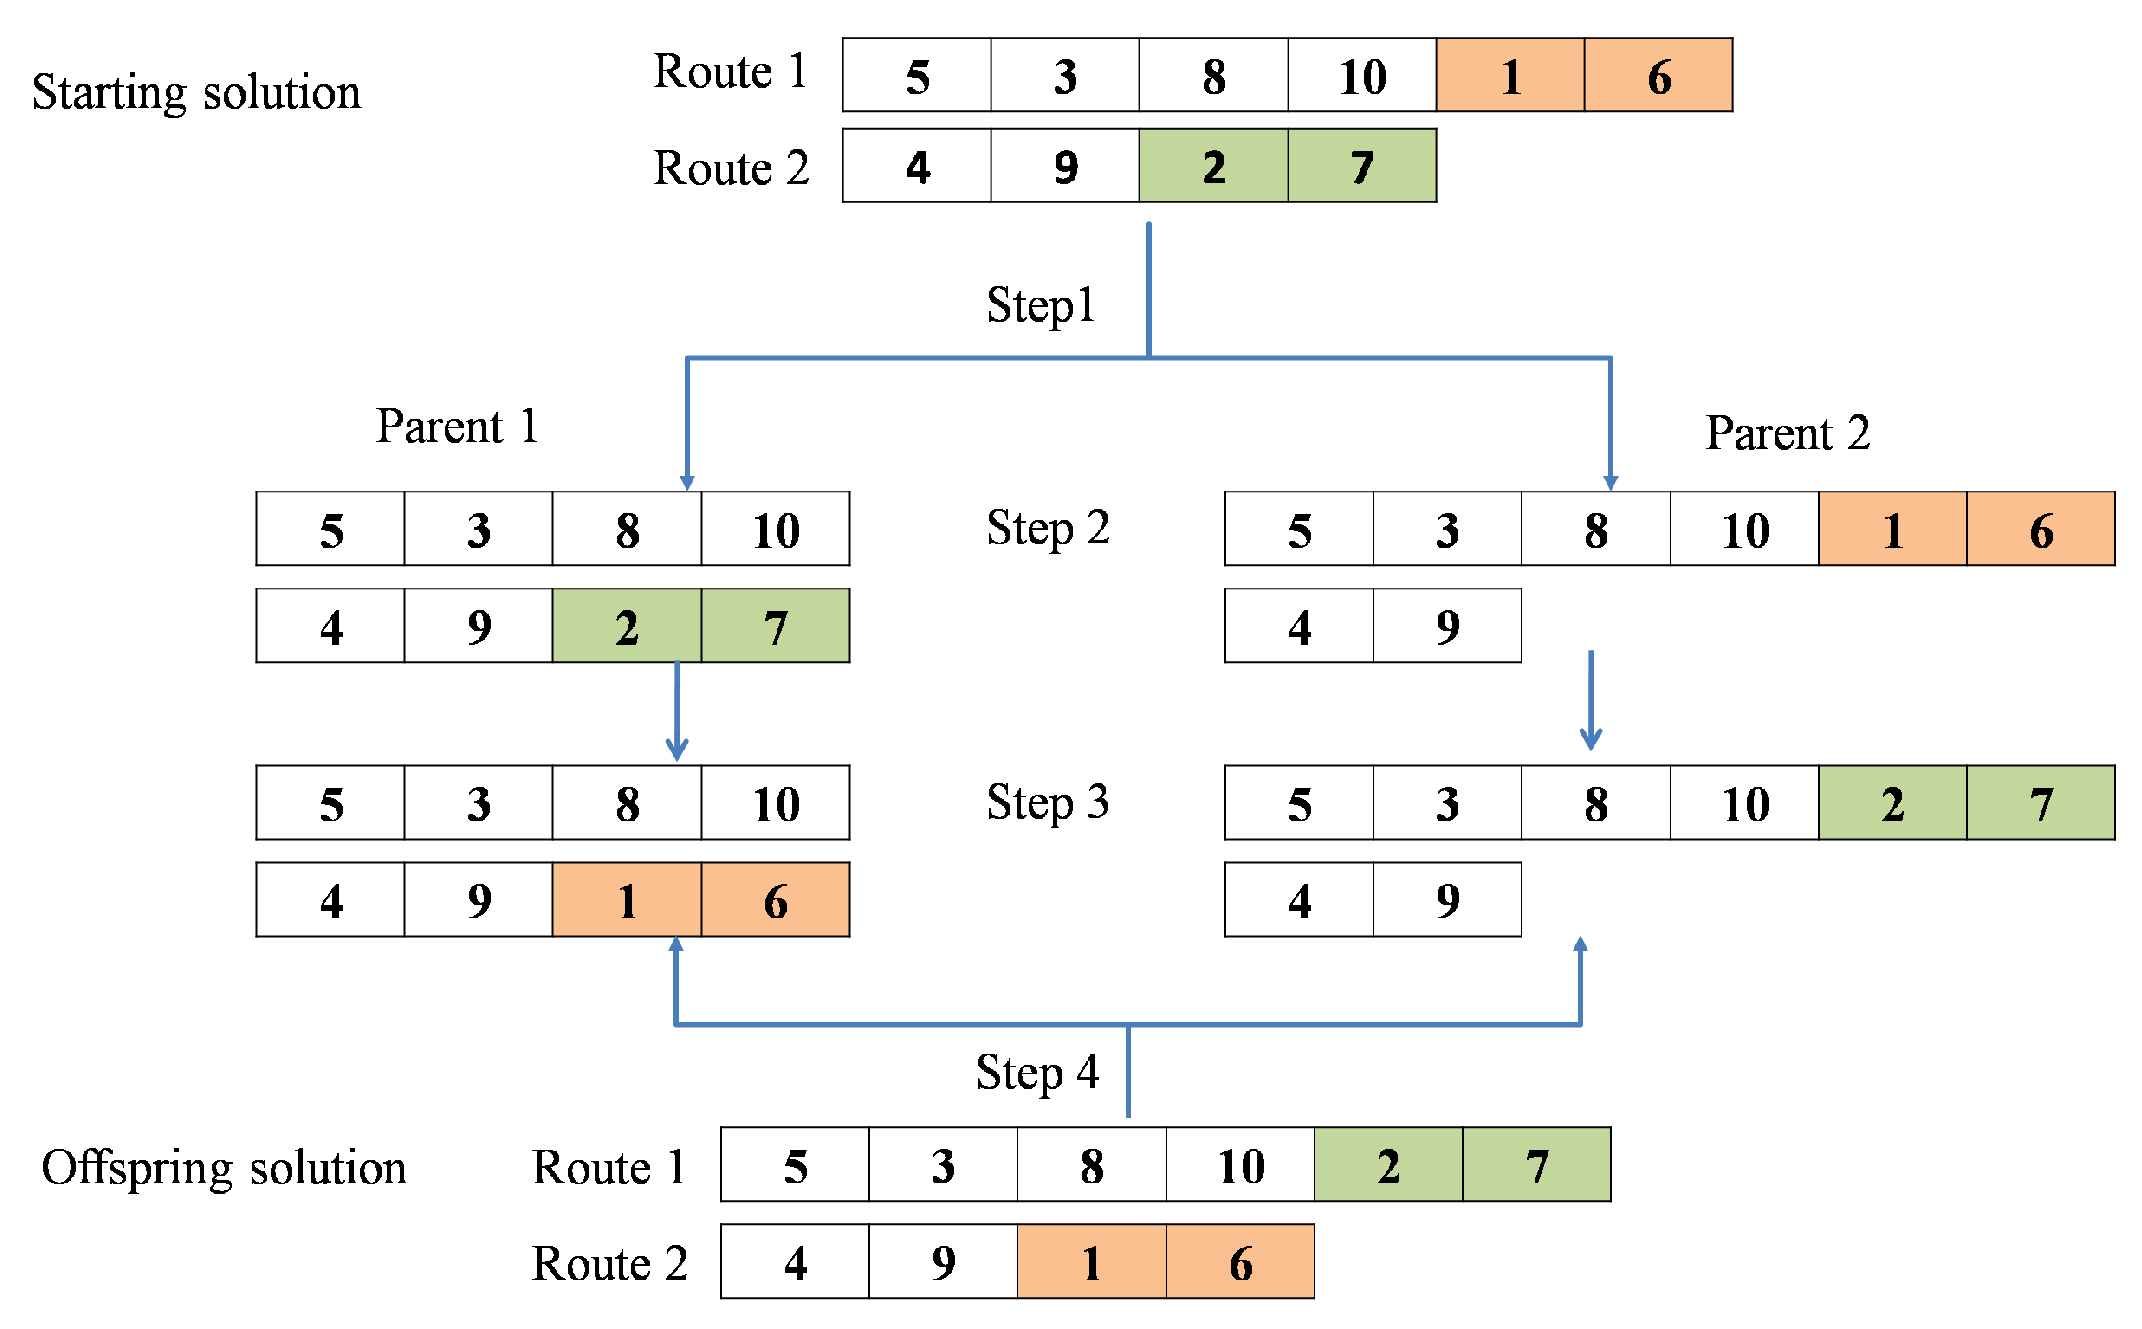
The crossover is a classic gene-changing process by which the offspring inherit a genetic code slightly different from the parents. The crossover operator in this work consists in creating an asymmetry between two copies of an individual. An example of the crossover operator is illustrated by
Figure 6. In this example, we consider five requests that are satisfied by two vehicles.
First, an individual is randomly selected from the current population. In step 1 of
Figure 6, a copy of this solution is created. Hence, two parents are considered for our crossover operator. Next, from each route, a complete sub-route is chosen (with the corresponding pickup and delivery nodes). In the example, we select the sub-route from node 1 to node 6 from route 1, and we select as an example, the sub-route from nodes 2 to 7 from route 2. Then, in step 2, the sub-sequence from 1 to 6 is removed from parent 1, and the sub-sequence from 2 to 7 is deleted from parent 2. Next, in step 3, two new solutions are constructed by exchanging the selected sub-routes respecting their exchanged positions in the tours. This exchange is guaranteed if it maintains the feasibility of the solution. With this regard, all the constraints of the problem must be checked at this stage. Finally, in step 4, an offspring solution is constructed by the union of the two resulting parts of solutions.
5. Experimental Study
In this section, an experimental study is conducted in order to assess the performance of the EDA method in terms of reliability and efficiency.
5.1. Description of the Benchmark Test Instances
The benchmark test instances which have been chosen for the study are mobility-on-demand problems taken from the work of [
39]. These instances are built upon realistic geographical data where pickup and delivery points are located sites defined by a geographical information system. Large distances separate the locations and the networks are of different complexities.
These instances include customer-oriented values with parameters related to the quality of service. Indeed, maximum riding times are specified for each customer as well as time windows which are supposed for pickup and delivery nodes. For these requests, the time windows are of different sizes depending on the customers’ preferences. The maximum riding times are also expressed according to the distances between the requests of the customers. A homogeneous fleet of vehicles is available at the depot with a maximum capacity of eight persons. A maximum total tour duration equal to 480 is considered. There are 96 instances, but only 15 examples are reported for this experimentation. These instances were selected considering various problem sizes with between 10 and 47 requests. From each set of problems with the same number of requests, one instance was selected. The selected instances are those solved by the branch and bound method embedded in the CPLEX software within a limit of four hours.
5.2. Experimental Protocol
The EDA was implemented in C++ language using the DevC++ compiler. The mixed-integer linear formulation of the Customer-Oriented DARP was implemented in OPL language in the commercial software CPLEX 12.6. This latter uses the branch and bound technique for an exact resolution of the problem. The two methods were executed on an Intel(R) Core(TM) computer (2.4 GHz) with 4 GB RAM.
Three types of experiments were conducted. In the first level, a comparison is made between near-optimal solutions obtained with the EDA and the lower bounds of the solution space provided by CPLEX. In order to assess the performance of the EDA, both the execution time for finding the exact and approximate solutions are provided as well as these solutions. In this work, we limit the calculations with CPLEX to four hours of time.
In the second level of experimentation, we compare our evolutionary method EDA with another local search based metaheuristic which is a Tabu Search method dedicated to DARPs with customer specifications, see the work of [
34]. In the third level of the experimentation, we compare our EDA method with a more complicated evolutionary technique where the genetic schema is hybridized with a local search dynamically managed over the search. This hybridized method is the ELS of [
13].
In order to fairly compare the different methods, a parameter (%) is introduced. It is calculated as ((( − )/) ∗ 100) where is the cost of the execution of a and is the cost of a compared to the first one. Let us note that a negative value of expresses an improvement of the EDA as compared with the other methods.
5.3. Comparison of the Results Obtained with the EDA Method and CPLEX
The computational results of the first testing phase are presented in two main tables.
Table 3 reports the results obtained in less than two hours. In
Table 4, the results of CPLEX take more than two hours. In the three first columns, the instances are described with their names, the total number of nodes, and the total number of vehicles. All the instances of the tables have been tested with CPLEX which gave the optimal solutions and with the EDA which provided near-optimal ones.
The comparison is expressed in terms of gaps in the value of the total costs and the
times.
Table 3 presents problems with up to 58 nodes with 29 requests. In
Table 4, between 68 and 94 nodes are considered and thus 34 to 47 requests have to be addressed.
Regarding the costs obtained with the EDA, the calculated
s are smaller than 5% in both
Table 3 and
Table 4, except the case of SF_RL_d08. However, for CPLEX, the problem resolution implies longer times, especially for problems involving more than 20 requests. For instance, the resolution of the instance SF_RL_d36 requires more than two hours for CPLEX whereas about five minutes are consumed by the EDA. As a consequence, the EDA can provide near-optimal solutions in a much shorter time for hard real life instances.
5.4. Comparison of the Results Obtained with the EDA Technique and Existing Methods from the State of the Art
In this part of the study, we show the quality of the solutions produced by the EDA by comparing them to other metaheuristic based approaches.
In the first
Table 5, we compare our EDA to a local search-based method which is a Tabu Search dedicated to DARPs addressing some customers’ expectations, see the work of [
34]. In
Table 6, we observe the behaviour of our evolutionary method as compared with the ELS of [
13] which is more complicated than our method since the hybridization of the genetic schema is managed using six parameters which trigger the diversification and intensification operators dynamically during the run. As no computational time was given in the reference presenting the results of Chassaing et al. and tested on the same instances, in this paper, the
times are avoided from
Table 5 and
Table 6. Similarly to the previous experimental part, both the tables are divided into two parts separated by a horizontal line which separates the problems which consider more or less than 29 requests.
5.4.1. Comparison of the Results Obtained with the EDA and a Tabu Search
Table 5 presents a comparison of the results obtained with the EDA and a Tabu Search specially dedicated to customer-oriented DARPs.
Table 5.
Comparison of the results obtained with the EDA and the Tabu Search.
Table 5.
Comparison of the results obtained with the EDA and the Tabu Search.
| Instances | n | m | Tabu Search | EDA | Gap (%) |
|---|
| f (S) | f (S) | |
|---|
| SF_RL_d75 | 10 | 2 | 150.22 | 150.05 | −0.11% |
| SF_RL_d92 | 17 | 2 | 324.01 | 323.16 | −0.26% |
| SF_RL_d93 | 20 | 2 | 430.01 | 412.35 | −4.11% |
| SF_RL_d94 | 23 | 2 | 345.82 | 325.98 | −5.73% |
| SF_RL_d55 | 28 | 4 | 1469.28 | 1396.29 | −4.97% |
| SF_RL_d52 | 29 | 4 | 1528.45 | 1527.96 | −0.03% |
| SF_RL_d10 | 34 | 4 | 1375.86 | 1401.84 | 1.89% |
| SF_RL_d39 | 38 | 6 | 2091.61 | 2073.39 | −0.90% |
| SF_RL_d70 | 39 | 6 | 2148.97 | 2012.05 | −6.37% |
| SF_RL_d82 | 39 | 6 | 1918.25 | 1920.25 | 0.10% |
| SF_RL_d08 | 42 | 7 | 1992.69 | 1832.94 | −8.02% |
| SF_RL_d36 | 42 | 6 | 2198.22 | 2197.05 | −0.05% |
| SF_RL_d43 | 43 | 6 | 1995.23 | 2097.47 | 5.12% |
| SF_RL_d01 | 46 | 7 | 2506.84 | 2477.88 | −1.15% |
| SF_RL_d11 | 47 | 6 | 2661.76 | 2500.07 | −6.07% |
The upper part of the
Table 5 shows that there are better results with the EDA than with the TS. This is reflected by the negative values of the gaps. Additional negative gaps appear in the second part of the table. As an example, on the instances SF_RL_d08 and SF_RL_d01, the negative deviations −8.02% and −1.15% are obtained. Therefore, one can observe a positive impact of the descent technique in the EDA. Results obtained with the EDA are better thanks to a faster archival of the best population along the run in the descent process. Globally, the EDA has more improved results for problems with more than 29 requests.
5.4.2. Comparison of the Results Obtained with the EDA and the ELS Methods
The second study is performed on the same realistic instances to highlight the efficacy of our algorithm as compared with the hybridized ELS which counts six neighbourhoods in the local search.
In
Table 6, one can observe that the behaviour of the EDA is aligned with that of the ELS when the size of the problems grows. Moreover, for instances with less than 58 nodes (29 requests), all the results obtained with the EDA are better than those of the ELS. For problems with more than 68 nodes, the quality of the solutions is relatively good, as was also observed in
Table 5. However, there are only two instances where an improvement of the solution is obtained. It is for the instances SF_RL_d08 and SF_RL_d11 where the negative gaps −1.31% and −1.50% are produced respectively.
Moreover, for the same size of the network as the one with 42 requests, the costs obtained can be different. Two different gaps, one negative −1.31% and the other positive 2.69% are found on the instances SF_RL_d08 and SF_RL_d36. This fluctuation of the costs can be explained by the complexity of the on-demand transportation network.
Furthermore, even if the results seem to be less effective for large instances with more than 29 requests, the EDA is simpler and faster than the ELS since it uses only one search space perturbation operator. Besides, the positive gaps never exceed 5% in experiments carried out on problems with a high complexity.
Table 6.
Comparison of the results obtained with the EDA and the ELS of [
13].
Table 6.
Comparison of the results obtained with the EDA and the ELS of [
13].
| Instances | n | m | ELS | EDA | Gap |
|---|
| f (S) | f (S) | (%) |
|---|
| SF_RL_d75 | 10 | 2 | 150.91 | 150.05 | −0.57% |
| SF_RL_d92 | 17 | 2 | 347.01 | 323.16 | −6.88% |
| SF_RL_d93 | 20 | 2 | 418.76 | 412.35 | −1.53% |
| SF_RL_d94 | 23 | 2 | 352.25 | 325.98 | −7.46% |
| SF_RL_d55 | 28 | 4 | 1516.71 | 1396.29 | −7.94% |
| SF_RL_d52 | 29 | 4 | 1607.74 | 1527.96 | −4.96% |
| SF_RL_d10 | 34 | 4 | 1341.02 | 1401.84 | 4.53% |
| SF_RL_d39 | 38 | 6 | 2030.44 | 2073.39 | 2.12% |
| SF_RL_d70 | 39 | 6 | 2006.05 | 2212.05 | 0.30% |
| SF_RL_d82 | 39 | 6 | 1842.84 | 1920.25 | 4.20% |
| SF_RL_d08 | 42 | 7 | 1857.35 | 1832.94 | −1.31% |
| SF_RL_d36 | 42 | 6 | 2139.52 | 2197.05 | 2.69% |
| SF_RL_d43 | 43 | 6 | 2002.15 | 2097.47 | 4.76% |
| SF_RL_d01 | 46 | 7 | 2396.55 | 2477.88 | 3.39% |
| SF_RL_d11 | 47 | 6 | 2538.18 | 2500.07 | −1.50% |
6. Discussion
In this paper, a customer-oriented DARP has been tackled by a new evolutionary descent approach. In this approach, a descent technique aims at optimizing the quality of the population which evolves during the search. The exploration of the search space is ensured using new evolutionary operators.
The comparative results between the EDA and CPLEX show low gaps for almost all the instances tested ensuring lower execution times for a high quality of the solutions. Despite the use of a single evolutionary operator, the EDA method outperforms results obtained with other metaheuristics of the literature, namely the ELS and the TS. When compared with the TS, twelve out of the fifteen instances tested have been improved by our method. As compared with the hybrid evolutionary local search, the results are also promising with gaps reduced to 5% on instances of considerable size and complexity.
Indeed, for small instances, EDA outperforms ELS. For larger instances with more than 29 requests, the results are competitive. Let us note that the EDA is however faster and simpler to implement whereas the ELS uses six operators to manage the search for good solutions. Thus, an enhanced hybridized evolutionary algorithm with more elaborated operators is a promising direction for future works to cope with the specificity of the customers designed according to their preferences and the new requirements of current transport on demands. In addition, the proposal of the new time windows constraints makes the problem more difficult to address, especially when it is applied to real transport cases as presented in this study.
7. Conclusions
This paper describes a customer-oriented Dial-A-Ride Problem with specific customer-oriented constraints. A modelization of the problem is proposed using a mixed-integer linear program. For this model, a computation of lower bounds of the solution space is provided by the branch and bound method of CPLEX. To cope with the exponential times, an evolutionary descent algorithm is developed relying on a new evolutionary operator. The comparison between the two methods indicates low deviations. When our EDA method is compared to other metaheuristics such as the Tabu Search method or another hybrid evolutionary one, promising results are obtained. For more complex transport problems, the results are less spectacular, while they can be obtained in a faster time since it depends on only one operator for the crossover phase. This saved time can be used to test additional evolutionary operators. Moreover, as the Tabu Search is known to address efficiently DARPs, another hybridization of the evolutionary schema with a Tabu Search can be envisaged to tackle a wider range of mobility-on-demand problems.


