Article

A Data-Driven Approach to Stormwater Quality Analysis in Two Urban Catchments

1
StormTac Corporation, SE-116 40 Stockholm, Sweden
2
Urban Water Engineering, Department of Civil, Environmental and Natural Resources Engineering, Luleå University of Technology, SE-971 87 Luleå, Sweden
*
Author to whom correspondence should be addressed.
Sustainability 2022, 14(5), 2888; https://doi.org/10.3390/su14052888
Submission received: 20 January 2022 / Revised: 22 February 2022 / Accepted: 23 February 2022 / Published: 2 March 2022

Abstract

:
The StormTac Web model, representing a low-complexity conceptual model (LCCM), was applied to two urban catchments featuring stormwater quality controls, a stormwater pond or a biofilter. The model calculates annual average runoff from annual precipitation and land-use specific volumetric runoff coefficients and baseflows (in storm sewers), which are multiplied by the corresponding mean stormwater quality constituent concentrations obtained from the recently upgraded StormTac Database, to yield constituent loads. The resulting runoff loads pass through the stormwater quality control facilities (a stormwater pond or a biofilter) where treatment takes place and its efficacy is described by “reduction efficiencies”. For the four selected stormwater quality constituents (TP, Cu, Zn, TSS) and two study catchments, a 201-ha residential Ladbrodammen and an 8.2-ha Sundsvall traffic corridor, the compositions of stormwater entering and leaving the control facilities were calculated by StormTac Web and compared against the measured data. In general, the calculated concentrations were smaller than the measured ones, and these differences were reduced, but not eliminated in all cases, by considering uncertainties in both calculated and measured data. Uncertainties in calculated values consisted of two components, a flow component (assumed as 20%) and a concentration component, which was assumed equal to the relative standard error (RSE) of the data in the StormTac Database. Explanations of differences in calculated and measured stormwater data were discussed with respect to temporal changes and trends in environmental practices and stormwater quality monitoring and enhancement by treatment.

1. Introduction

Goals of urban stormwater management have evolved rapidly during the last 50 years from providing hydrologically and hydraulically effective drainage to the current state encompassing the health, safety, and welfare of the urban population, enhancing and protecting the water quality [1], preventing harmful effects of increased and polluted runoff on the environment, and maintaining a water balance of urban areas through groundwater recharge and enhanced use of stormwater as a resource. The success of such programs depends on managing stormwater quantity and quality. While the stormwater quantity can be managed fairly well using the time-tested hydrological concepts, the understanding and management of stormwater quality needs further development of concepts and tools, and their understanding [2]. One of the first broad and systematic efforts in advancing the understanding of stormwater quality, its effects on the receiving waters, and the means of effect mitigation, was the US EPA Nationwide Urban Runoff Program [3] focusing on urban stormwater quality and the collection of stormwater data in 28 cities across the USA.
Among the innovative concepts recommended in NURP [3] were the characterization of stormwater quality by event-mean-concentrations (EMC = event pollutant mass/event flow volume) and adopting the lognormal distribution for describing EMCs. Furthermore, EMCs and runoff event volumes, either measured or calculated from rainfall data by hydrologic models or the volumetric runoff coefficient methods [4], were uncorrelated and their analyses could proceed independently. A theoretical justification for using the lognormal distribution in engineering applications was offered by Chow [5], cited in Van Buren et al. [6], and using his reasoning, it should be applicable to EMCs. After NURP, the applicability of lognormal distribution and the lack of correlation between EMCs and event runoff volumes were reported by others, e.g., Van Buren et al. [6] and Leutnant et al. [7]. Fitting the lognormal distribution to empirical runoff quality data offers advantages in further data analysis and interpretation, including comparisons of upstream–downstream concentrations [3], performance of best management practices [6], and assessing wet-weather bacteriological pollution in a river and compliance with recreational waters criteria. However, for estimating storm event loads, annual loads, and comparisons of various catchment loads, the use of mean (rather than median) concentrations was recommended in NURP [3].
Stormwater quality data are also essential for stormwater modelling, in which they serve two purposes: selection of optional stormwater quality algorithms and model calibration. Such approaches can be demonstrated on the widely used SWMM model [8], which allows the user to select from three alternative approaches to modelling the stormwater quality: (a) inputting catchment-specific EMC concentrations, which remain constant during the event simulation, (b) inputting stormwater quality rating curves, in which the pollutant concentration is a function of the runoff rate only, and (c) calibrating the pollutant mass accumulation/washoff algorithms. Calibration of stormwater quality sub-models is a major challenge, particularly at the planning level, because the physical system under design does not yet exist and calibration data have to be transposed from similar existing developments. Such a transposition of data can be implemented by means of the StormTac Web model and its database, which holds stormwater quality data for various types of urban land use.
Building on the earlier research, the objective of our paper is to demonstrate a data-driven approach to analyzing stormwater quality by means of the StormTac Web model [9], serving to calculate pollutant loads generated in two urban catchments and evaluate load remediation by two widely used stormwater control measures (SCMs), a stormwater detention pond and a biofiltration facility. Toward this end, the modelled pollutant loads, with estimated uncertainties, are compared against field measurements.

2. Methods

The main task of this study was to calculate the selected constituent concentrations and loads in two test catchments and assess the mitigation of such loads by the existing SCMs.

2.1. Modelling Stormwater Pollution Loads

The modelling of stormwater quantity and quality by the StormTac Web model was described in detail elsewhere [10]. Therefore, only a brief model description is included here focusing on the model’s salient features applied in this study. Stormwater runoff was calculated as a product of the annual precipitation and the volumetric runoff coefficients, φV, defined for specific land uses. For the land uses considered in our two test catchments, the values of φV varied from 0.1 (for green areas) to 0.8 (for imperious covers). The uncertainty of φV was estimated in [10] as 0.2, which is a more conservative estimate than 0.15 derived in [11] from sensitivity analysis of runoff simulations with the STORM model. Relatively high uncertainties in the φV estimate were caused by the need for the model to cover a broad range of conditions with respect to climate, rainfall regime, catchment development and cover, and soil characteristics. Where the model user has access to or can collect such data, the proposed value (0.2) could be significantly reduced.
Pollutant loads in stormwater are then estimated by multiplying the annual runoff flow rate by the pollutant concentration corresponding to the catchment land uses. Hence, the catchment is divided into a number of subcatchments with homogenous land use. For the catchments studied, there were nine land uses considered. Concentrations of pollutants in stormwater from such land uses can be supplied by the user from locally available data, or as done here, adopted as typical (default) data from the StormTac Urban Stormwater Quality Database (SUSQD). This database has been developed using data from numerous case studies and international databases, such as the BMP database [12] and the NSQD database [13]. The SUSQD is a proprietary web application, requiring a license for full access to all the data, but much of the data, including the most comprehensive stormwater concentration data, are publicly available at StormTac Website (accessed on 13 October 2021) [14]. The database includes also some baseflow concentrations for a few land uses, see Supplementary Table S2.
When using default data, one of the key issues is the estimation of data uncertainties. As discussed in [11] for a data set of 14 conventional pollutants and 21 trace organic compounds from multiple sites in three industrial cities, uncertainties in pollutant loads are strongly affected by concentration variabilities at the individual sites and among the sites. Furthermore, it was noted that variations in mean stormwater concentrations among sites were relatively small for common stormwater chemicals (e.g., P, Cl, Cd, Cu, Ni, Zn), but higher for local industry related trace organics (e.g., hexachlorobenzene, PCBs, PAHs). Finally, estimates of load uncertainties were produced in [11] (comprising flow and concentration components) in the range of 0.28–0.75. The SUSQD database represents a much larger data set (probably an order of magnitude) and this enabled more robust estimates of uncertainties, certainly for the water quality constituents studied in the test catchments (TP, Cu, Zn, and TSS). The procedure proposed here for estimating pollutant loads uncertainty is outlined below.
The basic assumption in estimating load uncertainties from representative concentrations for a selected land use is that they can be well approximated by the relative standard error (RSE) of the corresponding data in the SUSQD. Such an approach cannot be readily applied to uncertainties in baseflow because there is scarcity of baseflow concentration data in general, and that is reflected in relatively limited baseflow data in the SUSQD. Consequently, it was assumed in [10] that RSEbaseflow = RSEsw. Finally, the uncertainty components from individual subcatchments with specific land uses were prorated according to the magnitude of load components from individual subcatchments divided by the corresponding runoff volume, because as demonstrated in the results section, pollutant loads from the whole catchment are dominated by contributions of a few subcatchments producing high runoff and pollutant concentrations. The prorating procedure can be summarized by the following equation:
δ Crj = RSE Crj = ( A 1   ·   φ V 1   · RSE Cr 1 j 2 + A 2   · φ V 2   ·   RSE Cr 2 j 2 + + Ai   · φ Vi   ·   RSE Crij 2 A 1   ·   φ V 1 +   A 2   ·   φ V 2 + +   Ai   ·   φ Vi   )
where δCrj is uncertainty in pollutant p concentrations in stormwater runoff, RSECrj is the corresponding relative standard error calculated from concentration data in SUSQD, A1–Ai are areas of subcatchments; φV1, …, φVi are volumetric runoff coefficients of subcatchments 1–i, and RSECr1j, …, RSECrij are relative standard errors of pollutant j concentrations in individual subcatchments.

2.2. Modelling Stormwater Treatment Efficiencies for Stormwater Detention Ponds and Biofilters

The modelling of stormwater treatment efficiencies by StormTac Web, for various SCMs, is based on the published field data compiled in the StormTac SUSQD database. Such data are listed as the so-called reduction efficiencies (REs) for specific constituents and SCM measures (in our case, ponds and biofilters) and were collected from numerous studies, or databases, and compiled in SUSQD. All data accepted for inclusion were subject to quality control and emphasis was placed on adopting the data from studies employing flow-weighted concentration data to derive reduction efficiencies. The functions implemented in the StormTac Web model for the calculation of reduction efficiency (RE) in ponds and biofilters are based on logarithmic functions between the permanent facility area (Ap) per reduced (impervious) catchment area (i.e., area x runoff coefficient, φV) and the reduction efficiency (%). In these functions, additional site-specific parameters were included, such as constituent inflow concentrations, vegetated fraction of the facility, bypassed fraction of runoff, length/width ratio (hydraulic efficiency) of storage layout, detention volume [15], and minimum outflow concentrations Cirr (also called “irreducible concentrations”) [16,17]. The functions implemented in the current version of StormTac Web have since then been modified by including a factor representing the effect of the level of the raised well over the biofilter surface area and a function describing the time needed to empty the pond.
For estimating SCM performance uncertainties, it was assumed that the calculated relative standard error (%) of reduction efficiencies (%) of individual SCMs (e.g., ponds and biofilters in our case) compiled in the SUSQD (see Supplementary Table S3) represents the total uncertainties of specific SCM reduction efficiencies. The relative standard errors were compiled from numerous case studies with different site conditions, assuming that RSEs equal the total uncertainty, δREj = RSEREj, specific for each substance and the type of facility.

3. Case Study Catchments

The StormTac Web model was applied to two test catchments, which were selected for the following reasons: (i) representing typical Swedish urban catchments with similar varieties of land uses, (ii) each featuring one of the two most common SCMs in Sweden (a stormwater pond, or a biofilter), and (iii) availability of rainfall, runoff, stormwater quality, and SCM performance data.

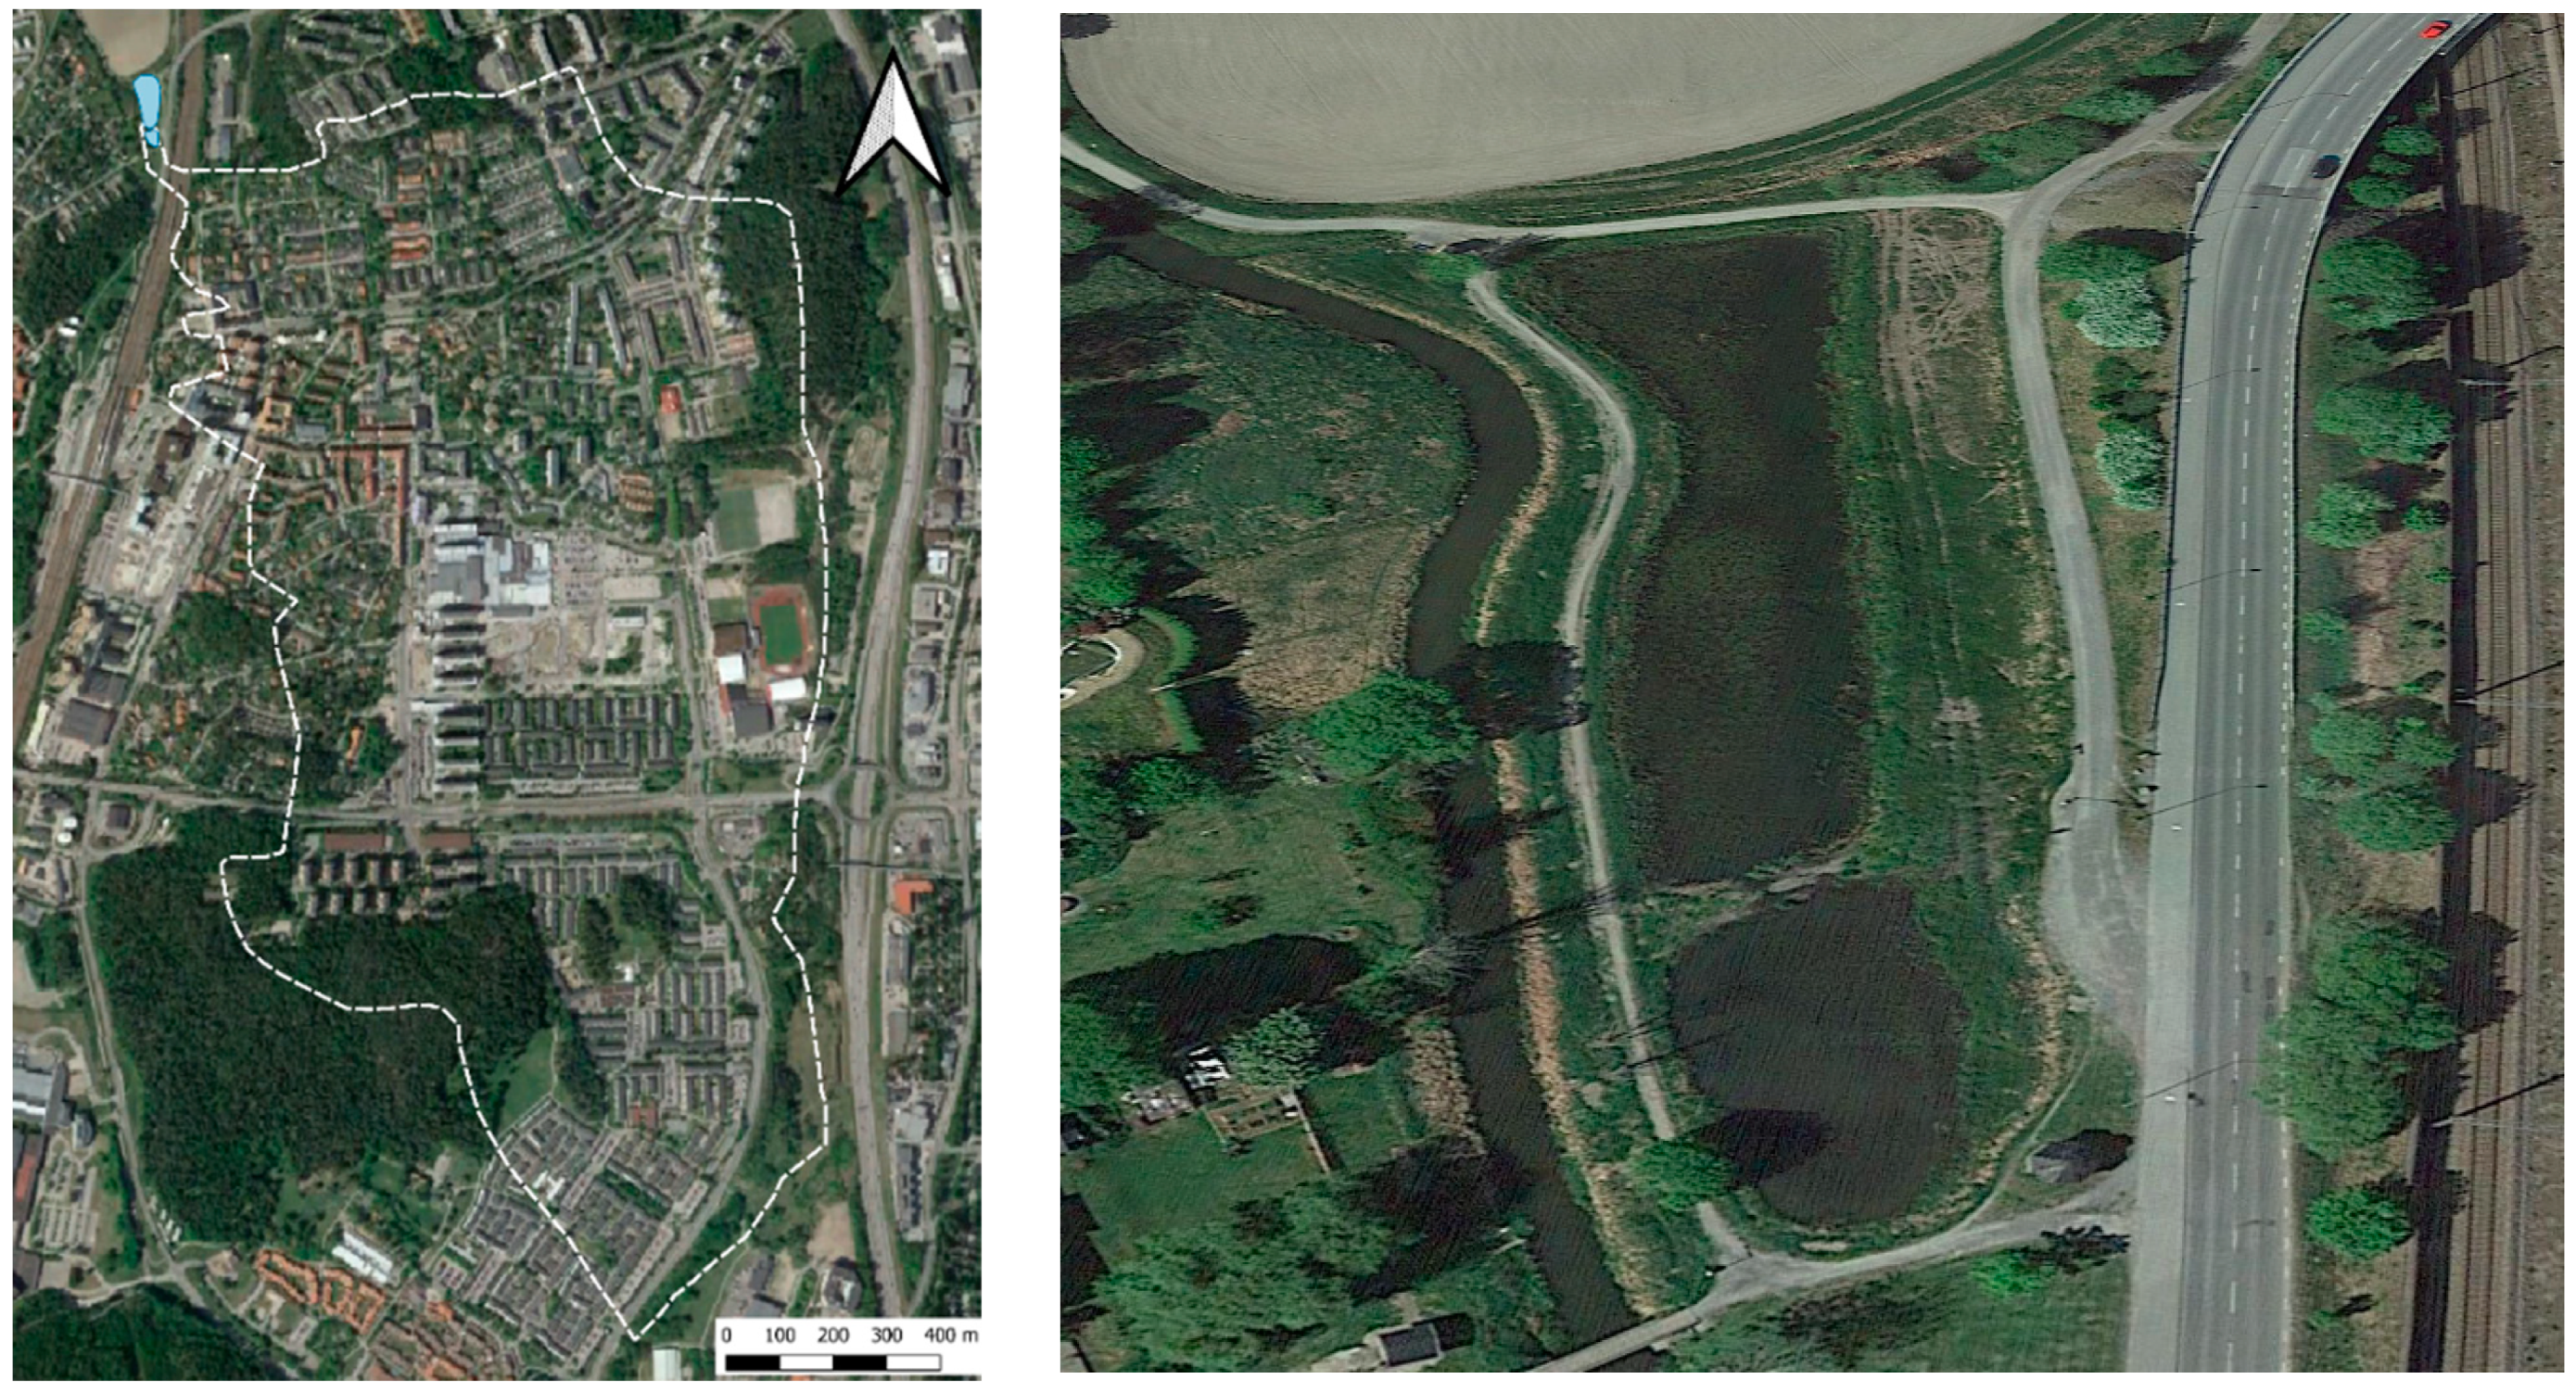
3.1. Ladbrodammen Catchment

The Ladbrodammen catchment is an urban catchment of 201 ha located in Upplands Väsby, in northern Stockholm, Sweden (Figure 1). The catchment was discretized into 10 subcatchments representing various land uses (Table 1).
Runoff and baseflow: Catchment rainfall, runoff and baseflow, and stormwater and baseflow quality were obtained from an earlier study of the Ladbrodammen catchment, in which these quantities were measured from May 2008 to August 2010. The rainfall characteristics of the sampled periods are presented in Supplementary Tables S4 and S5. Precipitation input data were obtained from SMHI Station No. 9732, Sätra Gård, and corrected to yield two annual values of 613 and 694 mm/year [18]. Land use in the catchment was classified into 10 categories, ranging from typical urban land uses (Nos. 1–6 in Table 1) to green or undeveloped lands (Nos. 7–10). Examination of subcatchment areas and the associated volumetric runoff coefficients indicates that the urban lands have a potential to produce more than 80% of the annual runoff from this catchment. As discussed later, during the monitored period, there were at least two 14-day dry periods producing 400–800 m3 of drainage flow contributed by baseflows in the range from 0.33 to 0.66 L/s. Note that in wet weather, the baseflow rates are likely higher.
The stormwater runoff and baseflow from the catchment area are drained to the Ladbrodammen stormwater management facility, constructed in 2003. The facility consists of three components: an upstream balancing basin storing pumped-in stormwater and baseflow, and, depending on the water depth in the basin, water is discharged either through or over a porous macadam barrier into the main pond or the adjacent wetland area. When the detention pond is full, water discharges over an outflow weir directly to the Väsbyån stream [19]. The combined capacity of the two pumps filling the balancing basin is 160 L/s; when the catchment runoff exceeds this capacity, the excess drains directly into the receiving stream Väsbyån. The volume of such bypasses was estimated at 25–35% of the annual catchment runoff and baseflow [20]. The rate of interception of annual runoff may appear low by today’s standards, but it was constrained by several factors, including the lack of space for stormwater management facilities and the costs of pumping stormwater into the pond. The main treatment process in the facility is stormwater settling in the main pond having a surface area of 5500 m2, permanent storage of 3700 m3, and a dynamic storage of 500 m3, with the outflow throttled by a weir.
The Ladbrodammen facility was instrumented and monitored by collecting flow data and flow-weighted samples of stormwater and baseflows. Pumped inflow rates were measured by a flow velocity-area meter installed in the sewer outlet feeding the main pond and outflow rates were measured by the pond outlet weir, of which head was measured by a sonar sensor. For both flow metering installations, uncertainties in measured flows were estimated at 7%. The sampling regime slightly differed between the two sampling periods. During the first period (8 May 2008 to 6 June 2009), eighteen of 7-litre samples were collected as flow-weighted composite samples every 2–4 weeks. During the second period (from 7 June 2009 to 31 August 2010), thirty-two 10–20 litre composite samples were collected using flow data for sample composition. Throughout the sampling program, sample aliquots were collected continually, even in dry weather when baseflow was observed in storm sewers. The sampling frequency was justified by the expected inflow rates and was adjusted to collect as large sample volumes as possible, without exceeding the capacity of the sample storage container during about two weeks. During the first period, the cumulative flow volume discharged from the pond outlet was also recorded, but not during the second period. The samples collected during the first period represented runoff and baseflow generated by catchment precipitation of almost 600 mm, while those collected during the second period characterized the quality of runoff generated by 843 mm of precipitation. Thus, during both periods, high fractions of the annual runoff were sampled and this contributed to the robustness of the collected data.
Samples were analyzed for many parameters [19,20], but here we selected four parameters, namely TP (total phosphorus), Cu (total copper), Zn (total zinc), and TSS (total suspended solids), for the following reasons: (i) TP is important for addressing productivity or eutrophication of the receiving waters; (ii) Cu and Zn are ubiquitous urban metals, which may cause toxicity in the receiving waters. They can also serve as indicators of traffic-related pollution; and (iii) TSS are known to impact on fish habitat, water quality processes in the water column, and transport of adsorbed hydrophobic pollutants (some species of metals, or trace organics).
The measurement errors caused by longer sampling periods (around two weeks) than normally recommended were assessed to be relatively small. The measurement errors for the four constituents were estimated to be about 10% for TP, Cu, and TSS, and 10–20% for Zn [19]. Uncertainties in measured flows were estimated at 7%, so the combined uncertainties of measured chemical fluxes were about 12% for TP, Cu, and TSS and 12–21% for Zn. Stormwater quality for various subcatchment land uses were adopted from the StormTac Database (SUSQD).

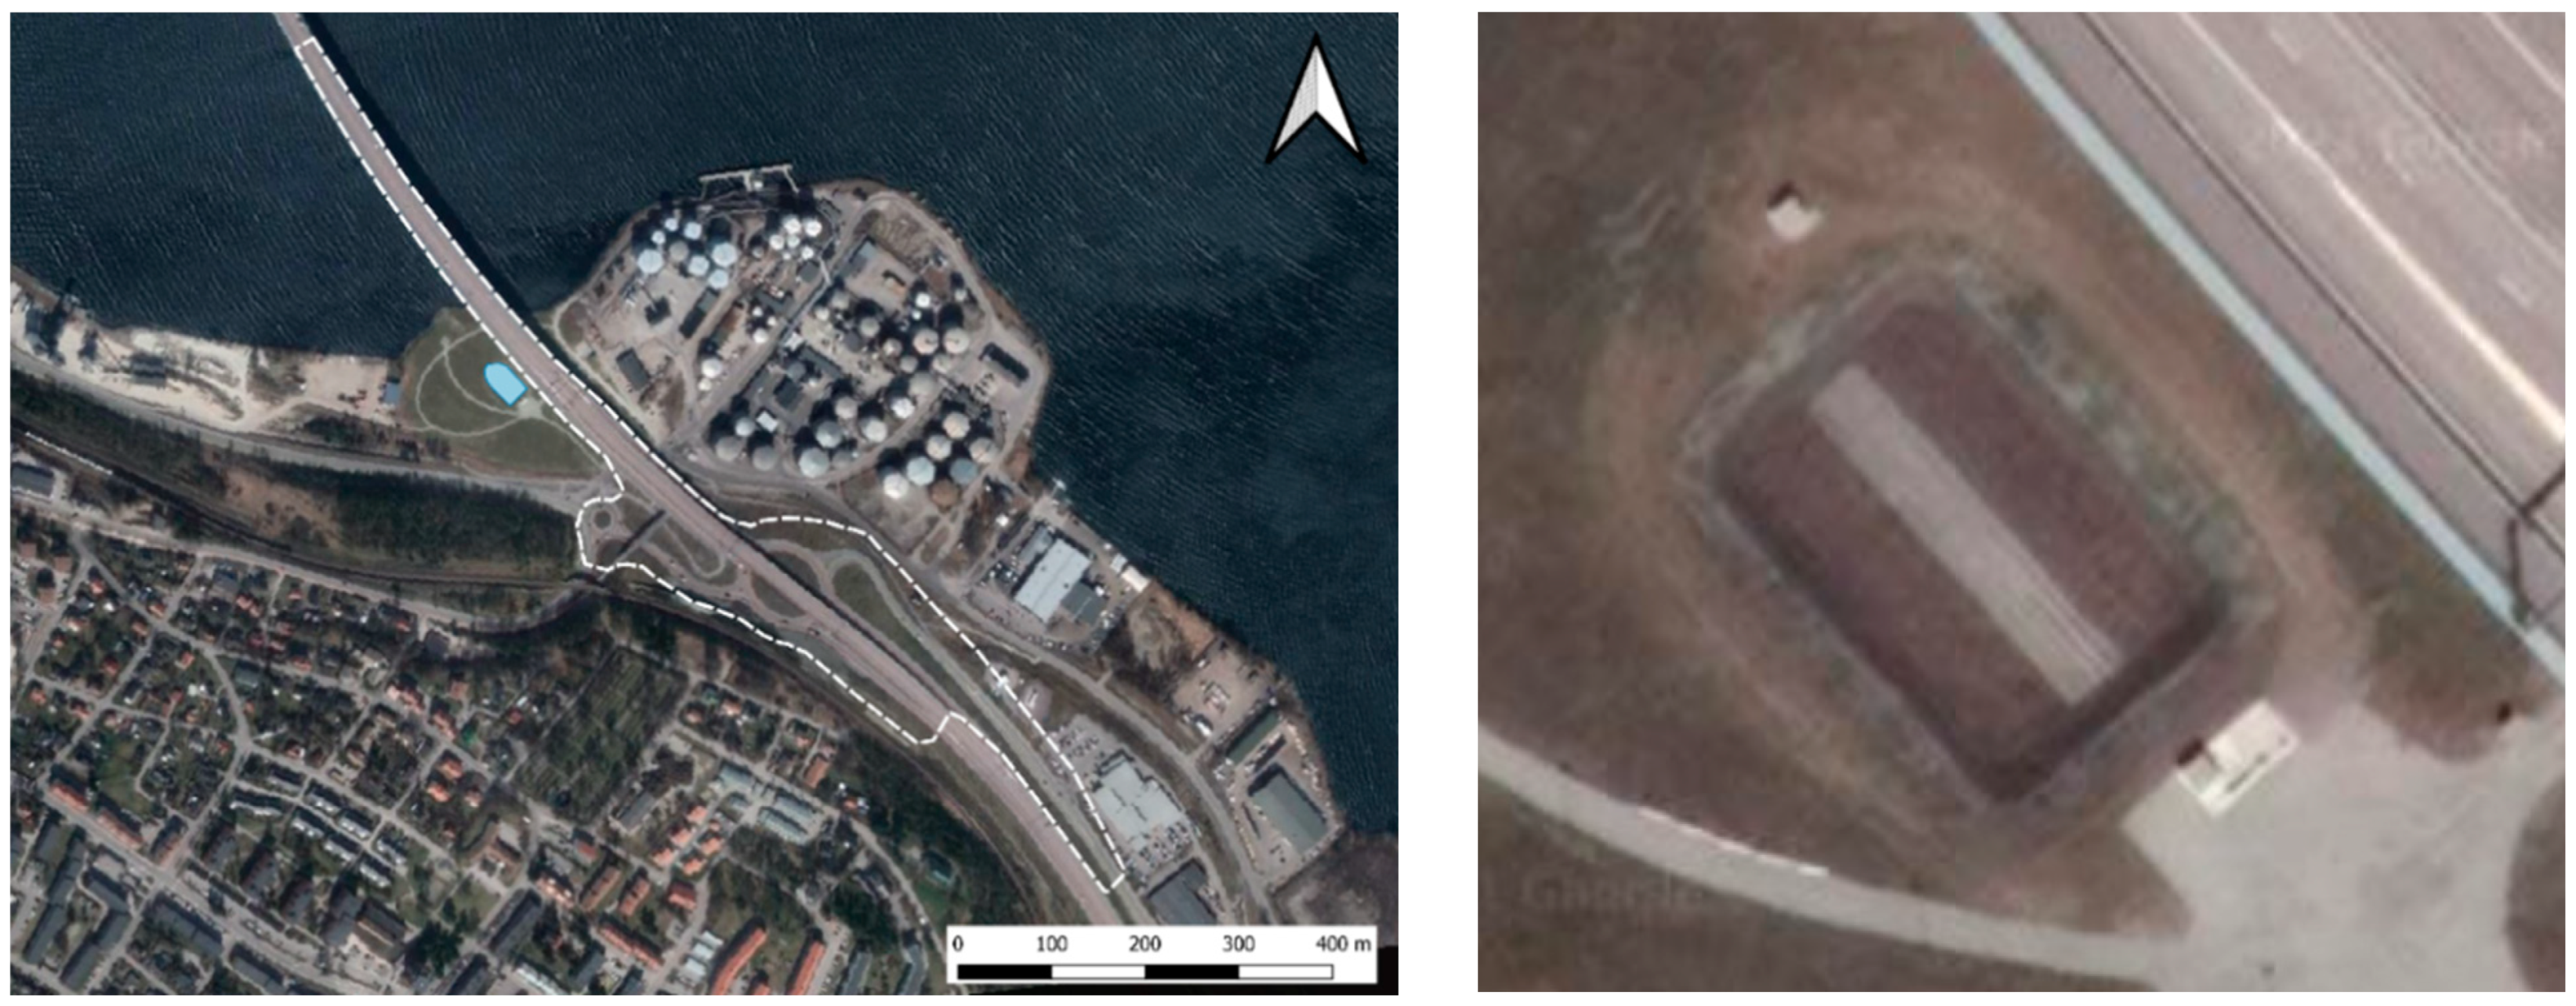
3.2. Sundsvall Biofilter Catchment

The Sundsvall catchment of 8.2 ha is located on the waterfront in the City of Sundsvall, Sweden and represents a traffic corridor with adjacent mixed green areas (see Figure 2 and Table 2). The catchment was instrumented in 2020 for studying the biofiltration treatment of stormwater.
Runoff and baseflow: The precipitation input data for runoff calculations were obtained from the SMHI Station Stordalen, Midlanda D, corrected as recommended by SMHI, and the revised value of 799 mm/year was used for runoff calculations by StormTac Web. The runoff formation in the catchment is clearly dominated by the two road subcatchments (Roads 1 and 2), likely contributing more than 90% of the annual runoff. The catchment runoff drains by open drainage towards the lowest point in the catchment, near the intersection of the highway and shoreline, where the stormwater biofiltration facility is located. The facility consists of a small underground basin and a biofilter. The basin serves to balance flows, separate larger sediment particles, skim free oil, and distribute the stormwater inflow laterally into twelve outflow pipes feeding the biofilter.
The biofilter body consisted of three cells, two of which were vegetated and the last one was without any vegetation. The filter was filled with sand-like material to the depth of 0.5 m [21]. The individual cells were separated by a water-tight EPDM membrane, so there was no exchange of water between the individual cells and the groundwater. The sloping area draining toward the biofilter is about 1200 m2, measured from an aerial photo, and the total filter surface area (all cells combined) is 760 m2. The Sundsvall stormwater treatment facility was designed to fully intercept and treat about 95% of annual precipitation. During the remaining greater rainfall events, runoff bypasses the facility via a sewer outlet. Only one of the three biofilter cells was studied in detail, the vegetated cell F1 with the surface area of 230 m2 [21]. The filter material in this cell was enhanced by the addition of CaCO3 in the amount of 10% by weight [21]. Measurements of intra-event concentrations of various pollutants were used in this study to assess the inflow-outflow pollutant concentrations and reduction efficiencies of cell F1.
The inflow to the biofilter was measured by an ultrasound flow meter, with measurement uncertainties of about 5%, and the outflow was measured in a pipe with full-bore flow by an electromagnetic flow meter (uncertainties 3%). Flow-proportional composite stormwater samples were collected by automated samplers, each equipped with 24 1-L plastic bottles. Almost 50 flow-weighted samples were collected during the six rain events monitored during the sampling period from 15 September to 5 December 2020. The characteristics of these events are presented in Table 3. Furthermore, StormTac Web calculations of stormwater in and out concentrations and pollutant reduction efficiencies were performed for average daily traffic (ADT) counts, in both directions, obtained from two sources [21,22]. Such counts were needed to calculate pollutant concentrations in road runoff by the empirical relationships built into the StormTac database (SUSQD).
A relatively short sampling period, covering just the autumn season, contributed to higher uncertainties in extrapolation of this data to the whole year.
Stormwater data measurement errors: The ranges of uncertainties in constituent concentrations, sampled in stormwater and reported in the literature, varied between 10% and 30%, with TSS reported closer to the lower limit [23,24,25]. Constituents primarily transported with solids, or requiring more intricate analytical procedures (e.g., trace metals), were reported as having uncertainties closer to the upper limit [26,27,28]. The uncertainties in analytical laboratory results, indicated in previous stormwater quality studies, were around 20–25% for heavy metal concentrations (e.g., [26,28]). Based on the estimates of measurement errors from the Ladbrodammen catchment and the general estimates of measurement errors listed above, including the laboratory analyses, the following uncertainties in the studied pollutant fluxes were assumed: TP and TSS~20%, Cu~30%, and Zn~40%. Such data were then used in comparisons of measured and calculated data.

4. Results and Discussion

4.1. Characteristics of Stormwater Data Adopted from the StormTac Web Database (SUSQD) for the Test Catchments

In stormwater quality analysis, two types of stormwater/baseflow quality data were needed for the selected four constituents (TP, Cu, Zn, TSS): quality of the drainage effluent at the catchment outlet, contributed by various land use subcatchments, and the changes in such quality data after the effluent passage through the respective stormwater quality controls, a pond or a biofilter. Both types of data were adopted from the latest version of the StormTac Database (SUSQD) accessed in October 2021, and summaries of data characteristics are listed in Supplementary Table S1. These characteristics include typical concentration values, number of datasets (sources of data) for individual land use types in the database, and the general statistics of the combined dataset for individual land uses: the mean, median, standard deviation, coefficient of variation, standard error, and relative standard error.
In most cases, the median concentrations reported for respective land uses were adopted as typical concentrations in the database, except for relatively few cases, in which such concentrations were further adjusted to reflect the properties of a particular data set (e.g., limited data) and replaced by “typical” values. Numbers of individual datasets in the database are particularly important for the land uses generating high runoff contributions, i.e., those with a high runoff generation potential. In the Ladbrodammen catchment, those were the residential, terraced housing, multifamily housing, and downtown areas. For these catchments, the numbers of datasets were n = 93, 5, 14, and 47, respectively. Using the median rather than mean values may be important when dealing with small datasets. The median is less affected by outliers. Finally, the relative standard errors for the four constituents studied varied from 9.5% (the mean value for four constituents) for the largest data set, residential areas, to 33% for meadows (among the smallest sets, on average, n = 4), However, the latter land use produced just about 5% of the catchment runoff in StormTac Web calculations of runoff. In the Sundsvall catchment, there were just two land uses, roads or green areas. For the former, there were on average 54 datasets in the database, and for green areas, just three. The corresponding average relative standard errors were 13% and 25%, respectively.
For the concentration data adopted from the StormTac Database SUSQD, the uncertainties were assumed to be equal to the respective RSEs, which varied between 6% and 48%, for the four constituents studied (see Supplementary Table S1). The following average values were extracted from the SUSQD: TP—20%, Cu—23%, Zn—19%, and TSS—27%. After including the flow measurement uncertainty component (assumed at 20%), the final estimated load uncertainties would be TP 28%, Cu 30%, Zn 28%, and TSS 34%.
Generally, stormwater EMC data are assumed to follow a lognormal distribution [3,6,7,29] and this was the case in this study as well, with the best fit in the case of TP described by the regression coefficient R2 = 0.91, the worst fit with R2 = 0.64 for Cu, see Supplementary Figures S1 and S2, and the remaining two falling between these two values. The latter low R2 value was caused by two high-end outliers. A good fit of the high end of the distribution is particularly important when assessing non-exceedance of high concentrations (e.g., when assessing the compliance with water quality criteria) but less important when dealing with the central part of the distribution for selecting the mean or median concentrations for load estimates, as done in this study.
Studied constituent concentrations vs. land uses: Variations in the studied constituent concentrations in stormwater from the two test catchments are shown in Figure 3, which was derived from the data in the SUSQD. Such concentrations are displayed for the 11 land uses addressed in this study and characterized by the median and mean concentrations (crosses and full circles, respectively) and RSE bands corresponding to mean concentrations.
Two main observations can be inferred from this figure:
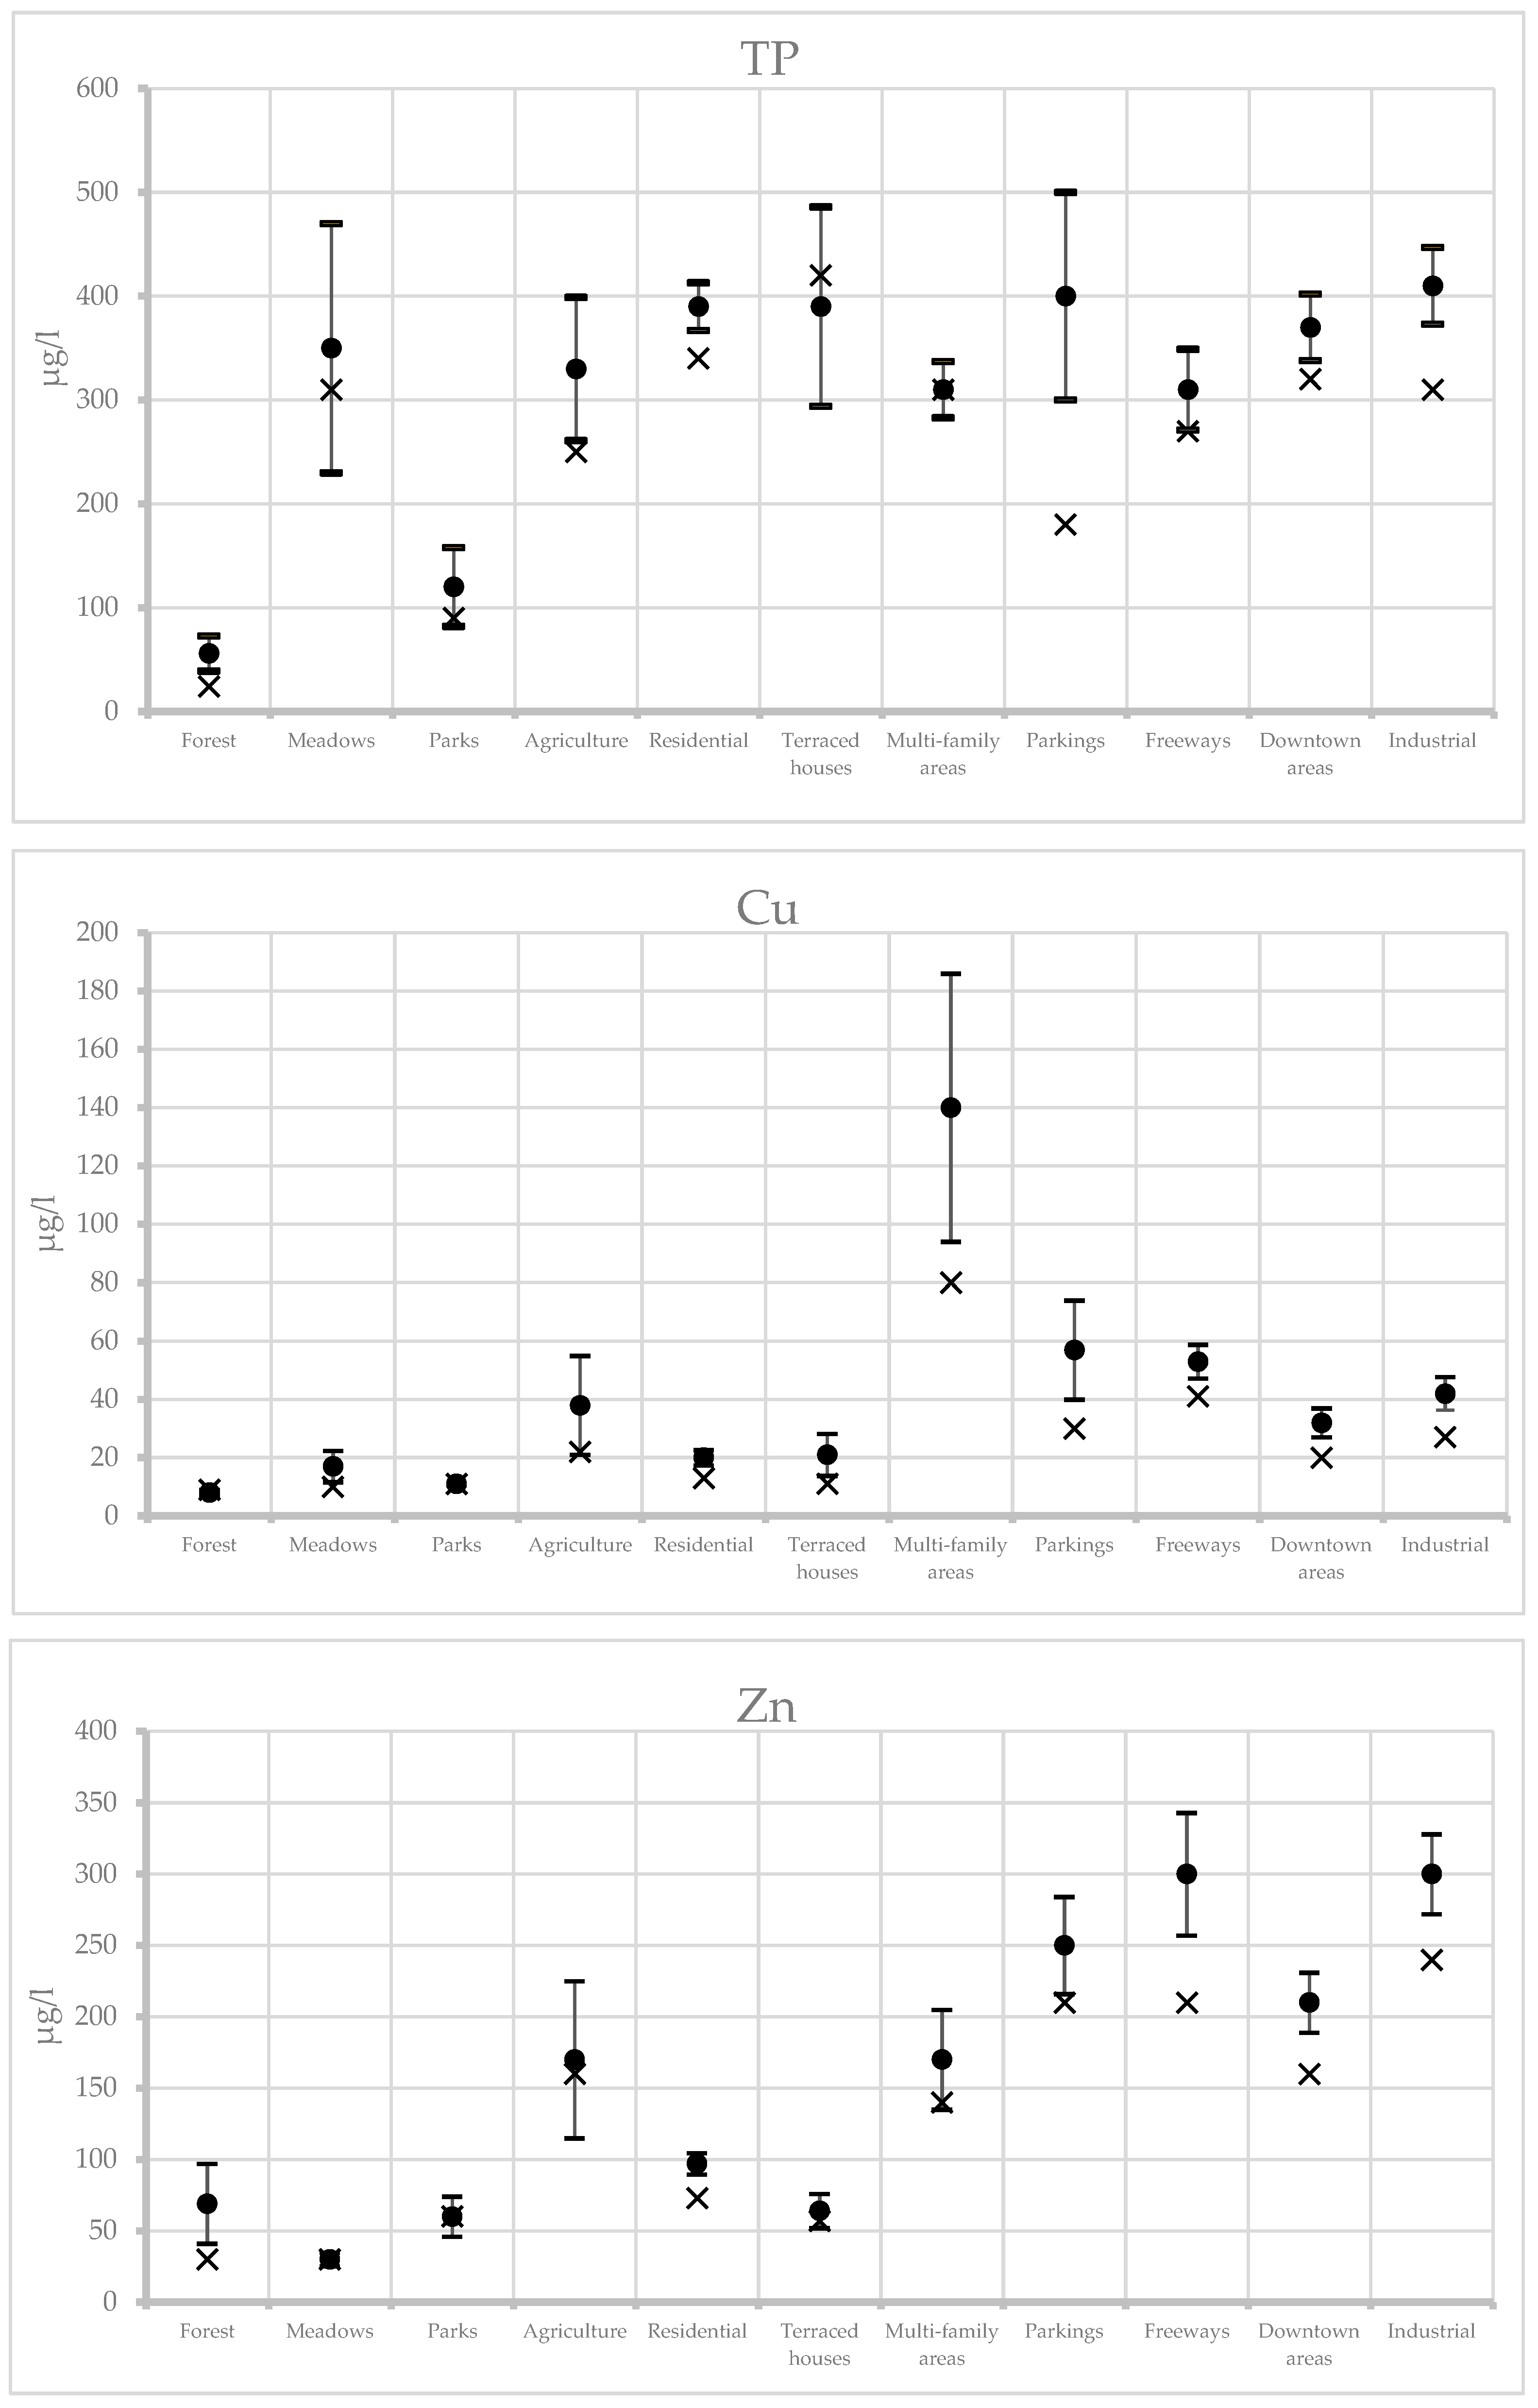
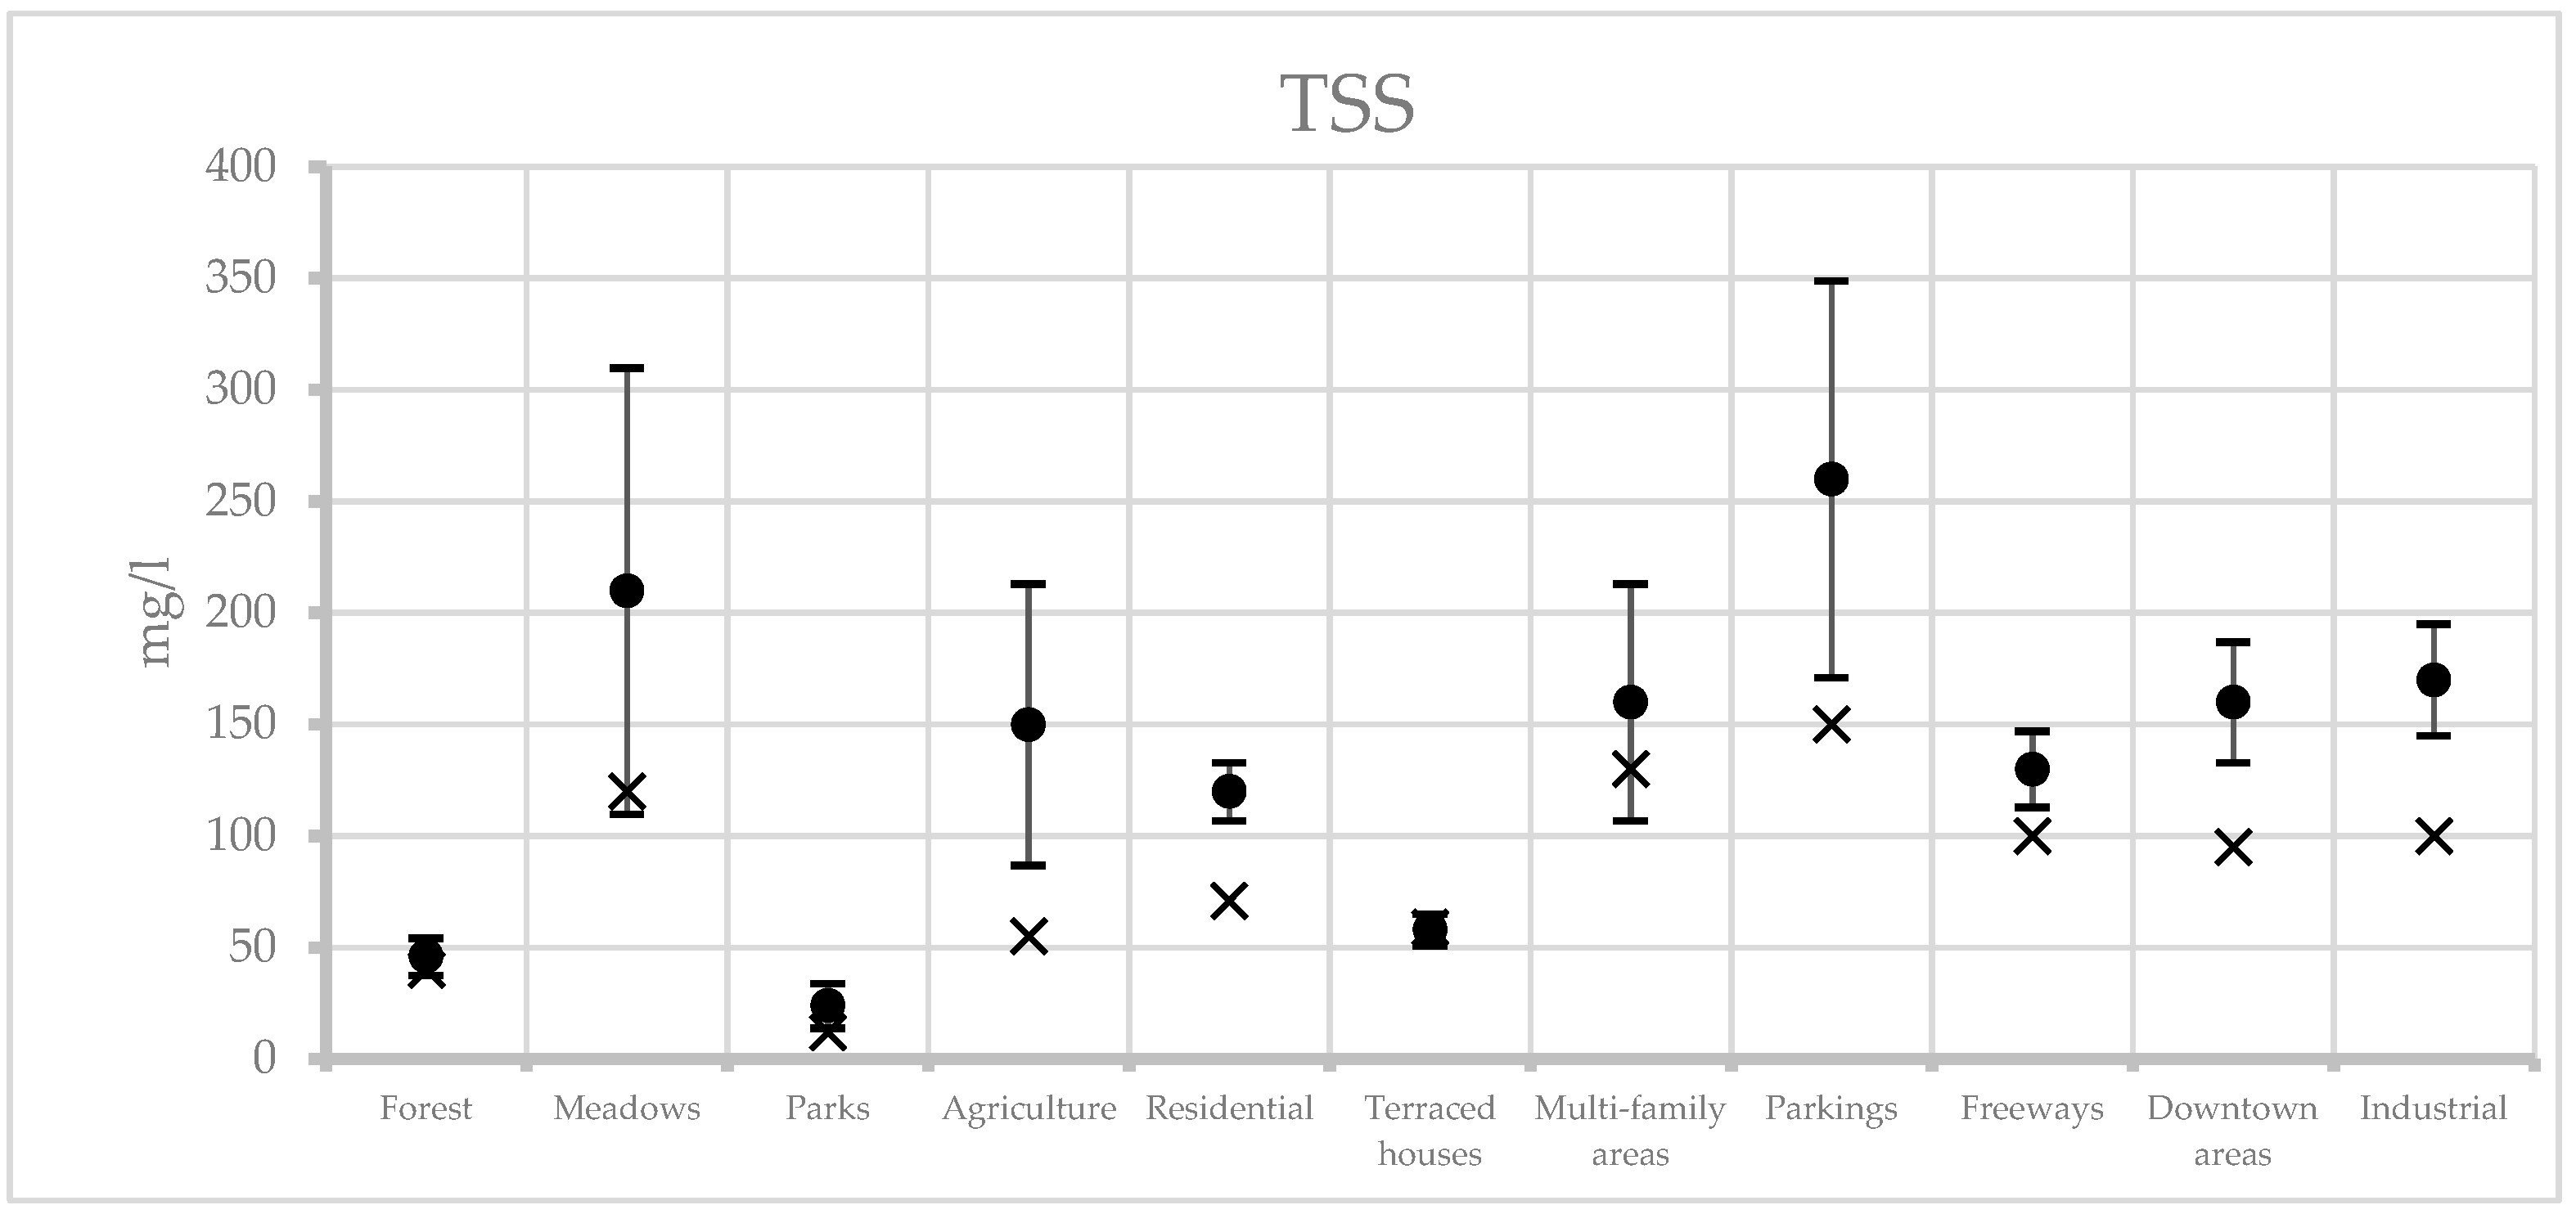
  • Mean concentrations of the water quality constituents varied among the subcatchments with various land uses by about an order of magnitude, as also reported in [30]. Both Cu and Zn concentrations were the highest in runoff from industrial and trafficked areas. When comparing residential areas with various density of development, multifamily areas displayed higher concentrations of Cu and TSS, possibly because of higher traffic, and in the case of Cu, more frequent use of copper roofs, compared to lower density single-family residential areas. The concentrations of Cu and Zn were the lowest in rural or green lands, including forests, meadows, parks, and agricultural lands. On the other hand, the median concentrations of TP were higher in single-family areas with more greenery and a higher use of fertilizers.
  • Among the land uses studied, the RSE band width was the greatest for TP from meadows, terraced housing and parking lots, and smallest for forests and residential land; in the case Cu, the greatest for multifamily housing, smallest in residential areas; for Zn, the greatest in runoff from freeways and agricultural land, smallest in residential areas; and, for TSS, greatest in the parking lots and meadows, the smallest in forests and terraced housing. This was possibly caused by a combination of two factors, low variability of specific constituent concentrations in runoff from those land use areas and a small number of catchments in the database (in some cases, n being as low as 3–4).
For selecting “typical” concentrations for load calculations, from data observed in specific case studies, US EPA [3] recommended to use the mean EMCs. The experience from our study catchments suggests that while the use of the mean is theoretically the best choice, the use of a median may offer a better practical solution for suppressing the effects of outliers in the upper end of the empirical data distribution curves [13]. Generally, the typical concentrations implemented in the StormTac Web model were closer to the median than the mean of data, and the mean concentrations were more often than not higher than the median concentrations (see Figure 3).
Finally, it should be acknowledged that the data in the StormTac Database are not stationary, but change with the addition of new data to the database, particularly in the case of land use/constituent combinations with a limited number of cases in the database (i.e., a low n). This was noted when comparing median/mean concentrations in two consecutive versions of the database. Hence, it is recommended to use the most up to date version of the database.

4.2. Treatment (Reduction) Efficiencies of Stormwater Control Measures (SCMs) in the StormTac Database (SUSQD)

The StormTac Database contains treatment performance data from a fair number of facilities, including 32 biofilters and 51 stormwater ponds, for the constituents studied here (TP, Cu, Zn, and TSS). Basic statistics of such data are summarized in Supplementary Table S3 and a further discussion of such data follows.
Concerning the removal of individual constituents, TP removal by biofilters deviated from the rest of the cases, because the mean reduction value for biofilters was negative (−21%; i.e., not a removal, but production), indicating the leakage of TP from some facilities. Physically, this is possible and may result from the high storage of TP in filter media (soils) of biofilter facilities (possibly indicating lack of maintenance), or the decomposition of plants in wet ponds resulting in leakage of nutrients [17], or measurement uncertainties (note that the facilities may store stormwater and chemicals from a preceding event, which may be displaced by a consecutive event). The median of removal data (37%) offered a likely more realistic value for the biofilter facilities than the mean (−21%). Note that similar issues with a seeming production of constituents in some SCMs were also reported by others in the literature [12].
Notwithstanding the issue with TP removal, the relative pollutant removal uncertainties, assumed equal to RSE of the dataset in Supplementary Table S4, were between 4% and 33% for stormwater ponds (4–12% without TP) and −110–5% (5–27%, without TP) for biofilters. The median values show higher reductions for ponds in the case of TP, Cu, and TSS than for biofilters, but a higher reduction of Zn in biofilters than in ponds. However, such anomalous data should not be used as typical values in actual projects. The calculation of reduction efficiencies requires consideration of additional site-specific parameters, such as the facility area vs. catchment area and inflow pollutant concentrations [15].

4.3. Comparison of Calculated and Measured Stormwater Quality Data

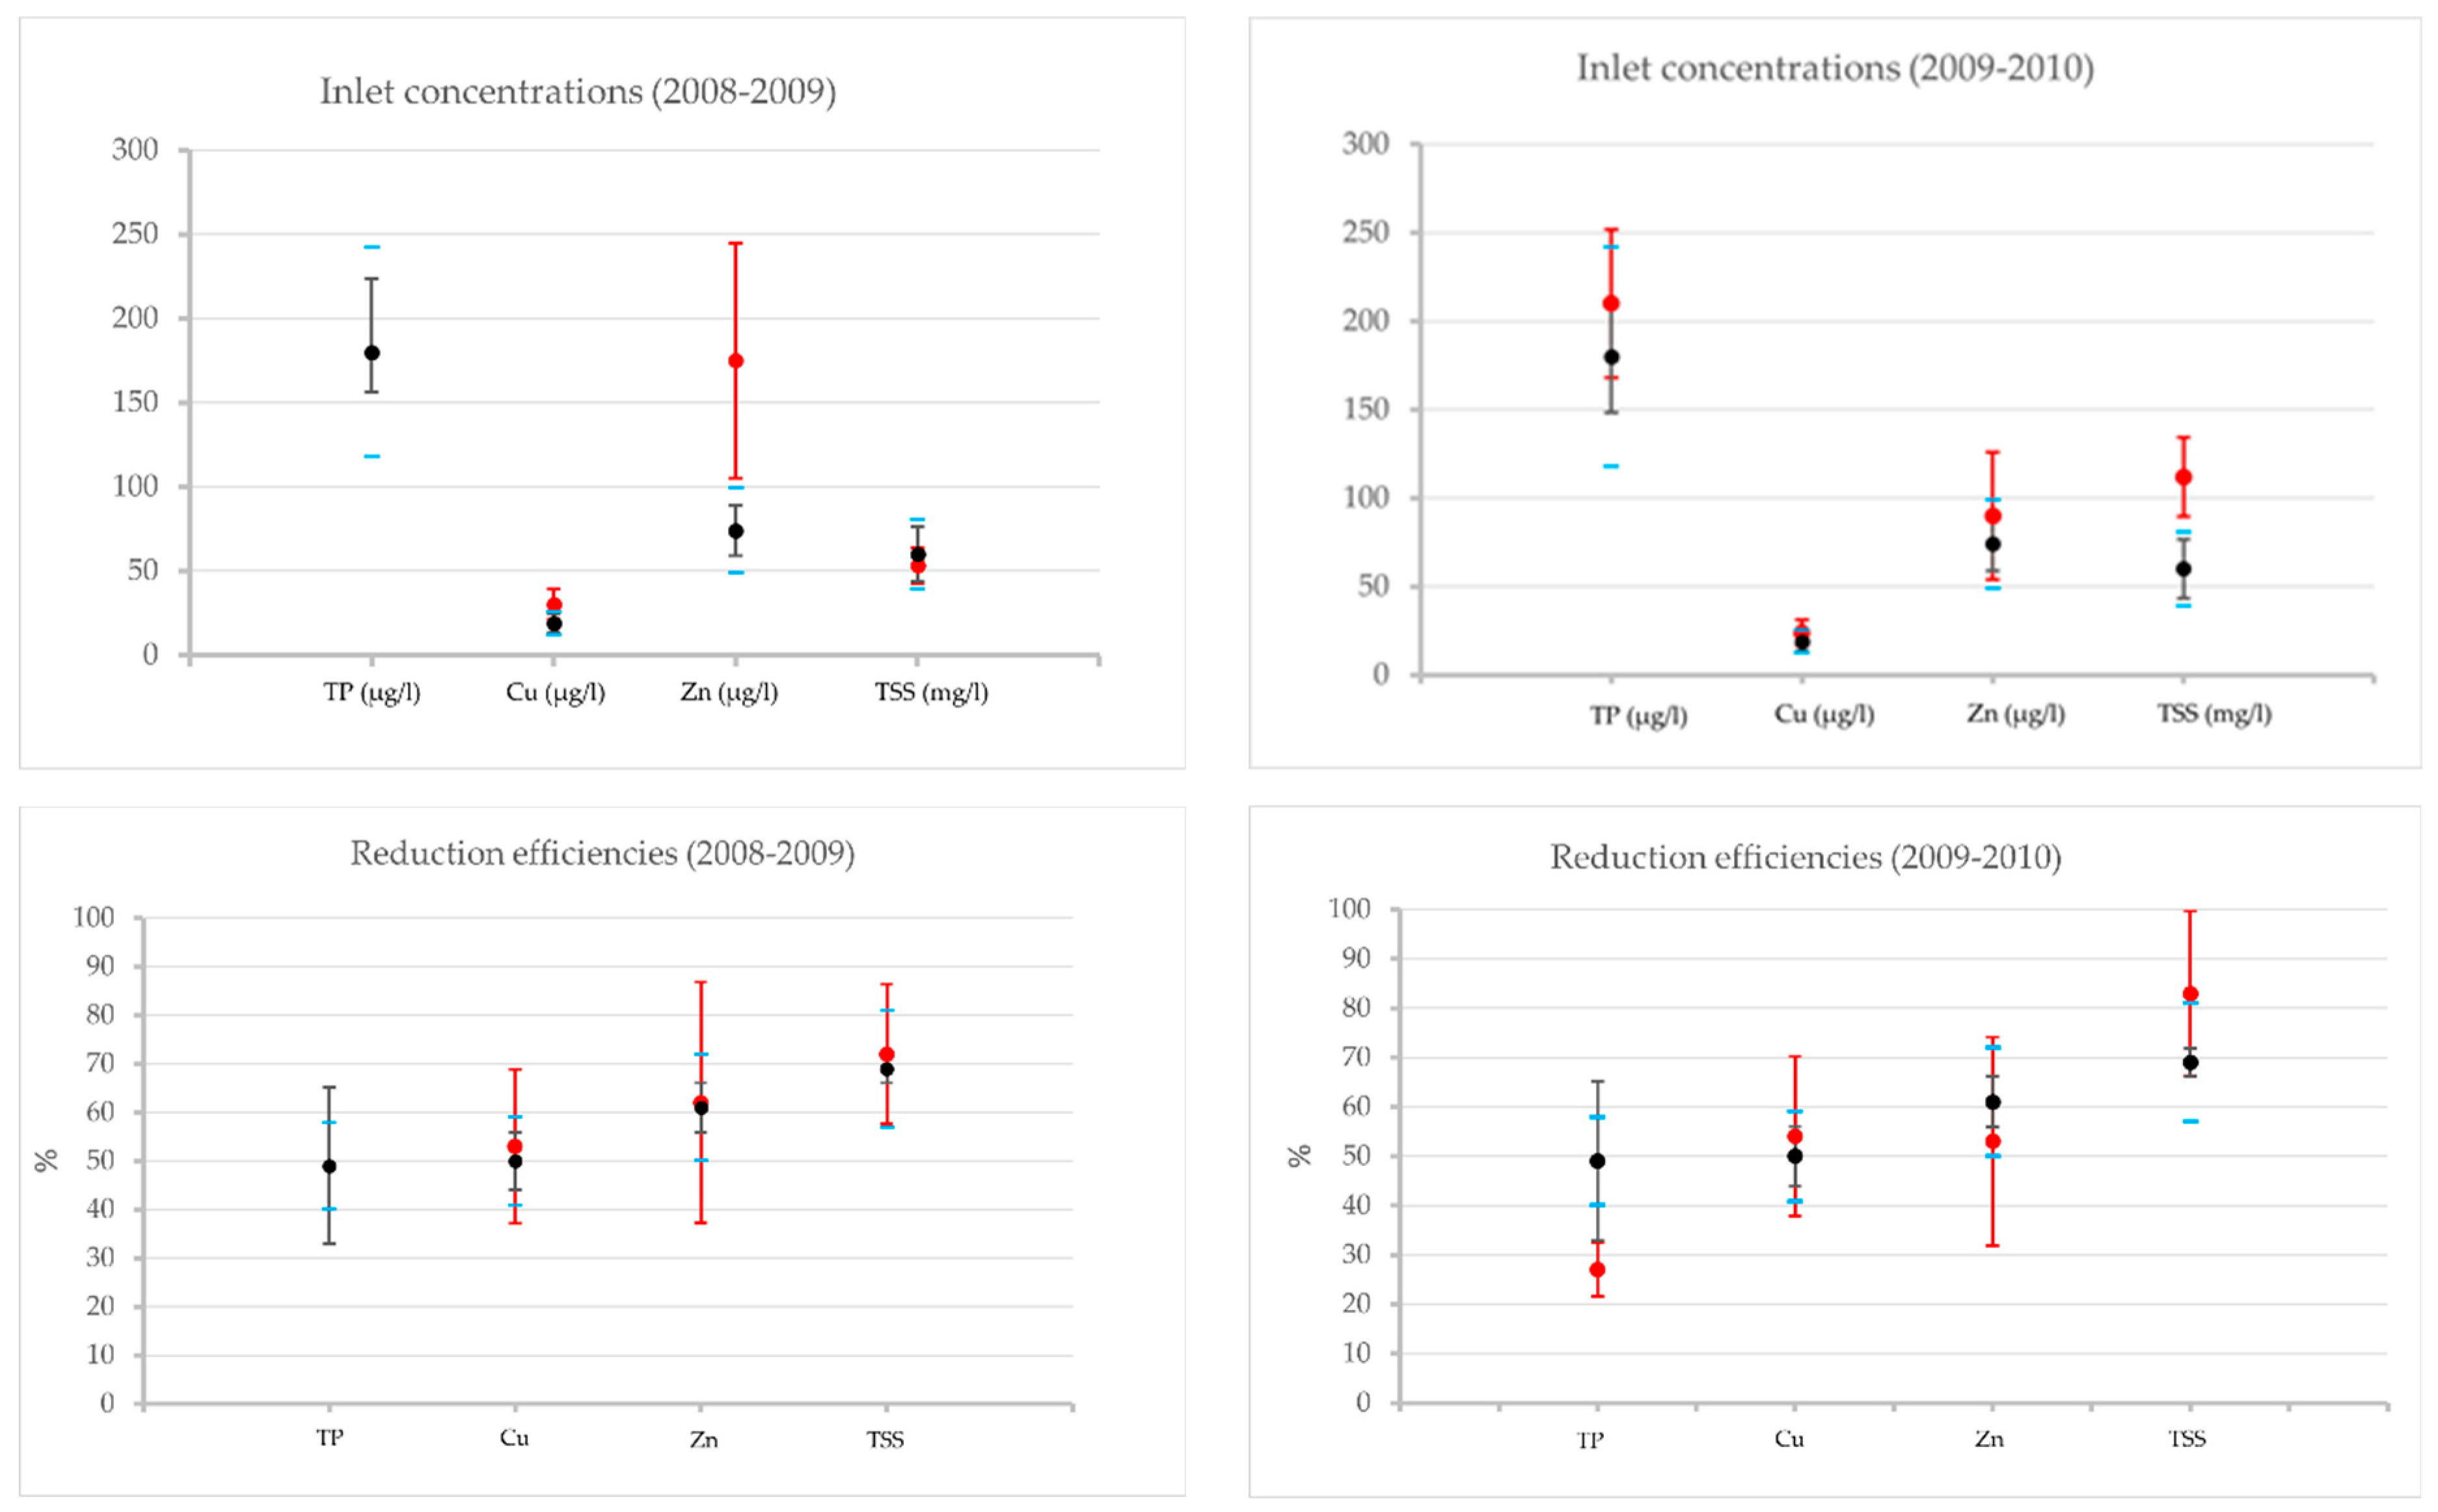
4.3.1. Ladbrodammen Stormwater Detention Pond

Measured and calculated influent and effluent constituent concentrations of the Ladbrodammen pond, collected during two sampling periods, or calculated by StormTac Web, v. 21.3.3, respectively, are presented in Table 4. The influent was a mix of stormwater and baseflow, and the calculations were performed for the mean corrected precipitation from both sampling periods.
The comparison between the calculated and measured mean influent/effluent concentrations in the Ladbrodammen catchment during both monitoring periods indicates that the StormTac Web calculated results were in 11 out of 14 possible combinations smaller than the measured ones, in two cases greater (TSS influent and effluent in the first monitoring period), and in one case equal (Cu in influent in the first monitoring period). For influent concentrations, the average ratio Cin calc/Cin meas was 0.72, with standard deviation of 0.24. Outflow concentrations were also underestimated, with Cut calc/Cout meas = 0.79 and standard deviation of 0.28. It was further noted that the measured influent and effluent concentrations were correlated (Ccor = 0.88). These findings indicate that the Ladbrommen catchment belonged in the StormTac SUSQD database to the environmentally cleaner catchments, producing lower pollution loads than the average catchment in the database. Furthermore, there were notable large differences in the measured influent concentrations and reduction efficiencies between the two periods.
Figure 4 displays calculated mean inflow concentrations and reduction efficiencies with uncertainty bands expressed in concentration units, derived from the calculated RSE (%) in the StormTac database data (black markers). The diagram is complemented with measurements and estimated measurement errors (red markers) and uncertainties calculated by assuming a constant relative uncertainty for all land uses and constituent concentrations in stormwater and baseflow, according to the simplified method described in [10] (short blue dashes).
When comparing the calculated and measured concentrations entering the pond, in five cases, the uncertainty bands of calculated and measured concentrations overlapped, and in the remaining two cases bands were separated by small margins (Zn by 20 µg/L in study 1, and TSS by 20 mg/L in study 2). With the exception of TP removal in Study 1, when calculated removals were higher than those measured, the calculated reduction efficiency uncertainty bands were either within or overlapping those of measured data.

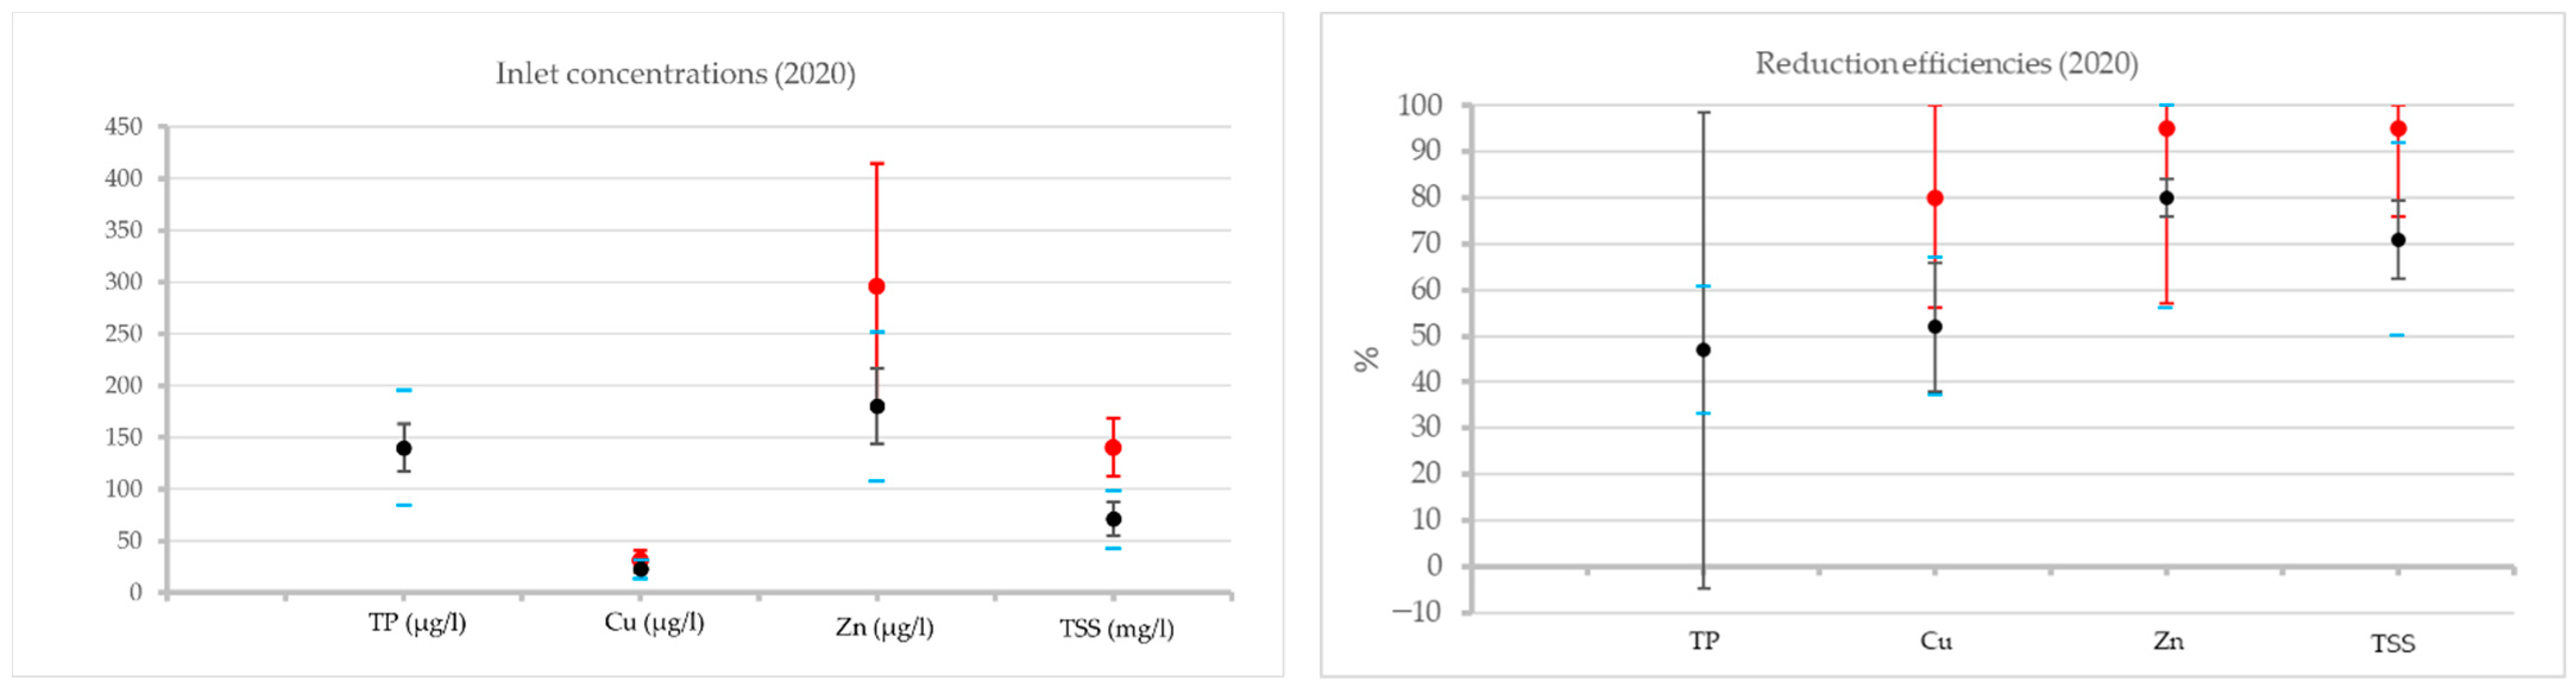
4.3.2. Sundsvall Biofilter

The measured [21] and calculated, by StormTac Web v.21.3.3, influent and effluent constituent concentrations for the Sundsvall biofilter are presented in Table 5.
The comparison between the calculated (black symbols) and measured (red symbols) influent concentrations and REs at the stormwater biofilter in Sundsvall indicates that both the calculated concentrations and REs were lower than those measured for Cu, Zn, and TSS. Consequently, it was of interest to examine whether this result would be affected by consideration of uncertainties in the calculated and measured data, as shown in Figure 5.
In Figure 5, influent constituent concentrations and REs are plotted with three types of uncertainties: (a) uncertainties in the measured influent constituent concentrations, estimated from references on stormwater monitoring (red symbols), (b) uncertainties in StormTac Web-calculated concentrations, assumed as RSE(%) of the data for specific constituents and land use in the SUSQD database (in concentration units; black symbols), and (c) calculated as in (b), but simplified by assuming a constant RSE for all land uses and constituents of interest in the studied catchment, as proposed in [10] (short blue dashes).
When comparing the StormTac Web-calculated and the measured influent concentrations, for Cu, Zn, and TSS, the measured values clearly exceed those calculated with StormTac Web for Zn and TSS and just marginally those for Cu. Consideration of data uncertainty only reduced but did not eliminate the probable differences between the calculated and measured data. Such differences were likely caused by the nature of the Sundsvall catchment, which represents a highway corridor with potentially high loads of Cu, Zn, and TSS in road runoff, and some adjacent green areas, which barely affect the catchment runoff and its quality. As further demonstrated in Figure 6 and discussed below, the data set in the SUSQD contains some older (before 2000) low Zn concentrations, particularly for low ADTs, and such data biases the concentration curve towards the lower calculated values.
The calculated Zn influent concentration (the mean of ≈180 µg/L) is about 60% of the mean measured value of ≈300 µg/L (individual samples ranged from 180 to 550 µg/L). The calculated Zn concentration was obtained by considering the road runoff and green area runoff concentrations using an empirical equation in the form: CZn = K1 · (ADT) + K2, where K1, K2 are fitted empirical constants, and ADT is the average annual daily traffic (Figure 6). The newly employed function for calculating road runoff concentrations of Zn was based only on experimental data collected in 2000 and later and fitted better that data (R2 = 0.84) than a function fitted to all the data in the database (R2 = 0.63). Furthermore, it was noted that there are high uncertainties in Zn concentrations for traffic intensities encountered in our study, around 7000–13,000 vehicles/day, marked as 7–13 (×103) on the x-axis. The recalculated road runoff concentrations were around 100–170 µg/L. The median 270 µg/L and mean 310 µg/L values for all roads (including those with unknown ADT) are within the measured concentrations, as shown in Supplementary Table S1. The employed function yields lower concentrations for local roads with low ADTs compared to higher concentrations for highways with high ADTs, with a different fit of the data for different constituents and depending on whether all or just some data from the database are used. Other factors also affect the Zn concentrations and their uncertainties, which exceeded those for Cu and TSS.
The underestimation of calculated REs of the biofilter can be explained by the nature of the Sundsvall facility, which is an advanced biofiltration system designed in a PhD research project and enhanced by the addition of calcium carbonate to the filter media [21]. Hence, one would expect that such a facility will perform better than indicated by the SUSQD dataset produced by compilation of Cu, Zn, and TSS data from 32–44 facilities built during the past 30 years or so.

4.4. Feasibility and Limitations of the Proposed Data-Based Approach to Stormwater Quality Analysis

From the data compiled in the StormTac Database and in the literature [4,30], the use of typical land-use stormwater pollutant concentrations and volumetric runoff coefficients for the calculation of mean annual stormwater characteristics and pollutant loads is a workable method, as long as the user is aware of the inherent method limitations [4]. Ultimately, such data can be used as a basis for designing stormwater management facilities for controlling pollutant loads. In many engineering projects addressing stormwater quality analysis and calculations, there is a dearth of available data that could be used as inputs to complex modelling tools and such data cannot be collected for planned (yet to be built) designs and their alternatives. Under such circumstances, it is argued here that LCMMs, such as StormTac Web, can be gainfully used with relatively simple input data, such as land use and the associated areas. This approach is also exposed to some limitations that need to be addressed in specific projects: (a) Lack of data, including reliable stormwater quality data for uncommon land uses and stormwater quality constituents, data on baseflow quality for various land uses, and annual baseflow data needed for estimating RSEs for infiltration and volumetric runoff coefficients. (b) Differences in stormwater quality and performance of quality control subsets from various time periods, reflecting the evolution of urban environmental practices, and data collection and stormwater treatment technologies (demonstrated here in the Sundsvall catchment for Zn in road runoff and the refinement of biofilter design). (c) Suppression of potential acute effects of stormwater pollutants by focus on concentrations, loads, and flows averaged over extended time periods (typically one year). The user needs to assess whether these limitations can be accepted under specific project conditions.

5. Conclusions

The StormTac Web model, supplemented by the StormTac Database (SUSQD), was applied to two urban catchments drained by storm sewers and equipped with end-of-pipe stormwater controls. The first catchment, Ladbrodammen, represented a residential area of 201 ha with a typical mix of land uses and a stormwater pond at the downstream end. The second catchment, in Sundsvall, was an 8.2 ha part of traffic corridor with two land uses, namely sections of two highways and adjacent green areas. Runoff from the catchment was treated by a biofilter. In both cases, the quality of stormwater draining from the catchment and leaving the treatment facility was characterized by four constituents, calculated by means of the StormTac Web model, and the results were compared against the measured data. The model and its database facilitated the quick calculation of constituent concentrations and loads and reduction efficiencies of the pond and biofilter. Furthermore, uncertainties in both constituent concentrations and loads could be quickly assessed by the demonstrated method assuming the concentration uncertainties equal to relative standard errors in the respective constituents in the StormTac Database. For loads, the uncertainty combines two components, namely the flow component (assumed as 0.2) and the concentration component. Generally, the calculated concentrations and reduction efficiencies were smaller than the measured data, but considerations of uncertainties reduced such differences, which were attributed to changes and trends in environmental practices, stormwater monitoring and treatment not fully reflected by the StormTac database. The demonstrated data-driven approach, implemented in the framework of StormTac Web and the associated database, has been found to be a practical tool facilitating stormwater quality analysis and pollution control in urban catchments.

Supplementary Materials

The following are available online at https://www.mdpi.com/article/10.3390/su14052888/s1, Figure S1: Lognormal distribution of phosphorus (TP) concentrations from the StormTac Database, for residential land use, Figure S2: Lognormal distribution fitted to copper (Cu) concentrations from the StormTac Database (residential land use), Table S1: Stormwater concentrations (µg/L) and statistics for different land uses considered in the case studies, Table S2: Baseflow concentrations (µg/L) and statistics for different land uses considered in the case studies, Table S3: Reduction efficiencies (%) and statistics of different facilities used in the case study, Table S4: Rain depth (mm) and passed water volume (m3) from Ladbrodammen per sampling period during 2008-05-08 to 2008-05-20, Table S5: Rain depth (mm) from Ladbrodammen during the sampling period 2009-05-07 to 2010-08-31, two samples/month.

Author Contributions

Conceptualization, T.L., A.W., J.M. and M.V.; methodology, T.L. and A.W.; validation, T.L., A.W. and J.M.; formal analysis, T.L. and A.W.; investigation, T.L. and A.W.; resources, T.L. and M.V.; data curation, T.L. and A.W.; writing, T.L., A.W. and J.M.; original draft preparation, T.L. and A.W.; writing, review and editing, T.L., A.W., J.M. and M.V.; project administration, T.L.; funding acquisition, T.L. All authors have read and agreed to the published version of the manuscript.

Funding

This work was supported by DRIZZLE Centre for Stormwater Management, funded by Swedish Governmental Agency for Innovation Systems (Vinnova), Grant no. 2016-05176.

Institutional Review Board Statement

Not applicable.

Informed Consent Statement

Not applicable.

Data Availability Statement

The StormTac Database is a proprietary web application, requiring a license for full access to all the data, but much of the data, including the most comprehensive stormwater concentration data, are publicly available at StormTac Website [14] and at http://data.stormtac.com/ (accessed on 13 October 2021). The database includes also some baseflow concentrations for a few land uses, see Supplementary Table S2. More data from the two case studies can be found by downloading the reports [19,20,21].

Conflicts of Interest

No potential conflict of interest was reported by the author(s).

References

  1. Mashayekhi, H. Integrated Stormwater Management, Rules & Regulations. In A White Paper Prepared for the Canadian Water Network Research Project: “An Integrated Risk Management Framework for Municipal Water Systems”; The W Booth School of Engineering Practice, McMaster University: Hamilton, ON, Canada, 2015; Available online: https://cvc.ca/wp-content/uploads/2016/09/Appendix-I-Integrated-SWMRules-and-Regulations.pdf (accessed on 4 January 2022).
  2. Taguchi, V.J.; Weiss, P.T.; Gulliver, J.S.; Klein, M.R.; Hozalski, R.M.; Baker, L.A.; Finlay, J.C.; Keeler, B.; Nieber, J.L. It is not easy being green: Recognizing unintended consequences of green stormwater infrastructure. Water 2020, 12, 522. [Google Scholar] [CrossRef] [Green Version]
  3. USEPA. Results of the Nationwide Urban Runoff Program; United States Environmental Protection Agency (USEPA), Water Planning Div.: Washington, DC, USA, 1983.
  4. Chandler, R.D. Estimating Annual Urban Nonpoint Pollutant Loads. J. Manag. Eng. 1994, 10, 50–59. [Google Scholar] [CrossRef]
  5. Chow, V.T. The log probability law and its engineering applications. Proc. Am. Soc. Civ. Eng. 1954, 80, 1–25. [Google Scholar] [CrossRef]
  6. Van Buren, M.; Watt, W.; Marsalek, J. Application of the log-normal and normal distributions to stormwater quality parameters. Water Res. 1997, 31, 95–104. [Google Scholar] [CrossRef]
  7. Leutnant, D.; Muschalla, D.; Uhl, M. Statistical distribution of TSS event loads from small urban environments. Water 2018, 10, 769. [Google Scholar] [CrossRef] [Green Version]
  8. Gironás, J.; Roesner, L.A.; Rossman, L.A.; Davis, J. A new applications manual for the Storm Water Management Model (SWMM). Environ. Model. Softw. 2010, 25, 813–814. [Google Scholar] [CrossRef]
  9. Larm, T. Watershed-Based Design of Stormwater Treatment Facilities: Model Development and Applications. Ph.D. Thesis, Royal Institute of Technology, Stockholm, Sweden, 2000. [Google Scholar]
  10. Wu, J.; Larm, T.; Wahlsten, A.; Marsalek, J.; Viklander, M. Uncertainty inherent to a conceptual model StormTac Web simulating urban runoff quantity, quality and control. Urban Water J. 2021, 18, 300–309. [Google Scholar] [CrossRef]
  11. Marsalek, J.; Ng, H. Evaluation of pollution loadings from urban nonpoint sources: Methodology and applications. J. Great Lakes Res. 1989, 15, 444–451. [Google Scholar] [CrossRef]
  12. BMP Database. Master BMP Database v.11-17-16. 2018. Available online: www.bmpdatabase.org (accessed on 20 September 2021).
  13. NSQD Database. The National Stormwater Quality Database, Version 4.02. 2015. Available online: https://bmpdatabase.org/national-stormwater-quality-database (accessed on 10 September 2021).
  14. StormTac. StormTac Database. 2021. Available online: http://www.stormtac.com (accessed on 13 October 2021).
  15. Larm, T.; Alm, H. Revised Design Criteria for Stormwater Facilities to Meet Pollution Reduction and Flow Control Requirements, Also considering Predicted Climate Effects. Water Pract. Technol. 2014, 9, 9–19. [Google Scholar] [CrossRef]
  16. Schueler, T.R.; Holland, H.K. Irreducible Pollutant Concentrations Discharged from Stormwater Practices: The Practice of Watershed Protection. Watershed Prot. Tech. 2000, 2, 369–372. [Google Scholar]
  17. Larm, T.; Wahlsten, A. Applying the Parameter “Irreducible Concentration” in Modelling of Stormwater Treatment Facilities. J. Civ. Eng. Archit. 2019, 13, 469–476. [Google Scholar]
  18. Alexandersson, H. Correction of Precipitation According to Simple Climatological Principles; SMHI Report 111; SMHI: Norrköping, Sweden, 2003. (In Swedish)
  19. Andersson, J.; Owenius, S.; Stråe, D. Monitoring of Stormwater Pond in Five Municipalities in The Stockholm Region; Swedish Water, Report No. 2012-02; Swedish Water: Stockholm, Sweden, 2012. (In Swedish) [Google Scholar]
  20. Alm, H.; Banach, A.; Larm, T. The Occurrence and Reduction of Priority Substances, Heavy Metals and Other Substances in Storm Water; Svenskt Vatten AB: Bromma, Sweden, 2010. (In Swedish) [Google Scholar]
  21. Lange, K. Metal and Microplastic Treatment in Stormwater Bioretention. Ph.D. Thesis, Department of Civil, Environmental and Natural Resources Engineering, Division of Architecture and Water, Luleå University of Technology, Luleå, Sweden, 2021. [Google Scholar]
  22. Trafikverket. Online Map with Data of Average Daily Traffic (ADT, Vehicles per Day) for Swedish Roads; Version 1.5.0.3.Vtf.trafikverket.se. 2021. Available online: https://vtf.trafikverket.se/SeTrafikinformation (accessed on 13 October 2021).
  23. Ahyerre, M.; Chebbo, G.; Tassin, B.; Gaume, E. Storm Water Quality Modelling, an Ambitious Objective? Water Sci. Technol. 1998, 37, 205. [Google Scholar] [CrossRef]
  24. Bertrand–Krajewski, J.-L.; Barraud, S.; Bardin, J.-P. Uncertainties, Performance Indicators and Decision Aid Applied to Stormwater Facilities. Urban Water 2002, 4, 163–179. [Google Scholar] [CrossRef]
  25. Harmel, R.D.; Cooper, R.J.; Slade, R.M.; Haney, R.L.; Arnold, J.G. Cumulative Uncertainty in Measured Streamflow and Water Quality Data for Small Watersheds. Trans. ASABE 2006, 49, 689–701. [Google Scholar] [CrossRef]
  26. Karlsson, K.; Viklander, M. Polycyclic Aromatic Hydrocarbons (PAH) in Water and Sediment from Gully Pots. Water Air Soil Pollut. 2008, 188, 271–282. [Google Scholar] [CrossRef]
  27. Francey, M. Characterising Urban Pollutant Loads. Ph.D. Thesis, Department of Civil Engineering, Monash University, Melbourne, Australia, 2010. [Google Scholar]
  28. Karlsson, K.; Viklander, M.; Scholes, L.; Revitt, M. Heavy Metal Concentrations and Toxicity in Water and Sediment from Stormwater Ponds and Sedimentation Tanks. J. Hazard. Mater. 2010, 178, 612–618. [Google Scholar] [CrossRef] [PubMed]
  29. Driscoll, E.D. Methodology for Analysis of Detention Basins for Control of Urban Runoff Quality; Report EPA 440/5-87-001, U.S. EPA; Office of Water, Nonpoint Source Branch: Washington, DC, USA, 1986.
  30. Pitt, R.E.; Maestre, A.; Morquecho, R. The National Stormwater Quality Database (NSQD, Version 1.1). Available online: http://rpitt.eng.ua.edu/research/ms4/paper/MS4%20Feb%2016%202004%20paper.pdf (accessed on 13 October 2021).
Figure 1. Left panel: map of the studied Ladbrodammen catchment. Legend: the pond is colored blue and the catchment boundaries are marked with a white dashed line. Right panel: The map of the pond, the receiving stream Väsbyån (on the left) and the pump house (the bottom-right corner). Orthophoto: Image Landsat Copernicus, Google Earth Pro.
Sustainability 14 02888 g001
Figure 2. Left-hand panel: map of the studied catchment in Sundsvall. The biofilter is marked in light blue and the catchment boundaries are marked with a white dashed line. Right-hand panel: the biofilter cell and the highway bridge to the east. Orthophoto: Image Landsat Copernicus, Google Earth Pro.
Sustainability 14 02888 g002
Figure 3. Variations of constituent concentrations for various land uses occurring in the two test catchments. (Legend: Median (cross symbols), mean (dot symbols), and standard errors of the mean (hyphens)).
Sustainability 14 02888 g003aSustainability 14 02888 g003b
Figure 4. Inflow concentrations (µg/L, or mg/L for TSS) and reduction efficiencies (%) during two sampling periods for the detention pond facility Ladbrodammen in Upplands Väsby.
Sustainability 14 02888 g004
Figure 5. Influent constituent concentrations (in µg/L, except mg/L for TSS) and reduction efficiencies (%), with uncertainties, for the Sundsvall biofilter.
Sustainability 14 02888 g005
Figure 6. Zn concentrations in runoff from roads with various ADT (x1000 vehicles/day) for two groupings of measured data: (a) using all data (blue dots) from the StormTac Database, or (b) using only the data collected in 2000 and later (black dot).
Sustainability 14 02888 g006
Table 1. Area per land use in the Ladbrodammen catchment. Typical volumetric runoff coefficients used in runoff calculations.
Subcatchment
Land Uses, i
Runoff and Groundwater Contributing Areas
A = Ab (ha)
Volumetric Runoff
Coefficients
Runoff Generation Potential (Area ∙ Volumetric Runoff Coefficient [ha]) 1
1Parking lot2.00.801.6
2Residential area250.256.25
3Terraced house area310.329.92
4Multifamily area600.4024.0
5Downtown area100.606.0
6Industrial area3.00.501.5
7Park grounds100.101.0
8Forest land250.153.75
9Agricultural land5.00.261.3
10Meadow land300.103.0
Parameter values for the whole catchmentArea 201 (ha)Area-weighted vol.
runoff coeff. 0.29
Runoff generation potential 58 (ha)
1 Called Reduced area in the StormTac documentation.
Table 2. Characteristics of the Sundsvall catchment: land use distribution and associated volumetric runoff coefficients.
Land Uses, iRunoff and Groundwater Contributing Areas
A = Ab (ha)
Volumetric runoff
Coefficients
Runoff Generation Potential (=Area ∙ Vol. Runoff Coefficient) 2
Road 1 (ADT = 13 000 1)3.10.802.48
Road 2 (ADT = 7 000 1)1.60.801.28
Park grounds2.50.100.25
Meadows1.00.100.10
Parameter values for the whole catchmentArea 8.2 (ha)Area-weighted vol. runoff coeff. 0.50Runoff generation potential 4.1 (ha)
1 Annual daily traffic (vehicle count in both directions), 2 Referred to as the ‘reduced area’ in StormTac documentation.
Table 3. Rain characteristics for the six events sampled and the numbers of collected samples [21]. Reprinted with permission from Ref. [21]. Copyright 2022 Copyright Katharina Lange.
EventDateRain Event Duration [h]Rainfall Depth [mm]Antecedent Dry Period [days] Depth of Rain One Day before the Event [mm]Overflow Duration [min]No. of Samples
115 September 202186.43003
226 September 20211131806012
35 October 202191370610
422 October 20217301705
51 November 2021221800.83012
63 December 2021347.68007
Table 4. Stormwater quality in the Ladbrodammen catchment: Measured and calculated constituent concentrations, and constituent removals (RE) by the pond.
Stormwater Concentrations Measured in Studies 1 and 2Calculated Concentrations
Study 1, 2008–2009 [20]Study 2, 2009–2010 [19]StormTac Web v.21.3.3.
ConstituentConstituent ConcentrationsRE [%] Constituent ConcentrationsRE [%] Constituent ConcentrationsRE [%]
InOutInOutInOut
TP [µg/L]---210150291809249
Cu [µg/L]301453241154199.550
Zn [µg/L]1756662904254742961
TSS [mg/L]53157211219 8360 19 68
- Missing data.
Table 5. Measured and calculated (by StormTac Web) stormwater quality data for the Sundsvall biofilter.
ConstituentMeasured Stormwater Concentrations (2020)RE (%)Stormwater Concentrations Calculated with StormTac WebRE (%)
inoutinout
TP [µg/L]not measurednot measurednot calculated1407447
Cu [µg/L]316.280231152
Zn [µg/L]30014951803680
TSS [mg/L]1406.795712071
Publisher’s Note: MDPI stays neutral with regard to jurisdictional claims in published maps and institutional affiliations.

