Article

Computer Architectures for Incremental Learning in Water Management

1
Artificial Intelligence Laboratory, Jozef Stefan Institute, 1000 Ljubljana, Slovenia
2
Jozef Stefan International Postgraduate School, Jozef Stefan Institute, 1000 Ljubljana, Slovenia
3
Department of Civil Engineering, University of Thessaly, 38221 Volos, Greece
4
Municipal Enterprise for Water Supply and Sewage Treatment of Skiathos, 37002 Skiathos, Greece
5
Ljubljanski Urbanistični Zavod, 1000 Ljubljana, Slovenia
*
Author to whom correspondence should be addressed.
Sustainability 2022, 14(5), 2886; https://doi.org/10.3390/su14052886
Submission received: 26 January 2022 / Revised: 25 February 2022 / Accepted: 27 February 2022 / Published: 2 March 2022
(This article belongs to the Special Issue Sustainability in Water Supply and Smart Water Systems)

Abstract

:
This paper presents an architecture and a platform for processing of water management data in real time. Stakeholders in the domain are faced with the challenge of handling large amounts of incoming sensor data from heterogeneous sources after the digitalization efforts within the sector. Our water management analytical platform (WMAP) is built upon the needs of domain experts (it provides capabilities for offline analysis) and is designed to solve real-world problems (it provides real-time data flow solutions and data-driven predictive analytics) for smart water management. WMAP is expected to contribute significantly to the water management domain, which has not yet acquired the competences to implement extensive data analysis and modeling capabilities in real-world scenarios. The proposed architecture extends existing big data architectures and presents an efficient way of dealing with data-driven modeling in the water management domain. The main improvement is in the speed (online analytics) layer of the architecture, where we introduce heterogeneous data fusion in a set of data streams that provide real-time data-driven modeling and prediction services. Using the proposed architecture, the results illustrate that models built with datasets with richer contextual information and multiple data sources are more accurate and thus more useful.

1. Introduction

During recent decades, the issue of water management has gained great interest due to the constantly growing water demand, the limited availability of global water resources, and the effects of climate change. Decision-makers strive towards utilization of optimal water exploitation regimes, realizing that new approaches need to be adopted in order to optimize the use of water resources. Scientific research, based on the latest technological advancements, seeks to establish reliable, effective, and innovative solutions for integrated water management and water resources preservation. These efforts are reflected in the growing smart water management (SWM) paradigm, empowering a variety of information and communication technology (ICT) methodologies. Wireless sensor networks and communication technologies provide a powerful inventory tool to water operators, enabling them to oversee significant water parameters in real time [1,2]. In fact, basic monitoring of the water-related data can be extended with data analysis techniques to gain deeper understanding of the underlying processes and even further with predictive analytics. This contribution might prove crucial to the challenges of future water management.
Managing water relies on heavy physical infrastructure investments and inherently reactive governing attitudes; thus, decision-making constitutes a challenging task for the operators, especially under the framework of securing systems’ sustainability and resilience. Compared to other disciplines, the water domain has not yet witnessed thorough investigation in terms of bringing together real-time monitoring, big data analysis, and machine learning with advanced control systems and the internet of things (IoT). Scientific research focuses on optimizing individual aspects of the water chain, while only recently it turned to the development of cyber-physical systems towards a holistic and digital-oriented approach to water management. Under this realization, the water management analytical platform (WMAP) brings a multifunctional advanced tool to the table which offers robust solutions in combining multiple types of data inputs and conducting analyses using multiple modeling frameworks, especially when there is a goal of producing near-real-time predictions as the basis of decision-making. Additionally, the ability to monitor and model water systems more accurately and respond more quickly to unexpected changes could provide a basis for adaptive management. The hydro-environment community could benefit from the proposed tool by bringing powerful optimization capabilities to practice and opening a wealth of opportunities for water management practitioners.
In many cases, water distribution networks monitor groundwater and surface water bodies with a variety of sensors. Typical measurements include water level, pressure and flow rate, water quality, etc. Related quantities such as precipitation, temperature, evapotranspiration, pumping water energy, or data emerging from human behavior or remote sensing data are also relevant and are being collected by either water utilities or different environmental agencies [3]. Combining these data enables discovery of causative relations between water demand and demand drivers by means of demographic, socioeconomic, touristic, and infrastructure effectiveness indicators and provides an a priori knowledge on the patterns of water availability and demand [4]. Furthermore, all this knowledge can be used as an input to predictive algorithms and thus, water utilities and municipalities have the opportunity to plan water exploitation better, taking into account a fast-changing environment (mainly due to climate change and population growth). Typical use cases, where users benefit from efficient data-driven analytics, are in prediction of surface or groundwater levels, prediction of water quality parameters, prediction of water demand on household, district or urban levels, predictions of water demand in agriculture, etc. In order to exploit the water management data and implement intelligent solutions, a robust and efficient platform is needed. Some of the required functionalities include: data integration from heterogeneous (streaming) sources, data cleaning, enrichment and fusion, standardization of data access, and data mining and data-driven modeling capabilities that enable batch as well as real-time processing.
In this paper we describe an overall architecture of the WMAP and its integration into a real-world scenario. The presented solution is based on the EU H2020 Water4Cities project [5]. The architecture can ingest large volume of high-velocity data and process it either using online (close to real-time) or batch settings. The outputs of the platform match the needs of the water management stakeholders as identified in Section 2.2. Our main focus is on the online processing. We present data collection, data cleaning, and missing data imputation techniques as well as online contextual heterogeneous data fusion, which enables more accurate predictive analytics. We also introduce stream mining techniques for online processing into water management domain. The latter can effectively address many big data-related issues in an IoT setting. In such a setting, the user is often faced with high-velocity data streams from a large amount of fairly independent sensors. The consequence of the independence is twofold: (1) data streams can be easily processed in parallel (which means that this could be achieved even without the use of modern tools for distributed processing like Apache Hadoop, Spark [6] and others), and (2) stream mining models represent a computationally cheap solution to model the large amounts of data.
The contributions of this paper are as follows. (1) We present a conceptual architecture for WMAP, which we built upon our previous work on the numerous subcomponents. We developed our solution based on lambda [7] and hut [8] architectures. We suggest refinements and particular implementation details of the architectures in order to support the needs of the water domain. (2) Our implementation supports real-world use case integration. The platform provides the complete pipeline for data analysis from its source (sensor, weather forecast, or other human-behavior data) to the final product (i.e., data-driven prediction for groundwater level or household daily water consumption profile). (3) To the best of our knowledge, we have introduced stream mining methods into the water domain. Stream mining techniques improve the computational performance of the pipeline and provide models that are better at adjusting to the changes (concept drift) in the real-time data than traditional batch models. (4) We integrated a solution for heterogeneous sources data fusion in a stream in the architecture, which enables contextual information to be included in the data-driven models and consequently increases the final accuracy of the models.
The paper is structured as follows. In Section 2.1 we present the relevant related work and explain the benefits of our approach. In Section 2.2 we present typical water domain use cases and corresponding data types. In Section 2.3 we present the architecture, which is able to handle the previously identified data and its integration into a real-world system. We proceed by presenting particular components within the architecture and corresponding results in Section 3 and finally we conclude in Section 4, where we also provide insights into the future challenges.

2. Materials and Methods

2.1. Related Work

The literature proposes a couple of architectures that are suitable for big data processing within the internet of things (IoT) applications. The lambda architecture was proposed by Marz and Warren [7]. The architecture includes two independent pillars for big data processing, the batched processing (batch layer) and the stream processing (speed layer). The serving layer presents a view of the results. The hut architecture [8] extends the lambda architecture by formalizing the data acquisition and message distribution (broker) components on the one hand and reduces the generic nature of the speed layer on the other. It reduces real-time processing to event processing, by which we lose the potential for real-time machine learning techniques. We propose two adjustments to the existing architectures: (1) We propose a concrete framework for realization of the speed layer in the lambda architecture which will serve the needs of water management domain. (2) We propose the extension of the hut architecture with real-time machine learning components within the speed layer (in contrast to only event processing, based on the rules generated in the batch layer). Additionally, we propose the existing hut architecture’s principle to deploy models learnt in the batch layer to the speed layer, where predictions are generated on real-time data. Stream mining is a well-researched topic [9]; however, it lacks real-world applications [10]. Many incremental learning algorithms exist. Among them are methods that are based on stochastic gradient descent like recursive linear regression, support vector machines, and neural networks [11], methods based on decision and model trees and their ensembles [12] (i.e., streaming random forests) and incremental deep learning [13]. Many well-known platforms that enable large scale analytics (Apache Spark, Samza, and Flink), which are used in production systems, still lack implementations of more complex stream mining algorithms. Among platforms that do enable incremental learning techniques we can find academy-oriented frameworks such as MOA [14], scikit multiflow [15], and other smaller projects dedicated to a single algorithm only. The infrastructure is sufficient, but a unified production-oriented framework for stream machine learning techniques is needed. We have based our work on QMiner [16], which has been successfully deployed in many industry-grade use cases (from energy management to world news monitoring to anomaly detection in large computer clusters).
Our main contribution is related to the inclusion of advanced heterogeneous data fusion in the streaming setting. To the best of our knowledge, our methodology [17] is the only one that deals with data fusion in an online scenario. A similar platform, IoT streaming data integration (ISDI) [18], also solves real-time data integration using the generic window-based algorithm paradigm. The platform deals with the time alignment issues and inherent heterogeneity of the incoming streaming data; however, it solves the issue of data fusion with a batched algorithm on top of a relational database. Other methodologies are mainly focused on solving non-heterogeneous sensor fusion, which is not suitable for solving problems in environmental data-driven modeling [17]. The issue has gained a lot of attention from the scientific community in recent years.
In the water domain, the research focus on data analytics ICT systems is spread among various topics. Research has identified the potential of artificial intelligence techniques for deepening the understanding of the acquired IoT data and for aiding decision-making processes. Various architectures and functionalities have already been researched in several areas of water management [19]. For instance, ref. [20] introduces a case study where they deploy an IoT-enabled platform in order to gather data for precision agriculture and ecological monitoring. In another case, ref. [21] presents a web-based platform for water efficient households. The platform enables consumers to monitor and control the water and energy consumption of their households in real time. From a hydrological perspective, a global web-based catchment area (river basin or urban subcatchment area for rainwater) hydrological information platform allows both scientists and non-expert users to easily access and visualize hydrological information for local-level water management and water stewardship in catchments [22]. Although the aforementioned ICT platforms provide advanced and innovative features for water management, their design does not favor easy adaptation to other uses. Their main drawback is the lack of support for standardized data exchange protocols, while they also need to address connectivity with additional data analytics tools. Our platform (WMAP) is implemented as an integrated support tool that has the potential to adjust to different stakeholders’ needs, combining fast data acquisition, data fusion capabilities, and low-computational stream mining methods.
On a conceptual level, the usefulness of a big data analytics platform for groundwater management has been recognized by the Southern African Development Community [23].

2.2. Typical Use Cases and Data Description

There is a great range of typical scenarios where ICT systems have the potential to improve efficiency and facilitate critical decision-making in the water domain. Precision irrigation, optimization of water distribution networks, preservation of environmental flows in lake and river ecosystems [24], prevention of extreme events (floods and droughts) along with water-oriented urban planning, present only a few interesting scenarios. Traditionally, water management has been driven by process-based models focusing on revealing the mechanisms of natural water resources and simulating the operation of water-related infrastructure. Although modeling provides reliable and useful insights in relation to critical parameters of the water cycle, its usability is limited and often fails to produce timely solutions. The complexities and extensive detailing involved in the representation of water processes make the development of process-based models extremely challenging. Some of the major drawbacks arise from issues related to miscalibration, over parameterization, high computational requirements and extensive data preparation, while adapting to changes and capturing hidden system dynamics is often impossible. Data-driven methods, on the other hand, bridge some of the shortcomings of the process-based models by relying heavily upon machine learning methods. This gives them the ability to overcome the (in several cases) unknown physics of the modeled system by exploiting the information implicitly hidden in the data. In agriculture, data analytics can reveal the causal relations between irrigation and crop production and assist with preparation of reasonable and precise irrigation schedules in compliance with environmental and socioeconomic aspects. Furthermore, predicting water availability and demand, detecting anomalies throughout the water distribution system, and raising alarms in case of water quality deterioration present an important added value in urban water management. In terms of lake and river ecosystems management, predictive analytics can allow proactive interventions both in regulating environmental flows and preventing water quality degradation [25]. Floods and droughts, due to their devastating consequences on ecosystems, food supply and economies, present a rather sensitive sector, where the proposed platform could proactively predict such events and reveal the circumstances under which they may take place.
Since water management is often a complex process, encompassing various activities and involving different stakeholders, the optimal use of water resources implies a wide range of actions. Water system monitoring (by in situ sensors or remote sensing) is essential in order to understand the underlying behavior of critical components of the system. Monitoring includes data collection from various sources in (almost) real time. In this paper, we assume that the underlying IoT infrastructure is already in place. Our tools provide a data management and analysis level on top of the sensor layer. Typical data sources in the water domain are (see Table 1):
Collected data can be further analyzed and used for modeling. Data-driven forecasting has the potential to reveal system dynamics and produce meaningful and accurate predictions about the state of crucial system components. Thus, water experts and water operators will have the advantage of obtaining the necessary knowledge to proceed in effective water management plans and secure sustainability of water resources.
Possible scenarios for usage of data-driven modeling are:
  • Providing water security in agriculture (predicting water availability and demand, regulating irrigation schedules, setting sustainable limits on water allocation);
  • Delivering water supply services (predicting supply and demand fluctuations, predicting availability of water resources, securing adequate water quantity and quality, semantic annotation of water demand, detecting anomalies throughout the water distribution network in households or district areas in terms of leakage, theft, etc.) Securing water in aquatic ecosystems (specifying environmental flow regimes to achieve sustainability, identifying water contamination, and regulating the quality);
  • Reducing flood and drought risk (in-time storm water “hot spot” localization by operating early warning systems, constructing efficient flood control infrastructure, predicting drought events and taking the necessary preventive measures);
  • Promoting integrated urban water management (IUWM) (suggesting possible locations of nature-based solution (NBS) interventions, designing land use change allocation, assessing groundwater levels for urban planning extension).
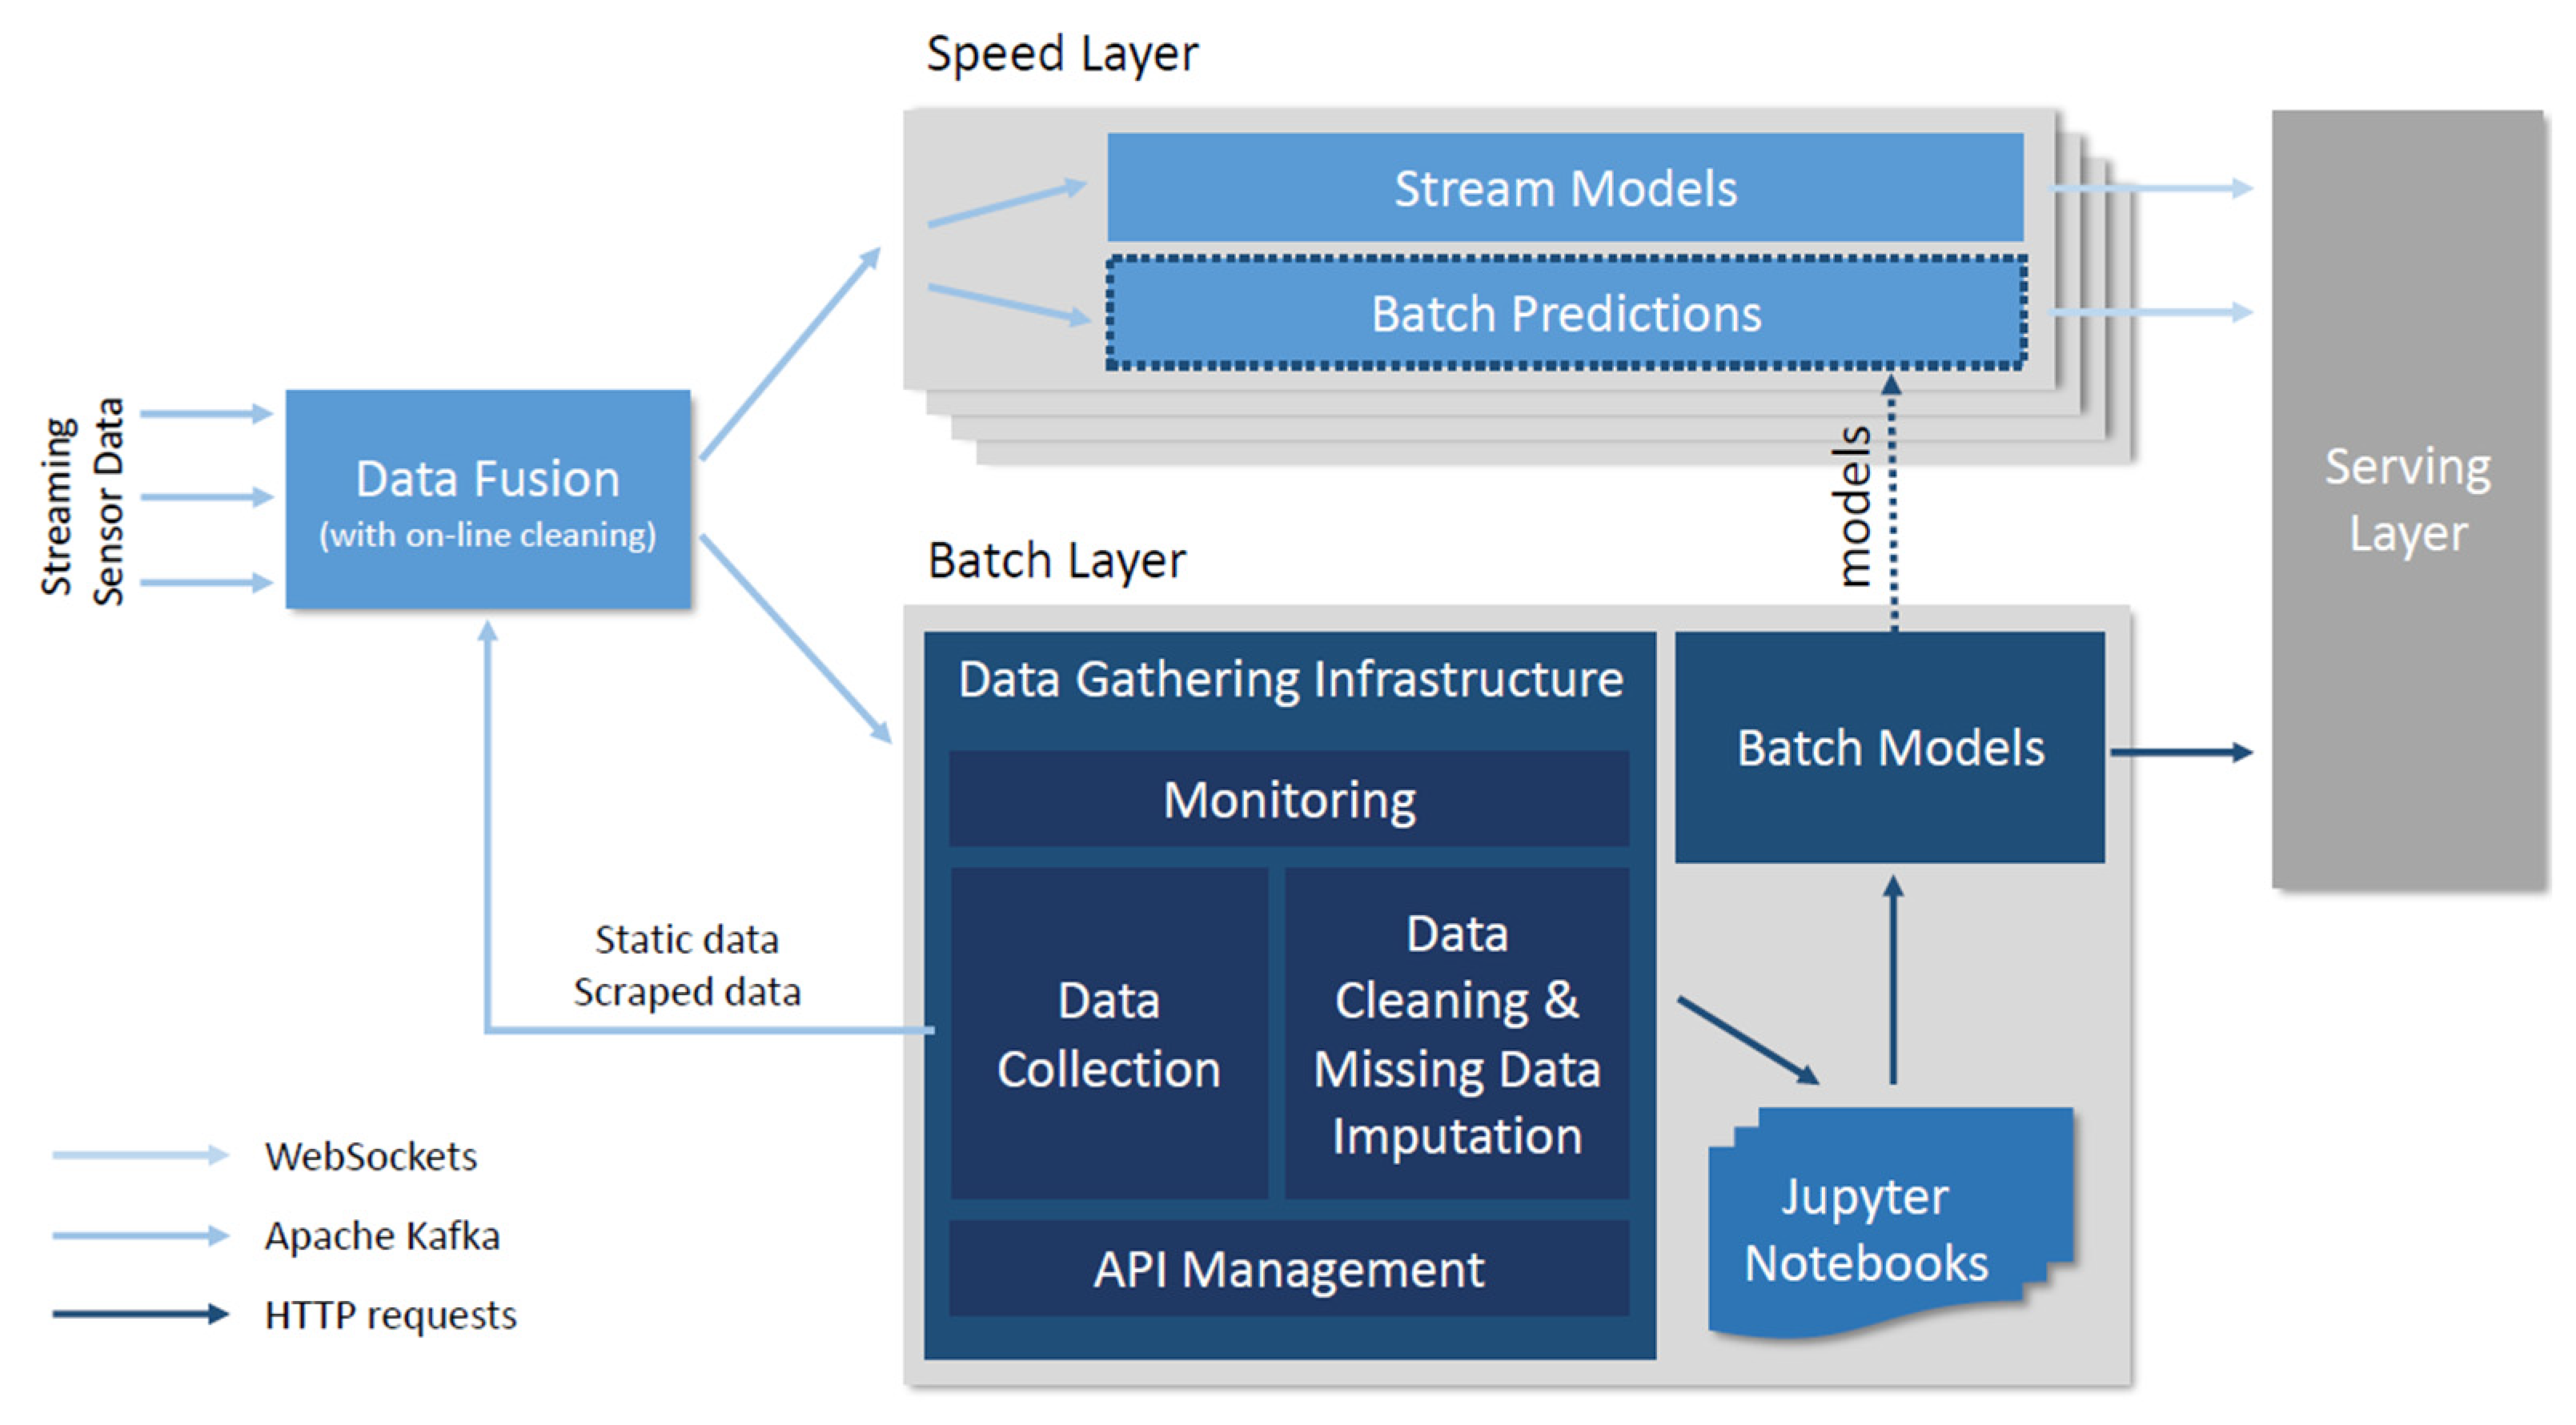
We present two illustrative examples of typical water management use cases.
Example: Island of Skiathos, Greece. Skiathos Island is a typical Greek island with a high touristic influx during the summer, which exceeds its population of 5000 inhabitants. The influx results in a sharp increase in water demand during summer. This, combined with an aged distribution network with high water loss due to leakage, means the island often faces water shortage issues during the touristic peak. The quantity and quality of groundwater, which serves as the island’s water supply, are being increasingly deteriorated; thus, the water operator was forced to take actions towards a more efficient and rational water management plan.
Balancing the water supply by means of water abstraction regulation, effective pressure control schemes, and improvements to ageing infrastructure will help to rationalize the use of the finite water resources. However, the accomplishment of an effective management regime requires a thorough insight in relation to hydrological and hydraulic parameters and other related variables. Aquifer water level, water abstraction rate, pressure throughout the water supply network, seasonal water demand levels, touristic arrivals, weather predictions, etc., are some of the parameters that the water operator needs in order to apply different water supply regimes in accordance with demand [26].
Additionally, in terms of water quality, measurements have shown mercury concentrations above the safety threshold in the groundwater. Thus, water cannot be used for drinking or cooking purposes and people turn to bottled water to cover these needs. Increased mercury concentrations are linked to high salinity in the water; therefore, it becomes important to quantify seawater intrusion, which entails measurements of groundwater level, temperature, and conductivity.
In order to proceed to a smart water monitoring scheme, the operator installed a range of wireless sensors measuring flow, pressure, water level, temperature, and water quality parameters, producing large amounts of real-time data. However, these data are not interoperable, so the water operator is faced with the need to install various different platforms to get access to the data, while any data fusion exercise is an arduous task. From this perspective, Skiathos presents a suitable case for the implementation of our proposed water management analytical platform. The uniform access to the data along with the implementation of data analytics and prediction algorithms will not only serve the efficient real-time data monitoring but will enable new insights into water management planning.
Example: Ljubljana urban region, Slovenia. The goal of the Ljubljana case study is to provide a reference system that will enable integrated urban water management (IUWM). IUWM is based on existing water supply and sanitation principles within an urban area by involving urban water management within the scope of the entire river basin [27]. The conceptual framework and approaches regarding a more efficient IUWM have evolved the past decades to involve new technology solutions, the idea of integration towards the holistic theory, and the public participation through awareness raising and participatory designing. The IUWM system should enable stakeholders to gain deep knowledge of their water systems through the clever visualization of key design parameters, and a valid simulation that will complete and interpolate their information. This way, hidden elements of the urban water cycle will be revealed as well as cause–effect relations. Stakeholders, including citizens, will benefit from optimum and inclusive design. There is a need to build an appropriate system that will enable IUWM decisions on an urban district level.
We found the Ljubljana case study suitable as a reference system because the urban area of the Ljubljana City spreads between two rivers—the Ljubljanica and the Sava rivers, the latter being the main Slovenian river discharging water from the Alpine mountains in the north-west of the country. The urban and agricultural area between the two rivers is where almost 15% of Slovenian inhabitants live and work and the main groundwater resource at the same time. Two recharging components of the Ljubljanskoaquifer, i.e., the local precipitation and infiltrated Sava River, are exposed to different sources of contamination because they originate from different parts of the hydrological circle. The area of the city of Ljubljana has a long history of various flood protection measures. Nevertheless, many parts of the urban area of the city are still heavily threatened by floods, which are a consequence of intensive urbanization, surface run-off increase, as well as climate change effects.
The use of information and communication technologies (ICT) enables IUWM by weighting the measure not only in comparison with comparable measures, but also against other aspects of planning [28]. It is important that any system results are precise enough to enable IUWM decisions (e.g., investments in infrastructure, city master plan rules); therefore, the big river catchment areas need to be sliced into suitable sub–catchment areas on an urban district level. Freshwater, wastewater, and storm water constitute the parts of the urban water cycle, while the urban surface, the aquifer, and water supply infrastructure constitute the linking mediums that intervene in the natural water cycle, forcing an altered, disturbed urban water cycle. The level of disturbance determines the consequences for water availability, water quality, and the regime of flows that with the increase of extreme events may (or already) constitute a severe threat to social integrity, urban infrastructure, the economy, and the natural environment. The architecture should support ingestion of the identified data sources and provide mechanisms to perform the usage scenarios. The interaction of groundwater with other urban systems, such as infrastructure and surface water networks, is well recognized by expert practitioners and is increasingly important to the everyday city agenda [29]. Therefore, the first step towards the IUWM reference system in Ljubljana is presented with groundwater level sensor data.

2.3. Architecture

Lambda [7] and hut [8] architectures provide a solid basis for building the water management analytical platform (WMAP). According to the identified usage scenarios in the water management domain, we propose a couple of modifications which are depicted in the WMAP architecture in Figure 1.
Arrows in the figure depict data flows. Streaming data is handled by Apache Kafka infrastructure in the back end and with Web Sockets (which can be ingested by HTTP clients) in the serving layer. Static data, web resources, and communication within the batch layer are handled with HTTP requests. The data enters the framework directly from sensors (and corresponding adapters) and from data collection in the data gathering infrastructure (from different web resources that need to be polled for the data). All the data undergoes the initial online data cleaning and fusion. The data fusion component is depicted in more detail in Figure 2. This component provides ingestion of different heterogeneous data streams (including different streams from the internet of things, weather forecasts, and static data on human behavior). All these streams are enriched (with different aggregated values of the stream). In the next step, we join the streams together with special attention to their records’ original timestamp. Finally, we compose the feature vectors. Fused (feature vectors) are injected into speed and batch layers and used for predictions of further modeling. Raw data is also pushed into the batch layer for further offline analysis. It is worth noting that we propose the usage of data-driven machine learning models even in the speed layer (we do not limit it to event processing). Technologies like heterogeneous streams data fusion and stream mining provide fast alternatives to traditional data-driven analytics. Finally, results are exposed via the serving layer.
The speed layer consists of two different predictive models: stream models (which are based on incremental learning) and batch predictions, which implement batch models developed in the batch layer. Both components provide similar functionality; however, incremental models are updated with each new measurement whereas batch models need to be updated from the batch layer. As shown in the data description, the uses in water management consist of larger number of contained data-mining problems. Parallelization of the computational tasks in such a setting emerges naturally. Each use (sensor) is independent and requires limited needs for computation power. Therefore, the load can simply be balanced over a set of workers, which are connected by data distribution infrastructure as depicted in Figure 3. The whole streaming pipeline (data fusion and speed layer) is generic and is described in more detail in related work [17].
The batch layer includes data gathering infrastructure (a data layer that can consume, store, and serve large volumes of data according to the specific use, and is able to perform data cleaning and missing data imputation) and batch models with Jupyter Notebooks to support machine learning on top of these data. The aim of the batch models component is twofold: (1) the learned models is fed into the batch predictions component in the speed layer, and (2) data-mining process results are provided from the batch modeling component, which is useful for on-demand processing. The layer also includes monitoring and API management (to handle availability and access to the data).

2.4. Notes on the Implementation of Speed Layer

An illustrative example of the implementation of the speed layer is depicted in Figure 1. Sensor, speed, and serving layers are positioned from left to right. The gray rectangle depicts the data distribution infrastructure, which takes care of transferring streaming data between components. The blue color depicts components and data flow related to sensors (IoT). The green color represents forecasts (i.e., weather forecasts). The yellow color represents static metadata sources. Data fusion components are depicted in purple, and finally the modeling components and its predictions are depicted in brown.
Data are flowing from left to right, originating from sensors or other sources, being infused into appropriate message channels or topics (depicted as circles) in the data distribution infrastructure and then consumed by different instances of fusion components. These components can consume data from the same or from a different set of sensors, forecasts, and static metadata sources. Here the data are enriched, validated, consolidated, and finally merged into viable feature vectors suitable to be consumed by machine learning models. The models (either batch or stream based) consume the data from fusion message channels and provide results to prediction message channels. Multiple models can consume data from the same fusion message channel, meaning that we can easily provide multiple predictions with heterogeneous properties for the same scenario.
There are many viable platforms to be used for message distribution. We have integrated Apache Kafka (https://kafka.apache.org/, accessed on 1 January 2022), which seems to be the favorite choice in terms of performance and functionality, and RabbitMQ (https://www.rabbitmq.com/, accessed on 1 January 2022) in some cases. The data fusion component has been implemented with QMiner (http://qminer.ijs.si, accessed on 1 January 2022), which enables large-scale data analysis and provides methods (stream aggregates) for enrichment and consolidation of the heterogeneous streaming data. Stream models have been implemented using the same framework, but experiments have been performed also with Scikit-multiflow (https://github.com/scikit-multiflow/scikit-multiflow, accessed on 1 January 2022) and MOA (https://moa.cms.waikato.ac.nz/, accessed on 1 January 2022), which offer a larger variety of algorithms. However, none of the platforms for stream learning algorithms has reached the maturity that could enable it to be used in production setups with ease and confidence. Batch modeling has been developed using Python scikit-learn (https://scikit-learn.org/, accessed on 1 January 2022) library.
Particular parts of the platform are described in the Section 3. Every subcomponent of our architecture has been described in a separate paper, which is cited in every subsection below.

3. Results and Discussion

3.1. Data Gathering Infrastructure

Data gathering infrastructure was implemented as part of the batch layer and is depicted in the bottom of Figure 2. The layer is described in more detail in related work [30]. It consisted of a data collection component, which controlled subscribing, polling, and preprocessing of external data sources. The latter can include remote devices, sensors, external data access APIs, and other web resources. A built-in feed monitoring component provided the ability to notify different stakeholders about failures and anomalies in the incoming data streams. The data were stored in a MongoDB NoSQL database. The latter allowed handling of data records with flexible schema. We have identified this as a useful feature, since some feed formats may evolve over time and records from different time intervals may contain different data fields. Additionally, the batch layer offered end users secure and uniform access to the data and easy integration with widely used data analysis tools such as Jupyter Python and R notebooks, Matlab scripts, and others. The data gathering infrastructure could also be used to trigger stream simulations, which are helpful for testing and development of streaming models. Loosely coupled data collection components could be scaled horizontally in order to improve performance.
In Water4Cities scenarios, we have stored the information about groundwater levels, pump sensors, and weather data. Special attention was given to the ease of integration of different data sources by providing boilerplate code in various languages (Python, Java, JavaScript). The platform performance has been proven adequate in the traffic domain, where we retrieved and stored approximately 100,000 records per hour (records include images and heterogeneous sensor data for Slovenia), collecting more than 1.2 TB of data per year. With just this amount of data, we could monitor the whole center of Ljubljana with water smart meters with an update interval of 15 min in every household. As data collection components could be distributed to different machines, the bottleneck was represented by data storage [31]. Even with a single high-end server the authors were able to achieve throughput of 1882 records per second, which is equivalent to 1.6 million records in 15 min. Such a setup would be adequate for the whole Ljubljana region and the database could have been scaled horizontally by adding new machines to balance the system load.

3.2. Missing Data Imputation and Data Cleaning

According to the CRISP-DM methodology [32], the process of data mining is devised into six separate stages. Modeling itself represents only one of these stages and the majority of a data scientist’s work time is invested in a process of understanding and preparing data. Data preparation includes data transformation, data cleaning, missing data imputation, and also data fusion, which is described in Section 3.3. Algorithms for data cleaning and missing data imputation differ significantly between the speed and batch layers. Within the speed layer, the algorithms should be simple and efficient and should rely only on historic data of a time series in question. They should also be autonomous and should not rely on any expert intervention, as the data stream is continuous. We proposed the usage of the Kalman filter’s short-term prediction capabilities in order to address outlier detection (cleaning) and sporadic missing sensor readings in a data stream [33]. In the batch layer it is feasible to use more complex and therefore more effective models that can rely on any data within the dataset and exploit the power of machine learning to find optimal models for missing data imputation as well as for anomaly detection, as described by [34].
An example of the results of the missing data imputation algorithm on a “Ljubljana polje” groundwater levels dataset [35] is depicted in Figure 4. Nearby sensors were used to predict the missing values of another sensor. High accuracy of the methodology suggests that the data from the sensors were reliable. Accuracy of the sensors maintained by Slovenian Environment Agency is ±0.01 m [36].
For groundwater level data in the Ljubljana region, we were able to achieve high R2 > 0.997 scores for highly correlated sensors (correlations up to 0.98) and were able to improve scores significantly for sensors with low correlation to nearby sensors. A more detailed description of the dataset, methodology, and results is given in related work [34].

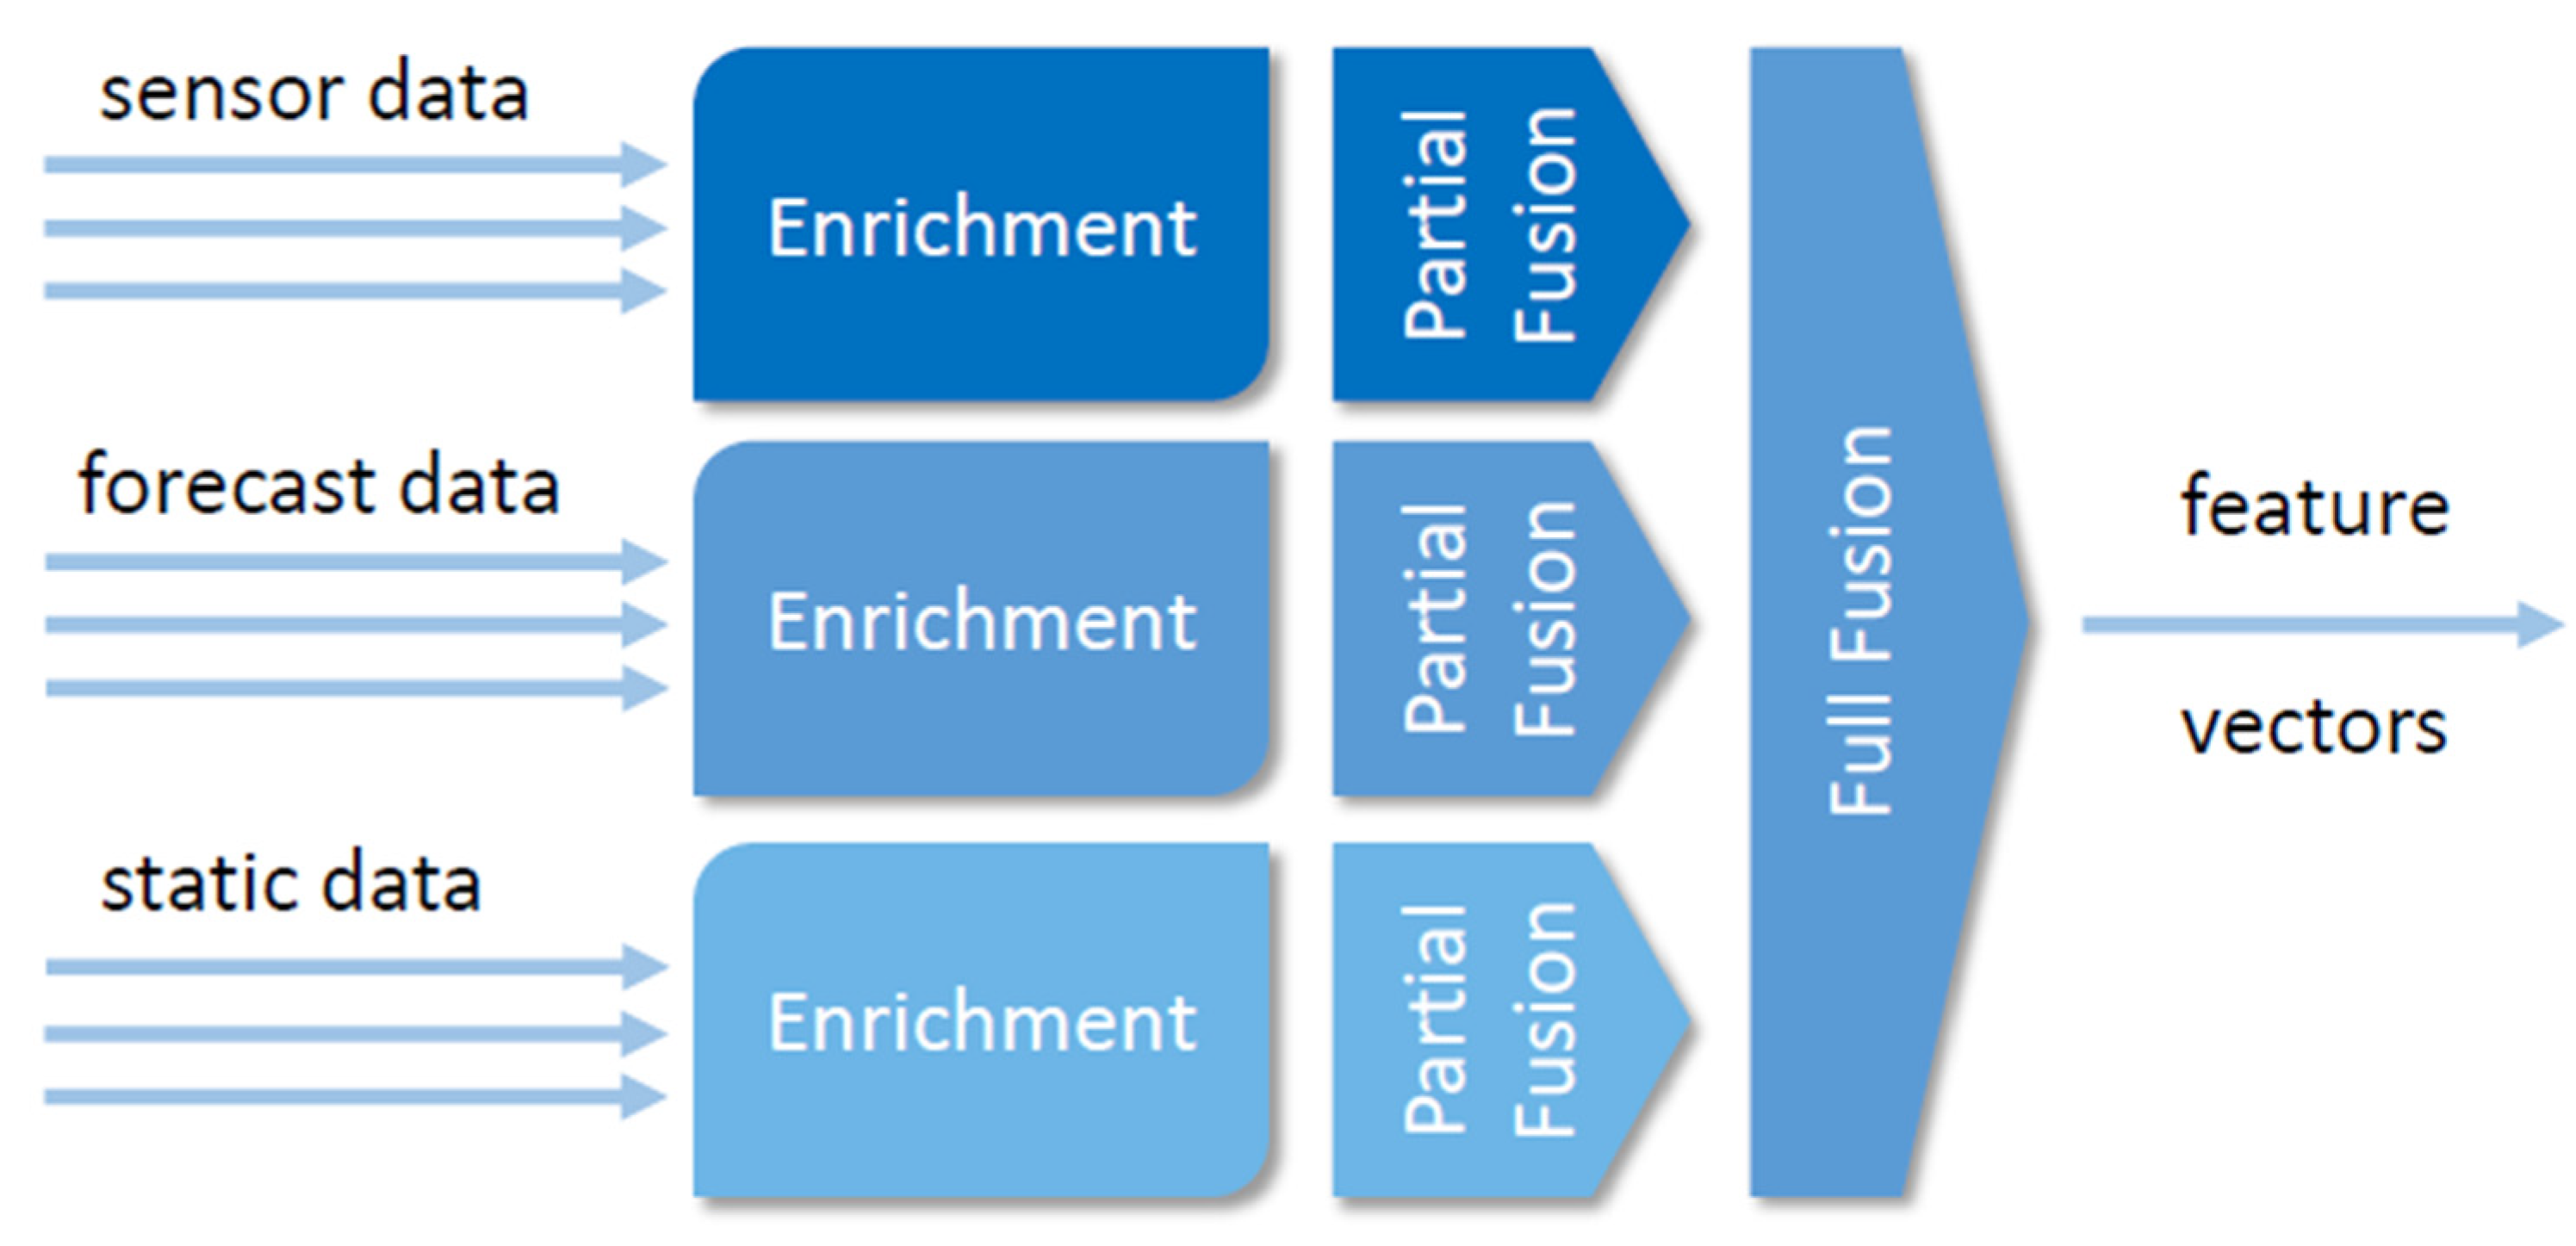
3.3. Real-Time Heterogenous Data Fusion

An intrinsic property of big data is its heterogeneity [37]. In a WMAP system, heterogeneity has been observed regarding data delay (data are submitted via various legacy systems, which bring systematic constant lags, sometimes send data in batches every hour or every day, etc.), data frequency, data type (i.e., weather forecast time series is updated every hour whereas the sensor stream is coherent in regard to its time component). To provide efficient and accurate predictive models, the usage of multiple data sources is essential. Feature vectors that contain additional enriched and contextual data will normally provide additional information to the predictive models and finally result in better prediction accuracies. To the best of our knowledge, our solution [17] is the first to mathematically describe and solve this problem.
The data fusion architecture within the speed layer is depicted in Figure 2. There are three basic tasks to be accomplished within the data fusion: stream enrichment, partial fusion (of sources of the same type), and full fusion. The stream processing component supports ingestion of three different types of streams: sensor data (which might have various frequencies and delays), forecast data (which is being updated regularly, i.e., weather forecasts are updated every hour for the next 48 h), and other contextual and human-behavior data (usually static pre-generated data, which we include as a stream in our platform).
Every data stream was separately transformed (i.e., we transformed weather predictions into a number of regular data streams) and enriched with stream aggregates (i.e., moving averages, variances, minimums, and maximums in different time windows).
Final feature vectors were generated from partial feature vectors within the fusion component, where time consolidation was done. Time consolidation is a process in which we bring all the partial feature vectors to the same master time (we handled delays and different update frequencies here; we also provided constant sampling; i.e., every 15 min a feature vector was generated, which is essential for most machine learning techniques). Finally, the fusion component expands the feature vector with historic data or even some derivatives (i.e., difference between hourly moving averages in the past hour), which often provide viable information to the data models. Final feature vectors are provided to stream or batch models, which calculate final predictions.
To the best of our knowledge, no methodologies described in the scientific literature can match the expressiveness of our system’s feature extraction language and cannot handle heterogeneous streaming data fusion. As argued in the next subsection, such data fusion is beneficial for improved prediction accuracy. There are, however, no direct validation methodologies for data fusion systems, especially not for the online versions’ latencies.
When profiling the pipeline, it is evident that the data fusion system works much faster than the optimal prediction algorithm. On a server machine, the average time to process the message in the online data fusion framework is 0.2 milliseconds (Figure 5). However, a prediction step with the random forest method takes on average 63 milliseconds on a server and 740 milliseconds on Raspberry Pi 2 (Figure 5). It is, therefore, important to have an architecture to be able to parallelize the processes (in our case any number of data fusion, stream models, and batch predictions could be running distributed in the network, reachable by message distribution system). The lesson learned in the performance validation of the system was that the message distribution system (i.e., Apache Kafka) has to be optimized within the network. If not, the bottleneck can be in the message distribution and not necessarily in the processing power.

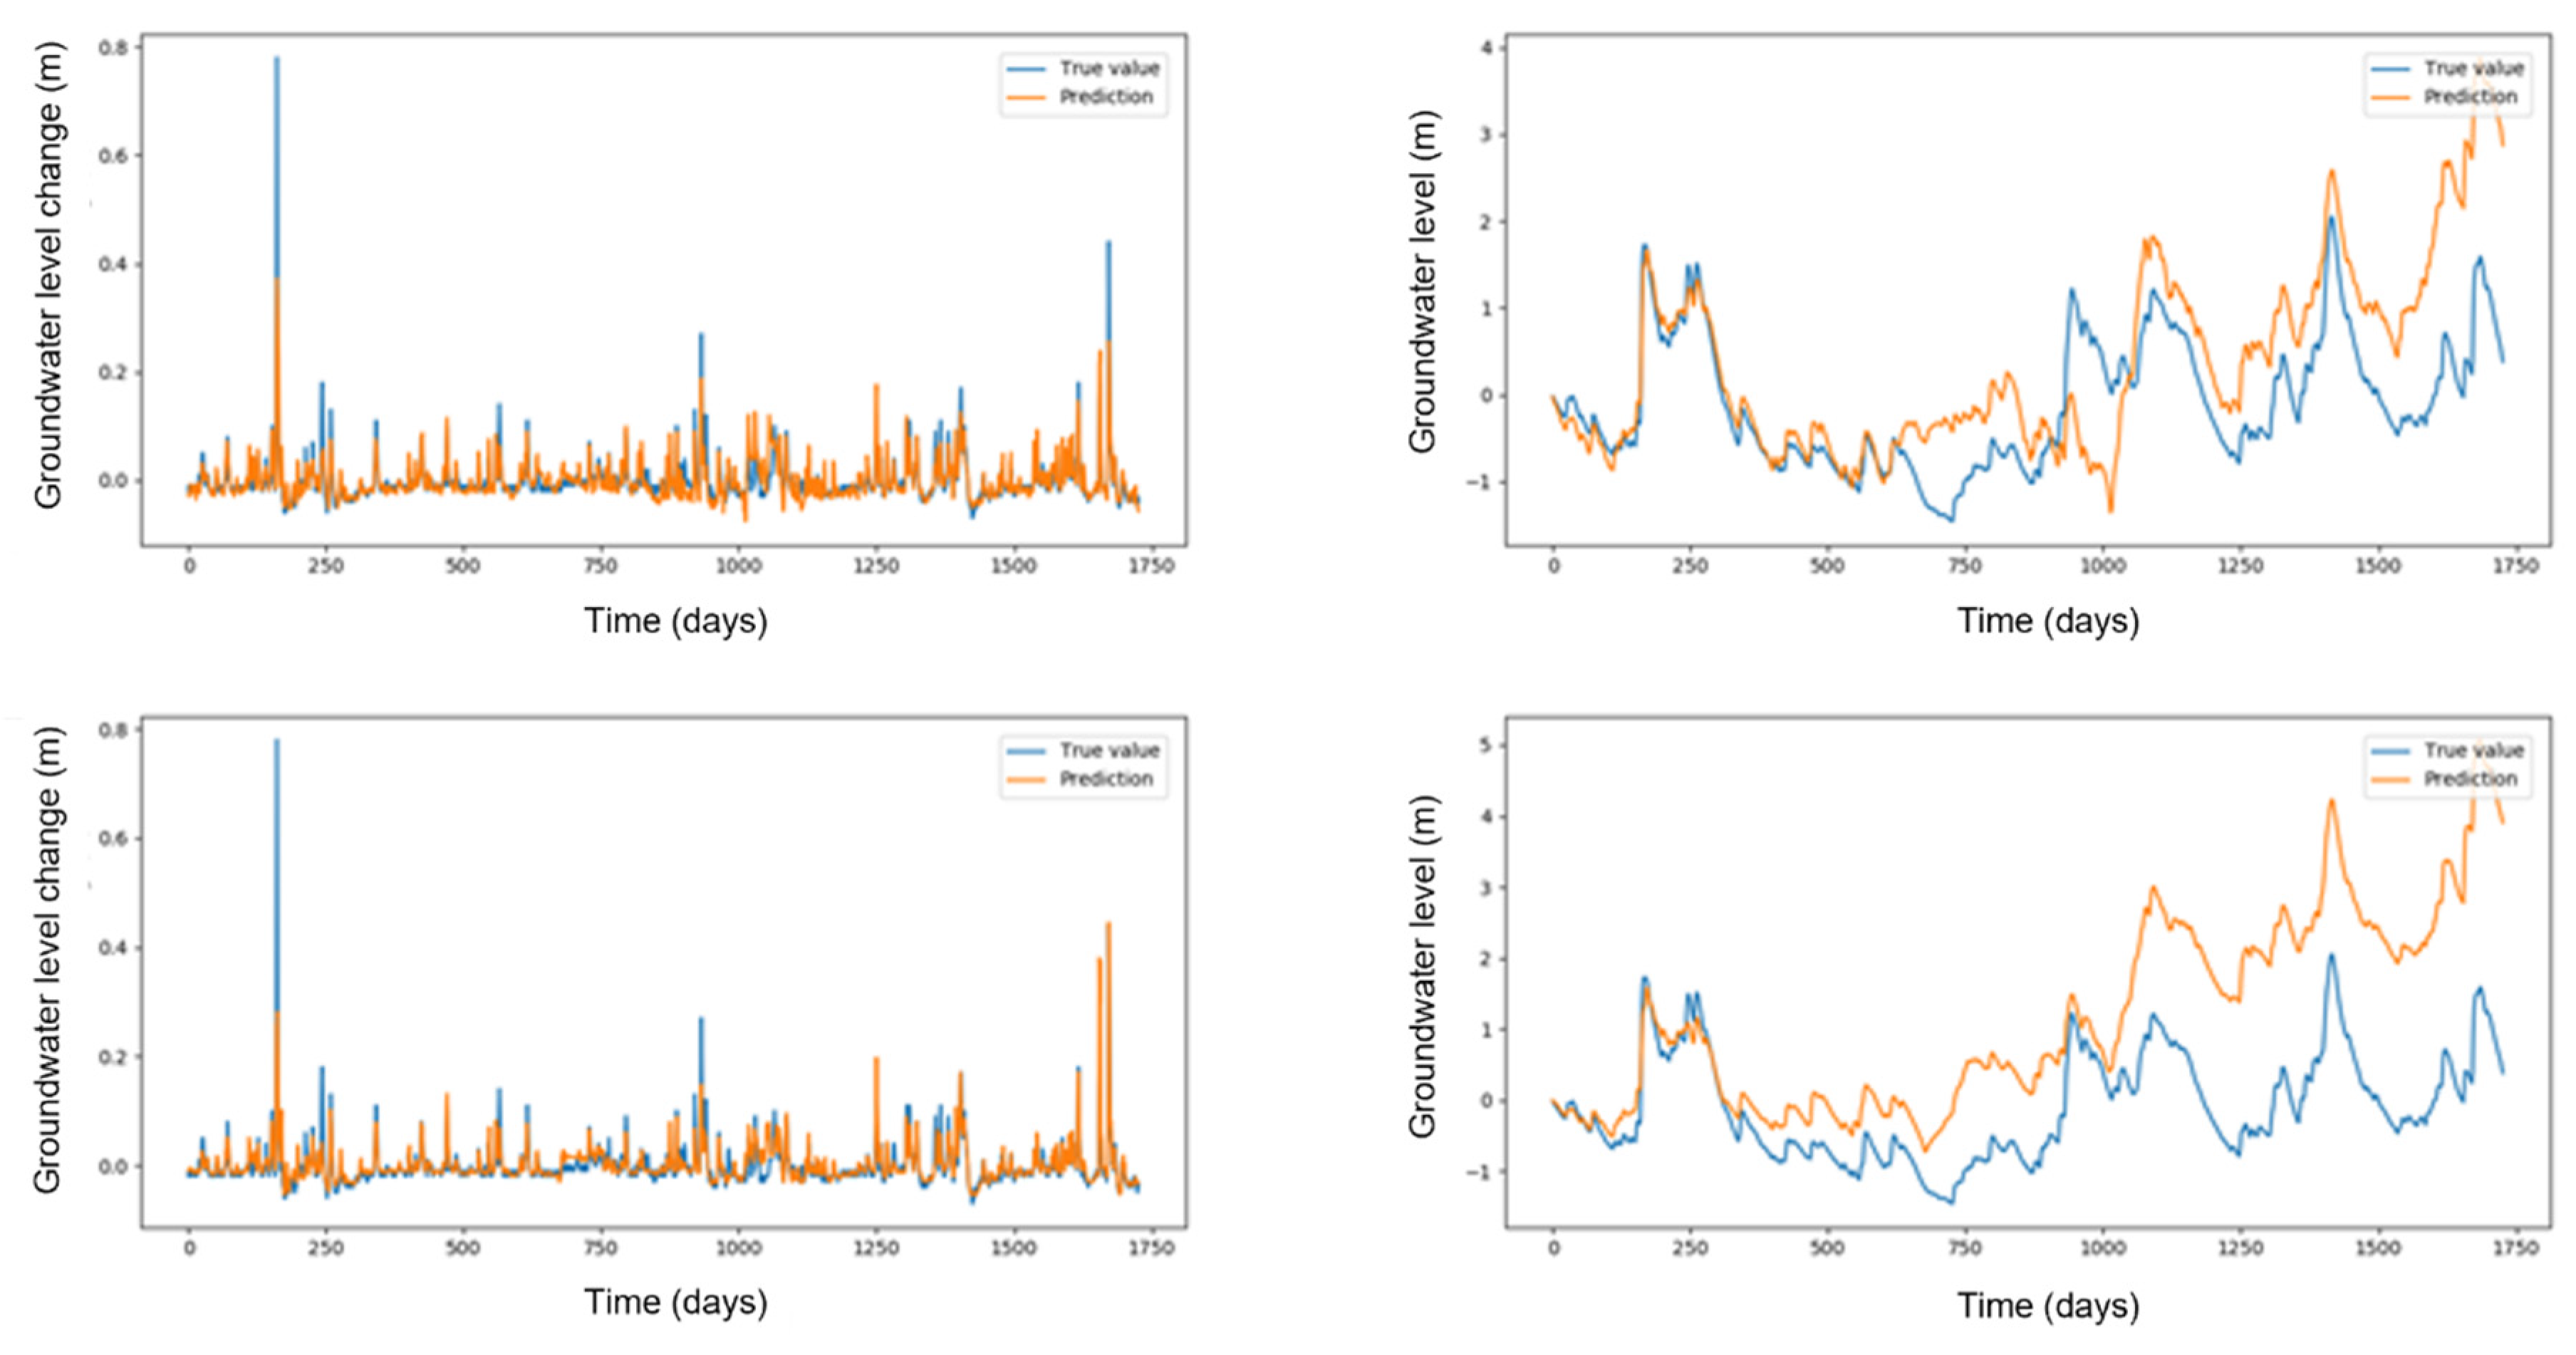
3.4. Data-Driven Modeling

Based upon the experience in the other fields that have faced the artificial intelligence breakthrough in recent years (physics, remote sensing and earth observation, energy management, etc.), we propose to bring the data (for batch analysis) to the users and let them manipulate the data in the fashion that is standardized or is based on the tools they are already familiar with. Our data gathering infrastructure provides a uniform access point for heterogeneous data sources and provides basic boilerplate code to speed up data analysis and development. An expert can access the data in the tool of their preference (i.e., Jupyter notebook), perform analysis, and even deploy their own models to the production by simply updating corresponding configuration structures (feature vectors and models).
As demonstrated in more detail in related work [38], a time series based on groundwater level sensor data can be enriched with various derivatives and with appropriate contextual data. Models will benefit from features such as readings of level change in the past hour, past day, or past week, moving average in the past day or past five days, or even past month. Weather and especially historic weather data (precipitation, snowfall and change of snow blanket) from the area and corresponding river basin, aggregated over a longer period (typically one week) will show good correlations with groundwater level change and will improve the models significantly. In particular areas, the time of the year might expose some typical local dynamics, etc. As stated in the related work section, other generic stream processing platforms do not enable heterogeneous sources data fusion and can therefore not easily provide enriched feature vectors which yield more accurate predictions. In addition, our data fusion component enables easy manipulation (with a single configuration structure) of stream aggregates (such as moving averages or variances) and their historic values.
Experiments have been conducted on the Ljubljana polje aquifer dataset [35], which is also available via an endpoint (data gathering infrastructure API) exposed by the platform, described in this paper (check the dataset source for additional instructions on how to use the API). The dataset includes more than 600 groundwater stations for Slovenia, which measured groundwater levels between years 1950 and 2018. A subset relevant for the Ljubljana polje aquifer was used in the experiments. Weather data were provided by Slovenian environment agency (ARSO) and were also included in the dataset. Normalization has not been performed on the data, since tree-based methods do not benefit from it and because the features themselves are in the same order of magnitude, which should be sufficient for the convergence of the linear regression models.
Feature correlation matrix for one of the time-series is depicted in Figure 6. It includes groundwater level features and weather features. Initial features are from the original dataset. The others have been extracted from historic values. Weather features have been averaged by various intervals (from 1 to 100 days) and different averaging windows have been considered. Next, these features have also been shifted by different time intervals in order to compensate for the time needed for weather-related phenomena to have effect on the groundwater. Based on the correlation matrix we have chosen features from the top 100 features correlated with the target value. Best- and mutually least-correlated features (according to Figure 6) have been selected for each feature subset (aggregated data, aggregated weather data, shifted historic weather data). All the raw values have been considered in the models. Correlations of features with the target value vary from −0.4 to 0.78 (precipitation averaged over next 3-day weather forecast is the best correlated feature). The feature selection process can be achieved using a more thorough search through the grid of features. Greedy algorithms would not be able to accomplish this task in a reasonable time; however, smart heuristics powered by genetic programming and entropy-based similarity measures can canvas the most relevant sections of the feature space and extract (almost) optimal feature vectors from a large feature space, usually further improving accuracy of a particular model [39].
Accuracy of the models has been evaluated using R2 score. R2 is invariant to offset the target value from 0 (which is not true for other relative scores like mean average percentage error—MAPE) and to amplitude within the dataset (which influences the root mean squared error—RMSE). R2 is therefore suitable for comparison of different approaches.
Figure 7 depicts learning curves (improvement of R2 score with number of training examples) of different models for prediction of groundwater levels (with 3-day prediction horizon) in the Ljubljana region. Each model (defined by a learning algorithm and a feature set) is represented by a curve in Figure 7A–D. Curves with a larger number of contextual features are higher in the learning curve graphs, which indicates the benefits of the methodologies presented in this paper. Figure 7A depicts results based on linear regression, Figure 7B on decision trees, Figure 7C on gradient boosting regression and Figure 7D on random forests.
In every picture we can observe five different curves that represent five different feature sets. The blue curve represents a feature set with only direct features from the groundwater level time series, the orange curve represents the “blue” feature set enriched with various stream aggregates, the green curve represents a feature set which also includes current weather data. The red curve is based on the results from a feature set which is further enriched with various aggregations of weather data, and finally the violet curve models include also time-shifted weather features to reflect the potential hysteresis effect of weather on groundwater levels.
Example results for groundwater level predictions (using linear regression and gradient boosting) are shown in Figure 8. We have modeled daily changes of the groundwater (depicted on the left side of Figure 8) and then calculated cumulatives (on the right side of the same figure). Cumulative values show how well the model captures the dynamics of groundwater levels. The values themselves diverge from the true values, but the important information is that the models reflect the trends in the real world well.
Each consecutive dataset includes more potentially relevant features that enable the model to reflect the underlying process better. Results, represented with blue and orange lines, which only include features based on the groundwater level time series itself, behave even worse than a constant zero model. As soon as additional weather data are considered (green line), the accuracy improves drastically. The biggest improvement is however achieved by including different time-window and time-shifted aggregates of weather data, which seem to reflect dynamics of groundwater adequately. The linear regression in Figure 7A gives stable results (curves rise with the number of learning examples). Each addition to the feature set increases the accuracy of the model by bringing new knowledge. Decision trees in Figure 7B behave slightly worse and are much less stable. We also observe that decision trees learn slower. They need more examples to reach comparable accuracy to linear regression. The learning rate of gradient boosting regression in Figure 7C and random forests in Figure 7D matches the speed of linear regression. Random forests, which are usually the method of choice in environmental data-driven modeling, behave best with the raw weather dataset (green) and aggregated weather dataset (red), but slightly worse than linear regression in the best-case scenario. The best results are given by gradient boosting regression, which can achieve an R2 score close to 0.8. As a baseline, a model with only the best feature would yield R2 ≈ 0.6, which is 0.16 less than the results of gradient boosting with the best feature subset.
Usage of data-fusion and data-driven modeling within the speed layer of the architecture enables real-time application of the predictive analytics, developed in batch mode.

4. Conclusions

We have presented a water domain view on the data mining approaches within a smart water management scenario. We have identified the needs of stakeholders and provided a description of typical data sources that support achieving the desired results. We have presented an architecture based on standard big data approaches and an early prototype which enables offline analysis tailored to the stakeholders’ needs and real-time predictive analytics that can be applied to real-world scenarios. The platform provides parallelization of data processing, which enables horizontal scalability of the system. The measurements, however, demonstrate that even a single high-end server can support a reasonably big project with up to 400,000 connected IoT devices. The main contributions within the streaming part of the architecture (speed layer) are the data fusion component and the usage of computationally less demanding stream mining techniques for predictive analytics.
Although a lot of work has been done in the field of digitalization in the water management domain, there is still a gap to be bridged in the water management domain to reach its counterparts in energy management, traffic, and manufacturing. Many solutions have been developed in those fields, especially in energy management, which can be applied to the water domain. Understanding of dynamics in the water domain has traditionally been supported by process-based models, which require extensive knowledge of the domain, including geology and fluid dynamics. With more data provided, machine learning models can provide an efficient alternative to the existing state, simply because they are easier to implement, because they reflect the current state of the system immediately (including human behavior-related variables), because predictive techniques have been proven to mimic hidden process dynamics and because they can be cost effective. As both approaches, data-driven and process-based, have their own advantages, they should work hand in hand, which offers another research challenge for the future. On the other hand, the water community has to embrace and gain trust in data-driven approaches. We should therefore allow the community to perform their analysis with the tools they are already familiar with or with the tools that are well documented and widely used in the data mining community (i.e., scikit-learn with Jupyter notebooks). In order to maximize the accuracy of data-driven models, data fusion techniques (like we have described in this paper) will be of the utmost importance. Weather plays an important role in the modeling of water-related phenomena. An efficient generic way to input weather data into the models is needed. The weather data are similar (in structure as well as in volume) to the remote sensing data from Sentinel and LandSat systems. The water management community (as well agriculture or others from the environmental domain) should take advantage of efficient technologies for exploiting earth observation data that has been evolving fast in recent years.
Finally, all this knowledge will have to be integrated under a standardized framework which will enable an efficient exchange and processing of large amounts of high-velocity data streams enriched with appropriate contextual data. An effective provisioning system for deployment of models is needed in order for the framework to take full advantage of parallel processing and to successfully deploy the system within a large sensor network. We have depicted the foundation for such a system, but efficient management of the analytics components still remains a challenge.

Author Contributions

Conceptualization, K.K.; methodology, K.K.; software, K.K., M.S., and N.M.; validation, N.M. and P.P.; data curation, K.K.; writing—original draft preparation, K.K. and N.M.; writing—review and editing, P.P., M.S.; visualization, M.S., K.K.; project administration, K.K., N.M. and P.P. All authors have read and agreed to the published version of the manuscript.

Funding

This research has received funding from: (i) the EU Horizon 2020 Programme project Water4Cities under grant agreement number 734409, (ii) the EU Horizon 2020 Programme project NAIADES under grant agreement number 820985, and (iii) the PRIMA Foundation project MAGO with grant number 2022.

Institutional Review Board Statement

Not applicable.

Informed Consent Statement

Not applicable.

Data Availability Statement

Data supporting reported results can be found in Slovenian Environment Agency public groundwater archive available at http://vode.arso.gov.si/hidarhiv/pod_arhiv_tab.php (accessed on 1 January 2022). The con-crete dataset used for experiments (including groundwater level data and weather data) was also published at https://researchgate.net/publication/336239471_Slovenia_-_groundwater_levels (accessed on 1 January 2022) [35].

Acknowledgments

The authors would like to thank partners and colleagues from H2020 Water4Cities project for their contributions in the phase of preparation and writing of this paper. We would like to thank Stamatia Rizou and Anja Polajnar, for project leadership and steering of the work, Kristina Klemen, for insights into the needs of the urban planning community for the solutions provided by data-mining approach, Filip Koprivec and Matej Ćerin, for developing subcomponents of the WMAP system, and finally Dimitris Kofinas and Chrysi Laspidou for providing significant insights into the water management domain.

Conflicts of Interest

The authors declare no conflict of interest. The funders had no role in the design of the study; in the collection, analyses, or interpretation of data; in the writing of the manuscript, or in the decision to publish the results.

Abbreviations

The following abbreviations are used in this manuscript:
APIApplication Programming Interface
CRISP-DMCross–industry Standard Process for Data Mining
HTTPHyper–Text Transfer Protocol
ICTInformation and Communication Technology
IoTInternet of Things
ISDIIoT Streaming Data Integration
IUWMIntegrated Urban Water Management
MOAMassive Online Analysis
SQLStructured (English) Query Language
SWMSmart Water Management
WMAPWater Management Analytical Platform

References

  1. Laspidou, C. ICT and stakeholder participation for improved urban water management in the cities of the future. Water Util. J. 2014, 8, 79–85. [Google Scholar]
  2. Cominola, A.; Giuliani, M.; Piga, D.; Castelletti, A.; Rizzoli, A. Benefits and challenges of using smart meters for advancing residential water demand modeling and management: A review. Environ. Model. Softw. 2015, 72, 198–214. [Google Scholar] [CrossRef] [Green Version]
  3. Ioannou, A.E.; Laspidou, C.S. The Water-Energy Nexus at City Level: The Case Study of Skiathos. Proceedings 2018, 2, 694. [Google Scholar] [CrossRef] [Green Version]
  4. Yang, L.; Yang, S.H.; Magiera, E.; Froelich, W.; Jach, T.; Laspidou, C. Domestic water consumption monitoring and behavior intervention by employing the internet of things technologies. Procedia Comput. Sci. 2017, 111, 367–375. [Google Scholar] [CrossRef]
  5. Rizou, S.; Kenda, K.; Kofinas, D.; Mellios, N.; Pergar, P.; Ritsos, P.D.; Vardakas, J.; Kalaboukas, K.; Laspidou, C.; Senožetnik, M.; et al. Water4Cities: An ICT Platform Enabling Holistic Surface Water and Groundwater Management for Sustainable Cities. Proceedings 2018, 2, 695. [Google Scholar] [CrossRef] [Green Version]
  6. Zaharia, M.; Xin, R.S.; Wendell, P.; Das, T.; Armbrust, M.; Dave, A.; Meng, X.; Rosen, J.; Venkataraman, S.; Franklin, M.J.; et al. Apache spark: A unified engine for big data processing. Commun. ACM 2016, 59, 56–65. [Google Scholar] [CrossRef]
  7. Marz, N.; Warren, J. Big Data: Principles and Best Practices of Scalable Realtime Data Systems, 1st ed.; Manning Publications Co.: Greenwich, CT, USA, 2015. [Google Scholar]
  8. Ta-Shma, P.; Akbar, A.; Gerson-Golan, G.; Hadash, G.; Carrez, F.; Moessner, K. An Ingestion and Analytics Architecture for IoT Applied to Smart City Use Cases. IEEE Internet Things J. 2018, 5, 765–774. [Google Scholar] [CrossRef] [Green Version]
  9. Aggarwal, C.C. Data Streams: Models and Algorithms (Advances in Database Systems); Springer: Secaucus, NJ, USA, 2006. [Google Scholar]
  10. Krempl, G.; Žliobaite, I.; Brzeziński, D.; Hüllermeier, E.; Last, M.; Lemaire, V.; Noack, T.; Shaker, A.; Sievi, S.; Spiliopoulou, M.; et al. Open challenges for data stream mining research. ACM SIGKDD Explor. Newsl. 2014, 16, 1–10. [Google Scholar] [CrossRef]
  11. Huang, G.B.; Chen, L.; Siew, C.K. Universal approximation using incremental constructive feedforward networks with random hidden nodes. IEEE Trans. Neural Netw. 2006, 17, 879–892. [Google Scholar] [CrossRef] [Green Version]
  12. Ikonomovska, E.; Gama, J.; Džeroski, S. Online tree-based ensembles and option trees for regression on evolving data streams. Neurocomputing 2015, 150, 458–470. [Google Scholar] [CrossRef] [Green Version]
  13. Zhang, Q.; Yang, L.T.; Chen, Z.; Li, P. A survey on deep learning for big data. Inf. Fusion 2018, 42, 146–157. [Google Scholar] [CrossRef]
  14. Bifet, A.; Holmes, G.; Kirkby, R.; Pfahringer, B. MOA: Massive Online Analysis. J. Mach. Learn. Res. 2010, 11, 1601–1604. [Google Scholar]
  15. Montiel, J.; Read, J.; Bifet, A.; Abdessalem, T. Scikit-Multiflow: A Multi-output Streaming Framework. CoRR 2018, 19, 1–5. [Google Scholar]
  16. QMiner: Data Analytics Platform for Processing Streams of Structured and Unstructured Data. Available online: https://www.researchgate.net/publication/269100309_QMiner_Data_Analytics_Platform_for_Processing_Streams_of_Structured_and_Unstructured_Data (accessed on 1 January 2022).
  17. Kenda, K.; Kažič, B.; Novak, E.; Mladenić, D. Streaming Data Fusion for the Internet of Things. Sensors 2019, 19, 1955. [Google Scholar] [CrossRef] [Green Version]
  18. Tu, D.Q.; Kayes, A.; Rahayu, W.; Nguyen, K. ISDI: A New Window-Based Framework for Integrating IoT Streaming Data from Multiple Sources; Springer: Heidelberg, Germany, 2019; Volume 926, pp. 498–511. [Google Scholar]
  19. Manes, C.L.; Laspidou, C. Biosensors for Aquaculture and Food Safety. In Challenges and Innovations in Ocean In Situ Sensors: Measuring Inner Ocean Processes and Health in the Digital Age, 1st ed.; Delory, E., Pearlman, J., Eds.; Elsevier: Amsterdam, The Netherlands, 2018. [Google Scholar]
  20. Popović, T.; Latinović, N.; Pešić, A.; Zečević, Ž.; Krstajić, B.; Djukanović, S. Architecting an IoT-enabled platform for precision agriculture and ecological monitoring: A case study. Comput. Electron. Agric. 2017, 140, 255–265. [Google Scholar] [CrossRef]
  21. Kossieris, P.; Kozanis, S.; Hashmi, A.; Katsiri, E.; Vamvakeridou-Lyroudia, L.; Farmani, R.; Makropoulos, C.; Savic, D. A Web-based Platform for Water Efficient Households. Procedia Eng. 2014, 89, 1128–1135. [Google Scholar] [CrossRef] [Green Version]
  22. Catchment Hydrology Explorer for Water Stewards (CatchX Platform). Available online: https://ui.adsabs.harvard.edu/abs/2018EGUGA..20.9882A/abstract (accessed on 1 January 2022).
  23. Gaffoor, Z.; Pietersen, K.; Jovanovic, N.; Bagula, A.; Kanyerere, T. Big data analytics and its role to support groundwater management in the Southern African development community. Water 2020, 12, 2796. [Google Scholar] [CrossRef]
  24. Laspidou, C.; Kofinas, D.; Mellios, N.; Latinopoulos, D.; Papadimitriou, T. Investigation of factors affecting the trophic state of a shallow Mediterranean reconstructed lake. Ecol. Eng. 2017, 103, 154–163. [Google Scholar] [CrossRef]
  25. Mellios, N.; Moe, S.J.; Laspidou, C. Machine Learning Approaches for Predicting Health Risk of Cyanobacterial Blooms in Northern European Lakes. Water 2020, 12, 1191. [Google Scholar] [CrossRef] [Green Version]
  26. Kofinas, D.; Mellios, N.; Papageorgiou, E.; Laspidou, C. Urban water demand forecasting for the island of Skiathos. Procedia Eng. 2014, 89, 1023–1030. [Google Scholar] [CrossRef] [Green Version]
  27. Parkinson, J.N.; Tucci, C.; Goldenfum, J.A. (Eds.) Integrated Urban Water Management: Humid Tropics: UNESCO-IHP; CRC Press: Boca Raton, FL, USA, 2010. [Google Scholar]
  28. Oregi, X.; Roth, E.; Alsema, E.; van Ginkel, M.; Struik, D. Use of ICT tools for integration of energy in urban planning projects. Energy Procedia 2015, 83, 157–166. [Google Scholar] [CrossRef] [Green Version]
  29. Bricker, S.; Banks, V.; Galik, G.; Tapete, D.; Jones, R. Accounting for groundwater in future city visions. Land Use Policy 2017, 69, 618–630. [Google Scholar] [CrossRef]
  30. Senožetnik, M.; Herga, Z.; Šubic, T.; Bradeško, L.; Kenda, K.; Klemen, K.; Pergar, P.; Mladenić, D. IoT Middleware for Water Management. Proceedings 2018, 2, 696. [Google Scholar] [CrossRef] [Green Version]
  31. Pereira, D.A.; de Morais, W.O.; de Freitas, E.P. NoSQL real–time database performance comparison. Int. J. Parallel Emergent Distrib. Syst. 2018, 33, 144–156. [Google Scholar] [CrossRef]
  32. Shearer, C. The CRISP–DM model: The new blueprint for data mining. J. Data Warehous. 2000, 5, 13–22. [Google Scholar]
  33. Kenda, K.; Mladenić, D. Autonomous Sensor Data Cleaning in Stream Mining Setting. Bus. Syst. Res. J. 2018, 9, 69–79. [Google Scholar] [CrossRef] [Green Version]
  34. Kenda, K.; Koprivec, F.; Mladenić, D. Optimal Missing Value Estimation Algorithm for Groundwater Levels. Proceedings 2018, 2, 698. [Google Scholar] [CrossRef] [Green Version]
  35. Groundwater Levels for Slovenia–Data Set. Available online: https://researchgate.net/publication/336239471_Slovenia_-_groundwater_levels (accessed on 1 January 2022).
  36. Andjelov, M.; Frantar, P.; Mikulič, Z.; Pavlič, U.; Savić, V.; Souvent, P.; Uhan, J. Groundwater quantitative status assessment for River Basin Management Plan 2015-2021 in Slovenia. Geologija 2016, 59, 205–219. [Google Scholar] [CrossRef]
  37. Wu, X.; Zhu, X.; Wu, G.; Ding, W. Data mining with big data. IEEE Trans. Knowl. Data Eng. 2014, 26, 97–107. [Google Scholar]
  38. Kenda, K.; Ćerin, M.; Bogataj, M.; Senožetnik, M.; Klemen, K.; Pergar, P.; Laspidou, C.; Mladenić, D. Groundwater Modeling with Machine Learning Techniques: Ljubljana polje Aquifer. Proceedings 2018, 2, 697. [Google Scholar] [CrossRef] [Green Version]
  39. Koprivec, F.; Kenda, K.; Šircelj, B. FASTENER Feature Selection for Inference from Earth Observation Data. Entropy 2020, 22, 1198. [Google Scholar] [CrossRef] [PubMed]
Figure 1. Proposed modification of lambda and hut architectures for usage in the water management domain. Heterogeneous input data streams are fused in the data fusion component and pushed into both speed and batch layers. The speed layer includes two types of models—incremental (being updated with only new data online) and batch. Batch models are updated with all the data from the batch layer.
Sustainability 14 02886 g001
Figure 2. Design of data fusion component in the speed layer. The component is able to ingest three types of data streams and output a stream of feature vectors.
Sustainability 14 02886 g002
Figure 3. Example of speed layer implementation and interconnection of particular components. Message distribution component is depicted in gray.
Sustainability 14 02886 g003
Figure 4. Example of missing data imputation algorithm based on nearby sensors, R2 > 0.99. The dataset with missing data is depicted in the top panel. The imputed part of the time series is depicted in black in the lower panel.
Sustainability 14 02886 g004
Figure 5. Evaluation of the performance of the speed layer setup (data ingestion, streaming data fusion, and modeling with random forest) on a high-end server (blue) and Raspberry Pi edge device (orange). Apache Kafka was running in a dockerized container on the same high-end server.
Sustainability 14 02886 g005
Figure 6. Correlation matrix includes 544 features. The features are the original ones represented in the dataset (such as weather data and current and historic groundwater levels) and derived ones (such as averaged and shifted by different time intervals). Our platform enables online generation of all these features. Positive correlation is depicted in yellow and negative in dark blue shades.
Sustainability 14 02886 g006
Figure 7. Learning curves of plain and enriched datasets with multiple learning methods: (A) linear regression, (B) decision trees, (C) gradient boosting regression, (D) random forest regression.
Sustainability 14 02886 g007
Figure 8. Groundwater level change predictions and summed predictions over time. First row depicts linear regression results, the second row depicts gradient boosting results. Summed predictions may drift over time, which does not give an objective measure of the model’s accuracy. Capturing the correct trends is much more important.
Sustainability 14 02886 g008
Table 1. Typical data sources in the water domain and corresponding indicative subcategories.
Typical Data Sources in the Water DomainIndicative Subcategories
Surface and groundwater bodies datagroundwater level and pressure; permeability and storage capacity; river water level and discharge rates; flood inundation areas
Meteorological dataprecipitation; temperature; evaporation; wind speed; radiation
Water repository dataaccessible storage volume; water storage bathymetry and level; reservoir or tank water level; storage inflows, outflows and offtakes
Water exploitation datavolume of water taken from groundwater, rivers, lakes, and storage infrastructure; water pumping data
Water quality datatemperature; pH; oxygen; nutrients; chlorine concentration; electrical conductivity
Water pollutant dataheavy metals concentration; fertilizers; pesticides; bacteria; algae
Water distribution dataflow rate; pressure; energy consumption
Human-behavior datawater consumption; migration/tourism; public participation data
Spatial datainfrastructure; future and current land use; water bodies; static data based on previous measurements and process models; surface and topology; geological data; risk maps
Administrative datawater management area boundaries; water prices; water infrastructure inventories
Publisher’s Note: MDPI stays neutral with regard to jurisdictional claims in published maps and institutional affiliations.

