
Measuring Access and Egress Distance and Catchment Area of Multiple Feeding Modes for Metro Transferring Using Survey Data


Abstract
:1. Introduction
- Calculating network-based access/egress distance and further determining the threshold to depict the service area by using the regression model for every mode;
- Comparing the transferring distances, corresponding spatio-temporal characteristics, and accessible areas for multiple feeding modes based on visualization.
2. Literature Review
2.1. Integration of Metro with Walking
2.2. Integration of Metro with Private Bike, Bike-Sharing, and E-Bike
2.3. Integration of Metro with Bus, Car, and Taxi
3. Methodology
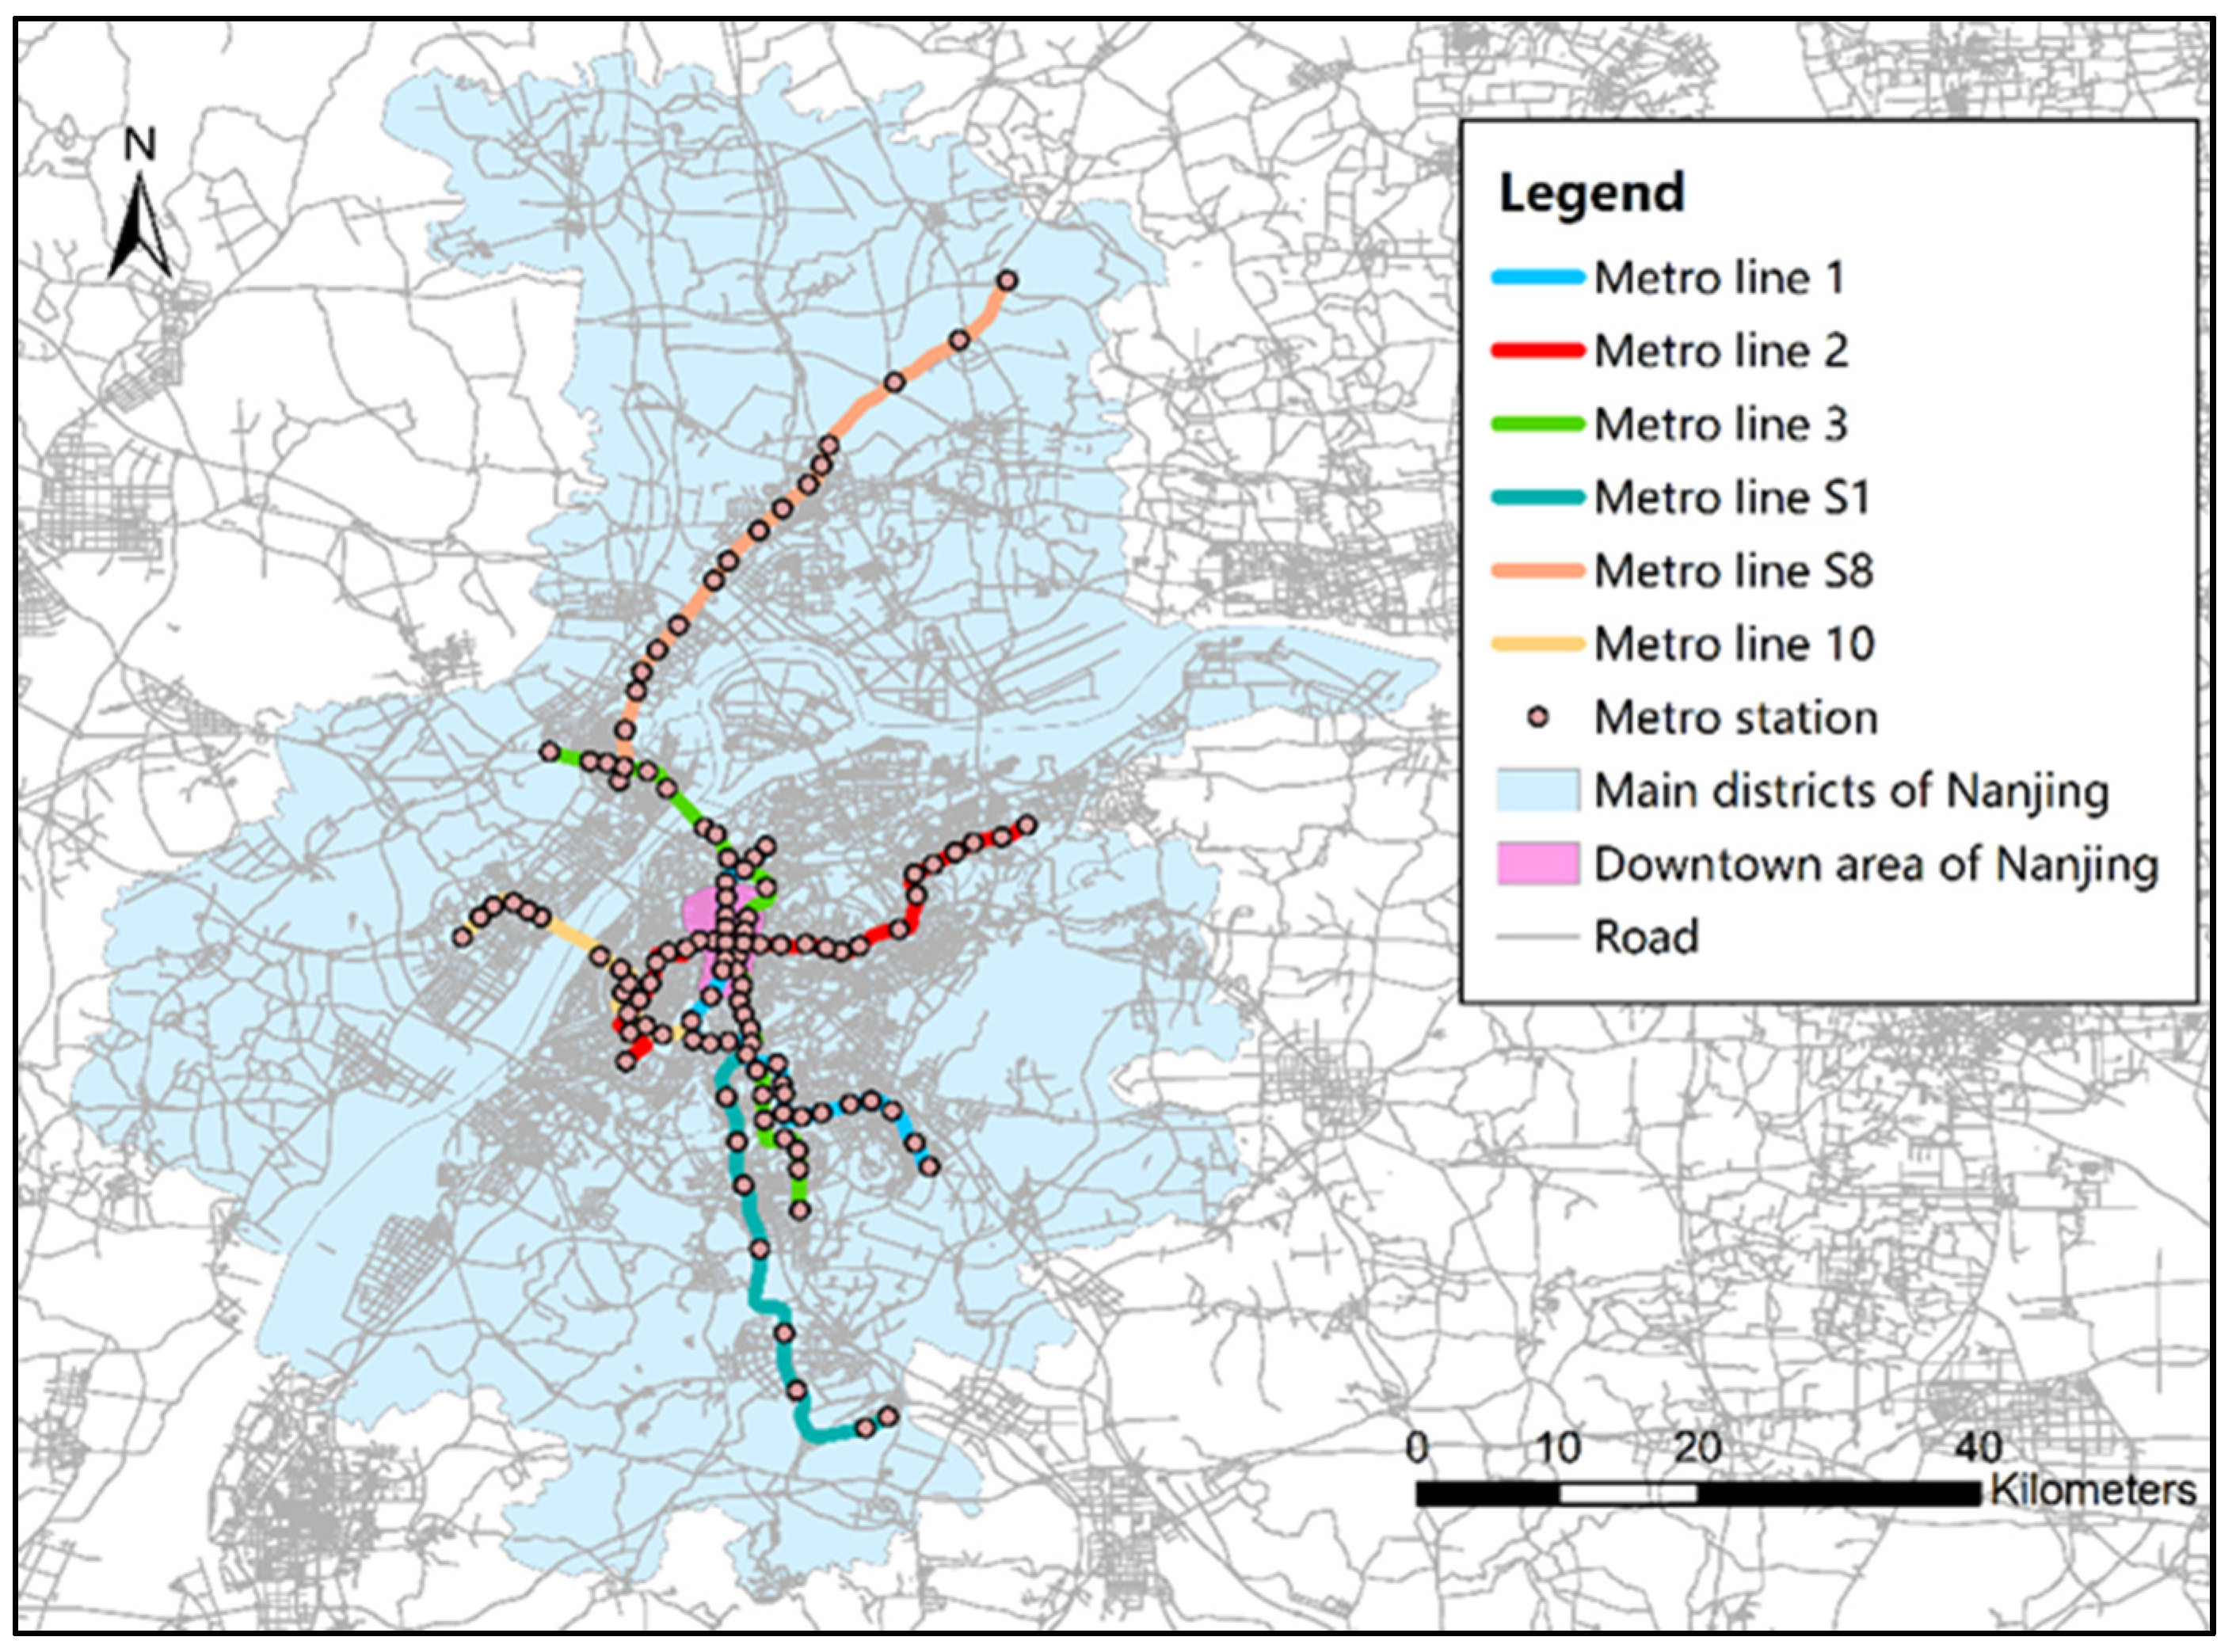
3.1. Study Area
3.2. Data Collection
- Trip data, including the longitude and latitude of origin and destination; the name of aligned metro station; feeding modes and corresponding transferring time consumption.
- Personal data, including gender; age; education; income, etc.
3.3. Access/Egress Distance Calculation
3.4. Catchment Area Delineation
4. Results
4.1. Analysis of Personal and Travel Characteristics
4.2. Access/Egress Distance of Metro Station
4.3. Analysis of Spatio-Temporal Characteristic for Multiple Feeding Modes
4.4. Catchment Area of Metro Station
5. Conclusions
Author Contributions
Funding
Institutional Review Board Statement
Informed Consent Statement
Data Availability Statement
Conflicts of Interest
References
- Zuo, T.; Wei, H.; Rohne, A. Determining transit service coverage by non-motorized accessibility to transit: Case study of applying GPS data in Cincinnati metropolitan area. J. Transp. Geogr. 2018, 67, 1–11. [Google Scholar] [CrossRef]
- Givoni, M.; Rietveld, P. The access journey to the railway station and its role in passengers’ satisfaction with rail travel. Transp. Policy 2007, 14, 357–365. [Google Scholar] [CrossRef]
- Wang, J.; Cao, X. Exploring built environment correlates of walking distance of transit egress in the Twin Cities. J. Transp. Geogr. 2017, 64, 132–138. [Google Scholar] [CrossRef]
- Wang, Z.-J.; Chen, F.; Xu, T.-K. Interchange between Metro and Other Modes: Access Distance and Catchment Area. J. Urban Plan. Dev. 2016, 142, 04016012. [Google Scholar] [CrossRef]
- Weiss, A.; Habib, K.N. Examining the difference between park and ride and kiss and ride station choices using a spatially weighted error correlation (SWEC) discrete choice model. J. Transp. Geogr. 2017, 59, 111–119. [Google Scholar] [CrossRef]
- Hsiao, S.; Lu, J.; Sterling, J.; Weatherford, M. Use of Geographic Information System for Analysis of Transit Pedestrian Access. Transp. Res. Rec. 1997, 1604, 50–59. [Google Scholar] [CrossRef]
- Zhao, J.; Deng, W.; Song, Y.; Zhu, Y. Analysis of Metro ridership at station level and station-to-station level in Nanjing: An approach based on direct demand models. Transportation 2014, 41, 133–155. [Google Scholar] [CrossRef]
- Jun, M.-J.; Choi, K.; Jeong, J.-E.; Kwon, K.-H.; Kim, H.-J. Land use characteristics of subway catchment areas and their influence on subway ridership in Seoul. J. Transp. Geogr. 2015, 48, 30–40. [Google Scholar] [CrossRef]
- Wang, Y.; Correia, G.; de Romph, E.; Timmermans, H. Using metro smart card data to model location choice of after-work activities: An application to Shanghai. J. Transp. Geogr. 2017, 63, 40–47. [Google Scholar] [CrossRef] [Green Version]
- Kuby, M.; Barranda, A.; Upchurch, C. Factors influencing light-rail station boardings in the United States. Transp. Res. Part A Policy Pract. 2004, 38, 223–247. [Google Scholar] [CrossRef]
- Cardozo, O.D.; García-Palomares, J.C.; Gutiérrez, J. Application of geographically weighted regression to the direct forecasting of transit ridership at station-level. Appl. Geogr. 2012, 34, 548–558. [Google Scholar] [CrossRef]
- Rastogi, R.; Rao, K.V.K. Travel Characteristics of Commuters Accessing Transit: Case Study. J. Transp. Eng. 2003, 129, 684–694. [Google Scholar] [CrossRef]
- Zhao, J.; Deng, W. Relationship of Walk Access Distance to Rapid Rail Transit Stations with Personal Characteristics and Station Context. J. Urban Plan. Dev. 2013, 139, 311–321. [Google Scholar] [CrossRef]
- Ji, Y.; Fan, Y.; Ermagun, A.; Cao, X.; Wang, W.; Das, K. Public bicycle as a feeder mode to rail transit in China: The role of gender, age, income, trip purpose, and bicycle theft experience. Int. J. Sustain. Transp. 2017, 11, 308–317. [Google Scholar] [CrossRef]
- Li, Z.; Wang, W.; Yang, C.; Ding, H. Bicycle mode share in China: A city-level analysis of long term trends. Transportation 2017, 44, 773–788. [Google Scholar] [CrossRef]
- Taylor, D.; Mahmassani, H. Analysis of stated preferences for intermodal bicycle-transit interfaces. Transp. Res. Rec. 1996, 1556, 86–95. [Google Scholar] [CrossRef]
- Hochmair, H.H. Assessment of Bicycle Service Areas around Transit Stations. Int. J. Sustain. Transp. 2015, 9, 15–29. [Google Scholar] [CrossRef]
- Lee, J.; Choi, K.; Leem, Y. Bicycle-based transit-oriented development as an alternative to overcome the criticisms of the conventional transit-oriented development. Int. J. Sustain. Transp. 2016, 10, 975–984. [Google Scholar] [CrossRef]
- Cheng, Y.-H.; Lin, Y.-C. Expanding the effect of metro station service coverage by incorporating a public bicycle sharing system. Int. J. Sustain. Transp. 2018, 12, 241–252. [Google Scholar] [CrossRef]
- Ma, T.; Liu, C.; Erdoğan, S. Bicycle Sharing and Public Transit Does Capital Bikeshare Affect Metrorail Ridership in Washington, DC? Transp. Res. Rec. 2015, 2534, 1–9. [Google Scholar] [CrossRef]
- Fyhri, A.; Fearnley, N. Effects of e-bikes on bicycle use and mode share. Transp. Res. Part D Transp. Environ. 2015, 36, 45–52. [Google Scholar] [CrossRef] [Green Version]
- Fyhri, A.; Heinen, E.; Fearnley, N.; Sundfør, H.B. A push to cycling exploring the e-bike’s role in overcoming barriers to bicycle use with a survey and an intervention study. Int. J. Sustain. Transp. 2017, 11, 681–695. [Google Scholar] [CrossRef]
- Plazier, P.A.; Weitkamp, G.; Berg, A.E.V.D. “Cycling was never so easy!” An analysis of e-bike commuters’ motives, travel behaviour and experiences using GPS-tracking and interviews. J. Transp. Geogr. 2017, 65, 25–34. [Google Scholar] [CrossRef] [Green Version]
- Talamini, G.; Ferreira, D.P. An informal transportation as a feeder of the rapid transit system. Spatial analysis of the e-bike taxi service in Shenzhen, China. Transp. Res. Interdiscip. Perspect. 2019, 1, 100002. [Google Scholar] [CrossRef]
- Lin, D.; Zhang, Y.; Zhu, R.; Meng, L. The analysis of catchment areas of metro stations using trajectory data generated by dockless shared bikes. Sustain. Cities Soc. 2019, 49, 101598. [Google Scholar] [CrossRef]
- Guo, Y.; Yang, L.; Lu, Y.; Zhao, R. Dockless bike-sharing as a feeder mode of metro commute? The role of the feeder-related built environment: Analytical framework and empirical evidence. Sustain. Cities Soc. 2021, 65, 102594. [Google Scholar] [CrossRef]
- Pan, H.; Shen, Q.; Xue, S. Intermodal Transfer between Bicycles and Rail Transit in Shanghai, China. Transp. Res. Rec. J. Transp. Res. Board 2010, 2144, 181–188. [Google Scholar] [CrossRef]
- Wang, Z.-J.; Liu, Y.; Chen, F. Evaluation and Improvement of the Interchange from Bus to Metro Using Smart Card Data and GIS. J. Urban Plan. Dev. 2018, 144, 05018004. [Google Scholar] [CrossRef]
- Santoso, D.S.; Sakamoto, K.; Yajima, M.; Kubotoa, H. Trip Characteristics of Commuters Accessing Rail Transit by Considering Distance and Slope with Integration of Public Bus as a Feeder. J. East. Asia Soc. Transp. Stud. 2015, 11, 1479–1494. [Google Scholar]
- Yang, M.; Zhao, J.; Wang, W.; Liu, Z.; Li, Z. Metro commuters’ satisfaction in multi-type access and egress transferring groups. Transp. Res. Part D Transp. Environ. 2015, 34, 179–194. [Google Scholar] [CrossRef]
- Buehler, R. Can Public Transportation Compete with Automated and Connected Cars? J. Public Transp. 2018, 21, 7–18. [Google Scholar] [CrossRef] [Green Version]
- Wang, F.; Ross, C.L. New potential for multimodal connection: Exploring the relationship between taxi and transit in New York City (NYC). Transportation 2017, 46, 1051–1072. [Google Scholar] [CrossRef]
- Li, M.; Dong, L.; Shen, Z.; Lang, W.; Ye, X. Examining the Interaction of Taxi and Subway Ridership for Sustainable Urbanization. Sustainability 2017, 9, 242. [Google Scholar] [CrossRef] [Green Version]
- Jiang, S.; Guan, W.; He, Z.; Yang, L. Exploring the Intermodal Relationship between Taxi and Subway in Beijing, China. J. Adv. Transp. 2018, 2018, 1–14. [Google Scholar] [CrossRef]
- The Population of Nanjing. 2018. Available online: http://www.chamiji.com/201806046098.html (accessed on 16 August 2018).
- Nanjing Metro. 2021. Available online: https://baike.baidu.com/item/%E5%8D%97%E4%BA%AC%E5%9C%B0%E9%93%81/5045076?fr=aladdin (accessed on 15 January 2022).
- Efforts of Nanjing Transportation Bureau in the Past Five Years. 2017. Available online: http://jiangsu.sina.com.cn/news/2017-07-22/detail-ifyihrit1200076.shtml (accessed on 11 July 2017).
- Hino, S.; Kishi, K.; Sato, K. Development of the Complementary Accessibility Index and Evaluation of Public Transportation System. J. City Plan. Inst. Jpn. 2000, 35, 475–480. [Google Scholar] [CrossRef]
- El-Geneidy, A.; Grimsrud, M.; Wasfi, R.; Tétreault, P.; Surprenant-Legault, J. New evidence on walking distances to transit stops: Identifying redundancies and gaps using variable service areas. Transportation 2014, 41, 193–210. [Google Scholar] [CrossRef]
- Parkin, J.; Wardman, M.; Page, M. Estimation of the determinants of bicycle mode share for the journey to work using census data. Transportation 2008, 35, 93–109. [Google Scholar] [CrossRef] [Green Version]
- Ma, X.; Ji, Y.; Yang, M.; Jin, Y.; Tan, X. Understanding bikeshare mode as a feeder to metro by isolating metro-bikeshare transfers from smart card data. Transp. Policy 2018, 71, 57–69. [Google Scholar] [CrossRef]
- Fishman, E.; Cherry, C. E-bikes in the Mainstream: Reviewing a Decade of Research. Transp. Rev. 2016, 36, 72–91. [Google Scholar] [CrossRef]
- He, S.Y.; Giuliano, G. Factors affecting children’s journeys to school: A joint escort-mode choice model. Transportation 2017, 44, 199–224. [Google Scholar] [CrossRef]
- Olszewski, P.; Wibowo, S.S. Using equivalent walking distance to assess pedestrian accessibility to transit stations in Singapore, Transit: Planning, Management and Maintenance, Technology, Marketing and Fare Policy, and Capacity and Qualtiy of Sevice. Transp. Res. Rec. 2005, 1927, 38–45. [Google Scholar] [CrossRef]
- Vuchic, V.R.; Kikuchi, S. Design of outlying rapid transit station areas. Transp. Res. Rec. 1974, 505, 1–12. [Google Scholar]
- Tirachini, A. The economics and engineering of bus stops: Spacing, design and congestion. Transp. Res. Part A Policy Pract. 2014, 59, 37–57. [Google Scholar] [CrossRef]
- Yang, M.; Wu, J.X.; Zhao, J.Y.; You, Y.T.; Zhang, M.K.; Sun, S.Y. Optimizing Multimodal Transfer Facility Design for Urban Rail Transit Service. Urban Transp. China 2017, 15, 64–69. [Google Scholar]


| Feeding Mode | Regression Model | R2 | Sig. | |
|---|---|---|---|---|
| Access | Walking | y = −7.212 + 0.068x1 + 2.630 × 105x12 − 1.747 × 108x13 | 0.994 | 0.000 |
| Docked bike-sharing | y = 117.062 − 0.257x1 − 0.0002x12 − 3.272 × 108x13 | 0.986 | 0.000 | |
| Private bike | y = 3.026 − 0.018x1 + 4.008 × 105x12 − 7.847 × 109x13 | 0.989 | 0.000 | |
| Private e-bike | y = −19.468 + 0.026x1 + 4.293 × 106x12 − 9.877 × 1010x13 | 0.990 | 0.000 | |
| Taxi | y = −145.618 + 0.204x1 − 7.354 × 105x12 + 8.564 × 109x13 | 0.970 | 0.015 | |
| Bus | y = −19.005 + 0.024 x1 − 1.735 × 106x12 + 4.413 ×1011x13 | 0.987 | 0.000 | |
| Car | y = −12.547 + 0.022x1 − 1.654 × 106x12 + 4.671 ×1011x13 | 0.985 | 0.000 | |
| Egress | Walking | y = −9.005 + 0.090x2 − 1.793 × 106x22 − 8.520 × 109x23 | 0.974 | 0.000 |
| Docked bike-sharing | y = −53.019 + 0.083x2 − 1.619 × 105x22 + 1.311 × 109x23 | 0.992 | 0.000 | |
| Private bike | y = −14.261 + 0.032x2 + 9.282 × 106x22 − 2.471 ×109x23 | 0.988 | 0.000 | |
| Private e-bike | y = −30.122 + 0.061x2 − 1.072 × 105x22 + 7.190 × 1010x23 | 0.992 | 0.000 | |
| Taxi | y = −15.409 + 0.029x2 − 1.763 × 106x22 | 0.920 | 0.021 | |
| Bus | y = −19.774 + 0.022x2 − 1.611× 106x22 + 4.074 ×1011x23 | 0.985 | 0.000 | |
| Car | y = 3.177 − 0.002x2 + 1.826× 106x22 − 8.580 ×1011x23 | 0.960 | 0.000 |
| Feeding Mode | Access (m) | N | Egress (m) | N | ||
|---|---|---|---|---|---|---|
| Mean | 85th Percentile | Mean | 85th Percentile | |||
| Walking | 784 | 1255 | 955 | 777 | 1271 | 775 |
| Docked bike-sharing | 1809 | 2418 | 40 | 1993 | 2969 | 36 |
| Private bike | 1741 | 2469 | 63 | 1761 | 2470 | 39 |
| Private e-bike | 2423 | 3673 | 49 | 2220 | 3679 | 28 |
| Taxi | 3590 | 4785 | 21 | 4467 | 4955 | 16 |
| Bus | 4906 | 8097 | 206 | 5739 | 10506 | 157 |
| Car | 4910 | 8854 | 52 | 7844 | 10605 | 20 |
Publisher’s Note: MDPI stays neutral with regard to jurisdictional claims in published maps and institutional affiliations. |
© 2022 by the authors. Licensee MDPI, Basel, Switzerland. This article is an open access article distributed under the terms and conditions of the Creative Commons Attribution (CC BY) license (https://creativecommons.org/licenses/by/4.0/).
Share and Cite
Li, X.; Liu, Z.; Ma, X. Measuring Access and Egress Distance and Catchment Area of Multiple Feeding Modes for Metro Transferring Using Survey Data. Sustainability 2022, 14, 2841. https://doi.org/10.3390/su14052841
Li X, Liu Z, Ma X. Measuring Access and Egress Distance and Catchment Area of Multiple Feeding Modes for Metro Transferring Using Survey Data. Sustainability. 2022; 14(5):2841. https://doi.org/10.3390/su14052841
Chicago/Turabian StyleLi, Xia, Zhenyu Liu, and Xinwei Ma. 2022. "Measuring Access and Egress Distance and Catchment Area of Multiple Feeding Modes for Metro Transferring Using Survey Data" Sustainability 14, no. 5: 2841. https://doi.org/10.3390/su14052841