1. Introduction
Since 1850, air temperatures in each subsequent decade have been higher than in any previous decade [
1]. Over the last two centuries, human activity has been responsible for a noticeable rise in global average temperatures largely due to increased CO
2 emissions [
2]. The impacts of global warming include rising sea levels, desertification, regional changes in precipitation, and a higher frequency of extreme weather events such as heatwaves [
3]. Approximately three-quarters of all anthropogenic carbon dioxide emissions over the past 20 years have resulted from the extraction and combustion of oil, natural gas, and coal, with nearly half of all anthropogenic carbon dioxide emissions attributed to terrestrial vegetation and the ocean [
3]. Most of the remaining CO
2 emissions are caused by landscape changes, primarily deforestation [
4]. In marine industries, sea vessels have long been a persistent air pollutant, and there are several reasons for this. First of all, this can be attributed to the fact that marine engines are very power-intensive and consume massive volumes of fuel. Secondly, the problem lies in the fuel itself. Marine fuel is a cheap fuel with a higher sulfur content (although levels have been lowered globally in the previous decade), which is, in fact, a byproduct of petroleum refining processes. Thirdly, sea vessels, unlike cars or power plants, are not equipped with exhaust gas cleaning systems, since this problem has not yet been given due attention [
5].
Nowadays, international organizations such as the key maritime regulators including the European Union (EU) and International Maritime Organization (IMO), as well as many countries, have pledged to make contributions in order to change the situation associated with sources of global warming. In 2018, IMO has agreed upon the Initial Strategy on the reduction of greenhouse gas (GHG) emissions from shipping [
6], where the reduction of CO
2 emissions per transport work by 2030 is targeted by at least 40%, pursuing efforts towards 70% by 2050, compared to 2008 [
7]. The European Union member states have agreed to fulfill the goals set under the Paris Agreement [
8] and achieve climate neutrality by 2050. The agreement consists of plans for changes to be made in various sectors of industry and production as well as addressing problems with modern energy production. The ultimate goal is to reduce greenhouse gas emissions and slow down the process of global warming mainly derived from heavy reliance on the use of fossil energy sources in energy production. Correcting this issue requires decisive action to transition to renewable energy sources. In July 2021, the European Commission put forward the ‘fit for 55’ package of legislative proposals, aimed at ensuring the success of the European Green Deal, which includes a set of strengthened emissions reduction targets to each Member State as well as maritime transport urging the need for alternative energy resources.
In addition to conventional renewable energy sources, such as solar, wind, and hydro, most European countries have access to seas or the ocean. These reservoirs contain a massive amount of energy [
9] (pp. 648–654) that is yet to be adapted to suit our society’s needs and power requirements.
First of all, gaining access to such an enormous untapped source of energy will affect consumers such as shipyards, coastal infrastructure, and vessels, all of which are located near the sea, which are increasingly contributing to the global GHG emissions as the share of shipping emissions in global anthropogenic emissions has increased from 2.76% in 2012 to 2.89% in 2018 [
10]. As we will further see a rapid decrease in emissions in other energy production and transportation sectors, the share of shipping will continue to increase [
7]. Applying wave energy technology in less favorable environmental conditions, such as the case of the Baltic Sea, would presumably enable a reduction of greenhouse gas emissions as the consumption of fossil fuels would decrease in the process.
Summarizing the above, it can be argued that, firstly, ships and maritime infrastructure require a lot of energy and greatly pollute the environment. To change this, one possibility is to generate electricity by converting sea waves into electricity. Before realizing this, it is necessary to study in detail the threshold for the appearance of such solutions within the existing infrastructure. This study is the purpose of this article.
The main aim of the work is to assess development limitations and conduct a secondary analysis of the potential for wave energy utilization in the Baltic Sea.
Many published studies, such as [
11,
12], as well as [
13,
14,
15], strive for a mathematical and physical designation of the energy resource of a certain region using various available methods and programs. Our paper shows the difference between a mathematical assessment of the potential of a renewable resource and an analysis of the factors affecting the utilization of wave energy in the Baltic Sea region. Due to this fact, the article will not mention the methods of calculating one or another quantity, and the average values obtained during the study of any environment themselves will be taken directly from the works already carried out. With the help of our research, we desire to proceed beyond the usual methods for assessing the potential for generating wave energy in a region. Our focus will be directed to the study of the opinions of future users and local governments, the analysis of the digital environment, and the analysis of studies already carried out on the calculation of the main parameters of the Baltic Sea region. An important aspect of this work is the possibility of combining already written articles on different topics under one topic and reconsidering the installation of a wave energy converter as a set of tasks that need to be solved. The article is based on the principle of secondary analysis of literature on the subject of limitations in the Baltic Sea. Statistical second-hand data and direct research results were collected (survey), thanks to which the range of limitations was indicated where possible.
This article is structured as follows: In
Section 2 the description of the study area is given. In
Section 3 the current state of wave energy application at the Baltic Sea is analyzed in the light of previous research in the area and with modern measurement techniques. Together with this we provide analyses from tidal and wave appliance supplies, which are publicly traded.
Section 4 gives results of the analyses of the Baltic Sea region from the perspective of a number of limitations to wave energy investments and ends examining a small-scale survey result of the Estonian maritime and energy experts concerning the marketability of the wave energy in the region. Research is drawn together in
Section 5, where discussion is provided with suggestions for future research avenues. Overall conclusions are provided in
Section 6.
2. Description of the Study Area
Before beginning the process of developing methods, attracting innovative technologies, and adapting our energy systems for generating electricity from the sea, it is necessary to consider in detail all the factors that directly affect the location itself and the sea or ocean, where energy generation is planned [
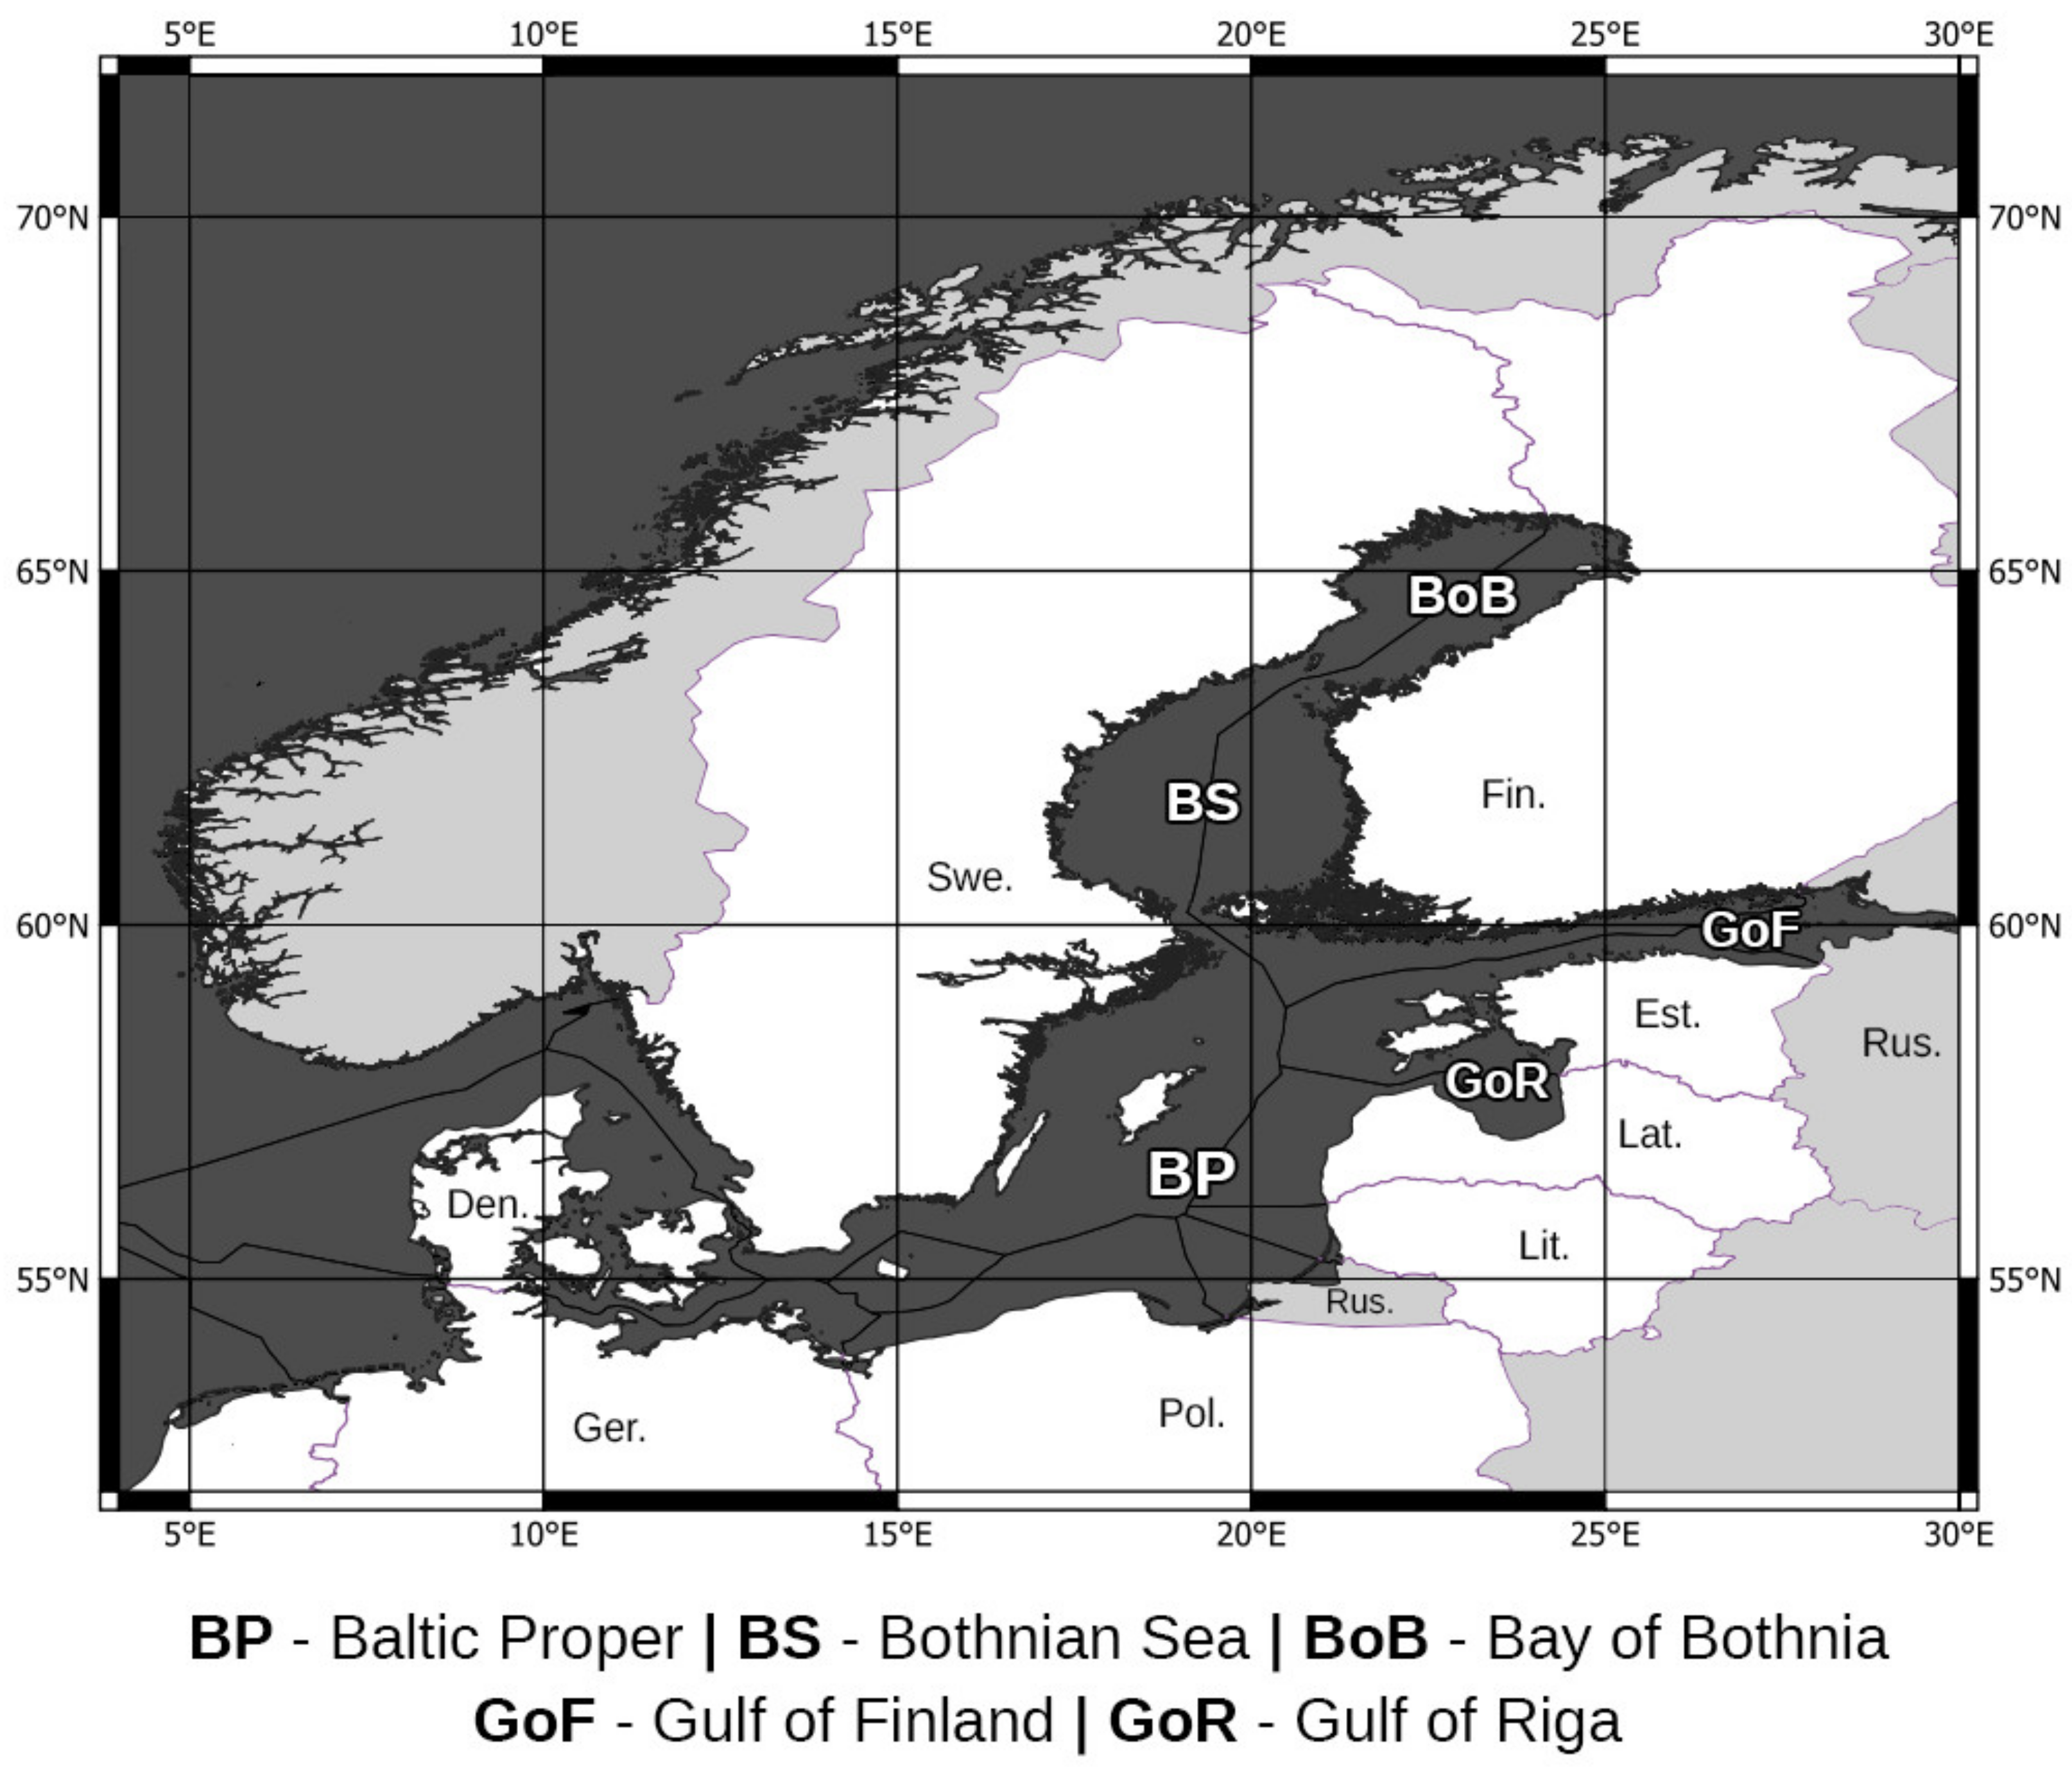
16]. This article examines the influence of these various factors on the emergence of wave energy as a power source in a particular region. For this study, the region selected is the Baltic Sea area. The study area of this research, the Baltic Sea (BS), is located at 10°–30° E and 54°–66° N (
Figure 1).
The sea is surrounded by nine sovereign states, all but one of which are member states of the European Union. The total area of the BS is 435,000 km², and the BS catchment area is home to about 80 million people [
17]. The Baltic marine area accommodates 2000 ships at any given moment and about 3500–5500 ships navigate through the Baltic Sea per month according to the data based on Helcom AIS [
18].
3. Current Status
Judging by the latest publications on the state of energy potential in the Baltic Sea, we can conclude that the opportunity of obtaining electricity from the Baltic Sea waves is well-established, but the application of existing technologies in the Baltic Sea is still a long way off from coming into wide-scale reality [
13,
19]. The development of wave and tidal energy in the Baltic region is only taking its first steps in the adaptation process. In the last decade, the first few attempts have finally been made to assess this untapped energy resource [
20,
21]. These estimates and summaries need to be studied in more detail and further expanded, but so far, they have helped characterize the field of study and made it possible to establish the primary boundaries for the emergence of the wave energy industry in the BS countries [
14,
15]. A clear understanding of wave energy estimates helps researchers and developers of wave energy converters (WECs) to adapt the converters more effectively to a specific location, presuming that these restrictions are generally tied to a specific location and may not be altered for a very long time.
In regard to the modern market of devices and programs that allow us to measure and calculate the energy potential of the Baltic Sea today, in the context of this article it is necessary to proceed from the practical needs of sea wave energy converters. An essential component in the real usage of WECs is the short-term prediction of wave energy at the deployment site. For the Baltic Sea, several tools and combinations of them can be utilized rather successfully. A fleet of small and inexpensive wave buoys (e.g., Spotter and LainePoiss, [
22,
23]) combined with machine learning methods [
24] could be used for rapid and iterative prediction, while the third-generation spectral models running at Marine Forecast Centers provide accurate spatiotemporal forecasts updated at least twice a day. The repeat cycles of Sentinel-1 also provide the opportunity to obtain a spatial nowcast field of wave parameters at least every other week [
25]. Overall, the possible synergy between models, buoys, and remote sensing products allows for timely and reliable prediction of wave energy in the Baltic Sea.
Looking at the economic aspect, tidal and wave energy as a business is also taking its early steps, and there are several publicly traded companies in the world which provide solutions (appliances) to this area (e.g., Ocean Power Technologies (Princeton, NJ, USA), Eco Wave Power Global (Stockholm, Sweden), and Carnegie Clean Energy Ltd. (North Fremantle, Australia)).
Figure 2 illustrates the revenue development of two of these suppliers in recent years (as Eco Wave Power Global did not report any revenue in this period).
It should be noted that revenues are rather small (a few million at best), and it is very difficult to draw any longer-term projections out of these two companies. It could be concluded that activity on a revenue basis was higher in 2013–2017, and the last three observation period years have been much lower. All of these three companies have shown substantial deficits in each year of observation period (2013–2021). This is of course understandable as the technology is new and application areas (geographic and technology) are still not fully known. Shareholder value has eroded over the years, and valuations were much higher in both
Figure 1 companies in the early parts of the observation period (and even before this, around 2007–2010). It should be noted that two of these analyzed companies have spent approximately a decade in the wave energy branch without financial success, and this is a rather long time compared to the clean energy “valley of death” period stated by Miller and Sterman [
28]. In general, it is known, these start-up companies should have an excessive amount of capital, which is not seeking quick returns. This is in order to meet revenue growth and profitability targets later on [
29].
Supplying appliances for green energy production is, in general, a difficult business area as energy production units are small (compared to power plants, such as coal or hydro) and in the end, electricity and energy prices together with the competition for production alternatives are defining the feasible area of operation and scale of business. In previous decades, continuous price erosion has also been present in clean energy products, which increases the difficulties of managing a profitable business [
30] (p. 122), [
31]. For example, Eco Wave Power Global [
32] mentions licensing in annual reports numerous times as a strategy to sell and initiate large-scale projects. This approach will take time to produce revenues; however, it could be an appropriate choice for small entrant companies in this new business area. Similarly, two other companies are also providing other products and services in addition to tidal/wave appliances. For example, these include solar power production units at sea, backup power appliances, moor power production, consulting, and data analysis [
26,
27]. This all illustrates well that the sector is still under development, and even in ocean areas, it is difficult to make it a viable business. As our study concerns the Baltic Sea region, this gives business prospects new perspectives and caveats. Energy and electricity production needs to significantly change (prices to remain high for years), and emissions payments (CO
2) need to stay at a high level for wave and tidal energy production to become a financially sound investment.
4. Results
In the following sub-sections, the entry threshold and the main characteristics of the BS wave energy market will be considered. The first set of features determining the usability of wave energy in the region is associated with the natural characteristics—BS available wave energy resource and the water conditions. Natural conditions are complimented by the second set of features, i.e., “overall conditions”, making business possible comprising of the economic, legal, and technical situation set by marine traffic, sea areas protection, availability of data, and overall expectations from the market participants.
4.1. The First Limitation: Available Energy Resource
For a successful and long-term as well as economically viable conversion of sea wave energy into electricity or heat, it is necessary that a specific amount of the resource in a specific place goes to the section of the device where the resource will be taken. Since wave direction, height, period, and length change regardless of human desire, it is necessary to look for a place with more or less constant parameters. The waves in the Baltic Sea are dominated by the interaction between wind and water surface. The average wind speed in the Baltic Sea region usually remains in the range of 6–10 m/s [
21]. Unfortunately, unlike the open ocean, waves in the Baltic Sea cannot sufficiently grow as the maximum path along which waves can travel in a straight line (fetch) is 800 km [
33]. The maximum recorded significant wave height in the Baltic Sea is 8.2 m [
34] and the average significant wave height is half a meter [
21]. Resource analysis was carried out only for parts of the Baltic Sea, and as such is not representative of the entire Baltic Sea surface (stated in the current state section). The coasts feature a large number of bays and islands, which cause the long wave to break and fade.
Primary simulations of the energy resource were carried out for the territorial waters of Estonia in the Baltic Sea, and these showed that the amount of available resource in the Estonian territorial waters, which cover an area of 36,500 km² (8.4% of the total BS area), is equal to 611 MW, and about 73% can be industrially used [
13]. Since the energy flow is low and it is scattered over the area of the Baltic Sea, there is a limitation on the size and design of the device that converts kinetic energy of the sea wave into electricity or heat.
4.2. The Second Limitation: Water Conditions
A feature of the hydrological regime of the Baltic Sea is a large excess of brackish water formed due to precipitation and river runoff. The total river inflow into the sea together with atmospheric precipitation is approximately 660 km³ of freshwater per year, which forms a partially desalinated upper layer of the reservoir and reduces its salinity in general. According to the simulations carried out in the Baltic Sea region [
35], the salinity of seawater decreases from the Danish straits, connecting the Baltic Sea with the North Sea, to the northeast. In the Danish Straits, salinity is 20 g/kg at the sea surface and 30 g/kg at the bottom. Towards the center of the sea, salinity decreases to 6–8 g/kg near the sea surface in the north of the Gulf of Bothnia, dropping to 2–3 g/kg in the Gulf of Finland to 2 g/kg. Salinity increases with depth, reaching 13 g/kg in the center of the sea at the bottom. Due to a difference in salinity, it becomes necessary to simulate the salinity of the location before proceeding with the installation of the device in the sea for a period including winter. For this, it is convenient to use the three-dimensional coupled ice–ocean model for the Baltic Sea, e.g., the Rossby Centre Ocean model [
36]. The tides in the Baltic Sea are semi-diurnal and diurnal, but their magnitude does not exceed 20 cm. Based on this, the application of tidal power plants in the Baltic Sea is rather strongly limited.
During wintertime, the intensity of sea waves in the Baltic Sea increases. Therefore, it is the winter months that are most productive in terms of efficiency of energy production for converting sea waves into electricity. However, the probability of ice cover accumulation in the Baltic Sea increases during the winter season [
37]. If we analyze the observations from the period 1971–2000 on the average, the Gulf of Bothnia is frozen 101 days a year. The maximum period of ice coverage was recorded in the Finnish port of Kemi in the Gulf of Bothnia, where water was covered with ice for 181 days, whereas the minimum, close to 0 days of ice coverage, was demonstrated by Baltic Proper region [
38]. Due to the risk of ice accumulation it is necessary to prepare converters for these extreme conditions. The simplest method is to remove wave energy converters and associated installations for the winter.
Since most wave energy converter types require anchoring, one of the possible ways to slow down icing while continuing to generate electricity is to direct part of the generated energy towards heating or artificially localizing water at the point of wave energy conversion, which would slow down the process of freezing. It is also possible to choose the location for the installation as close as possible to the point of connection with the Atlantic Ocean in the Danish Straits, where the salinity of the water and the average annual air temperature are higher.
Ice is dangerous for converters as it obstructs moving parts and interferes with the operation of mechanical drives. Therefore, it is necessary to resort to the use of special anti-icing methods, treating surfaces with special paint and using materials and components designed for use at low temperatures.
4.3. The Third Limitation: Marine Traffic
The Baltic Sea is an integral part of the economy and trade of the entire Baltic region. The Baltic Sea is mainly used today as a source of food and transport. More than 100 ports and nine countries located on the shores of the Baltic annually cause tension in the field of maritime traffic, which is why the Baltic Sea is rightly considered one of the busiest places on the Earth. It takes up about 15% of the total movement of goods via ship transport (cargos) in the world [
39] (
Figure 3).
Such congestion can interfere with predicted electricity production. Ports and coastal infrastructure are complex major consumers of energy that needs to be produced locally. Converting sea waves into electricity could be one such source [
41].
During the COVID-19 pandemic, in 2020 and at its peak in mid-2020, seaworthy traffic was halved [
42]. This situation can be attributed as
force majeure, and in the future, it is predicted that the number of vessels moving in the Baltic Sea will continue to grow by 5% per year [
43].
The installation of wave energy converters at sea can seriously affect transport lines. Therefore, when building wind and wave parks at sea, the location of trade and other sea routes should be seriously considered. A study conducted in 2019 [
44] shows that in areas where renewable energy devices are installed, navigation has decreased by 35%. This has mainly led to a change in the trajectories of movement of large vessels and is caused by the fact that ships, by changing the trajectory of their movement, reduce the risk of collision with objects in water. There is a possibility that this will be considered a serious obstacle to the installation of wave energy converters in the Baltic Sea. Therefore, first of all, it is necessary to consider the possibility of installing converters in areas that are not loaded with traffic, such as areas under nature protection and already existing infrastructure (e.g., ports).
4.4. Fourth Limitation: The Lack of Open Access Wave Energy Web-Based Databases
In addition to the natural factors listed above, the emergence of wave energy converters in the Baltic Sea is hampered by the lack of a unified, open access database and energy maps for preliminary simulation of devices in this region. At the moment, any assessment of the resource is possible only through the analysis of published scientific articles (see
Section 3), which greatly reduce the accuracy and possibility of predicting the amount of both the resource itself and other parameters such as profit from the sale of electricity. This makes each project unique and, as a result, prohibitively expensive. Based on the research data evaluated within the framework of this article, it is possible to track similar trends by linking them to the production of electricity from wind or sun.
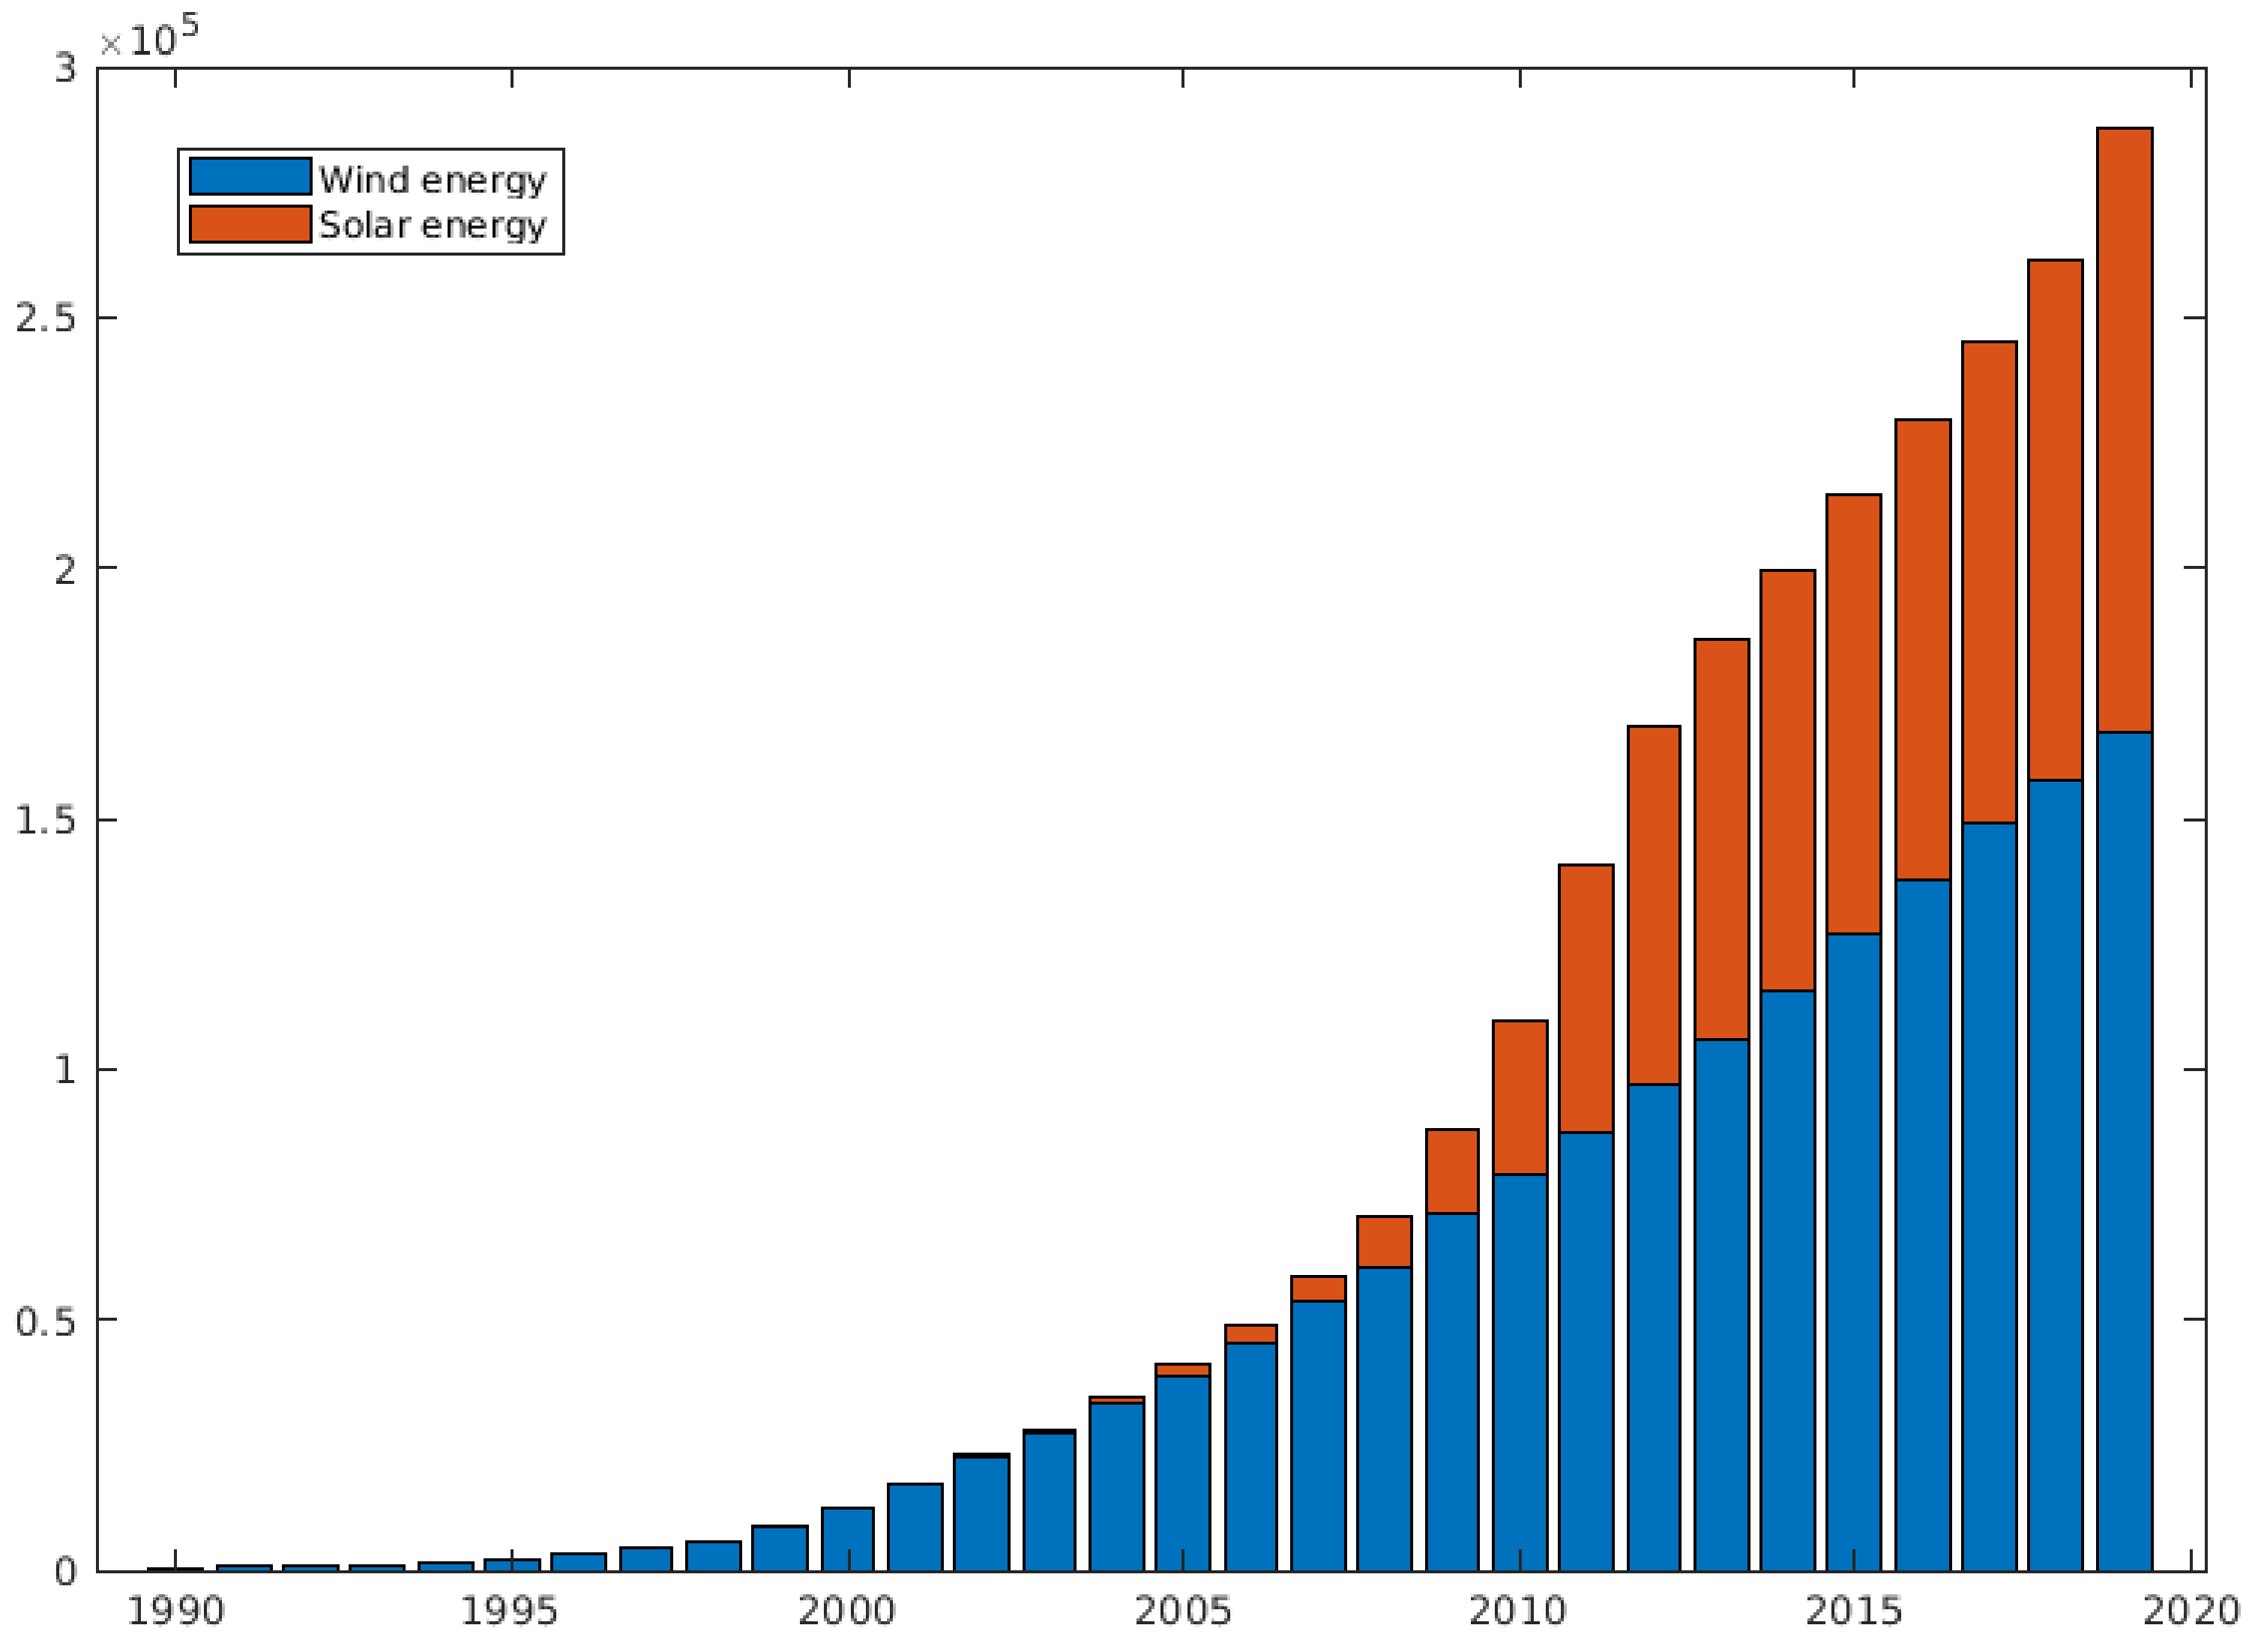
For example, in 2005, interactive databases began to appear, which made it possible to conveniently explore locations throughout Europe and receive preliminary data on the generation of electricity from solar radiation based on online simulations, e.g., PV-GIS [
45]. After that, exponential growth began in the solar energy sector that has continued to this day (
Figure 4).
A similar situation can be observed with wind energy, where the active development of mathematical simulation and the emergence of convenient applications for calculation began somewhat earlier, actively starting from 1995 first with ECMWF ERA-15, and then 1998–2003, when ERA-40 Reanalysis data was first implemented in web-based interactive wind energy models [
46].
According to Eurostat [
47], in 2019, the total maximum electrical capacity of solar energy within 27 European countries was 120,384 MW and the amount of wind energy was in turn 167,140 MW.
An important factor to account for is that due to the small concentration of the wave energy resources in the Baltic Sea, generated energy will be directed primarily to supporting small consumers (up to 50 kW). These include lighthouses, marinas, ports, and various remote electrical devices such as measurement buoys. Therefore, it is cost-prohibitive to attract major research centers for such power generation calculations, and as in the case of solar panels, it will be much more convenient to use interactive applications available on the web. In other words, the limitation is the lack of an opportunity for an entrepreneur engaged in developments in the field of converting sea waves into electricity to simulate his/her device in a digital environment in the location, where it is subsequently oriented.
4.5. Fifth Limitation: Protected Sea Areas
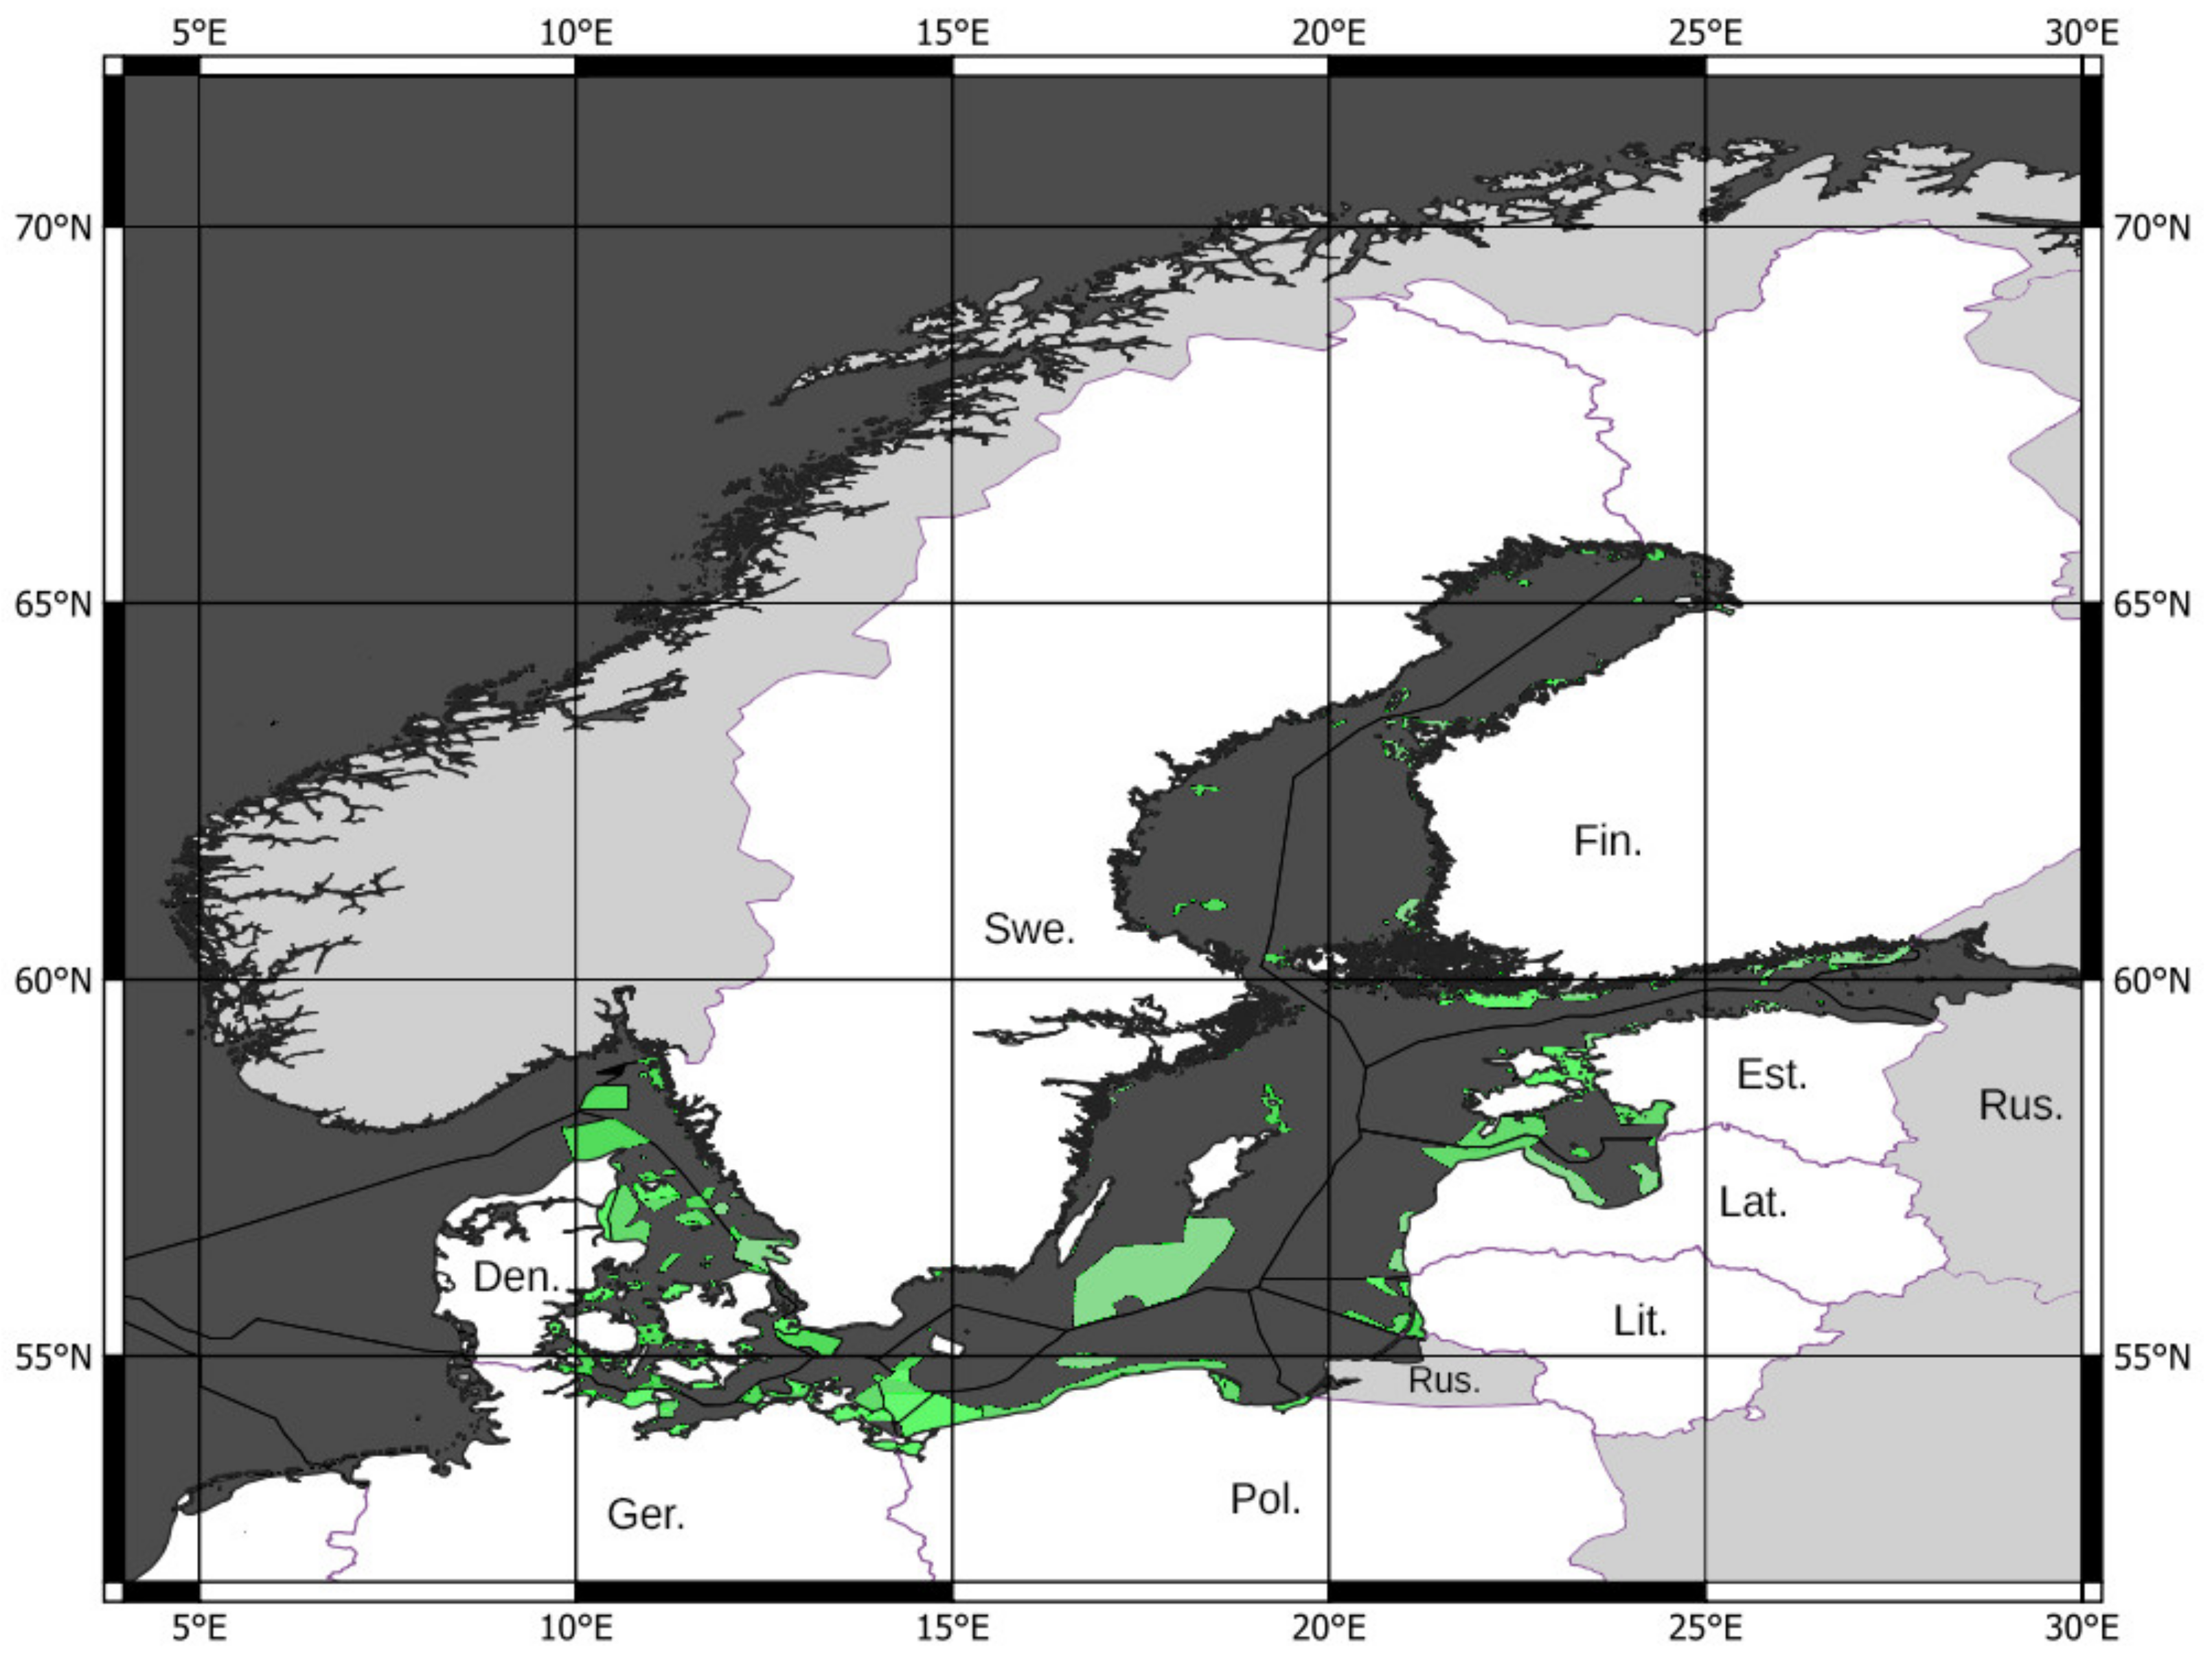
The availability of the sea wave resource is the most important factor in assessing the possibilities of its exploitation. Some of the resource limitations are associated solely with political decisions, most of them related to environmental protection regulations. Natura 2000 is one of the largest environmental protection networks with a protection network covering the Baltic Sea region. The total coverage by marine protected areas in the Baltic Sea region is 11.7% [
48] (
Figure 5).
This network, drawing on the experience of member states, is set up to prevent harm caused by anthropogenic activities to individual areas in the region. Some of the restrictions apply to the entire region; some are inherent to individual territories in the Baltic Sea. Compliance with the rules established in kind is monitored by the local environmental protection centers of the member countries of the system [
16].
When installing equipment at sea, it is important to take into account that some pieces of equipment tend to become artificial reefs. Thus, an important aspect is to analyze the integration of a particular location with a specific device [
49]. In some cases, the installation of sea wave energy converters does not spoil the balance of flora and fauna, but instead restores it in a particular place by providing a new habitat for wildlife.
4.6. Role of Local Public Opinion in Regulation
While technological and environmental factors play a major role in the adoption and installation of renewable energy sources, it has to be understood that the entire planning process is not solely an entrepreneurial, but also a political process. The process of marine spatial planning (MSP), which brings together various users of the sea to ensure that a compromise can be reached for human activity, is a major tool for resolving such processes in the European Union [
50]. A major part of MSP is the involvement of local communities, which may oppose offshore projects for reasons ranging from economic to aesthetic. Therefore, public support is vital for the implementation of offshore projects, including wave energy.
As the development of wave energy lags significantly behind the success enjoyed by solar and wind sectors, public awareness of wave energy technologies is limited. However, it is safe to assume that public opinion towards wave energy projects would be influenced by similar factors to its closest well-established counterpart—offshore wind. Additionally, as offshore wave energy converters would use infrastructure largely influenced by off-shore wind parks, and likely form combined wind–wave parks using the same infrastructure, it can be presumed that they would also face similar scrutiny from environmentalists and economic groups. As such, we can roughly estimate the primary factors in public opinion on wave energy development by comparing them to public issues faced by offshore wind energy.
While renewable energy enjoys an unprecedented level of popularity in Europe, with 90% of Eurobarometer respondents across the European Union and the United Kingdom agreeing that the EU should encourage more investment in renewable energy [
51] and 72% of respondents in Estonia supporting the construction of offshore wind parks [
52], the factor that truly impacts marine spatial planning is what can be described as community acceptance, i.e., local public opinion. Therefore, public acceptance and community acceptance should not be conflated when developing an offshore project. As previously mentioned, 72% of Estonian respondents support the construction of offshore wind parks and 64% would support offshore wind development in their immediate vicinity; however, 62% of respondents also believe that they have not been provided with sufficient information about wind energy, and only a mere 24% believe that local opinions are seriously taken into consideration during wind energy development [
52]. We can conclude from this that the pros and cons of offshore energy development should be better communicated with local populaces during early development phases to prevent misunderstanding and conflict.
However, it should be noted that unlike towering offshore wind turbines, the majority of wave energy converter designs are located either on sea level or submerged below it, making wave energy converters more comparable to distant stationary vessels than horizon-obstructing towers. Based on that, we can presume that the visual impact of wave energy farms would be significantly less controversial than offshore wind for groups concerned with the aesthetic impact. Additionally, the issue of noise pollution would likely be completely negated by the distance between the converters and the coast as well as the low position of the converters, while the concern for local wildlife has been addressed in the previous limitation section.
So far, the process of developing offshore energy, e.g., in Estonia has been slowed down by local opposition in prospective regions. Notably, the planning of Estonia’s would-be offshore wind park faced organized resistance from a loose coalition of local objectors and local municipalities [
53]. As such, while the impact of public opinion may seem marginal, it may decide whether a perfectly fit and economically viable technology is implemented or not.
4.7. Marketability of Wave Energy
In May and November 2021, a questionnaire was distributed among 59 stakeholders within a variety of domains of the maritime field and the related energy sector. Respondents all originated from Estonia, which is a European Union member country besides the Baltic Sea in the North East. We received 20 responses from stakeholders, which makes our response rate 34%. One-fourth of the answers came from “educational and research institutions”. This was followed by “business organizations” and “industrial enterprises of the maritime sector” which together had a 15% share. The rest of the responses arose from “shipping companies” (10%), organizations involved in “navigation marking activities” (10%), and “services” and “maritime consulting and project management” (last the two together reached 10%). Individual responses were provided by “ports”, “public administration”, “fleet management”, “energy management organizations”, “terminal access systems providers” and “communication and monitoring systems providers”, as well as “IT”.
In addition to the first question about the field of operation of the respondent, the questionnaire consisted of five other questions. Twelve out of twenty respondents had heard of the possible usage of wave energy in their field of activity (question 2), of which eight indicated the possibility of using wave energy (question 3) for electricity production in general, and four announced specific possibilities of using it for floating and portable devices. One of the responses indicated that offering flexibility in energy production also provides an opportunity to create new business models in the energy sector with new IT solutions.
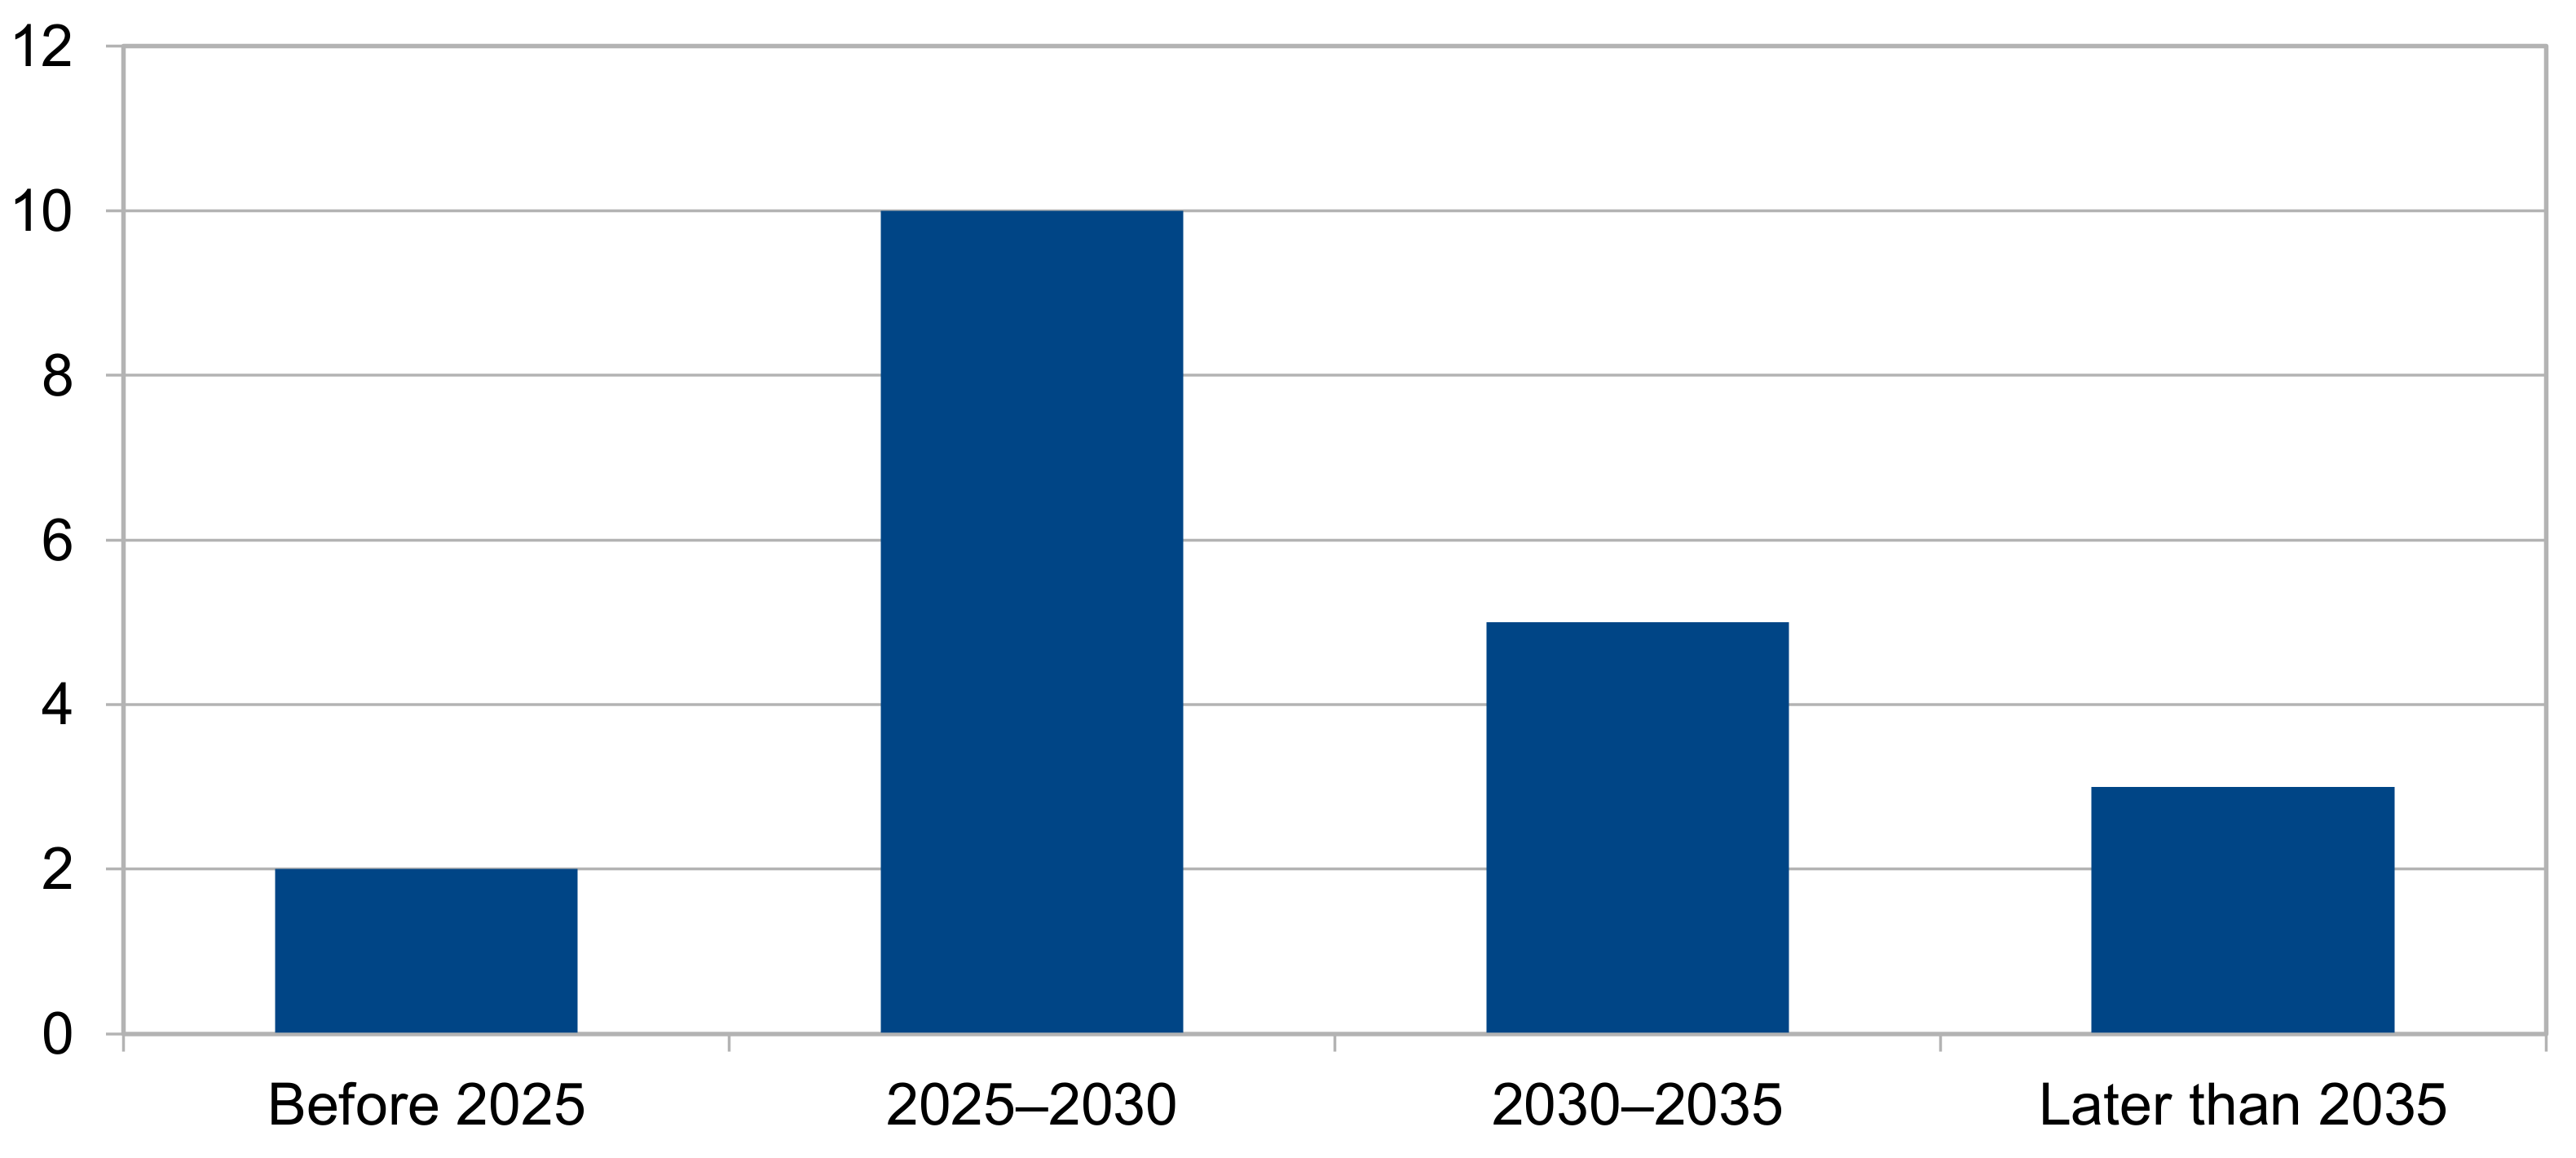
Responses to question 4 (
Figure 6) indicate that half of the respondents see wave energy as an alternative to current energy sources already in the years 2025–2030, 10% see it possible before 2025, while 25% indicate the same for the years 2030–2035, and only 15% can see it in 2035 and later. So, based on responses, the most probable implementation time is after 2025, and investment activity should continue well into the 2030s.
The majority of the respondents (85%) had an opinion that it would be possible to use wave energy outside of their field of operation (question 5). Respondents also identified fields, which presented possible usage areas (
Table 1). These usage areas are also rather similar with earlier analyzed publicly traded companies, and their expanding versatility of wave energy technology. In maritime sector wave energy is seen as additional energy form, or to be applied in specific smaller applications or within remote areas. Apart of maritime industry, sector of “other industries” was mentioned, however, these responses are rather general, and lack a specific application area.
What is known from applications built in the world, these other industries are rare, and wave energy is typically sea port or sea operations centered.
The results of the questionnaire show sector stakeholders’ support and interest in applying wave energy in various sectors and a general expectation of wave energy’s imminent emergence. It could be some sort of indication that earlier investments on green energy, such as wind power, have demonstrated that green energy production is at the very least a good addition to the energy production mix.
5. Discussion
Currently, the number of design concepts for wave energy converters has exceeded a hundred, and the number of prototypes used has exceeded half a hundred [
54]. This demonstrates that the development of wave energy technology, which has been ongoing for half a century, will reach the stage of active use, similar to the development history of solar energy in the form of solar panels. The study of the entry threshold and the environment of the area where installation is planned helps speed up the process of the emergence of sea wave energy converters on the market and in mass production. This research is a primary analysis of the obstacles that do not directly depend on the status of technology itself. The technology is already present, while a single standardized method for converting sea waves into electricity is not.
Based on the first limitation presented in this article, we can conclude that it is necessary to improve the quality of marine wave resource assessment using alternative methods, a comparison of methods, and a range of corrections to them. This will make it possible to estimate the reserve of energy resources in the sea waves of the Baltic Sea on the scale of the entire region, not just partially for the waters of each country. If the number of measuring buoys is increased in parallel, then in addition to speeding up the process of assessing the energy reserve, the stations can also be used to control the installed wave energy converters.
Based on the second limitation, we can conclude that ice is a serious problem for the emergence of the wave energy industry in the Baltic region. The winter period is the most interesting from the point of view of power generation, because the peak of the wave activity of the Baltic Sea occurs during winter months. As practice shows, it is necessary to protect the device from ice by using frost-resistant materials or by investigating the possibility of establishing a territory around the installation site that is not allowed to freeze by increasing the temperature or changing the composition of the water. It is advisable to use such a method only if the location is not completely frozen. Additionally, the device can be removed for the winter period as a whole or at the time of the greatest probability of ice cover accumulation.
Analyzing the third limitation, we can conclude that the density of maritime transport lines in the Baltic Sea is growing and even extraordinary events such as the global pandemic reduced it for a very short time period. Based on this, it is necessary to take into account the presence of transport in both directions, both the influence of maritime traffic on the object installed in the sea and the influence of the object on the density of transport.
Analyzing the fourth limitation, we can conclude that the growth of technological development of specific devices for the production of renewable energy has been associated with the emergence of simple software available for the end-user energy developers. The creation of such solutions and databases entails a faster emergence of technologies for the production of sea wave energy in the Baltic Sea region.
Based on the fifth limitation, it can be understood that anyone who wants to install their devices in Baltic Sea waters, must reckon with both local environmental protection regulations and global ones.
It is also important to consider that in some cases regulations and restrictions related to environmental protection can be curbed by the fact that in most cases the anchoring site and underwater infrastructure do not generate waste. On the contrary, they create conditions for the emergence of artificial reefs.
The sixth limitation reminds us of the vital importance of community support for the implementation of renewable energy projects and the power of grassroots activism to stop even the largest developments. However, as the visual and other impacts of sea wave energy devices are insignificant compared to offshore wind or even solar parks, it might be significantly easier to convince local communities to approve sea wave energy use. However, care has to be taken to properly communicate the impact of wave energy to local communities and stakeholders.
As part of this article, an analysis was also carried out through a survey of opinion leaders in the maritime sector of Estonia. Public awareness of wave energy, at least among the maritime sector stakeholders, is supportive, and the industry is open to such alternative energy resources. Although there are currently no WECs present for the Baltic Sea conditions, the general public needs to be briefed on wave energy features and benefits to support the development process and future implementation at all levels. Support from the sector stakeholders endorses the local WECs’ development and testing.
6. Conclusions
As the main aim of the work is to assess the development limitations and potential for wave energy utilization in the Baltic Sea, we can conclude that wave energy utilization in the Baltic Sea is possible, while taking into account the limitations of the study area. Assessing the above-mentioned features, it is evident that some of these are associated with natural parameters. These are constant and we cannot change these, but only adapt to, for example, the amount of available energy resource such as wind (the main source of waves in the study area) in a specific place or quantity of ice in winter. Some of the restrictions are related to already existing man-made structures; when installing devices at sea, it is necessary to consider the intensity of vessel traffic and areas under the protection of various departments. It is important to take into account that sometimes the movement of ships can provoke an additional flow of energy for the WEC and in an area in which the movement of ships is limited, installation of WEC infrastructure can serve to create artificial habitats for flora and fauna. Some of the limitations are related to the presence or absence of collected or calculated data; we can influence this limitation by carrying out new measurements and creating new databases available for users. Some of the restrictions stem from local legislation, which is a way of regulating processes associated with the spread of anthropogenic activities near the shores of the Baltic Sea. We can influence these restrictions using methods and characteristics similar to these restrictions for each specific case and finding and clearly defining the differences from existing legal restrictions, thereby leaving innovation out of their influence. Since the speed of the dissemination of innovative solutions and devices on the market is closely dependent on public opinion, the last part is the constant analysis of opinions. It is necessary to understand to what extent existing public opinion is consistent with the chosen course of development of a particular innovation, and if it is not in agreement, it is necessary to take action to adjust the opinion of the population of the region.
Based on the previous analysis, we can affirm the primary readiness of the region to adopt technology for converting sea waves into electricity. For successful application of the technology in the region, it is necessary to focus on small consumers and to keep the ability to convert energy as long as possible during the winter season. The appearance of a database in the public domain with the ability to indicate the presence of an energy resource in a specific location will be an indicator of the imminent arrival of technology in the region.
Returning to the beginning of the study, we can say that the threshold for access to electricity production using the waves of the Baltic Sea are as follows (where WEC installation is planned): the size of the available energy resource, water conditions including salinity and ice in winter, marine traffic density change, and availability of web-based databases to forecast electricity production. The entry threshold also depends on whether the installation site is within a nature protection area. In the course of this work, no public ethical problems associated with the emergence of a new energy source were found. Moreover, analyzing the answers received from opinion leaders, we can conclude that the majority favors and expresses support for obtaining energy from sea waves. Analyzing the present, it is safe to say that the theoretical analysis, measurement equipment to maintain the efficiency of electricity generation, and the business level of development of the world’s leading companies in the field of wave energy are enough to start the development of the wave energy market in the Baltic Sea region.
Statement
This article is based on the conference article [
11], and has been expanded.
Author Contributions
Conceptualization, N.V., R.P., J.T. and V.A.; methodology, N.V., R.P., J.T., O.-P.H. and V.A.; software, N.V., R.P. and O.-P.H.; validation, N.V., R.P., J.T., O.-P.H. and V.A.; formal analysis, N.V., R.P., J.T., O.-P.H. and V.A.; investigation, N.V., R.P., J.T., O.-P.H. and V.A.; resources, V.A.; data curation, N.V., R.P., J.T., O.-P.H. and V.A.; writing—original draft preparation, N.V., R.P., J.T., O.-P.H. and V.A.; writing—review and editing, N.V., R.P., J.T., O.-P.H. and V.A.; visualization, N.V., R.P., J.T., O.-P.H. and V.A.; supervision, V.A. and O.-P.H.; project administration, N.V., R.P.; funding acquisition, V.A. All authors have read and agreed to the published version of the manuscript.
Funding
The last author (V.A.) was partially supported by an Estonian Research Council Grant PSG22.
Institutional Review Board Statement
Not applicable.
Informed Consent Statement
Not applicable.
Data Availability Statement
Research datasets are available from the author by email request.
Acknowledgments
We thank Sander Rikka for his help in improving the manuscript.
Conflicts of Interest
The author declares no conflict of interest.
References
- Allan, R.P.; Hawkins, E.; Bellouin, N.; Collins, B. IPCC, 2021: Summary for Policymakers. In Climate Change 2021: The Physical Science Basis. Contribution of Working Group I to the Sixth Assessment Report of the Intergovernmental Panel on Climate Change; Masson-Delmotte, V., Zhai, P., Pirani, A., Connors, S.L., Péan, C., Berger, S., Caud, N., Chen, Y., Goldfarb, L., Gomis, M.I., et al., Eds.; Cambridge University Press: Cambridge, UK, 2021. [Google Scholar]
- Bonneuil, C.; Choquet, P.-L.; Franta, B. Early warnings and emerging accountability: Total’s responses to global warming, 1971–2021. Glob. Environ. Chang. 2021, 71, 102386. [Google Scholar] [CrossRef]
- Mandal, S.; Islam, S.; Biswas, A.H.; Akter, S. A mathematical model applied to investigate the potential impact of global warming on marine ecosystems. Appl. Math. Model. 2022, 101, 19–37. [Google Scholar] [CrossRef]
- Da Silva, C.M.; da Silva, L.L.; Souza, T.D.C.; Dantas, T.C.; Correa, S.M.; Arbilla, G. Main Greenhouse Gases levels in the largest secondary urban forest in the world. Atmos. Pollut. Res. 2019, 10, 564–570. [Google Scholar] [CrossRef]
- Schwarzkopf, D.; Petrik, R.; Volker, M.; Quante, M.; Majamäki, E.; Jalkanen, J.-P. A ship emission modeling system with scenario capabilities. Atmos. Environ 2021, 12, 100132. [Google Scholar] [CrossRef]
- The International Maritime Organization (IMO). Initial IMO Strategy on Reduction of GHG Emissions from Ships; UNFCCC Talanoa Dialogue: Bonn, Germany, 2018. [Google Scholar]
- Tapaninen, U.; Palu, R. Recovery of Ro-Pax Ferry Traffic from Covid-19 Under-Tightening Environmental Regulations: Case Helsinki-Tallinn. In Proceedings of the 2022 World of Shipping Portugal, an International Research Conference on Maritime Affairs, online, 27–28 January 2022. [Google Scholar]
- UNFCCC. The Paris Agreement. In Proceedings of the COP 21, Paris, France, 12 December 2015. [Google Scholar]
- Kraemer, D.; McCormick, M. Ocean Wave-Energy Conversion; Academic Press: Oxford, UK, 2019. [Google Scholar]
- International Maritime Organization. Fourth IMO GHG Study; International Maritime Organization: London, UK, 2020. [Google Scholar]
- Pastor, J.; Liu, Y. Wave Climate Resource Analysis Based on a Revised Gamma Spectrum for Wave Energy Conversion Technology. Sustainability 2016, 8, 1321. [Google Scholar] [CrossRef] [Green Version]
- Guiberteau, K.; Liu, Y.; Lee, J.; Kozman, T. Investigation of Developing Wave Energy Technology In the Gulf of Mexico. Distrib. Gener. Altern. Energy J. 2012, 27, 36–52. [Google Scholar] [CrossRef]
- Soomere, T.; Eelsalu, M. On the wave energy potential along the eastern Baltic Sea coast. Renew. Energy 2014, 71, 221–233. [Google Scholar] [CrossRef]
- Bernhoff, H.; Sjöstedt, E.; Leijon, M. Wave energy resources in sheltered sea areas: A case study of the Baltic Sea. Renew. Energy 2006, 31, 2164–2170. [Google Scholar] [CrossRef]
- Jakimavičius, D.; Kriaučiūnienė, J.; Šarauskienė, D. Assessment of wave climate and energy resources in the Baltic Sea nearshore (Lithuanian territorial water). Oceanologia 2018, 60, 207–218. [Google Scholar] [CrossRef]
- Vidjajev, N.; Palu, R.; Terentjev, J.; Hunt, T. Limitations and Opportunities for Wave Energy Utilization in the Baltic Sea: The case-study of Estonia. In Proceedings of the International Association of Maritime Universities (IAMU) Conference, Alexandria, Egypt, 26–28 October 2021. [Google Scholar]
- European Commission. EU Strategy for the Baltic Region; Publications Office of the European Union: Luxembourg, 2018. [Google Scholar]
- Matczak, M.; Meyer, K.N.; Ooms, E.; Schroder, L.; Vološina, M.; Warmelink, H.; Zaucha, J.; Czermański, E.; Coornaert, C.; Koch, A. QUO VADIS: Exploring the Future of Shipping in the Baltic Sea; VASAB, Baltic LINes: Riga, Latvia, 2018. [Google Scholar]
- Kasiulis, E.; Punys, P.; Kofoed, J.P. Assessment of theoretical near-shore wave power potential along the Lithuanian coast of the Baltic Sea. Renew. Sustain. Energy Rev. 2015, 41, 134–142. [Google Scholar] [CrossRef]
- Henfridsson, U.; Neimane, V.; Strand, K.; Kapper, R.; Bernhoff, H.; Danielsson, O.; Leijon, M. Wave energy potential in the Baltic Sea and the Danish part of the North Sea, with reflections on the Skagerrak. Renew. Energy 2007, 32, 2069–2084. [Google Scholar] [CrossRef]
- Björkqvist, J.-V.; Ingvar, L.; Alari, V.; van Vledder, G.H.S.; Petterson, H.; Arno, B.; Männik, A. Comparing a 41-year model hindcast with decades of wave measurements from the Baltic Sea. Ocean Eng. 2018, 152, 57–71. [Google Scholar] [CrossRef] [Green Version]
- Raghukumar, K.; Chang, G.; Spada, F.; Jones, C.; Janssen, T.; Gans, A. Performance characteristics of “Spotter,” a newly developed real-time wave measurement buoy. J. Atmos. Ocean. Technol. 2019, 6, 1127–1141. [Google Scholar] [CrossRef]
- Alari, V.; Björkqvist, J.-V.; Kaldvee, V.; Mölder, K.; Rikka, S.; Kask-Korb, A.; Pärt, S.; Vahter, K.; Vidjajev, N.; Tõnisson, H. Lainepoiss—A Lightweight and Ice-resistant Wave Buoy. J. Atmos. Ocean. Technol. 2022. [Google Scholar]
- Hu, H.; van der Westhuysen, A.J.; Chu, P.; Fujisaki-Manome, A. Predicting Lake Erie wave heights using XGBoost and LSTM. Ocean Model. 2021, 164, 101832. [Google Scholar] [CrossRef]
- Rikka, S.; Pleskachevsky, A.; Jacobsen, S.; Alari, V.; Uiboupin, R. Meteo-marine parameters from Sentinel-1 SAR imagery: Towards near real-time services for the baltic sea. Remote Sens. 2018, 5, 757. [Google Scholar] [CrossRef] [Green Version]
- Carnegie Clean Energy Ltd. Annual Report; Carnegie Clean Energy Ltd.: North Fremantle, Australia, 2021. [Google Scholar]
- Ocean Power Technologies. Annual Report; Ocean Power Technologies: Princeton, NJ, USA, 2021. [Google Scholar]
- Miller, D.S.; Sterman, J. New venture commercialization of clean energy technologies. In Proceedings of the System Dynamics Conference Proceedings, Boston, MA, USA, 29 July–2 August 2007. [Google Scholar]
- Hilmola, O.P. Question of software start-up finance: System dynamics simulation analysis. World Rev. Sci. Technol. Sustain. Dev. 2009, 6, 204–216. [Google Scholar] [CrossRef]
- Milberg, W.; Winkler, D. Outsourcing Economics—Global Value Chains in Capitalist Development; Cambridge University Press: Cambridge, UK, 2013. [Google Scholar]
- Sterman, J. Interactive web-based simulations for strategy and sustainability: The MIT Sloan LearningEdge management flight simulators, Part I. Syst. Dyn. Rev. 2014, 30, 89–121. [Google Scholar] [CrossRef]
- Eco Wave Power Global. Annual Report; Eco Wave Power Global: Stockholm, Sweden, 2020. [Google Scholar]
- Street, S.; Hanson, H.; Larson, M.; Bertotti, L. Modeling the Wave climate in the Baltic sea. VATTEN-J. Water Manag. Res. 2014, 70, 19–29. [Google Scholar]
- Tuomi, L.; Kahma, K.; Pettersson, H. Wave hindcast statistics in the seasonally ice-covered Baltic. Boreal Environ. Res. 2011, 16, 451–472. [Google Scholar]
- Kniebusch, M.; Meier, M.; Radtke, H. Changing Salinity Gradients in the Baltic Sea as a Consequence of Altered Freshwater Budgets. Geophys. Res. Lett. 2019, 46, 9739–9747. [Google Scholar] [CrossRef]
- Meier, M.; Kauker, F. Modeling decadal variability of the Baltic Sea: 2. Role of freshwater inflow and large-scale atmospheric circulation for salinity. J. Geophys. Res. Ocean 2003, 108, 3368. [Google Scholar] [CrossRef] [Green Version]
- Vihma, T.; Haapala, J. Geophysics of sea ice in the Baltic Sea: A review. Prog. Oceanogr. 2009, 80, 129–148. [Google Scholar] [CrossRef]
- Granskog, M.; Kaartokallio, H.; Kuosa, H. Sea ice in the Baltic Sea—A review. Estuar. Coast. Shelf Sci. 2006, 70, 145–160. [Google Scholar] [CrossRef]
- HELCOM AIS. Overview of the Shipping Traffic in the Baltic Sea, Automatic Identification System (AIS); HELCOM: Helsinki, Finland, 2009. [Google Scholar]
- National Geospatial-Intelligence Agency NGA. Global Maritime Traffic Density Service (GMTDS); NGA: Atlanta, GA, USA, 2022. [Google Scholar]
- Cascajo, R.; García, E.; Quiles, E.; Correcher, A.; Morant, F. Integration of Marine Wave Energy Converters into Seaports: A Case Study in the Port of Valencia. Energies 2019, 12, 787. [Google Scholar] [CrossRef] [Green Version]
- March, D.; Metcalfe, K.; Tintoré, J.; Godley, B. Tracking the global reduction of marine traffic during the COVID-19 pandemic. Nat. Commun. 2021, 12, 2415. [Google Scholar] [CrossRef]
- Madjidian, J.; Björk, S.; Nilsson, A.; Halén, T. CLEANSHIP—Final Project Report; Brunel University: London, UK, 2013. [Google Scholar]
- Yu, Q.; Liu, K.; Teixeira, A.; Soares, G. Assessment of the Influence of Offshore Wind Farms on Ship Traffic Flow Based on AIS Data. J. Navig. 2020, 1, 131–148. [Google Scholar] [CrossRef]
- Šúri, M.; Huld, T.A.; Dunlop, E.D. PV-GIS: A web-based solar radiation database for the calculation of PV potential in Europe. Int. J. Sustain. Energy 2005, 24, 55–67. [Google Scholar] [CrossRef]
- Uppala, S.M.; Kållberg, P.W.; Simmons, A.J.; Andrae, U.; Da Costa Bechtold, V.; Fiorino, M.; Gibson, J.K.; Haseler, J.; Hernandez, A.; Kelly, G.A.; et al. The ERA-40 reanalysis. Q. J. R. Meteorol. Soc. 2005, 131, 2961–3012. [Google Scholar] [CrossRef]
- Eurostat. Evolution of Net Maximum Electrical Capacity for Renewable and Wastes in EU-27 (MW), 1990–2019; European Commission: Luxemburg, 2019. [Google Scholar]
- European Commission. Natura 2000. 2021. Available online: https://ec.europa.eu/environment/nature/natura2000/index_en.htm (accessed on 2 May 2021).
- Langhamer, O.; Wilhelmsson, D. Wave Power Devices as Artificial Reefs; Swedish Centre for Renewable Electric Energy Conversion: Upsala, Sweden, 2007. [Google Scholar]
- European Commission. Maritime Spatial Planning. 2014. Available online: https://ec.europa.eu/oceans-and-fisheries/ocean/blue-economy/maritime-spatial-planning_en (accessed on 2 May 2021).
- European Commission. European Attitudes of EU Energy Policy. 2019. Available online: https://europa.eu/eurobarometer/surveys/detail/2238 (accessed on 2 May 2021).
- Emor, K. Tuuleparkide Meelsusuuring (Asessment of Public Opinion about Wind Energy Production); Republic of Estonia, Ministry of Economic Affairs and Communications: Tallinn, Estonia, 2021. [Google Scholar]
- Tafon, R.; Howarth, D.; Griggs, S. The politics of Estonia’s offshore wind energy programme: Discourse, power and marine spatial planning. Environ. Plan. C Politics Space 2019, 37, 157–176. [Google Scholar] [CrossRef] [Green Version]
- Clemente, D.; Rosa-Santos, P.; Taveira-Pinto, F. On the potential synergies and applications of wave energy converters: A review. Renew. Sustain. Energy Rev. 2021, 135, 110162. [Google Scholar] [CrossRef]
| Publisher’s Note: MDPI stays neutral with regard to jurisdictional claims in published maps and institutional affiliations. |
© 2022 by the authors. Licensee MDPI, Basel, Switzerland. This article is an open access article distributed under the terms and conditions of the Creative Commons Attribution (CC BY) license (https://creativecommons.org/licenses/by/4.0/).


