
Identification of the Right Moment for Motor Vehicle Replacement—Life-Cycle Analysis in Serbia and Montenegro


 , , and
Abstract
:1. Introduction
- What are the main business, market and environment indicators of influence that define the active use and end-of-life phases in the life cycle of a motor vehicle?
- Is it possible to define the specific indicators of influence, depending on the type of vehicle?
2. Literature Review
2.1. Indicators Defining the Life-Cycle Phases of Motor Vehicle Use
- Motor vehicles in use are being replaced faster with the rise of models using new technologies, as analyzed by Bajpai [36] and Vanderseypen [37], who defined differences within the lifespan of a vehicle related to environment and technology; Drahokoupil [38], EC [39] and PwC [40] identified a business perspective influencing the driver’s rationale;
2.2. Separating Active Use from the End-of-Life Phase of a Life-Cycle
3. Methodology
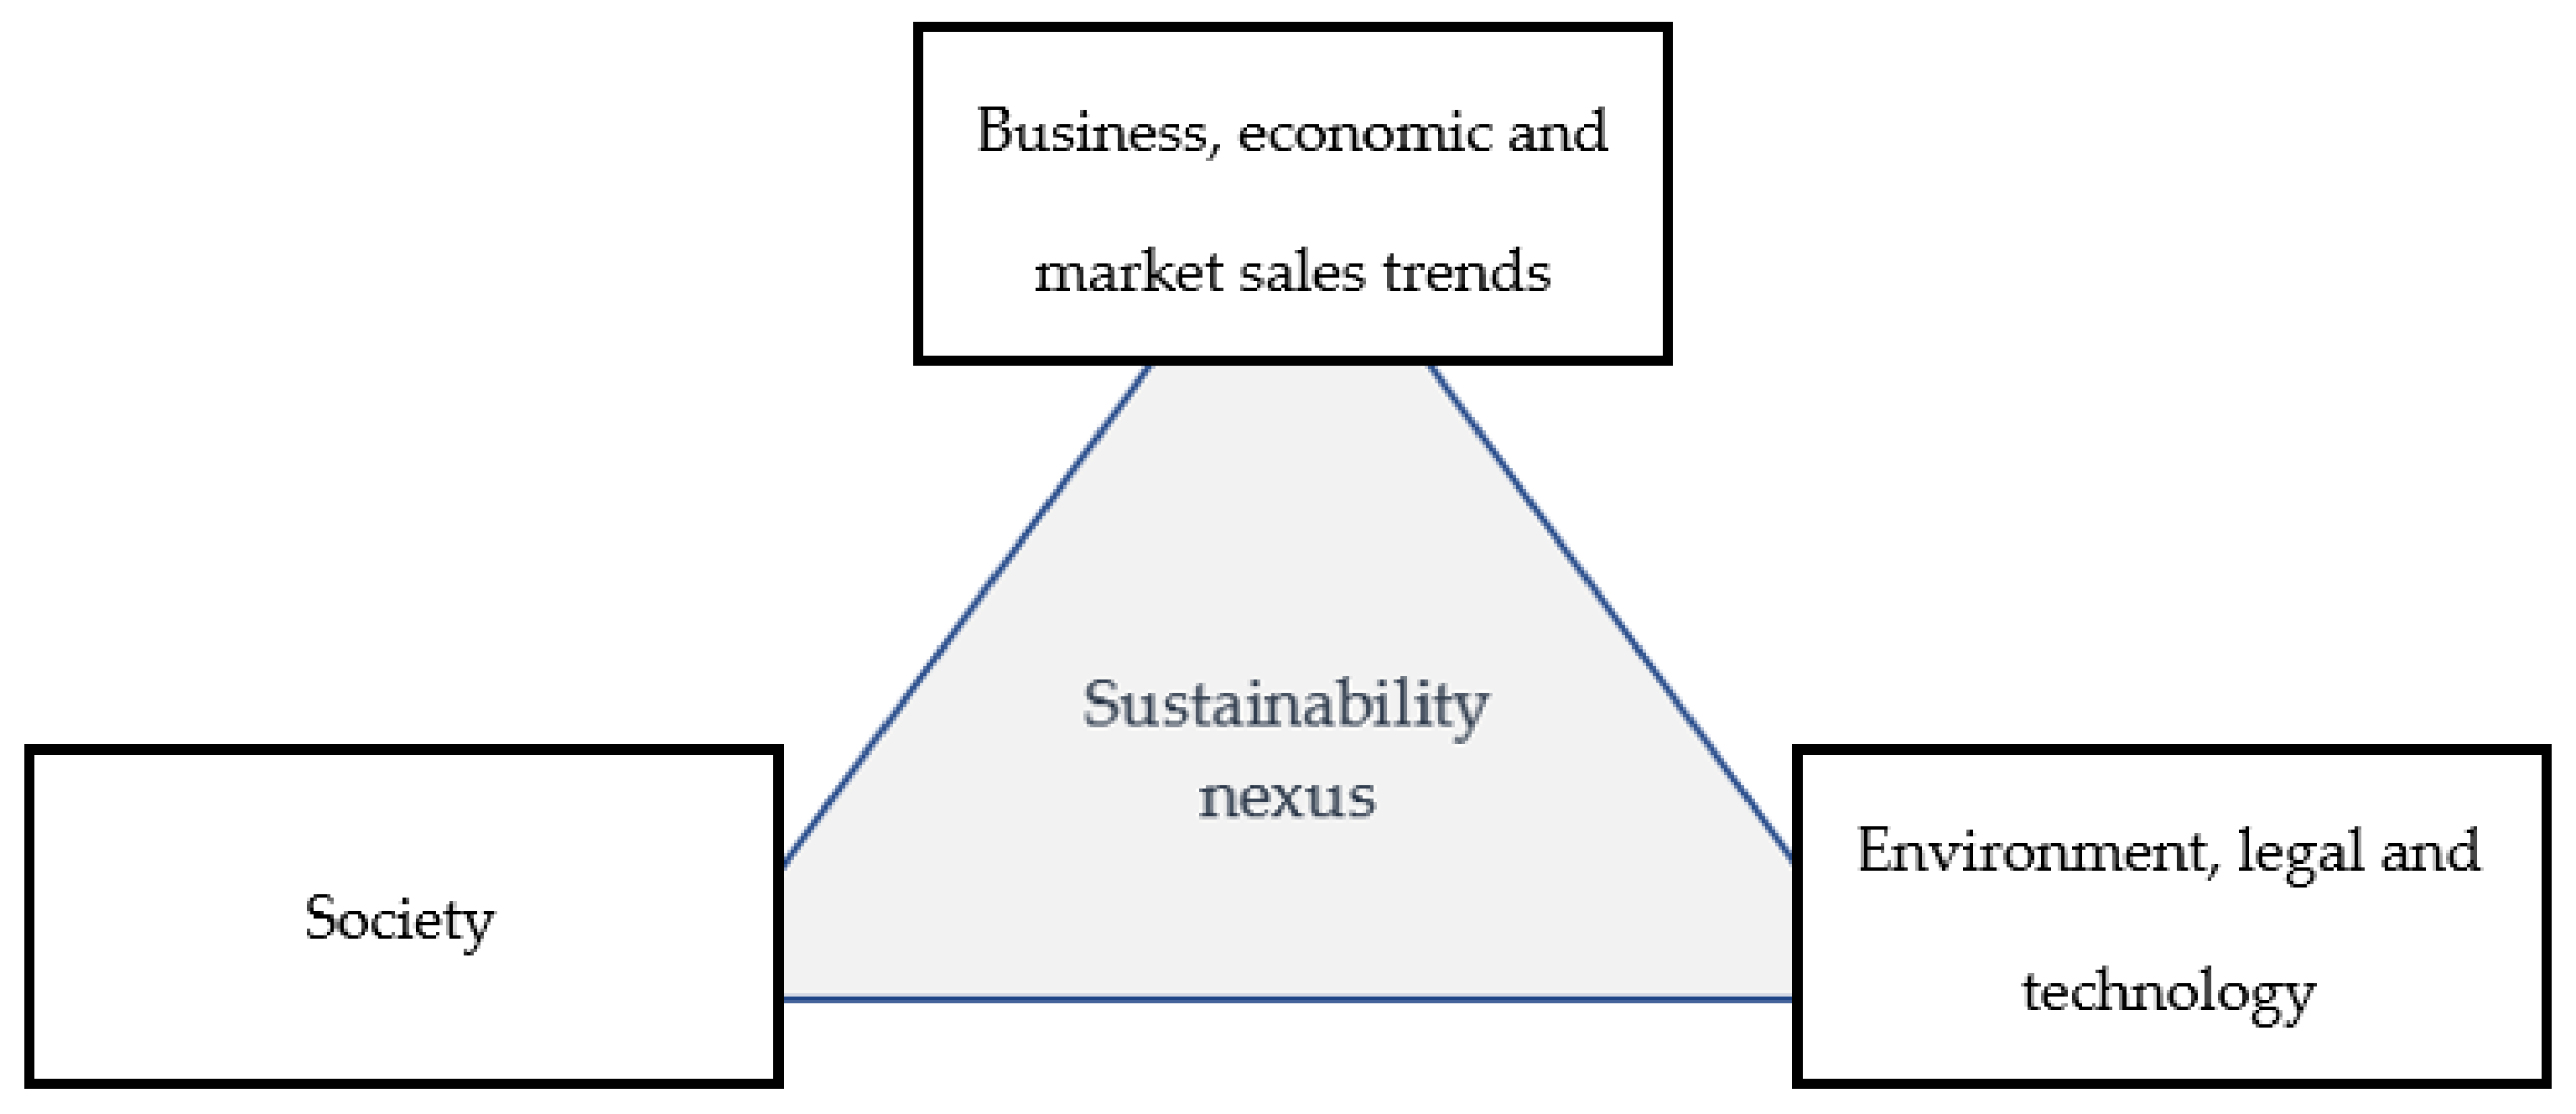
3.1. Framework
- Environment (engine technology) and legislative indicators;
- Business/economic indicators and market sales trends of new/used motor vehicles;
- Societal indicators.
3.2. Variables Definition and Hypothesis Formulation
- Private vehicles (mostly passenger cars; see Appendix B for details);
- Commercial vehicles (cars, vans, trucks; see Appendix B for details).
- To determine what defines the active use phase of a motor vehicle’s life cycle, in terms of the different indicators of influence,
- To determine what defines the end-of-life phase of a motor vehicle’s life cycle, in terms of the different indicators of influence,
- To determine whether it is possible to distinguish between life-cycle phases depending on the vehicle type (passenger or commercial vehicle).
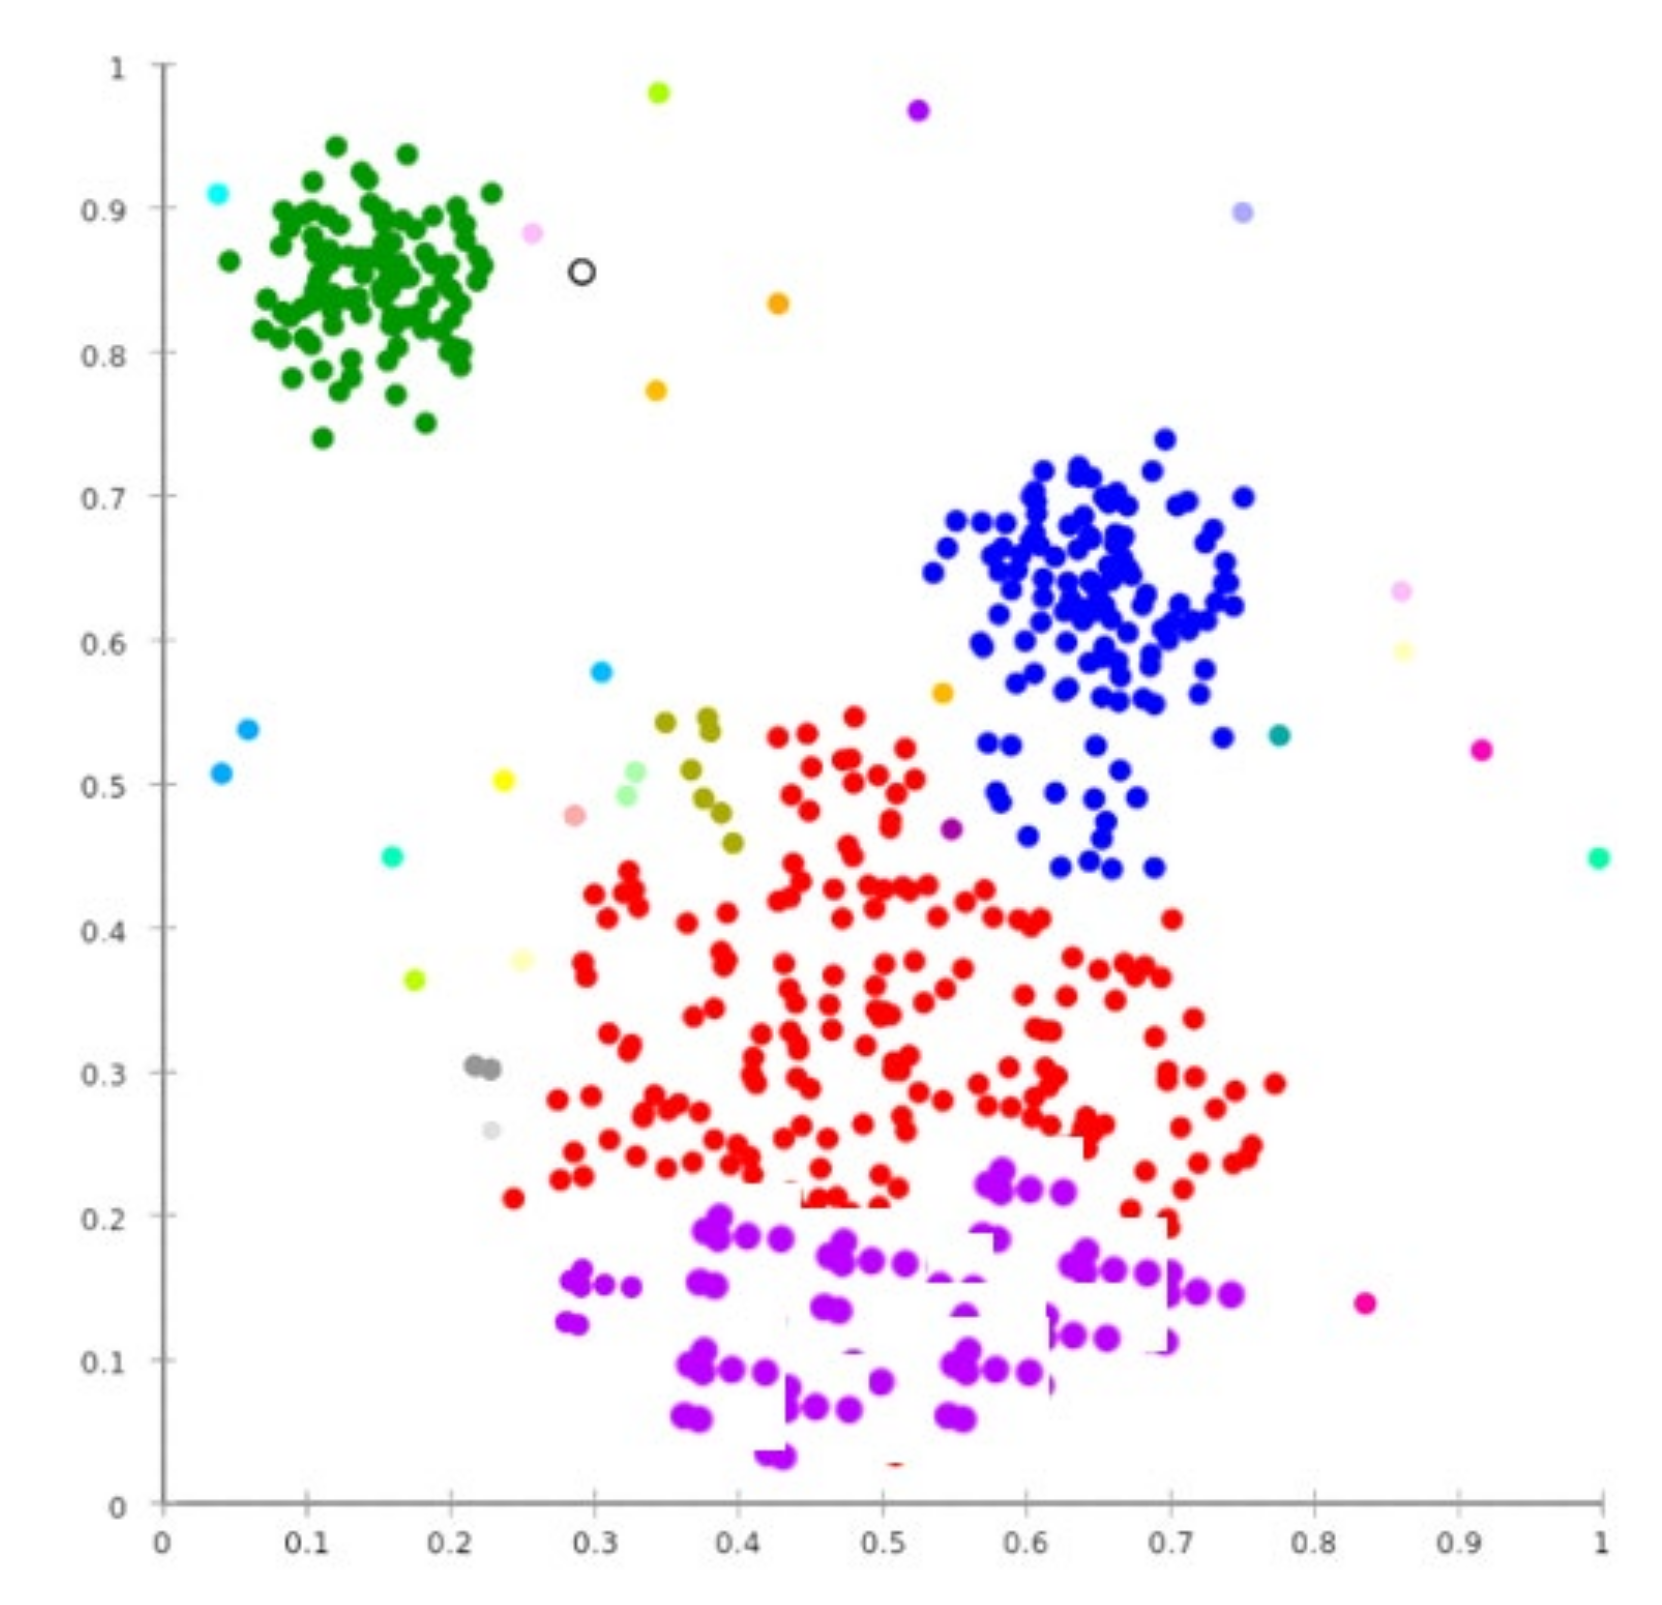
3.3. Methods Used for Quantitative Research
- High level of intra-cluster similarity;
- Low level of inter-cluster similarity;
- Natural (visual, if possible) groupings among data points.
4. Results
4.1. Research Sample
4.2. Research Results and Findings
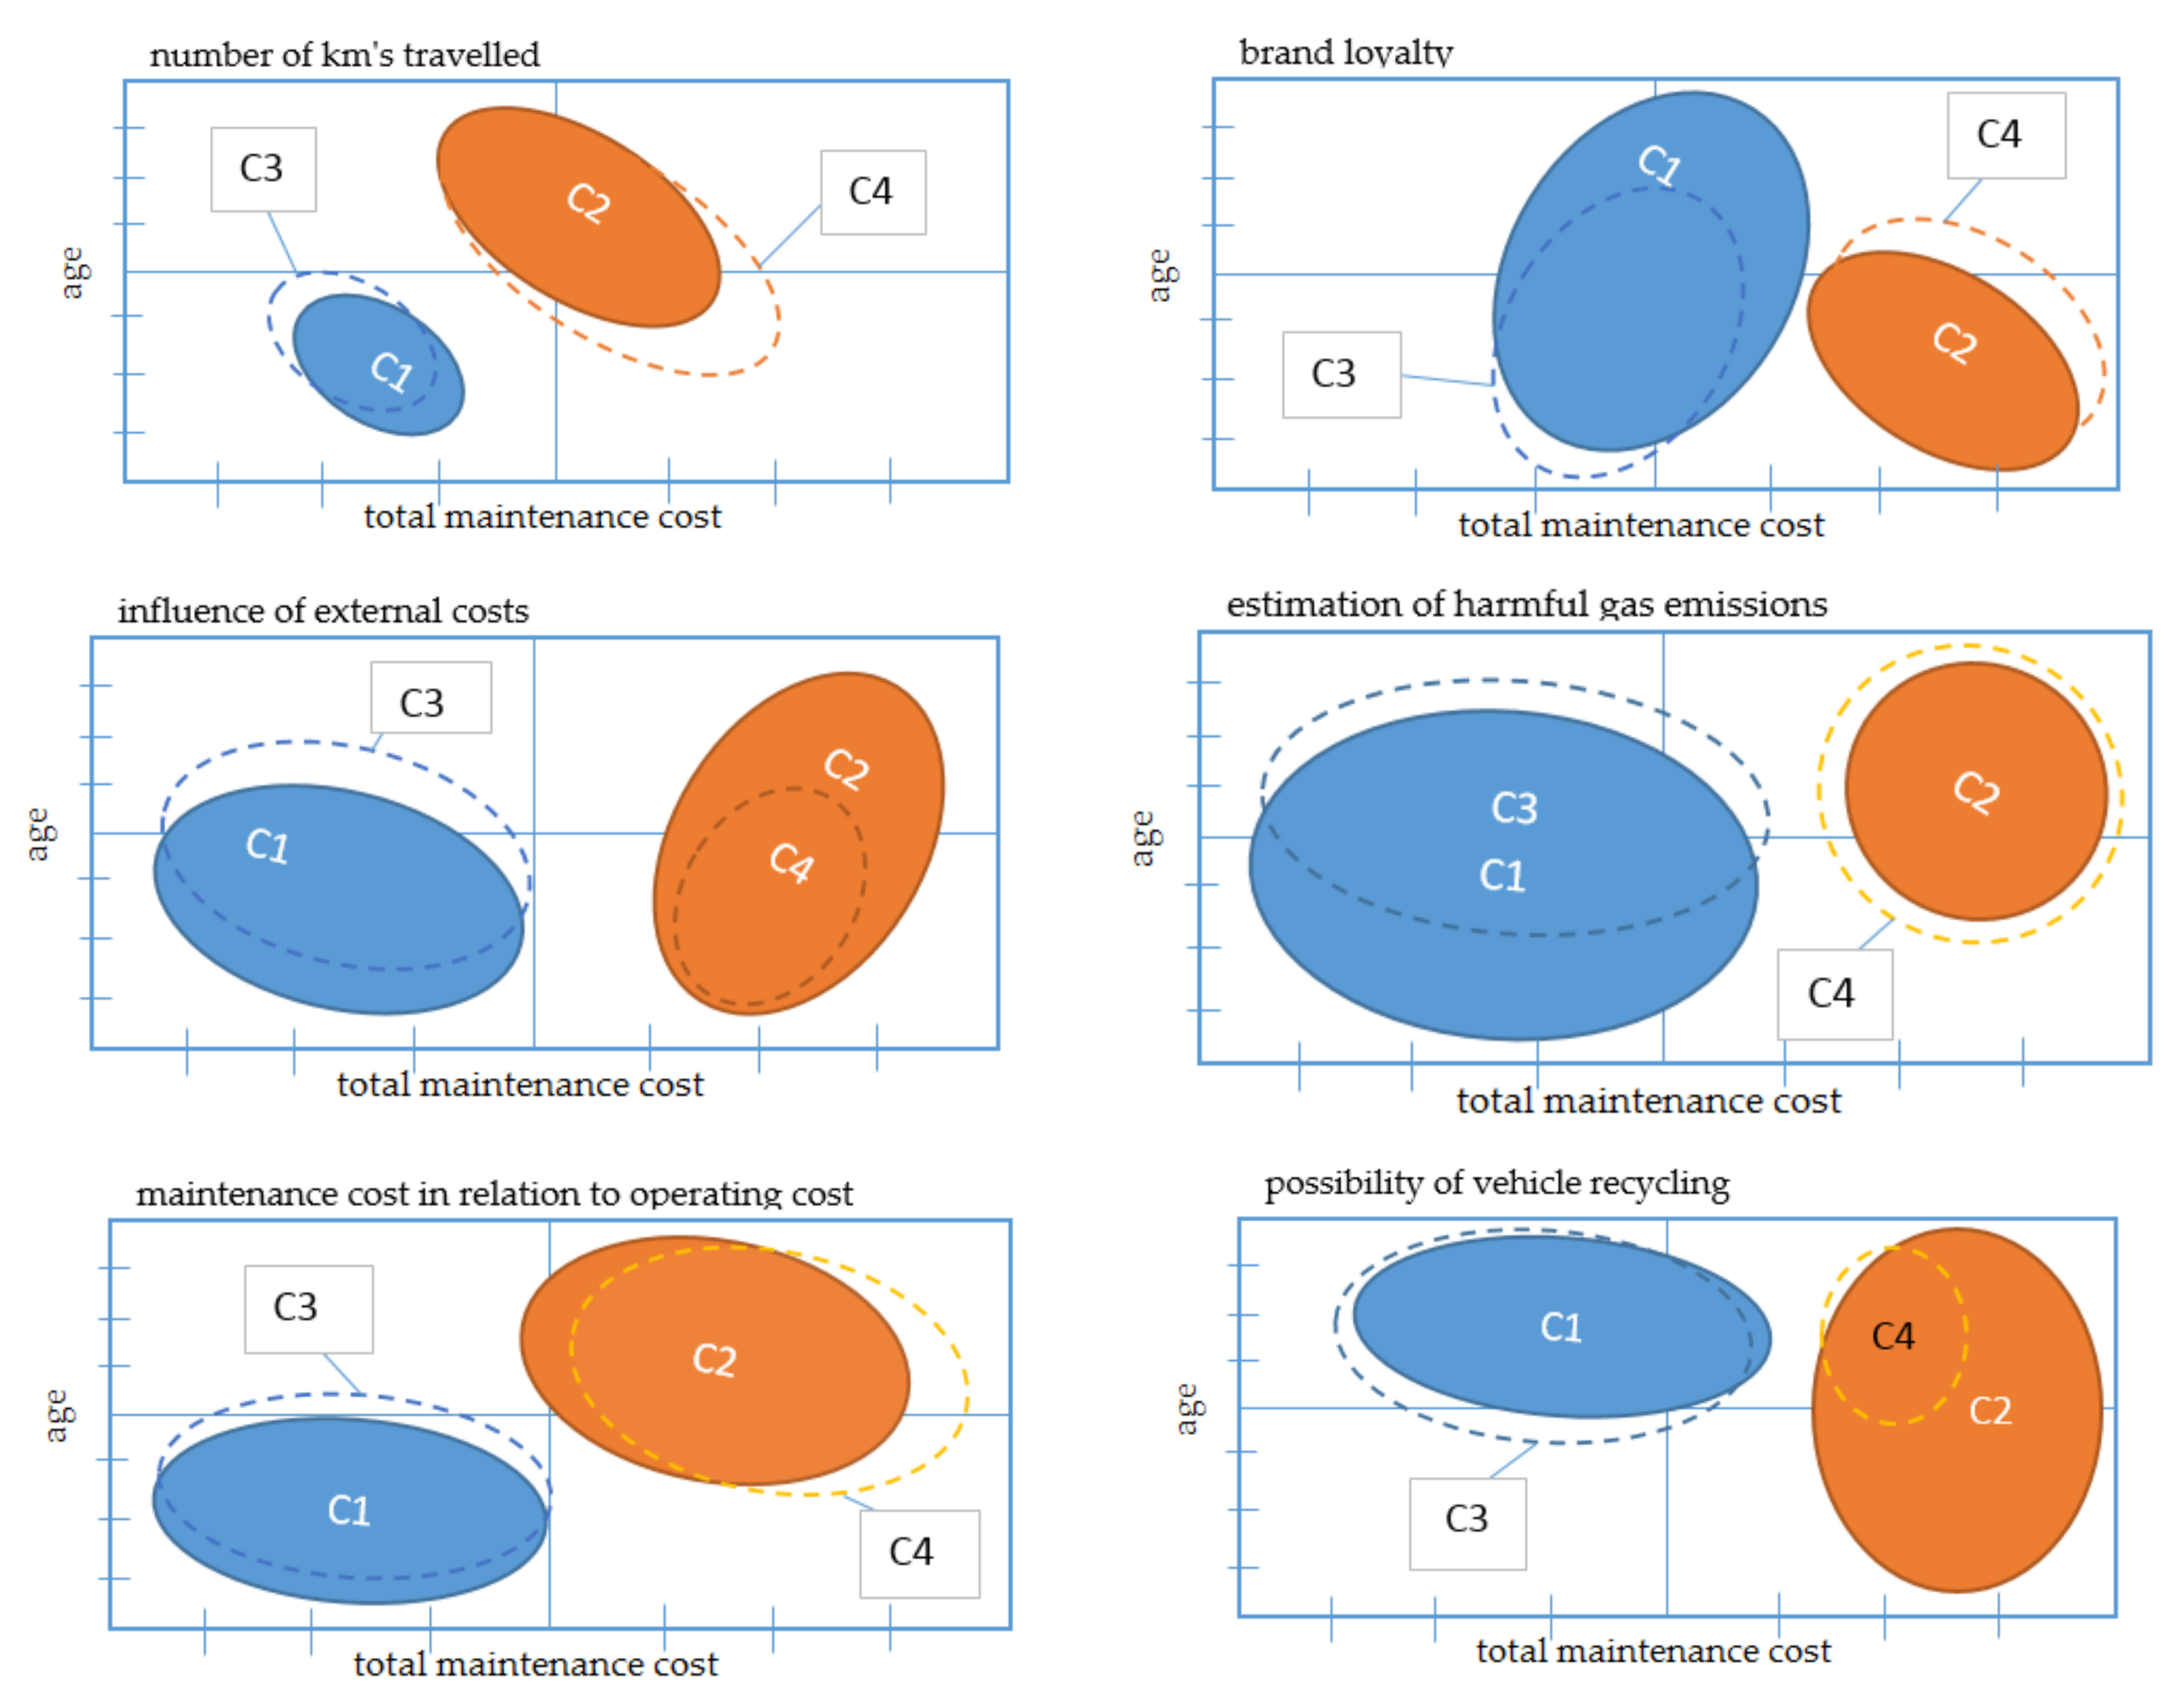
- In terms of the age of the motor vehicle, the inter-cluster border is around 14 years in the case of passenger vehicles and around 12 years in the case of commercial vehicles;
- In terms of the number of kilometers traveled, the inter-cluster border is around 200,000 km in the case of passenger vehicles and around 300,000 km in the case of commercial vehicles;
- Regarding the active-use phase—as total maintenance costs grow, the estimated loyalty to the brand of the vehicle is constant, external costs are increasing, the estimate of harmful gas emissions is increasing, and the potential for recycling the vehicle is a constant, as the vehicle is getting older;
- Regarding the end-of-life phase—as the estimate of total maintenance costs grows and surpasses the operational costs, loyalty to the brand decreases significantly, external costs (influence of the environmental impact, etc.) grow significantly, harmful gas emissions are much higher (particularly in the case of passenger vehicles), and finally, the recycling potential drops significantly;
- Regarding the type of vehicle, for the end-of-life phase of commercial vehicles, maintenance costs in relation to operating costs differ most significantly compared to passenger vehicles; therefore, this can be observed as a unique indicator of the end-of-life phase of the life cycle in the case of commercial vehicles. The same pattern can be observed with passenger vehicles in the end-of-life phase when it comes to the estimation of harmful gas emissions.
4.3. Testing of Research Hypotheses
4.3.1. Statistical Significance of the Research Sample
- ANOVA test—to determine if there is any statistically significant difference within and between defined groups;
- F test and p-value.
4.3.2. Regression Tests within A Cluster (Phase of Life Cycle)
- Regression coefficients (slope) for specific independent variables (indicators);
- The p-value and comparison based on a confidence interval of 0.05;
- Student’s t-test.
5. Discussion and Conclusions
5.1. Comparison of Key Research Findings
- In terms of the active-use phase of the life cycle, since maintenance costs are perceived to be growing (to the point of being perceived as not acceptable in terms of sustainability), as the number of kilometers traveled reaches 200,000 km, this phase is also characterized by low to medium external costs, harmful gas emissions, the market appeal is still more important than technology, and the potential for recycling is medium to very high—during this phase, the majority of the resources can be reused;
- In terms of the active-use phase, there were no statistically important differences between the types of motor vehicles, regarding the level of influence of the quantified indicators;
- In terms of the end-of-life phase of the life cycle, maintenance costs are no longer sustainable after passing the 200,000 km mark, external costs are higher than ever, the estimated harmful gas emissions are higher than ever and the influence of brand loyalty is dropping significantly. The potential for reuse of the vehicle parts through recycling is minimal, and the end of life is approaching wherein the vehicle shall be put out of order through waste management;
- in terms of a cluster containing commercial vehicles in the end-of-life phase of their life cycle, a specific level of influence was identified of the maintenance cost indicator in relation to regular operating costs, which was quantified as high to very high.
- Avesani [75] analyzed life-cycle sustainability by considering corporate, social, and eco-friendly parameters/indicators. This paper expands on it by introducing market trends (the estimated loyalty of drivers to a specific vehicle brand, thus expanding the usage of the existing vehicle) and some environmental indicators (the estimated level of harmful gas emissions, the possibility of recycling their current vehicle). In addition, this study presents a preliminary effort to distinguish between the active-use and end-of-life phases of a motor vehicle’s life cycle;
- Traverso [76] and Young [77] analyzed life-cycle phases from a sustainability point of view, concluding that social impact is having a greater than ever influence on the exploitation period of a product. This research expands along those lines, identifying the specific level of influence of external costs according to the cost of ownership, as is particularly important in the case of households owning a passenger vehicle, taking into account the share of the vehicle cost of ownership in terms of the overall costs of the entire household;
- In a study by Jasinski [78], the full cost of ownership of motor vehicles was developed, involving relevant experts with 20+ years of experience in the automotive industry, and searching a total of 4000+ papers. This research confirms their findings by analyzing the dependency of age and total maintenance costs across different indicators of influence, expanding the research to two new markets of Europe—Serbia and Montenegro;
- Conclusions from this study are in opposition to the findings made by Kagawa [79], who concluded that the drivers’ decision to prolong their vehicle’s life cycle (instead of replacing it with a new one), caused a decrease in the overall CO2 emissions on a national level since the average number of vehicles in use is thus lower.
5.2. Limitations
5.3. Future Research
5.4. Practical Implications
Author Contributions
Funding
Institutional Review Board Statement
Informed Consent Statement
Acknowledgments
Conflicts of Interest
Appendix A

| Research Question | Possible Answers (Only One Response Is Possible) | ||||
|---|---|---|---|---|---|
| RQ1: What is the average age of your motor vehicle? (If age is below 10, the survey ends) | Enter the age of your vehicle (minimum 10 or larger) | ||||
| RQ2: What type of motor vehicle are you driving? | Commercial van | Commercial truck | Commercial car | Passenger car | bus |
| RQ3: Number of km traveled with your vehicle? | Below 100,000 km | 100–150,000 km | 150–250,000 km | 250–350,000 km | More than 350,000 km |
| RQ4: How would you define the level of loyalty to your vehicle’s brand? | Very low | Low | Medium | High | Very high |
| RQ5: How would you rate the level of influence of external costs (social, environmental, legal) to the cost of ownership of your vehicle? | Very low | Low | Medium | High | Very high |
| RQ6: How would you rate the harmful gas emissions of your vehicle to the environment? | Very low | Low | Medium | High | Very high |
| RQ7: How do you rate the maintenance cost (repairs) in relation to the operating costs (regular, everyday) associated with your vehicle? | Very low | Low | Medium | High | Very high |
| RQ8: How would you rate the possibility of recycling your vehicle in the following period? | Very low | Low | Medium | High | Very high |
| RQ9: At what point would you consider replacing your current vehicle (or fleet of vehicles)? | Enter time period (number of years) after which you would consider vehicle replacement (1,2, etc) | ||||
| Independent Variable | Cluster Centroid * | Regression Coefficient (Slope) | p-Value | t-Test |
|---|---|---|---|---|
| Average age of motor vehicles | C1 | 0.54 | <0.01 | 1.98 |
| C2 | 0.33 | <0.01 | 0.96 | |
| C3 | 0.65 | <0.01 | 1.34 | |
| C4 | 1.28 | <0.01 | 1.13 | |
| Number of traveled kilometers | C1 | 1.95 | <0.01 | 2.08 |
| C2 | 1.56 | <0.01 | 1.91 | |
| C3 | 075 | <0.01 | 1.44 | |
| C4 | 3.91 | <0.01 | 1.16 | |
| Estimated loyalty to the brand of vehicle | C1 | 1.21 | <0.01 | 1.58 |
| C2 | 1.55 | <0.01 | 1.33 | |
| C3 | 0.54 | <0.01 | 1.87 | |
| C4 | 0.87 | <0.01 | 1.25 | |
| External costs | C1 | 1.29 | <0.01 | 1.22 |
| C2 | 1.63 | <0.01 | 1.48 | |
| C3 | 1.01 | <0.01 | 1.89 | |
| C4 | 1.97 | <0.01 | 1.99 | |
| Estimation of harmful gas emissions | C1 | 0.91 | <0.01 | 1.92 |
| C2 | 0.88 | <0.01 | 1.54 | |
| C3 | 0.22 | <0.01 | 1.76 | |
| C4 | 0.39 | <0.01 | 1.65 | |
| Maintenance cost in relation to operating cost | C1 | 1.01 | <0.01 | 1.77 |
| C2 | 0.93 | <0.01 | 1.87 | |
| C3 | 0.83 | <0.01 | 1.53 | |
| C4 | 4.13 | <0.01 | 1.99 | |
| Possibility of recycling the vehicle | C1 | 0.88 | <0.01 | 2.01 |
| C2 | 0.11 | <0.01 | 1.42 | |
| C3 | 0.62 | <0.01 | 1.55 | |
| C4 | 0.09 | <0.01 | 2.11 | |
| Estimated period for replacement/dismantling of vehicle | C1 | 0.05 | <0.01 | 1.64 |
| C2 | 1.88 | <0.01 | 1.45 | |
| C3 | 0.53 | <0.01 | 1.81 | |
| C4 | 2.56 | <0.01 | 2.30 |
Appendix B
| Indicators Defined after Literature Review | Indicators Marked as Key after Discussion with Experts |
|---|---|
| Average age of motor vehicles | Marked as important for further analysis |
| Brand loyalty in relation to vehicle technology level | |
| External costs influencing vehicle end of life management | |
| Greenhouse gas emissions | |
| Maintenance cost in relation to operating costs | |
| Potential for vehicle recycling | |
| Remaining useful time for exploitation of vehicle engine | Marked by experts as not important for further analysis |
| Leasing as a form of ownership over a vehicle | |
| Engine technology | |
| Country is a candidate for EU membership | |
| Shortage of regional/national infrastructure for disposal of end-of-life vehicles | |
| Financial/banking incentives for vehicle replacement | |
| Legal support aligned with EU Directives | |
| Number of imported new vehicles | |
| Number of runtime failures | |
| Risk level for other participants in traffic | |
| Existence of mass transport systems | |
| Fleet renewal |
| Characteristics | Serbia | Montenegro | Standard Deviation | Pearson Kendall Tau b Correlation Coefficient * | |||||||||
|---|---|---|---|---|---|---|---|---|---|---|---|---|---|
| RQ1 | RQ2 | RQ3 | RQ4 | RQ5 | RQ6 | RQ7 | RQ8 | RQ9 | |||||
| Gender | Male | 70% | 74% | 1.92 | 0.76 | 0.93 | 0.19 | 0.29 | 0.34 | 0.67 | 0.56 | 0.21 | 0.24 |
| Female | 30% | 26% | 1.95 | 0.75 | 0.64 | 0.21 | 0.18 | 0.29 | 0.45 | 0.27 | 0.11 | 0.18 | |
| Age group | 18–30 | 11% | 20% | 1.03 | 0.81 | 0.14 | 0.11 | 0.15 | 0.09 | 0.14 | 0.05 | 0.11 | 0.09 |
| 31–50 | 42% | 32% | 1.13 | 0.74 | 0.26 | 0.25 | 0.26 | 0.35 | 0.26 | 0.35 | 0.11 | 0.33 | |
| 51–70 | 40% | 34% | 1.11 | 0.74 | 0.24 | 0.23 | 0.22 | 0.39 | 0.28 | 0.43 | 0.12 | 0.35 | |
| 71+ | 7% | 4% | 1.99 | 0.92 | 0.05 | 0.04 | 0.09 | 0.21 | 0.03 | 0.36 | 0.03 | 0.37 | |
| Region | Metropolitan | 38% | 26% | 1.43 | 0.69 | 0.16 | 0.45 | 0.11 | 0.65 | 0.66 | 0.32 | 0.24 | 0.45 |
| Urban (other cities except the capital) | 34% | 39% | 1.85 | 0.70 | 0.17 | 0.48 | 0.15 | 0.62 | 0.58 | 0.30 | 0.26 | 0.43 | |
| Rural | 28% | 35% | 2.01 | 0.84 | 0.26 | 0.43 | 0.02 | 0.36 | 0.24 | 0.24 | 0.14 | 0.48 | |
| Passenger vehicle type | Small car | 29% | 9% | 1.94 | 0.65 | 0.22 | 0.23 | 0.02 | 0.11 | 0.27 | 0.21 | 0.11 | 0.51 |
| Family car | 54% | 63% | 1.44 | 0.63 | 0.34 | 0.66 | 0.11 | 0.12 | 0.43 | 0.22 | 0.22 | 0.65 | |
| Sports car | 5% | 2% | 1.65 | 0.67 | 0.12 | 0.24 | 0.35 | 0.55 | 0.78 | 0.15 | 0.09 | 0.45 | |
| SUV/Jeep | 12% | 26% | 1.54 | 0.58 | 0.25 | 0.25 | 0.39 | 0.23 | 0.95 | 0.16 | 0.03 | 0.40 | |
| Engine type | Diesel | 45% | 62% | 1.86 | 0.57 | 0.51 | 0.32 | 0.01 | 0.55 | 0.89 | 0.02 | 0.25 | 0.11 |
| Unleaded | 55% | 38% | 1.54 | 0.58 | 0.49 | 0.31 | 0.01 | 0.46 | 0.56 | 0.04 | 0.22 | 0.09 | |
| Type of commercial vehicle | Bus | 17% | 21% | 2.34 | 0.48 | 0.44 | 0.77 | 0.01 | 0.08 | 0.88 | 0.06 | 0.07 | 0.11 |
| Small transport vehicle | 18% | 19% | 2.11 | 0.49 | 0.22 | 0.75 | 0.02 | 0.07 | 0.54 | 0.11 | 0.11 | 0.12 | |
| Light commercial vehicle | 40% | 35% | 1.54 | 0.33 | 0.24 | 0.76 | 0.03 | 0.04 | 0.78 | 0.12 | 0.16 | 0.14 | |
| Medium commercial vehicle | 10% | 9% | 1.32 | 0.49 | 0.26 | 0.78 | 0.01 | 0.16 | 0.69 | 0.14 | 0.24 | 0.12 | |
| Heavy-duty vehicle | 15% | 16% | 1.12 | 0.63 | 0.21 | 0.90 | 0.01 | 0.01 | 0.66 | 0.28 | 0.21 | 0.08 | |
References
- Zbicinski, I.; Stavenuiter, J.; Kozlowska, B.; van de Coevering, H.P.M. Product Design and Life Cycle Assessment; Baltic University Press: Uppsala, Sweden, 2006; ISBN 91-975526-2-3. [Google Scholar]
- Eurostat Statistics. End of Life Vehicle Statistics. 2019. Available online: https://ec.europa.eu/eurostat/statistics-explained/index.php?title=End-of-life_vehicle_statistics (accessed on 27 November 2021).
- Sakai, S.; Yoshida, H.; Hiratsuka, J. An international comparative study of end-of-life vehicle (ELV) recycling systems. J. Mater. Cycles Waste Manag. 2014, 16, 1–20. [Google Scholar] [CrossRef] [Green Version]
- Keoleian, G.A.; Bulkley, J.W.; Ross, M.H.; Bean, J.C.; Kim, H.C.; Austin, S.; Spatari, S.; Riedemann, V. Life Cycle Optimization of Vehicle Replacement; Center for Sustainable Systems, University of Michigan: Ann Arbor, MI, USA, 2004. [Google Scholar]
- Harrington, W.; McConell, V. Motor Vehicles and the Environment; Resources for the Future: Washington, DC, USA, 2003; Available online: https://media.rff.org/documents/RFF-RPT-carsenviron.pdf (accessed on 4 December 2021).
- Burnham, A.; Gohlke, D.; Rush, L.; Stephens, T.; Zhou, Y.; Delucchi, M.A.; Birky, A.; Hunter, C.; Lin, Z.; Ou, S.; et al. Comprehensive Total Cost of Ownership Quantification for Vehicles with Different Size Classes and Powertrains; Argonne National Laboratory Study: Chicago, IL, USA, 2021. Available online: https://publications.anl.gov/anlpubs/2021/05/167399.pdf (accessed on 17 December 2021).
- Arsić, S.; Tomić, R.; Arsić, M.; Jovanović, D. Conceptual model for ecologic treatment of end of life motor vehicles. Ecologica 2020, 27, 414–421. [Google Scholar]
- Hawkins, T.R.; Singh, B.; Majeau-Bettez, G.; Strømman, A.H. Comparative environmental life cycle assessment of conventional and electric vehicles. J. Ind. Ecol. 2013, 17, 158–160. [Google Scholar] [CrossRef]
- Candelaresi, D.; Valente, A.; Iribarren, D.; Dufour, J.; Spazzafumo, G. Comparative life cycle assessment of hydrogen-fuelled passenger cars. Int. J. Hydrog. Energy 2021, 46, 35961–35973. [Google Scholar] [CrossRef]
- Kalmakov, V.A.; Andreev, A.A.; Martyanov, A.S. Remaining Vehicles Useful Lifetime Estimation Based on Operation Conditions Measurement. Procedia Eng. 2017, 206, 1716–1721. [Google Scholar] [CrossRef]
- Marell, A.; Davidsson, P.; Garling, T.; Laitila, T. Direct and indirect effects on households’ intentions to replace the old car. J. Retail. Consum. Serv. 2004, 11, 1–8. [Google Scholar] [CrossRef]
- Aizcorbe, A.; Starr, M.; Hickman, J.T. The Replacement Demand for Motor Vehicles: Evidence from the Survey of Consumer Finances. 2003. Available online: http://citeseerx.ist.psu.edu/viewdoc/download?doi=10.1.1.195.6747&rep=rep1&type=pdf (accessed on 2 December 2021).
- Redmer, A. Strategic vehicle fleet management—the replacement problem. LogForum—Sci. J. Logist. 2016, 12, 17–24. [Google Scholar] [CrossRef]
- Broch, F.; Warsen, J.; Krinke, S. Implementing Life Cycle Engineering in Automotive Development as a Helpful Management Tool to Support Design for Environment. In Life Cycle Management; LCA Compendium—The Complete World of Life Cycle Assessment; Sonnemann, G., Margni, M., Eds.; Springer: Dordrecht, The Netherlands, 2015. [Google Scholar] [CrossRef] [Green Version]
- Volpato, G.; Stoccheti, A. Managing product life cycle in the auto industry: Evaluating carmakers effectiveness. Int. J. Automot. Technol. Manag. 2008, 8, 22–41. [Google Scholar] [CrossRef] [Green Version]
- Cihat Onat, N.; Abdella, G.M.; Kucukvar, M.; Kutty, A.A.; Al Nuaimi, M.; Kumbaroglu, G.; Bulu, M. How eco-efficient are electric vehicles across Europe? A regionalized life cycle assessment-based eco-efficiency analysis. Sustain. Dev. 2021, 29, 941–956. [Google Scholar] [CrossRef]
- Held, M.; Rosat, N.; Georges, G. Lifespans of passenger cars in Europe: Empirical modelling of fleet turnover dynamics. Eur. Transp. Res. Rev. 2021, 13, 1–13. [Google Scholar] [CrossRef]
- Karagoz, S.; Aydin, N.; Simic, V. End-of-life vehicle management: A comprehensive review. J. Mater. Cycles Waste Manag. 2020, 22, 416–442. [Google Scholar] [CrossRef] [Green Version]
- Mrozik, M.; Guranowska, A.M. Environmental Assessment of the Vehicle Operation Process. Energies 2021, 14, 76. [Google Scholar] [CrossRef]
- Lane, B. Life Cycle Assessment of Vehicle Fuels and Technologies, Report Summary; Ecolane Transport Consultancy: London, UK, 2006; Available online: https://www.ttsitalia.it/file/Libreria/Europe/Camden%20LCA%20SUMMARY%2010%2003%202006%20vP.pdf (accessed on 11 December 2021).
- Costa, D.; Quinteiro, P.; Dias, A.C. A systematic review of life cycle sustainability assessment: Current state, methodological challenges, and implementation issues. Sci. Total Environ. 2019, 686, 774–787. [Google Scholar] [CrossRef] [PubMed]
- Petronijević, V.; Đorđević, A.; Stefanović, M.; Arsovski, S.; Krivokapić, Z.; Mišić, M. Energy Recovery through End-of-Life Vehicles Recycling in Developing Countries. Sustainability 2020, 12, 8764. [Google Scholar] [CrossRef]
- Official Gazzete. Law on Waste Management, Government of Republic of Serbia. 2018. Available online: https://www.paragraf.rs/propisi/zakon_o_upravljanju_otpadom.html (accessed on 11 January 2022).
- Stojanovic, M. Regional Landfill in Novi Sad: Growth of Pollution and Bureaucracy, Center for Investigative Journalism in Serbia. 2017. Available online: https://www.cins.rs/en/regional-landfill-in-novi-sad-growth-of-pollution-and-bureaucracy/ (accessed on 28 August 2021).
- Hogg, D.; Vergunst, T.; Elliot, T.; Van Breusegem, W.; Nicolopoulos, C.; Kotsani, C.; Mikalacki, J.; Madzarevic, I. A Comprehensive Assessment of The Current Waste Management Situation in South East Europe and Future Perspectives for the Sector Including Options for Regional Cooperation in Recycling of Electric and Electronic Waste, Eunomia Study. 2017. Available online: https://ec.europa.eu/environment/enlarg/pdf/pilot%20waste/Serbia_en.pdf (accessed on 24 August 2021).
- Von Schoenberg, A. Factsheet: Waste Management in Montenegro. CMS Study. 2021. Available online: https://www.retech-germany.net/fileadmin/retech/05_mediathek/laenderinformationen/Montenegro__Fact_Sheet_final.pdf (accessed on 25 August 2021).
- Denčić-Mihajlov, K.; Krstić, M.; Spasić, D. Sensitivity Analysis as a Tool in Environmental Policy for Sustainability: The Case of Waste Recycling Projects in the Republic of Serbia. Sustainability 2020, 12, 7995. [Google Scholar] [CrossRef]
- Marstijepovic, S. Waste Audit Report Montenegro 2019, Zero Waste Montengro. 2019. Available online: http://www.euic.me/wp-content/uploads/2020/01/WASTE-AUDIT-REPORT-MONTENEGRO-2019.pdf (accessed on 14 September 2021).
- Sokic, M.; Ilic, I.; Manojlovic, V.; Markovic, B.; Gulisija, Z.; Pavlovic, M.D.; Strbac, N. Modeling and Prediction of the end of Life Vehicles Number Distribution in Serbia. Acta Polytech. Hung. 2016, 13, 159–172. [Google Scholar] [CrossRef]
- Ratkovic, B.; Simic, V.; Vidovic, M. Neuro-fuzzy approach in estimating the number of ELVs in Serbia. In Proceedings of the Symopis Conference 2008, Belgrade, Serbia, 20–23 September 2008. [Google Scholar] [CrossRef]
- Bjelotomic, S. Serbia Imports Close to 120,000 Used Cars Annually, Serbian Monitor. 2021. Available online: https://www.serbianmonitor.com/en/serbia-imports-close-to-120000-used-cars-annually/ (accessed on 5 September 2021).
- European Investment Bank. Assessment of Financing Needs of SMEs in the Western Balkans Countries, EIB Report. 2016. Available online: https://www.eib.org/attachments/efs/assessment_of_financing_needs_of_smes_serbia_en.pdf (accessed on 11 September 2021).
- Dumitresca, E.; Gerasina, R.; Maclennan, E.; Watson, S.; Zhechkov, R. Cleaner, More Efficient Vehicles: Reducing Emissions in Central and Eastern Europe. 2010. Available online: https://www.globalfueleconomy.org/media/44071/wp3-cleaner-more-efficient-vehicles.pdf (accessed on 3 September 2021).
- Chanaron, J.J. Life Cycle Assessment Practices: Benchmarking Selected European Automobile Manufacturers. Int. J. Prod. Lifecycle Manag. 2007, 2, 290–311. [Google Scholar] [CrossRef]
- Sofijanic, S.S.; Arsic, S.M.; Jovanovic, D.; Arsic, M.Z.; Kalac, S.; Ribaric, Z.; Kostadinovic, D.; Peulic, V.; Rosulj, D.; Fazekas, T.; et al. Influence of Business-Operational Performances and Company Size on CO2 Emissions Decrease-Case of Serbian Road Transport Companies. Sustainability 2021, 13, 8176. [Google Scholar] [CrossRef]
- Bajpai, J.N. Emerging vehicle technologies and the search for urban mobility solutions. Urban Plan. Transp. Res. 2016, 4, 83–100. [Google Scholar] [CrossRef] [Green Version]
- Vanderseypen, E. Current and Future Situation of Obsolescence in the Automotive Industry. Master’s Thesis, University de Louvain, Bruxelles, Belgium, 2018. Available online: https://dial.uclouvain.be/memoire/ucl/fr/object/thesis%3A14403/datastream/PDF_01/view (accessed on 14 August 2021).
- Drahokoupil, J. The Challenge of Digital Transformation in the Automotive Industry; Etui: Bruxelles, Belgium, 2020; ISBN 978-2-87452-570-4. Available online: https://www.etui.org/sites/default/files/2020-09/The%20challenge%20of%20digital%20transformation%20in%20the%20automotive%20industry-2020.pdf (accessed on 13 September 2021).
- European Comission. EU Legislation on Passenger Car Type Approval and Emissions Standards, European Comission Fact Sheet. 2016. Available online: https://ec.europa.eu/commission/presscorner/detail/en/MEMO_16_4269 (accessed on 15 September 2021).
- PwC. Five Trends Transforming the Automotive Industry, PwC Study. 2018. Available online: https://www.pwc.at/de/publikationen/branchen-und-wirtschaftsstudien/eascy-five-trends-transforming-the-automotive-industry_2018.pdf (accessed on 13 August 2021).
- Helbig, N.; Sandau, J.; Heinrich, J. Future Automotive Value Chain—2025 and beyond, Deloitte Study. 2017. Available online: https://www2.deloitte.com/content/dam/Deloitte/us/Documents/consumer-business/us-auto-the-future-of-the-automotive-value-chain.pdf (accessed on 1 September 2021).
- Schmidt, A.; Trenka, J.; Franzen, R.; Gerhard, A.; Holtgrave, M. A New Way for Oems and Dealers to Thrive in Times of Disruption, Accenture Study. 2019. Available online: https://www.accenture.com/_acnmedia/PDF-108/Accenture-Study-The-Future-of-Automotive-Sales.pdf (accessed on 7 September 2021).
- Schrotten, A.; van Grinsven, A.; Tol, E.; Leestemaker, L.; Schackmann, P.P.; Voonk Noordegraaf, D.; van Meijeren, J.; Kalisvaart, S. The Impact of Emerging Technologies on the Transport System, EU Directorate General for Internal Policies. 2020. Available online: https://www.europarl.europa.eu/thinktank/en/document.html?reference=IPOL_STU(2020)652226 (accessed on 26 August 2021).
- McKinsey. Winning the Race: China’s Auto Market Shift Gears, McKinsey and Company Study. 2019. Available online: https://www.mckinsey.com/~/media/mckinsey/industries/automotive%20and%20assembly/our%20insights/winning%20the%20race%20chinas%20auto%20market%20shifts%20gears/winning-the-race-chinas-auto-market-shifts-gears.ashx, (accessed on 5 August 2021).
- Hofstatter, T.; Krawina, M.; Muhlreiter, B.; Pohler, S.; Tschiesner, A. Reimagining the Auto Industry’s Future: It’s Now or Never, McKinsey. 2020. Available online: https://www.mckinsey.com/industries/automotive-and-assembly/our-insights/reimagining-the-auto-industrys-future-its-now-or-never (accessed on 31 August 2021).
- Acea. EU Automotive Industry Full-Year 2020, European Automobile Manufacturers Association. 2021. Available online: https://www.acea.auto/files/Economic_and_Market_Report_full-year_2020.pdf (accessed on 4 September 2021).
- Gaines, L.; Stodolsky, F.; Cuenca, R. Lifecycle-analysis for heavy vehicles, Center for Transportation Research. 1998. Available online: https://www.osti.gov/servlets/purl/10731 (accessed on 15 August 2021).
- Saidani, M.; Kendall, A.; Yannou, B.; Leroy, Y.; Cluzel, F. Management of the end-of-life of light and heavy vehicles in the U.S.: Comparison with the European Union in a circular economy perspective. J. Mater. Cycles Waste Manag. 2019, 21, 1449–1461. [Google Scholar] [CrossRef]
- Schmidt, W.P.; Dahlqvist, E.; Finkbeiner, M.; Krinke, S.; Lazzari, S.; Oschmann, D.; Pichon, S.; Thiel, C. Life cycle assessment of lightweight and end-of-life scenarios for generic compact class passenger vehicles. Int. J. Lifecycle Assess. 2004, 9, 405–416. [Google Scholar] [CrossRef]
- Yang, L.; Hao, C.; Chai, Y. Life Cycle Assessment of Commercial Delivery Trucks: Diesel, Plug-In Electric, and Battery-Swap Electric. Sustainability 2018, 10, 4547. [Google Scholar] [CrossRef] [Green Version]
- Pavlovic, A. Research Contributions of an Integrated Management Model of Motor Vehicles at the End of Life Cycle to the Development of the Republic of Serbia. Ph.D. Thesis, University of Novi Sad, Novi Sad, Serbia, 2016. Available online: https://nardus.mpn.gov.rs/handle/123456789/8703 (accessed on 10 September 2021).
- Karlewski, H.; Lehmann, A.; Ruhland, K.; Finkbeiner, M. A Practical Approach for Social Life Cycle Assessment in the Automotive Industry. Resources 2019, 8, 146. [Google Scholar] [CrossRef] [Green Version]
- Cornago, E.; Gaffney, K.; Oppermann, M. Promoting Vehicle Efficiency and Electrification through Stimulus Packages; IEA: Paris, France, 2020; Available online: https://www.iea.org/articles/promoting-vehicle-efficiency-and-electrification-through-stimulus-packages (accessed on 26 December 2021).
- Furch, J. A model for predicting motor vehicle life cycle cost and its verification. Trans. FAMENA 2016, 40, 15–26. [Google Scholar]
- Evtimov, I.; Ivanov, R.; Kadikyanov, G.; Staneva, G. Life cycle assessment of electric and conventional cars energy. consumption and CO2 emissions. In Proceedings of the MATEC Web of Conferences, Sozopol, Bulgaria, 15–17 September 2018; 2018; 234, p. 02007. [Google Scholar] [CrossRef]
- Earles, J.M.; Halog, A. Consequential life cycle assessment: A review. Int. J. Life Cycle Assess. 2011, 16, 445–453. [Google Scholar] [CrossRef]
- Miotti, M.; Hofer, J.; Bauer, C. Integrated environmental and economic assessment of current and future fuel cell vehicles. Int. J. Life Cycle Assess. 2017, 22, 94–110. [Google Scholar] [CrossRef] [Green Version]
- Capitano, K.J. Methodologies for Life Cycle Assessment of Passenger Vehicles. In Electronic Theses and Dissertations; University of Windsor: Windsor, ON, Canada, 2015; Available online: https://scholar.uwindsor.ca/cgi/viewcontent.cgi?article=6459&context=etd (accessed on 2 September 2021).
- Hirz, M.; Brunner, H. ECO-Design in the Automotive Industry—Potentials and Challenges. In Proceedings of the International Conference Management of Technology—Step to Sustainable Production, Brela, Croatia, 10–12 June 2015. [Google Scholar]
- Power, J.D. Automotive Brand Loyalty Study, Jdpower Study. 2021. Available online: https://www.jdpower.com/business/press-releases/2021-us-automotive-brand-loyalty-study (accessed on 15 September 2021).
- Anderson, J.M.; Kalra, N.; Stanley, K.D.; Sorensen, P.; Samaras, C.; Oluwatola, O.A. Autonomous Vehicle Technology. A Guide for Policymakers; RAND Corporation: Santa Monica, CA, USA, 2016; ISBN 978-0-8330-8398-2. Available online: https://www.rand.org/content/dam/rand/pubs/research_reports/RR400/RR443-2/RAND_RR443-2.pdf (accessed on 4 September 2021).
- Sopha, B.M.; Setiowati, S.M. Environmental Assessment of Motorcycle using a Life-Cycle Perspective. J. IJOLCAS1 2017, 1, 22–28. [Google Scholar] [CrossRef]
- Gorner, M. The Global EV Outlook 2019—life-cycle analysis. In Proceedings of the International Workshop “LCA of Urban Transport Business Models”, Paris, France, 1 October 2019; Available online: https://www.itf-oecd.org/sites/default/files/docs/iea-global-ev-outlook-life-cycle-analysis.pdf (accessed on 11 September 2021).
- Spitzley, D.V.; Grande, D.E.; Gruhl, T.; Keoleian, G.A.; Bean, J.C. Automotive Life Cycle Economics and Replacement Intervals, University of Michigan, United States of America. 2004. Available online: http://css.snre.umich.edu (accessed on 5 August 2021).
- Li, W.; Bai, H.; Yin, J.; Xu, H. Life cycle assessment of end-of-life vehicle recycling processes in China—take Corolla taxis for example. J. Clean. Prod. 2016, 117, 176–187. [Google Scholar] [CrossRef]
- Rapid Miner Documentation. 2022. Available online: https://docs.rapidminer.com/9.8/studio/releases/ (accessed on 22 December 2021).
- Grira, N.; Crucianu, M.; Boujemaa, N. Unsupervised and semi-supervised clustering: A brief survey. In A Review of Machine Learning Techniques for Processing Multimedia Content; Report of the MUSCLE European Network of Excellence (FP6); Citesee: Princeton, NJ, USA, 2004; pp. 9–16. [Google Scholar]
- Morissette, L.; Chartier, S. The k-means clustering technique: General considerations and implementation in Mathematica. Tutor. Quant. Methods Psychol. 2013, 9, 15–24. [Google Scholar] [CrossRef] [Green Version]
- Hastie, T.; Tibshirani, R.; Friedman, J. The Elements of Statistical Learning: Data Mining, Inference and Prediction; Springer: Berlin/Heidelberg, Germany, 2000. [Google Scholar]
- Franti, P.; Sieranoja, S. How much can k-means be improved by using better initialization and repeats? Pattern Recognit. 2019, 93, 95–112. [Google Scholar] [CrossRef]
- Santos, J.M.; Embrechts, M. On the Use of the Adjusted Rand Index as a Metric for Evaluating Supervised Classification Part II. In Proceedings of the Artificial Neural Networks—ICANN 2009, 19th International Conference, Limassol, Cyprus, 14–17 September 2009. [Google Scholar] [CrossRef]
- Meila, M. Comparing Clusterings by the Variation of Information. In Learning Theory and Kernel Machines; Springer: Berlin/Heidelberg, Germany, 2003; pp. 173–187. [Google Scholar] [CrossRef]
- Celebi, M.E.; Kingravi, H.A.; Vela, P.A. A comparative study of efficient initialization methods for the k-means clustering algorithm. Expert Syst. Appl. 2013, 40, 200–210. [Google Scholar] [CrossRef] [Green Version]
- Redmer, A. Strategic vehicle fleet management–a joint solution of make-or-buy, composition and replacement problems. J. Qual. Maint. Eng. 2020. Ahead of print. [Google Scholar] [CrossRef]
- Avesani, M. Chapter 2—Sustainability, sustainable development, and business sustainability. In Life Cycle Sustainability Assessment for Decision-Making; Elsevier: Amsterdam, The Netherlands, 2020; pp. 21–38. [Google Scholar] [CrossRef]
- Traverso, M.; Kim, P.; Brattig, S.; Wagner, V. Managing Life Cycle Sustainability Aspects in the Automotive Industry. In Life Cycle Management; LCA Compendium—The Complete World of Life Cycle Assessment; Sonnemann, G., Margni, M., Eds.; Springer: Dordrecht, The Netherlands, 2015. [Google Scholar] [CrossRef] [Green Version]
- Young, W.; Hwang, K.; Mcdonald, S.; Oates, C.J. Sustainable consumption: Green consumer behavior when purchasing products. Sustain. Dev. 2010, 18, 20–31. [Google Scholar] [CrossRef]
- Jasinski, D.; Meredith, J.; Kirwan, K. Sustainable development model for measuring and managing sustainability in the automotive sector. Sustain. Dev. 2021, 29, 1123–1173. [Google Scholar] [CrossRef]
- Kagawa, S.; Nansai, K.; Kondo, Y.; Hubacek, K.; Suh, S.; Minx, J.; Kudoh, Y.; Tasaki, T.; Nakamura, S. Role of Motor Vehicle Lifetime Extension in Climate Change Policy. Environ. Sci. Technol. 2011, 45, 1184–1191. [Google Scholar] [CrossRef]
- Yang, Y. Two sides of the same coin: Consequential life cycle assessment based on the attributional framework. J. Clean. Prod. 2016, 127, 274–281. [Google Scholar] [CrossRef]
- Del Pero, F.; Delogu, M.; Pierini, M. Life Cycle Assessment in the automotive sector: A comparative case study of Internal Combustion Engine (ICE) and electric car. Procedia Struct. Integr. 2018, 12, 521–537. [Google Scholar] [CrossRef]
- Petrauskienė, K.; Galinis, A.; Kliaugaitė, D.; Dvarionienė, J. Comparative Environmental Life Cycle and Cost Assessment of Electric, Hybrid, and Conventional Vehicles in Lithuania. Sustainability 2021, 13, 957. [Google Scholar] [CrossRef]


| Legislative | State of Technology and Infrastructure | Economic and Market Trends | Environment Issues |
|---|---|---|---|
| National plan and strategy for the management of end-of-life motor vehicles (Petronijevic et al. [22]) Legal support in the area of motor vehicles management aligned with EU Directive (Official Gazette [23]) | Low availability of waste treatment facilities on regional and national levels, for management of end-of-life motor vehicles (Stojanovic [24]; Hogg [25]; Von Schoenberg [26] Low level of investments for infrastructure development necessary for motor vehicle dismantling (Dencic Mihajlov [27]; Marstijepovic [28]) | Data regarding the volume of motor vehicles across phases of the life cycle is unavailable (Sokic et al. [29]; Ratkovic [30]) Increased number of used vehicles (older than 10 years) imported from Western Europe to Serbia/Montenegro (Bjelotomic [31]) Inadequate and under-developed public awareness on the timeliness of motor vehicle replacement (European Investment bank report [32]) | High levels of pollution caused by end-of-life motor vehicles (Dumitresca [33]) Reduced environmental impact through new engine technologies (Chanaron [34]) |
| Key Indicators |
|---|
| Average age of motor vehicles (Vanderseypen [60]) |
| Brand loyalty in relation to vehicle technology level (Power [61]) |
| External costs influencing vehicle end-of-life management (Anderson [62]) |
| Greenhouse gas emissions (Sopha [63], Gorner [64]) |
| Maintenance cost in relation to operating costs (Spitzley [65]) |
| Potential for vehicle recycling (Li [66]) |
| Percentage of Sample | |||
|---|---|---|---|
| Data | Response | Serbia | Montenegro |
| Age of motor vehicle | 10–15 years | 40% | 53% |
| 16–25 years | 38% | 27% | |
| 26+ years | 22% | 20% | |
| Type of motor vehicle | Commercial van | 24% | 32% |
| Commercial car | 10% | 11% | |
| Commercial truck | 30% | 28% | |
| Passenger car | 30% | 22% | |
| Bus | 6% | 7% | |
| Key Indicators | Intra-Cluster Ranges of Variables | |||
|---|---|---|---|---|
| Active Use Phase | End of Life Phase | |||
| Passenger Vehicle | Commercial Vehicle | Passenger Vehicle | Commercial Vehicle | |
| Average age of motor vehicles | 10–14 years old | 9–11 years old | At least 14 years old | At least 12 years old |
| Number of travelled km | Below 200,000 km | Below 300,000 km | Above 200,000 km | Above 300,000 km |
| Estimated loyalty to the brand of vehicle | High to very high | Very low to low | Medium to low | Medium to low |
| External costs | Low to medium | Medium to high | Medium to high | High to very high |
| Estimation of harmful gas emissions | Low to medium | Medium to high | High to very high | Medium to high |
| Maintenance cost in relation to operating cost | Low to medium | Low to medium | Medium to high | High to very high |
| Possibility of recycling the vehicle | Medium to very high | Medium to low | Very low to medium | Very low to low |
| Estimated period for replacement/dismantling of vehicle | 3–5 years | 1–2 years | 1–2 years | 0–1 year |
| C1—Active-Use Phase of Life Cycle C2—End-of-Life Phase of Life Cycle | ||||
|---|---|---|---|---|
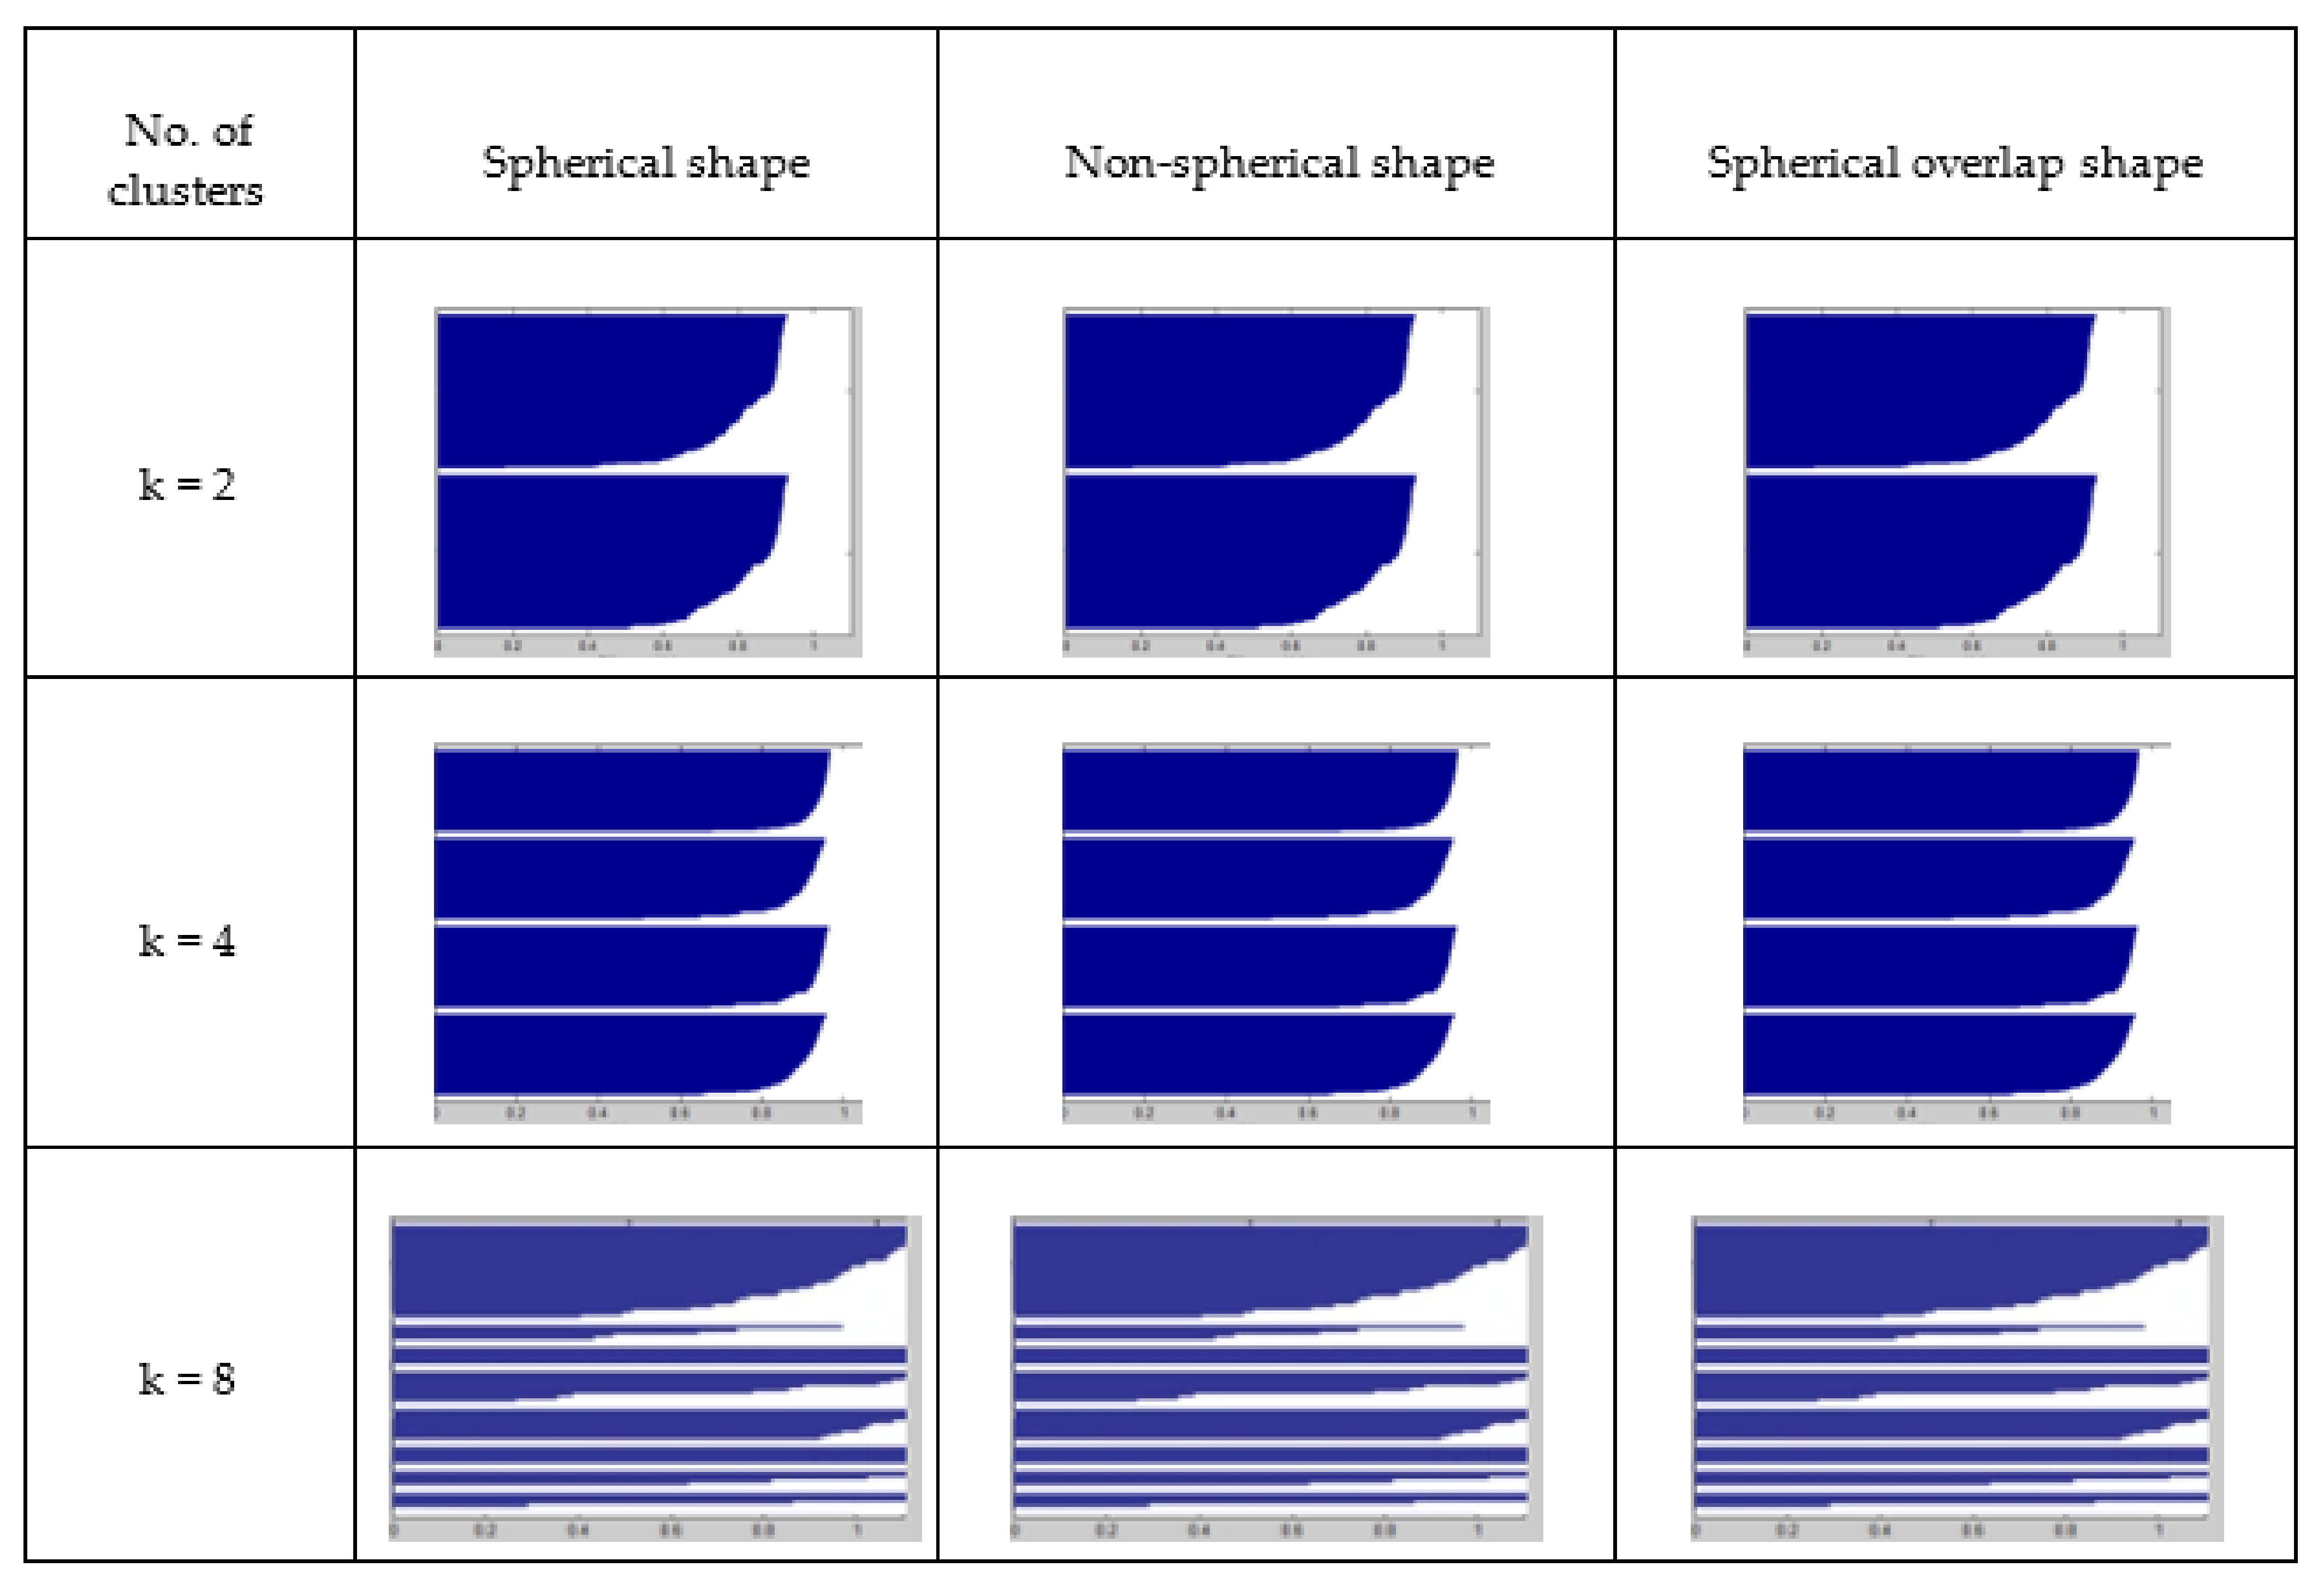
| No. of Clusters | SSE | ARI | VI | NMI |
| K = 2 | 1911 | 0.36 | 0.87 | 0.43 |
| K = 3 | 1083 | 0.28 | 0.66 | 0.55 |
| K = 4 | 933 | 0.27 | 0.59 | 0.72 |
| K = 5 | 941 | 0.27 | 0.57 | 0.76 |
| K = 6 | 944 | 0.31 | 0.55 | 0.80 |
| K = 7 | 975 | 0.30 | 0.52 | 0.81 |
| K = 8 | 972 | 0.31 | 0.51 | 0.84 |
| Variable | Segment of Sample | Sub-Sample | ANOVA (Sources of Variability Within and between Groups) | ||||
|---|---|---|---|---|---|---|---|
| Sum of Squares | Mean of Squares | F Test p-Value | |||||
| Between Groups | Within Groups | Between Groups | Within Groups | ||||
| C1—Active-use phase | Passenger vehicles | Serbia | 226,153 | 14,356 | 12,786 | 9657 | F 11.64 p-value < 0.01 |
| Montenegro | 192,786 | 12,455 | 11,655 | 9157 | F 12.08 p-value < 0.01 | ||
| C3—Active- use phase | Commercial vehicles | Serbia | 186,533 | 22,391 | 18,954 | 8987 | F 9.12 p-value < 0.01 |
| Montenegro | 176,353 | 21,082 | 17,898 | 9165 | F 10.09 p-value < 0.01 | ||
| C2—End-of=life phase | Passenger vehicles | Serbia | 84,566 | 8245 | 18,966 | 7155 | F 13.33 p-value < 0.01 |
| Montenegro | 79,633 | 7654 | 17,654 | 7537 | F 11.91 p-value < 0.01 | ||
| C4- End of life phase | Commercial vehicles | Serbia | 53,662 | 14325 | 18,356 | 6778 | F 8.36 p-value < 0.01 |
| Montenegro | 52,356 | 11,765 | 16,859 | 7511 | F 9,.18 p-value < 0.01 | ||
Publisher’s Note: MDPI stays neutral with regard to jurisdictional claims in published maps and institutional affiliations. |
© 2022 by the authors. Licensee MDPI, Basel, Switzerland. This article is an open access article distributed under the terms and conditions of the Creative Commons Attribution (CC BY) license (https://creativecommons.org/licenses/by/4.0/).
Share and Cite
Vesovic, V.; Jovanovic, D.; Arsic, M.; Avramovic, Z.; Sofijanic, S.; Djorovic, B.; Gospic, N.; Tomovic, N.; Milosevic, D.; Dobric, M.; et al. Identification of the Right Moment for Motor Vehicle Replacement—Life-Cycle Analysis in Serbia and Montenegro. Sustainability 2022, 14, 2744. https://doi.org/10.3390/su14052744
Vesovic V, Jovanovic D, Arsic M, Avramovic Z, Sofijanic S, Djorovic B, Gospic N, Tomovic N, Milosevic D, Dobric M, et al. Identification of the Right Moment for Motor Vehicle Replacement—Life-Cycle Analysis in Serbia and Montenegro. Sustainability. 2022; 14(5):2744. https://doi.org/10.3390/su14052744
Chicago/Turabian StyleVesovic, Vujadin, Dragutin Jovanovic, Milos Arsic, Zoran Avramovic, Svetozar Sofijanic, Boban Djorovic, Natasa Gospic, Nena Tomovic, Dragan Milosevic, Mladen Dobric, and et al. 2022. "Identification of the Right Moment for Motor Vehicle Replacement—Life-Cycle Analysis in Serbia and Montenegro" Sustainability 14, no. 5: 2744. https://doi.org/10.3390/su14052744