Article

Techno-Environmental Analyses and Optimization of a Utility Boiler Based on Real Data

by
Sajad Koochakinia
1,
Amir Ebrahimi-Moghadam
2,* and
Mahdi Deymi-Dashtebayaz
1
1
Department of Mechanical Engineering, Hakim Sabzevari University, Sabzevar 9617976487, Iran
2
Mechanical Engineering Department, Faculty of Engineering, Ferdowsi University of Mashhad, Mashhad 9177948974, Iran
*
Author to whom correspondence should be addressed.
Sustainability 2022, 14(5), 2592; https://doi.org/10.3390/su14052592
Submission received: 14 January 2022 / Revised: 17 February 2022 / Accepted: 21 February 2022 / Published: 23 February 2022

Abstract

:
A numerical simulation for analysis and optimization of the performance and NOx production was applied to a natural gas fuel boiler in South Pars Gas Complex. For this purpose, nine actual environmental and operational parameters of a boiler were measured and recorded every two hours and then averaged daily for a year. Using the thermodynamic laws, important parameters such as body and exhaust flue gas losses, as well as the thermal efficiency and exergy efficiencies of the combustor and boiler, were calculated for each day. The results show that, owing to changes in the environmental and operational conditions, the thermal and exergy efficiency of the boiler varied from 83% to 87% and 27% to 32%, respectively, during the year. In addition, by optimizing the excess air percentage, the thermal and exergy efficiencies could be increased by 1.5% and 3%, respectively, for most days of the year.

1. Introduction

Nowadays, the optimized consumption of energy is one of the most important concerns of human beings [1,2,3]. Efforts for assessing and identifying energy waste resources in the different fields of industry for the purpose of conducting optimization processes is also a major concern [4,5,6]. Boilers as steam generating equipment are widely used in various industries such as paper products, food products, chemicals, refineries, and primary metals; the ratio of energy consumption to total energy for steam production in these industries is 81%, 57%, 42%, 23%, and 10%, respectively [7,8]. Considering the expensive process of steam production and its economic valuation, analyzing, optimization, and reducing pollution emissions in boiler operation is of great importance. A common fuel used in boilers is natural gas, which according to the results of various studies, is because natural gas as a fuel produces lower emission levels of air pollutants. Li et al. [9] examined the effects of various fossil fuels such as coal, oil, and natural gas on the boiler performance, and the results indicate that natural gas is better than fossil fuels.
The numerical simulation based on the first law of thermodynamics is an effective method for studying the performance of boilers [10]. The energy efficiency of the boilers is closely related to their energy consumption. One of the best ways to optimize boiler efficiency is to increase the water heat transfer and to decrease the boiler heat loss as much as possible. The heat losses of boilers accrue in different ways, including hot flue gas, radiation, and, in the case of steam boilers, blowdown losses. It is necessary to optimize that part of the boiler plant where energy wastage is likely to occur. All the heat produced by the burning fuel cannot be transferred to water or steam in the boiler, therefore 10–30% of energy is lost through flue gases. If some of this waste heat in the flue gas could be recovered, a considerable amount of energy could be saved.
The calculation of energy and exergy efficiencies is appropriate for designing, analyzing, optimizing, and improving energy systems such as the industrial boiler. Exergy analysis has been widely used for performance evaluation of thermal and thermochemical systems. The exergy analysis helps to improve the efficiency of systems. Many researchers studied exergy analyses of boilers as used in various industrial settings. In one of the studies, Ebrahimi-Moghadam et al. [11] proposed a novel control system for indirect boilers of natural gas pressure reduction stations (PRSs). Their analyses revealed that their proposed system leads up to a 28.54% increment in the boiler sufficiency and USD $3671 of cost saving. Shokouhi Tabrizi et al. [12] evaluated the feasibility of utilizing a novel solar-based hybrid energy system instead of conventional heaters used in natural gas PRSs. Their results showed that utilizing their proposal leads to 4.87 million m3 of fuel saving each year. In another work in this category of study, Ebrahimi-Moghadam and Farzaneh-Gord [13] introduced a new tri-generation energy system (which produces electricity, heat, and hydrogen) to be replaced with conventional PRS boilers. They applied a robust evaluation model based on the combination of exergy principle with economic and environmental analyses. They also applied a powerful optimization technique and reached payback period of 6.77 years at the best operating conditions. Ebrahimi-Moghadam et al. [14] also designed another layout of such systems, which comprises gas turbine and Kalina power cycles and a heat exchanger that acts as the boiler of natural gas pressure reduction process. The optimal energetic and exergetic efficiencies of their system were obtained as 55.57% and 39.5%, respectively. Rosen et al. [15] studied an industrial heating process with steam through exergy analysis. They concluded that exergy analysis appears to be a key concept in the process of the energy center’s optimization. Saidur et al. [16] investigated the performance of a different section of boilers based on the energy and exergy efficiencies. According to their research, the energy and exergy efficiencies in their targeting cycle are calculated as 72.46% and 24.89%, respectively; based on their results, it is understood that the combustion compartment and the thermo-converter are the main reasons for exergy deterioration. Aljundi [17] calculated the energy and exergy losses of a steam power plant in Jordan, based on which he reports that, among all the equipment, the boilers are known as the component with the highest rate of exergy destruction. To reduce the exergy destruction, he suggested preheating the air needed for combustion and reducing the air-to-fuel ratio.
One of the most important parameters in boiler operation is the percentage of excess air entering the combustion chamber. Many researchers have worked on the optimum values of excess air entering the boilers. Kang et al. [18] studied the combustion process in boilers with various amounts of excess air and proposed methods for improvements in functionality. Rosen and Tang [19,20] studied the effect of excess air percentage on the irreversibility and exergy destruction of a steam boiler. They report that, by decreasing the excess air from 40% to 15%, there could be an increase in energy and exergy efficiencies by 1.4%. In another study, Habib et al. [21] introduced the main factors of exergy destruction in boilers as used in a power plant. According to their result, the effective parameters in exergy destruction of the boilers is the excess air percentage and the exhaust temperature. Li et al. [22] defines percentage of excess air as an effective parameter of boiler efficiency. The results in this article show that, increasing the percentage of excess air from 20% to 32% can reduce the exergy efficiency of the boiler from 34.4% to 34.1%. Singh [23] concludes that the main reason for the irreversibility in boilers is the chemical reaction between air and fuel. The reduction of excess air percentage in the combustion chamber of the boiler and the temperature reduction of output gasses are announced to be the effective factors in the exergy of combustion compartments of the boilers.
As known, with the diminishing of the excess combustion air in the boiler, the rate of NOx production in the combustion chamber also reduces. Considering this fact, it is necessary to find a solution to eliminate this undesired product. Although it is impossible to completely eliminate NOx production, methods such as combustion control and post-combustion control have been proposed to reduce its production. In the combustion control method, based on changing or correcting the combustion conditions, the NOx production can be controlled. In the post-combustion control method, the emission of NOX can be reduced by conducting a chemical reaction in the flue gas stream [24,25,26,27]. In one study, Li et al. [27] performed industrial experiments on a boiler with capacity of 660 MW. They measured the initial combustion of the fuel–air mixture, the gas temperature distribution inside the furnace, and the gas composition in the furnace for loads of 660, 550, and 330 MW. Based on their results, as the load decreased, the furnace gas temperature decreased. Additionally, the flue gas exhaust temperature decreased from 129.8 to 114.3 °C and the NOx emission rate decreased from 2448 to 1610 mg/m3. In another study, Li et al. [28] investigated the 300 MW utility boiler that was able to reduce NOX emissions by 44%; meanwhile, the boiler efficiency reduced by only 0.21%.
As evident in previous studies, the reduction of excess air can lead to improving the boiler performance as well as reducing pollutant emissions. However, in very low excess air ratios, less than the so-called critical excess air ratio, CO is formed in the boiler combustion chamber, indicating incomplete combustion. Conversely, the absence of CO in the chamber indicates that the amount of excess air has not exceeded the critical excess air ratio [29,30].
As seen, none of the above studies considered using the complete time period information to investigate the boiler momentary and continuous operations. For calculating the evaluation parameters, such as energy and exergy efficiencies, and pollutant emissions, a considerable amount of the boiler’s environmental and operational information needs to be measured and recorded during a year. Based on this information, the boiler performance is monitored instantaneously, and accordingly, a comprehensive control program can be developed to achieve optimal operating conditions for every moment throughout the year.
In this current research, a thermo-environmental study using energy, exergy, and environmental analysis is conducted to evaluate the performance of boilers in refinery. To make the modeling procedure even more applicable, we use unit 121 of the fourth refinery in the South Pars Gas Complex. For this goal, the actual environmental and operational parameters of the refinery boiler are measured and recorded on average daily during the year. The environmental parameters include the relative humidity, ambient temperature, and the wind speed on the boiler body; the operational parameters include the air and fuel flow rates to the combustion chamber, temperature of the boiler feed water, the flow rate and temperature of the steam, and finally the temperature of the exhaust gas from the chimney. After measuring the required parameters, a thermodynamic program is developed to calculate the body and chimney losses, thermal efficiency, exergy of the combustion chamber, exergy efficiency, and NOx and CO production of the boiler. Finally, with the operational calculations carried out in different boiler sections, operational recommendations for optimizing boilers are suggested.

2. Boiler Description

The South Pars gas field is the largest gas refinery in the Middle East, with an area of 9700 km2 (square kilometers), of which 3700 km2 are in Iran’s water. According to the Iran Petroleum Ministry, the proven natural gas reserves of Iran are about 1.201 trillion cubic feet (34.0 trillion cubic meters) or about 17.8% of the world’s total reserves, of which 33% are in associated gas and 67% is in non-associated gas fields. The fourth refinery of the South Pars Gas Complex is located in southwestern Iran, and utility unit 121 of the refinery has five boilers (A, B, C, D, and E), which provide 470 ton/h of steam needed by the refinery. The fourth refinery boilers are shown in Figure 1. In order to calculate the energy and exergy efficiencies, the performance of the various sections of the boiler must be determined. For this purpose, the measurement of the thermodynamic parameters of various parts of the boiler is necessary. Based on this, Figure 2 presents the two main parts of boilers schematically, including the combustion chamber and heat transfer. Moreover, the required thermodynamic parameters of the boiler that must be measured are specified in this figure.
The refinery boilers are of the water-tube type and their fuel consumption is natural gas. The nominal condition of boilers and composition of their fuel consumption are presented in Table 1 and Table 2, respectively.
The information pertaining to the recorded values for the minimum and maximum conditions for a period of one year is illustrated in Table 3.

3. Mathematical Modeling of the System

In this section, a detailed formulation associated with energy, exergy, and environmental (3E) analyses is presented. With the help of the developed program, the energy and exergy efficiencies and the pollutant emissions caused by the boiler could be calculated during a year. To have an overview of this section around the mentioned analyses, a flowchart is drawn in Figure 3.

3.1. Combustion Analysis

Based on South Pars boiler fuel composition information as given in Table 2, the stoichiometric equation of the boiler’s combustion chamber is presented. Taking into account the operating conditions of the boiler in all days of 2016 and based on the actual data recorded, the combustion equation was created. Thereby, Equation (1) presents the combustion reaction affected by a humidity of 69% and without excess air, whereas the same conditions with 40.83% excess air in January are presented as Equation (2).
[ 0.9272 C H 4 + 0.0157 C 2 H 6 + 0.0041 C 3 H 8 + 0.0023 C 4 H 10 + 0.00002 C 5 H 12 + 0.0140 C O 2 + 0.0343 N 2 ] + 1.9444 [ O 2 + 3.76 N 2 + 0.07302 H 2 O ] 0.994 C O 2 + 0.142 H 2 O + 7.311 N 2 + 0.916 O 2
[ 0.9272 C H 4 + 0.0157 C 2 H 6 + 0.0041 C 3 H 8 + 0.0023 C 4 H 10 + 0.00002 C 5 H 12 + 0.0140 C O 2 + 0.0343 N 2 ] + 2.7391 [ O 2 + 3.76 N 2 + 0.07302 H 2 O ] 0.994 C O 2 + 2.129 H 2 O + 10.3 N 2 + 0.7941 O 2
In reality, the stoichiometric fuel-to-air ratio cannot be used to achieve a maximum combustion efficiency. If the air in the combustion chamber is less than its stoichiometric ratio, the mixture is described as fuel rich; conversely, if the air is more than the stoichiometric ratio, the mixture is described as fuel lean. Therefore, the following relationships are introduced to identify the combustible mixture and calculate the excess air percentages. The fuel-to-air ratios in actual and stoichiometric states can be calculated by Equations (3) and (4), respectively. Additionally, in order to identify the type of mixture, the equivalence ratio is used based on Equation (5).
f = m f m a
f s = M f s 4.76 × X × M a s
ϕ = f f s { ϕ < 1 : l e a n m i x t u r e ϕ = 1 : s t o i c h i o m e t r i c m i x t u r e ϕ > 1 : r i c h m i x t u r e
where, f and f s are the ratios of fuel-to-air in actual and stoichiometric states, respectively. The parameter ϕ is normalizing the actual fuel-to-air ratio by the stoichiometric fuel-to-air ratio, giving the equivalence ratio. According to Equation (6), λ is defined as the ratio of the actual air-to-fuel ratio to the stoichiometric air-to-fuel ratio:
λ = 1 ϕ
Finally, the excess air percentage can be calculated from Equation (7) [29]:
%   E A = 100   ( λ 1 )

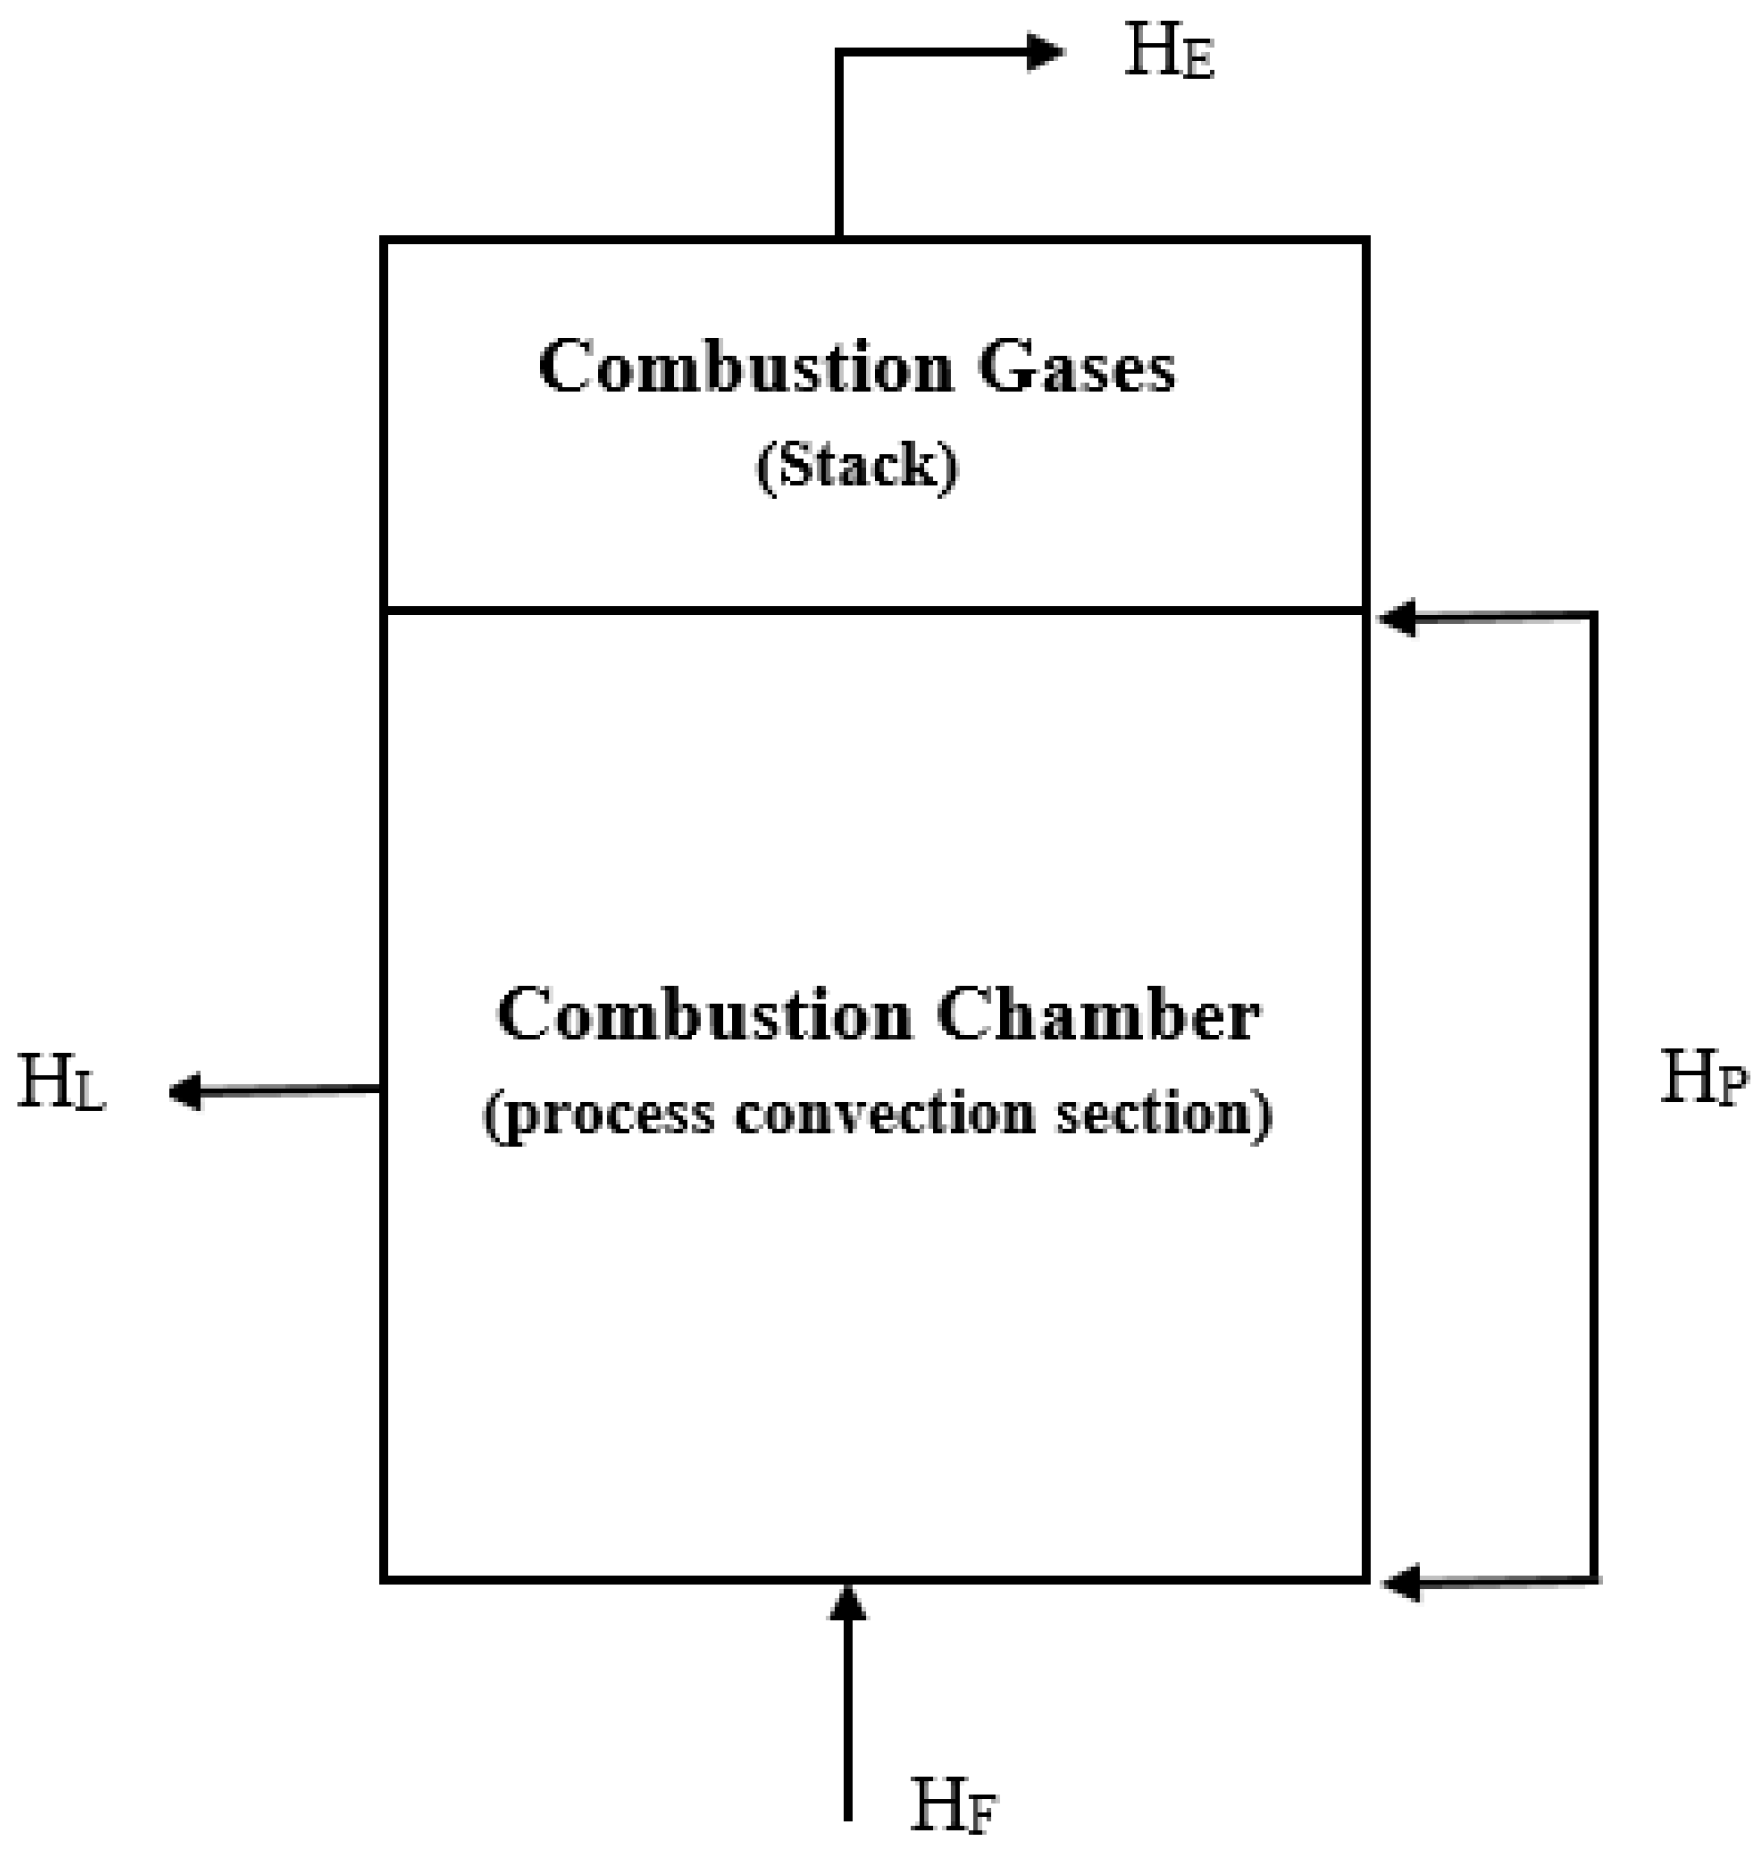
3.2. Energy Analysis

As shown in Figure 2, the sum of the incoming mass flow rates will be equal to the mass flow rates of the outgoing mixture in the boiler. Based on this, the continuity equation can be presented as follows:
m ˙ i = m ˙ e m ˙ F + m ˙ a m ˙ p = 0
Moreover, within the boiler, the main contribution to the energy flow is the combustor, wherein the combustion process leads to energy production. As shown in Figure 4, most of the thermal energy produced in the combustor is transferred to the steam flow, and part of this energy is lost through the body and the stack. Based on this, the energy balance for the combustor of the boiler can be written as follows:
H F = H P + H L + H E
where, H P is heat energy of combustion product, and H L and H E are the thermal losses of body and stack, respectively.
After re-arranging, Equation (9) is written as follows:
( H P H F + H L H F + H E H F ) × 100 = 100 %
In Equation (10), ( H P H F ) , ( H L H F ) , and ( H E H F ) are the thermal efficiency, body heat losses, and stack heat losses of the boiler, respectively.
The thermal dissipation off the outer surface of the boiler happens in two ways—radiation and transmission. Generally, the effective factors for the thermal dissipation off the outer surface of the boiler are as follows:
(a)
The temperature of the outer surface of the boiler;
(b)
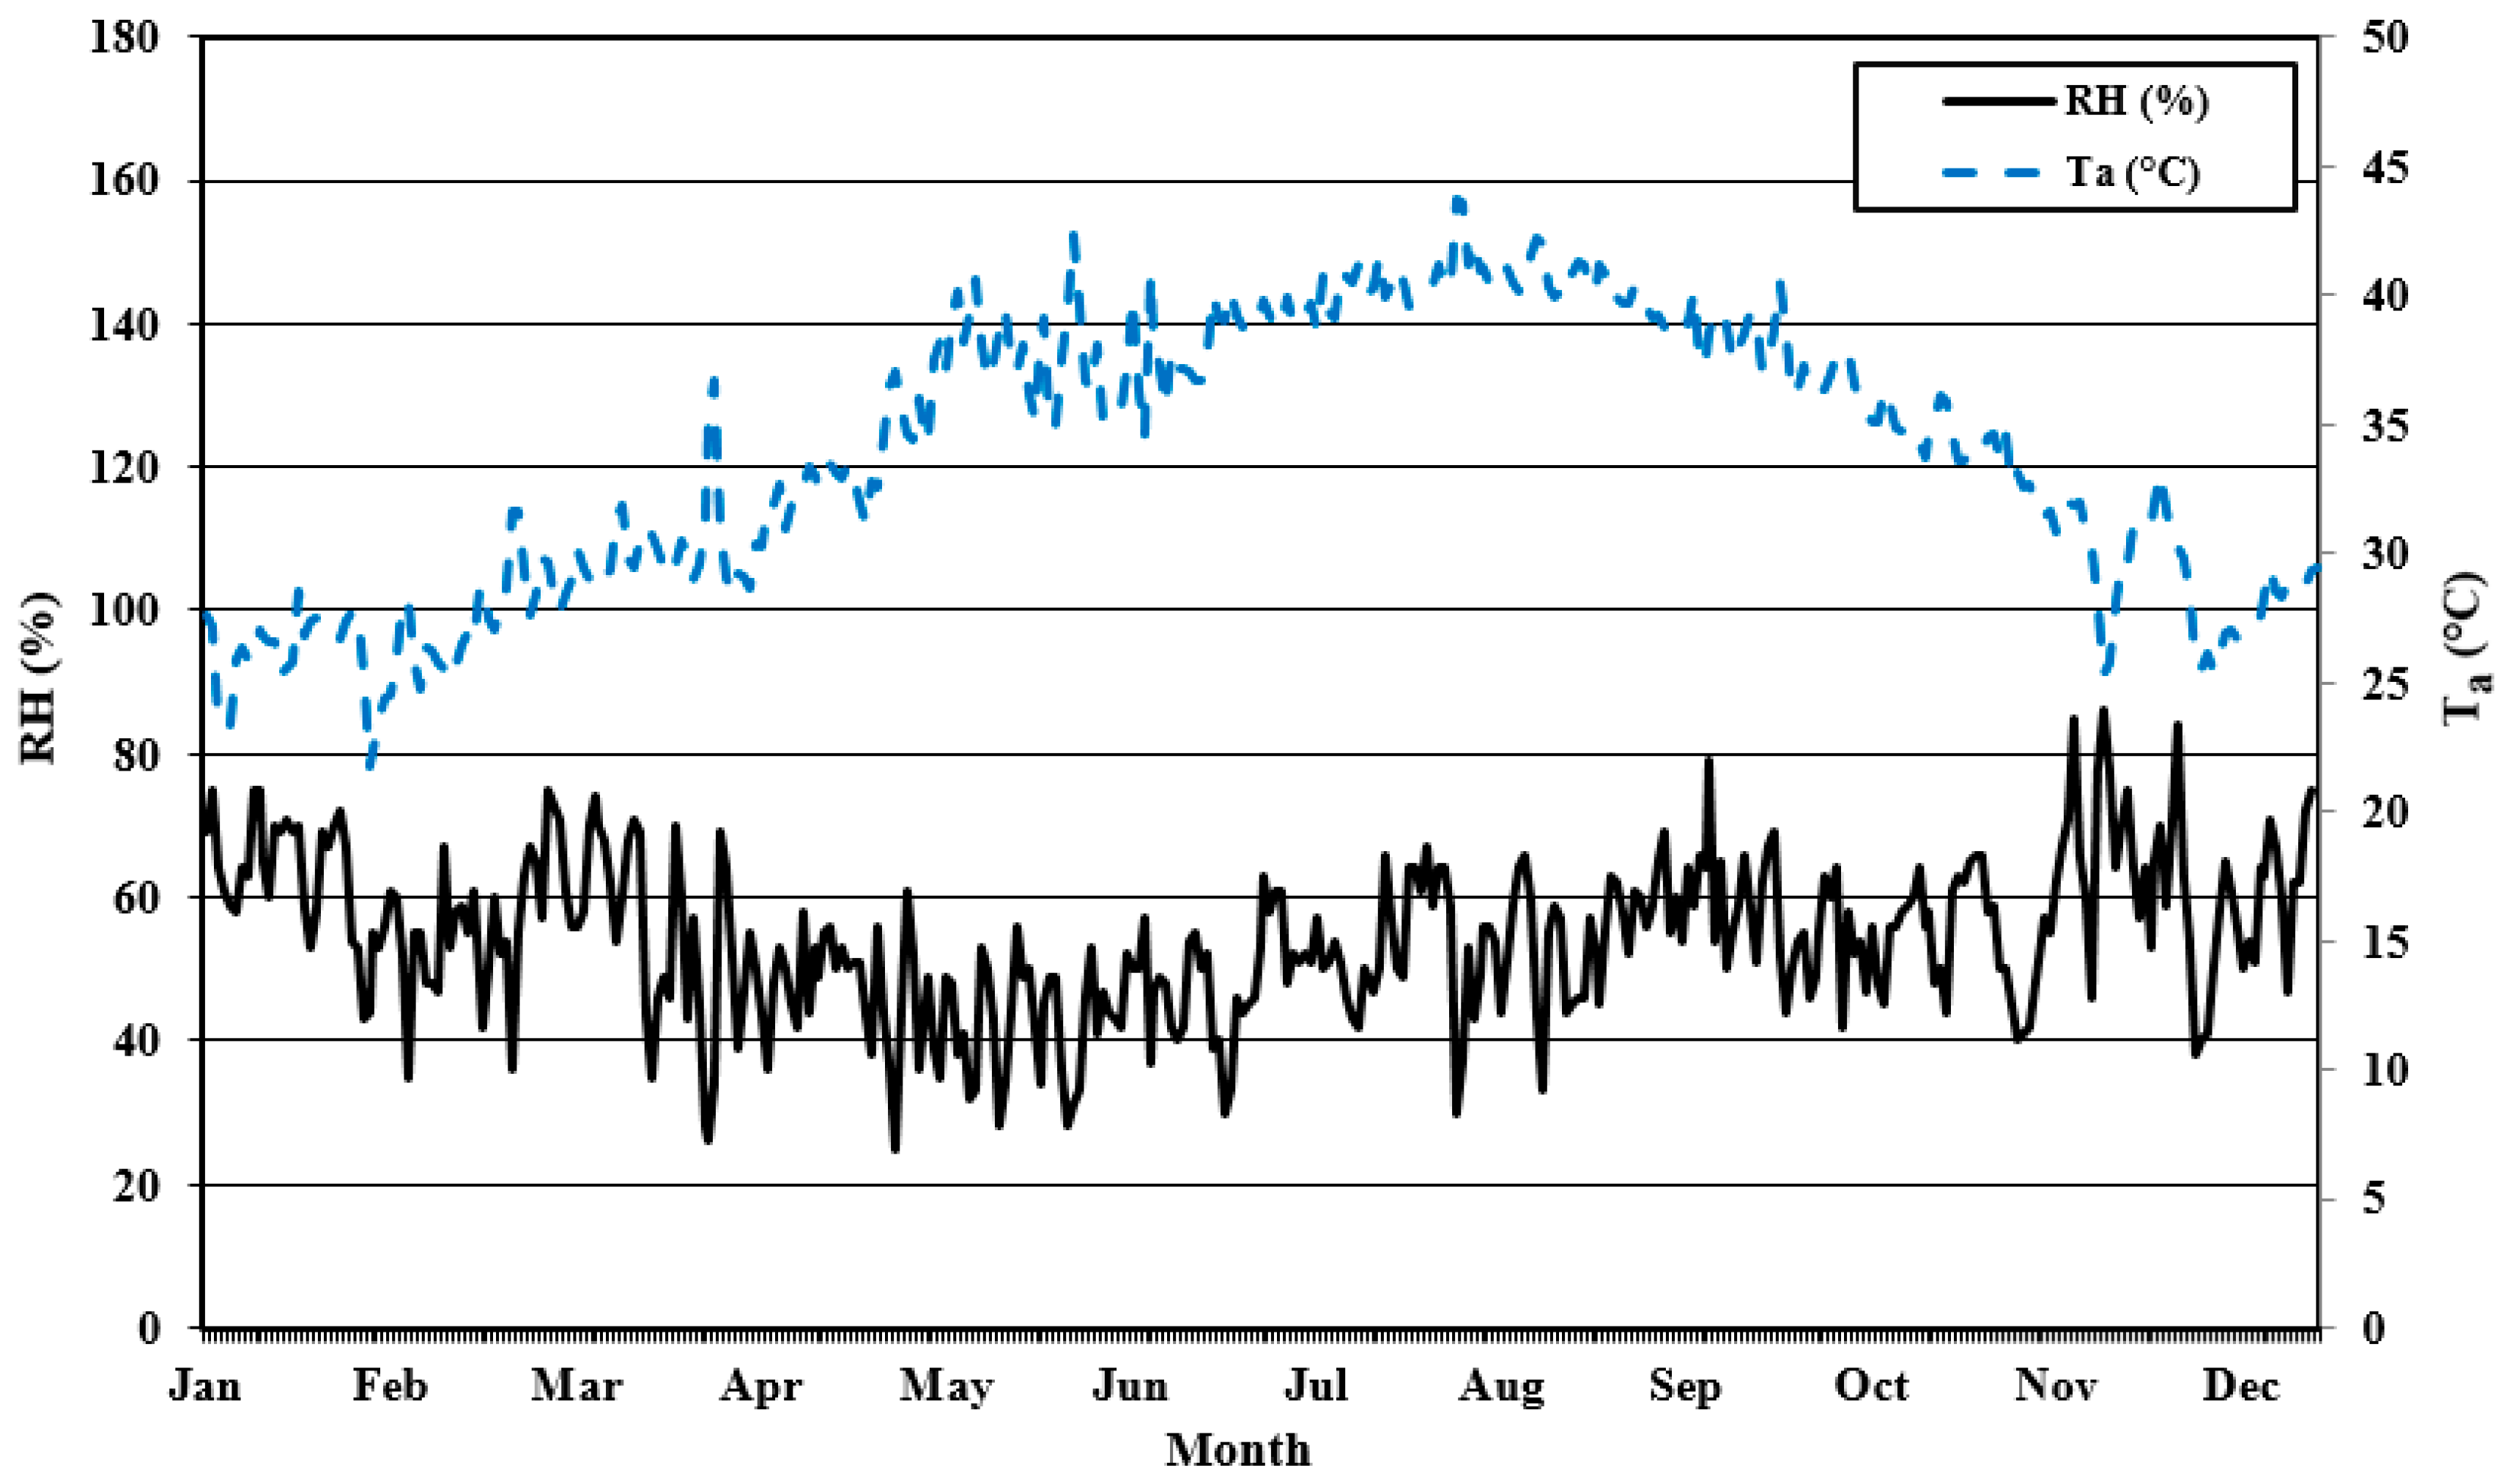
The environmental temperature and the wind speed around the boiler;
(c)
The boiler’s outer surface area;
(d)
The radiation heat transfer coefficient of the boiler.
Equations (11) and (12) can be used to calculate the thermal losses from the external surface of the boiler [30]:
H L = 0.174 × ε × ( T 1 4 T 0 4 ) × 10 8 + 0.296 × ( T 1 T 0 ) 1 / 25 × ( v w + 69 ) 69
H L = A × H L
The heat loss from the stack includes the heat loss caused by moisture in the fuel, the loss of dry gas heat, and the heat dissipation in the presence of moisture in the gas combustion. In order to calculate the heat loss percentage from the stack, the graphs presented in Reference [31] can be used to determine the enthalpy of the exhaust gases. The percentage of heat dissipation from the stack is calculated from Equation (13):
H E H F = ( m ˙ a + m ˙ F ) h E m ˙ F × L H V × 100
The heat absorbed (kJ/s) by the process fluid is taken as H P (kJ/s) and the heat generated by the fuel is denoted as H F (kJ/s); then, by determining the percentage of thermal losses from the stack body, it is possible to use Equation (14) to obtain the boiler thermal efficiency [31]:
η B o i l e r = ( H P H F ) × 100 = { 1 ( H L H F + H E H F ) }

3.3. Exergy Analysis

The boiler internal losses of exergy are defined as the sum of exergy losses of combustion, heat transfer and stack exergy, and the ability to perform work until it reaches equilibrium with the environment (heat source). Thus, after reaching equilibrium with the environment, the content of the exergy will be zero. Contrary to energy, which does not get lost and only transforms from one type to another (the first law of thermodynamics), exergy is lost due to irreversibility during a process. Neglecting the kinetic and potential energy changes, Equation (15) defines the exergy balances of any control volume at a steady state [32,33,34].
( 1 T 0 T )   Q ˙ c . v + W ˙ c . v = m ˙ e ψ e m ˙ i ψ i + I ˙
where, the parameters of ( 1 T 0 T ) Q ˙ c . v , W ˙ c . v , and I ˙ , respectively denote the net exergy transfer by heat at the temperature of T , the work input, and the irreversibility rate of system indicating the difference between the reversible work and the real work. Additionally, ψ is the current exergy on the mass unit given by Equation (16) [35]:
ψ = ( h h 0 ) T 0 ( s s 0 )

3.3.1. Combustion Chamber Exergy Analysis

According to Equation (17), the thermomechanical exergy of combustion gases at the stack temperature can be obtained [36]:
ψ T h = i = 1 n y i [ h i , T h i , T 0 T 0 ( s i , T 0 s i , T 0 0 ) + R T ln P P 0 ]
The chemical exergy of the combustion gases is defined as follows [37]:
ψ c h = R T 0 i = 1 n N t ln p t , 0 p t , 00 = R T 0 i = 1 n N t ln y t , 0 y t , 00
The total exergy of the boiler combustion chamber as a sum of thermomechanical and chemical exergies is calculated as:
ψ T = i = 1 n y i [ h i , T h i , T 0 T 0 ( s i , T 0 s i , T 0 0 ) + R T ln P P 0 ] + R T 0 i = 1 n N t ( ln y t , 0 y t , 00 )
According to Equation (20), the ratio of the exergy losses of combustion gases to the exergy of the fuel into the combustion chamber can be obtained as:
ψ E ψ c h , f = N E N F ψ E ψ c h , f
Based on the real components of combustion reaction, the chemical exergy of natural gas fuel in the South Pars refinery is defined as follows [38]:
ψ c h , f = { [             ( 0.9272 × g ¯ C H 4 ) + ( 0.0157 × g ¯ C 2 H 6 ) + ( 0.0041 × g ¯ C 3 H 8 ) +             ( 0.0023 × g ¯ C 4 H 10 ) + ( 0.0002 × g ¯ C 5 H 12 ) + ( 0.0140 × g ¯ C O 2 ) + ( 0.0343 × g ¯ N 2 ) + ( E A × 1.9444 × g ¯ O 2 ) + ( E A × 1.9444 × 3.76 × g ¯ N 2 ) + ( E A × 1.9444 × Y × g ¯ H 2 O ) ] [ ( 0.994 × g ¯ C O 2 ) + ( g ¯ H 2 O ) + ( g ¯ N 2 ) + ( g ¯ O 2 ) ] } ( T 0 , P 0 ) { [ ( 0.994 × ψ c h , C O 2 ) + ( A × ψ c h , H 2 O ) + ( B × ψ c h , N 2 ) + ( C × ψ c h , O 2 ) ] [ ( E A × 1.9444 × ψ c h , O 2 ) + ( E A × 1.9444 × 3.76 × ψ c h , N 2 ) + ( E A × 1.9444 × Y × ψ c h , H 2 O ) ] }

3.3.2. Exergy Efficiency for Boilers

The exergy efficiency of the combustor and boiler are presented as Equations (22) and (23), respectively:
η C o m b u s t o r = m ˙ E ψ E m ˙ F ψ c h , f
η E x e r g y   B o i l e r = m ˙ s ( ψ e -   ψ i ) m ˙ F ψ c h , f + m ˙ a ψ a
In Equation (23), because the air inlet to the combustion chamber does not preheat, the amount of exergy of the intake air to the combustion chamber will be zero.

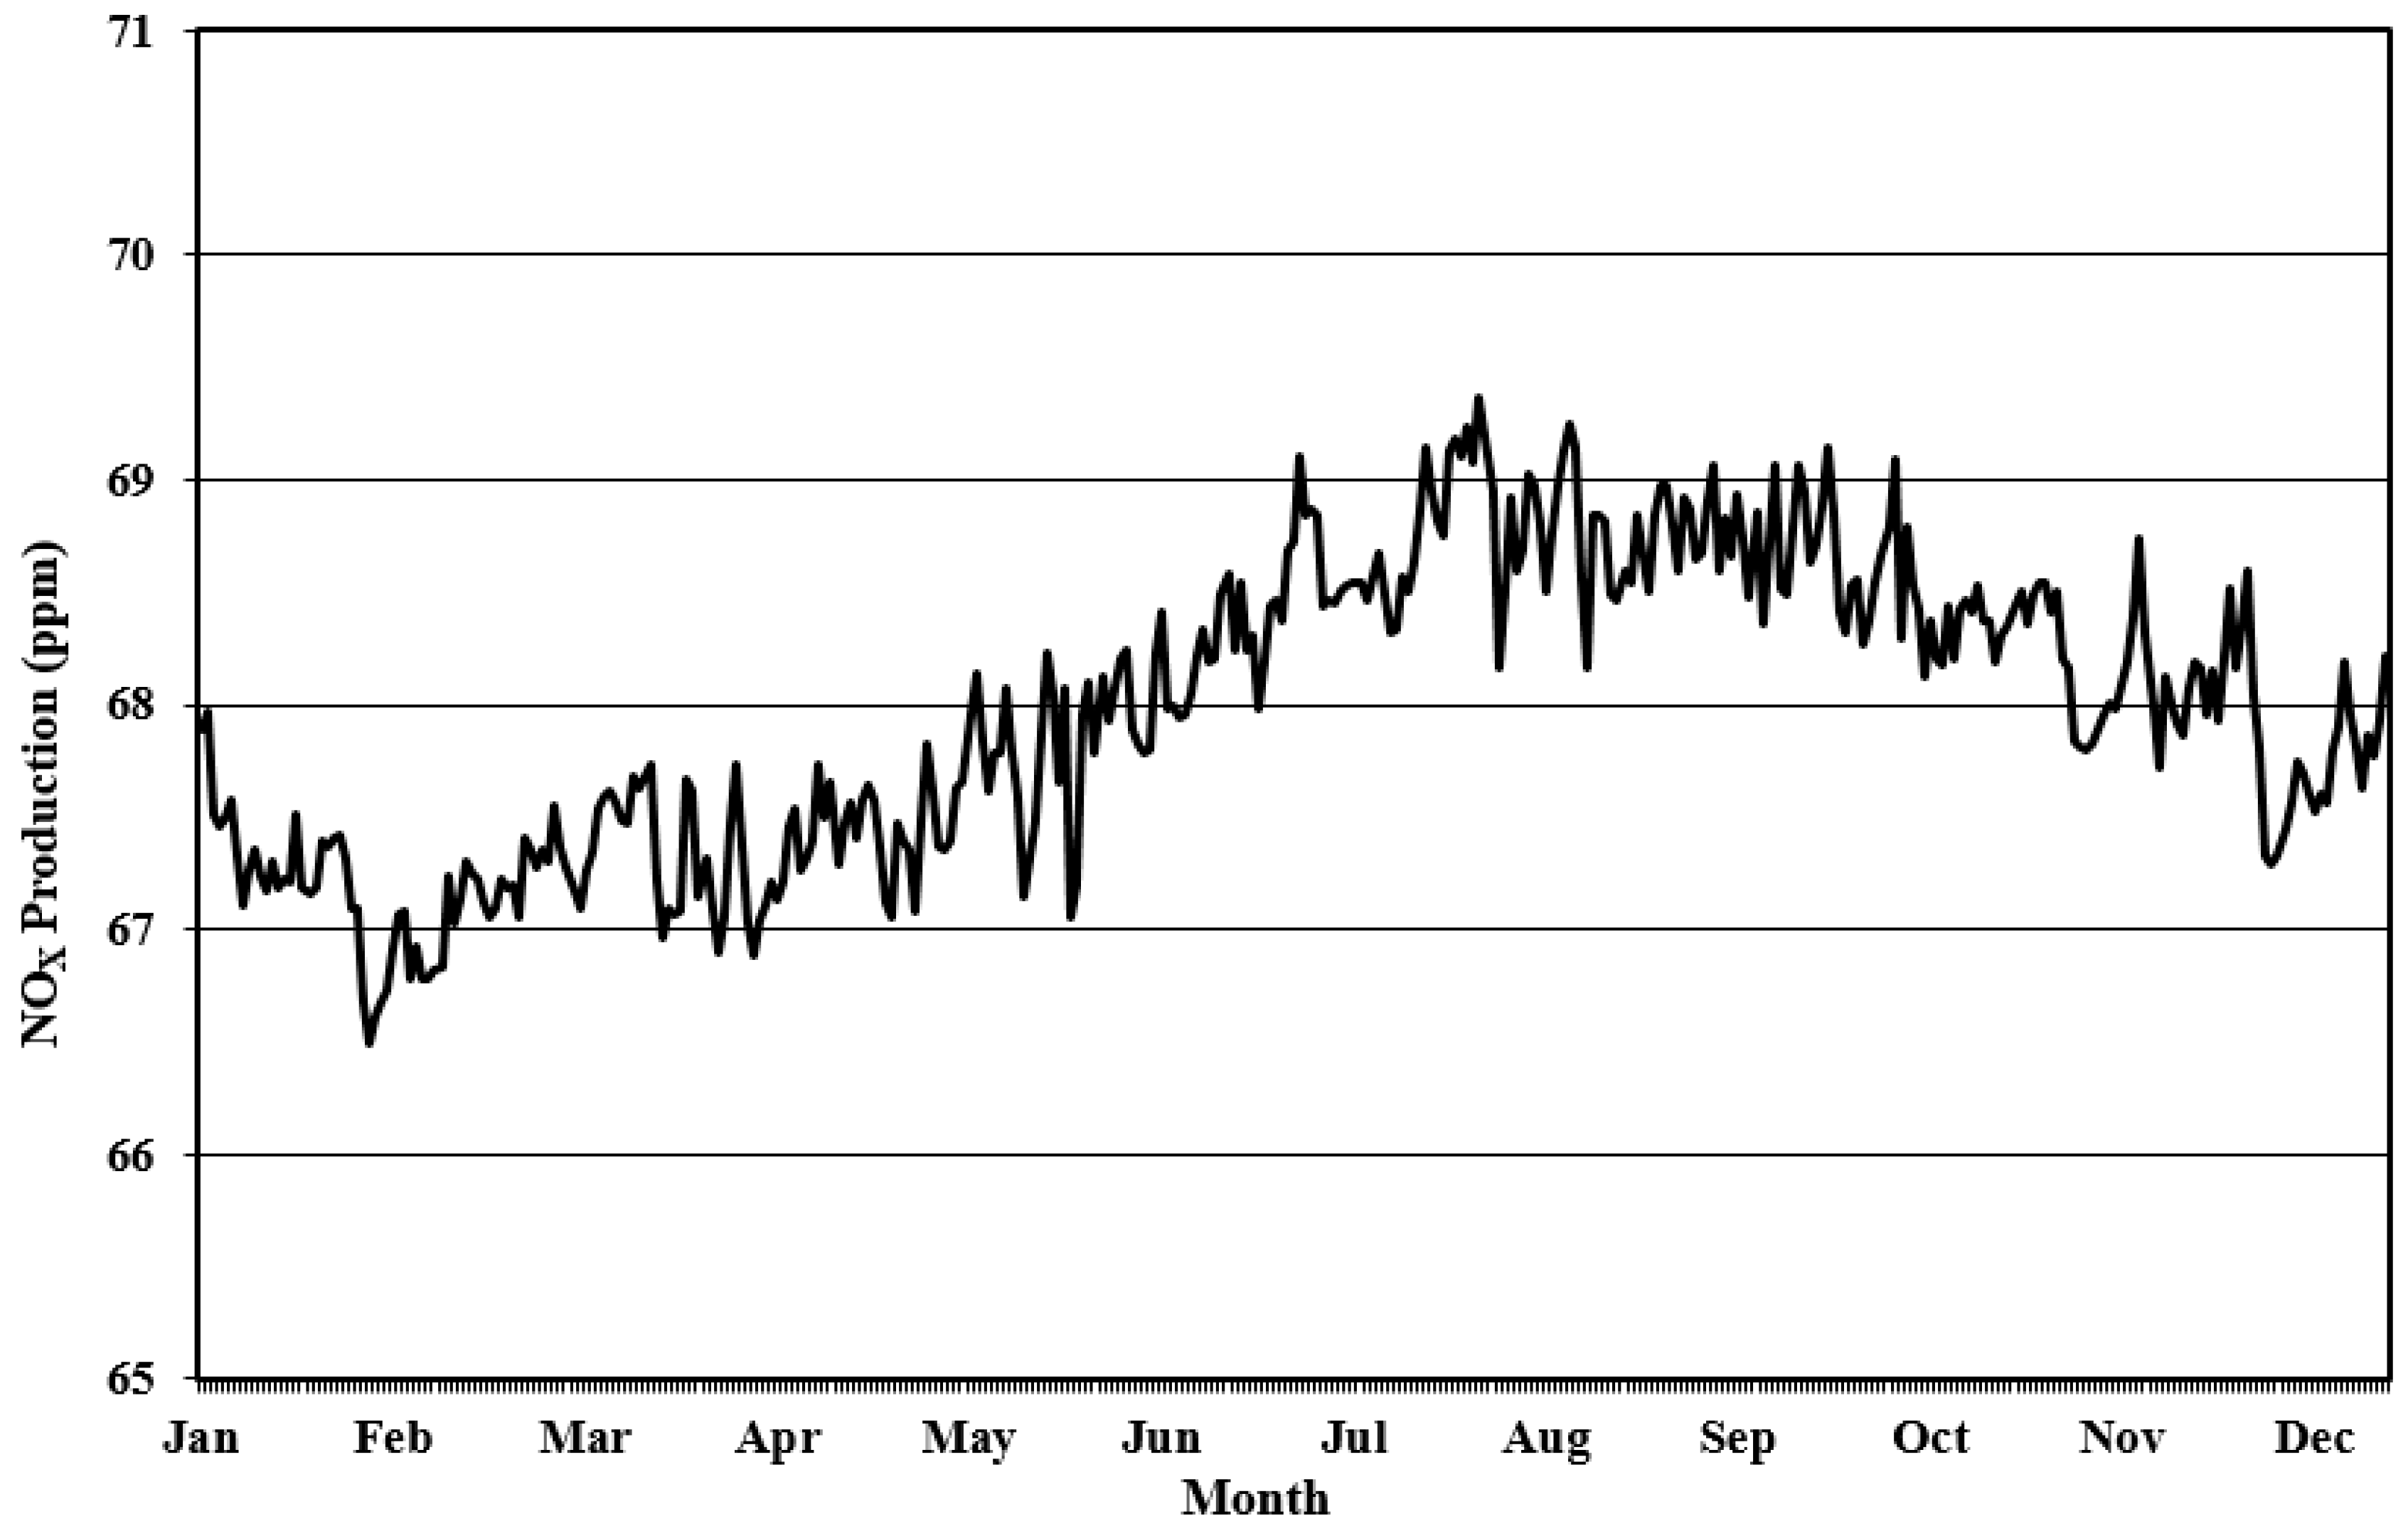
3.4. Environmental Impacts Analysis

In this section, the production of NOx pollution due to the combustion process of the boiler is presented. The NOx pollution production can be calculated as [39]:
V NO X = 10 6 × Y × N 46 × MW m ˙ E × 21 3 21 ( O 2 × Y )
where H2O depends on the water vapor contained in the wet flue gases and can be calculated as Y = ( 100 / ( 100 % H 2 O ) ) , and MW is the molecular weight of wet flue gases.

4. Results and Discussion

As mentioned, a boiler in unit 121 of the fourth refinery in the South Pars Gas Complex was chosen as a real-life case study of this work. Firstly, for validation of the numerical method, the numerical results were compared with the available experimental values. It should be noted that, although the simulation results use actual measured values, the simulation method can be validated by comparing the numerical and experimental results. In Table 4, the compression between the calculated and measured values of NOX emission is presented for different days of 2016. The calculated values were obtained based on the equations in Section 3.4. Furthermore, the experimental results were measured with the testo 350 device. As evident in this table, there is very good agreement between the measured and numerical values. This guarantees the accuracy of the developed model.

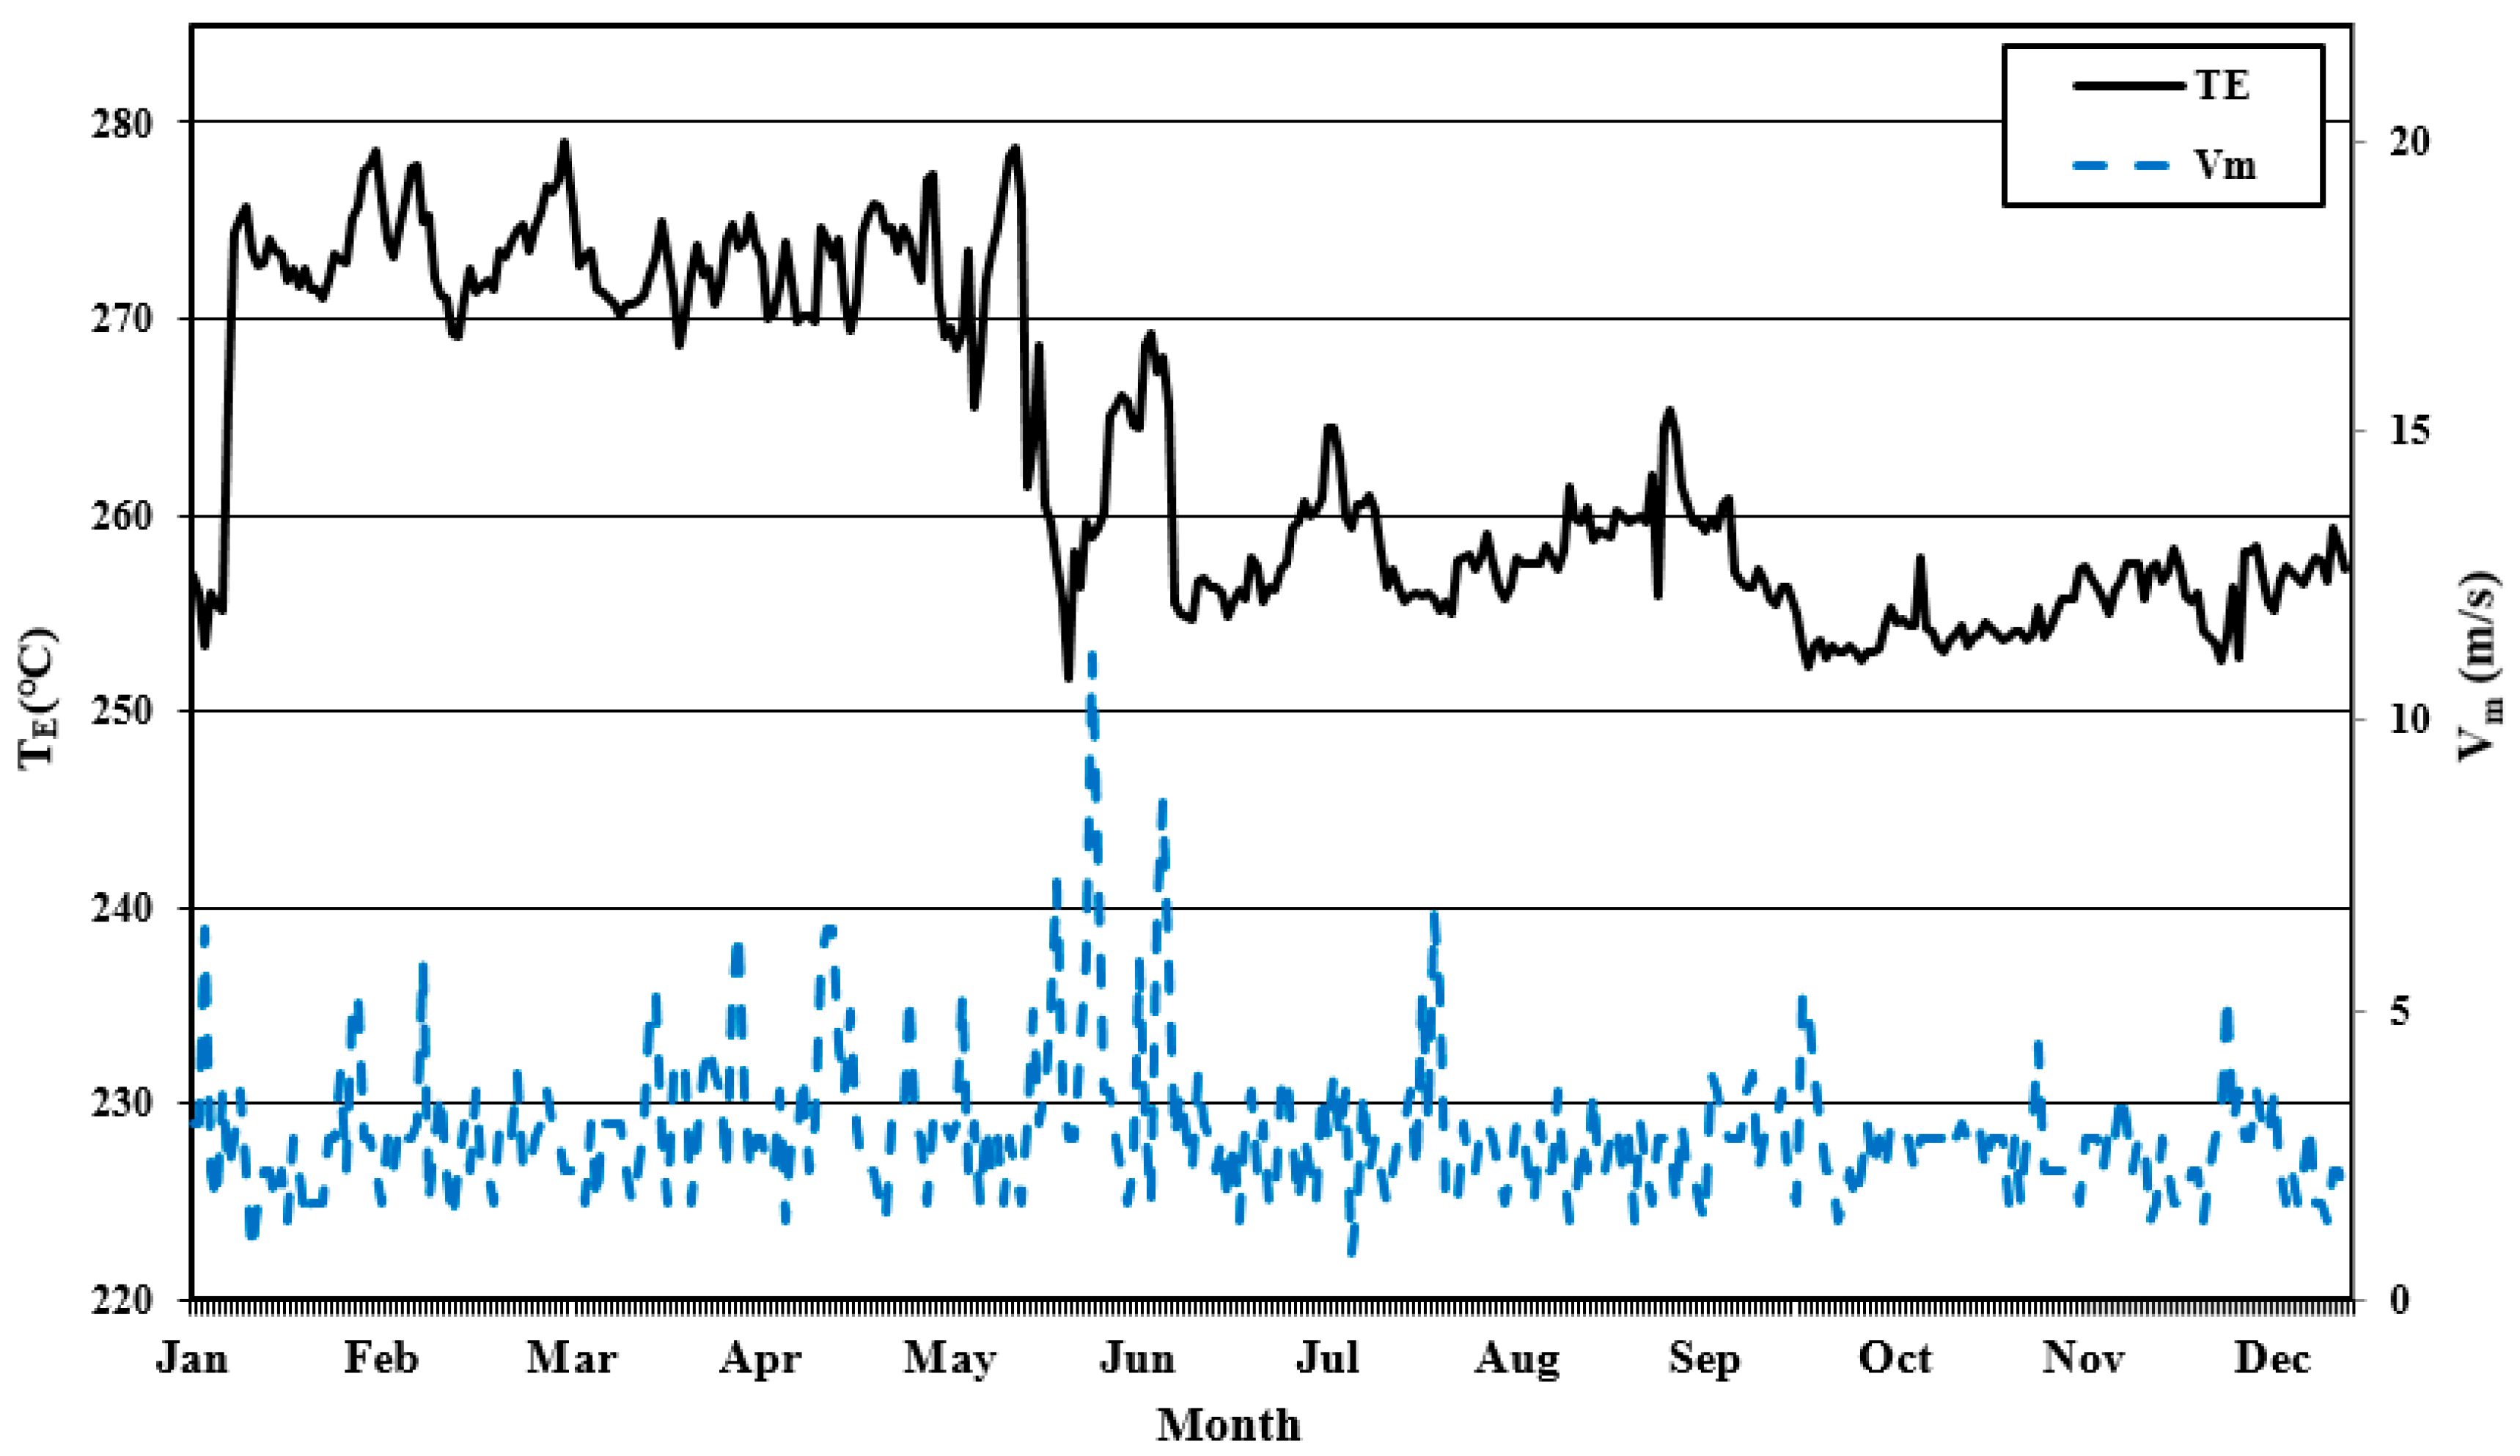
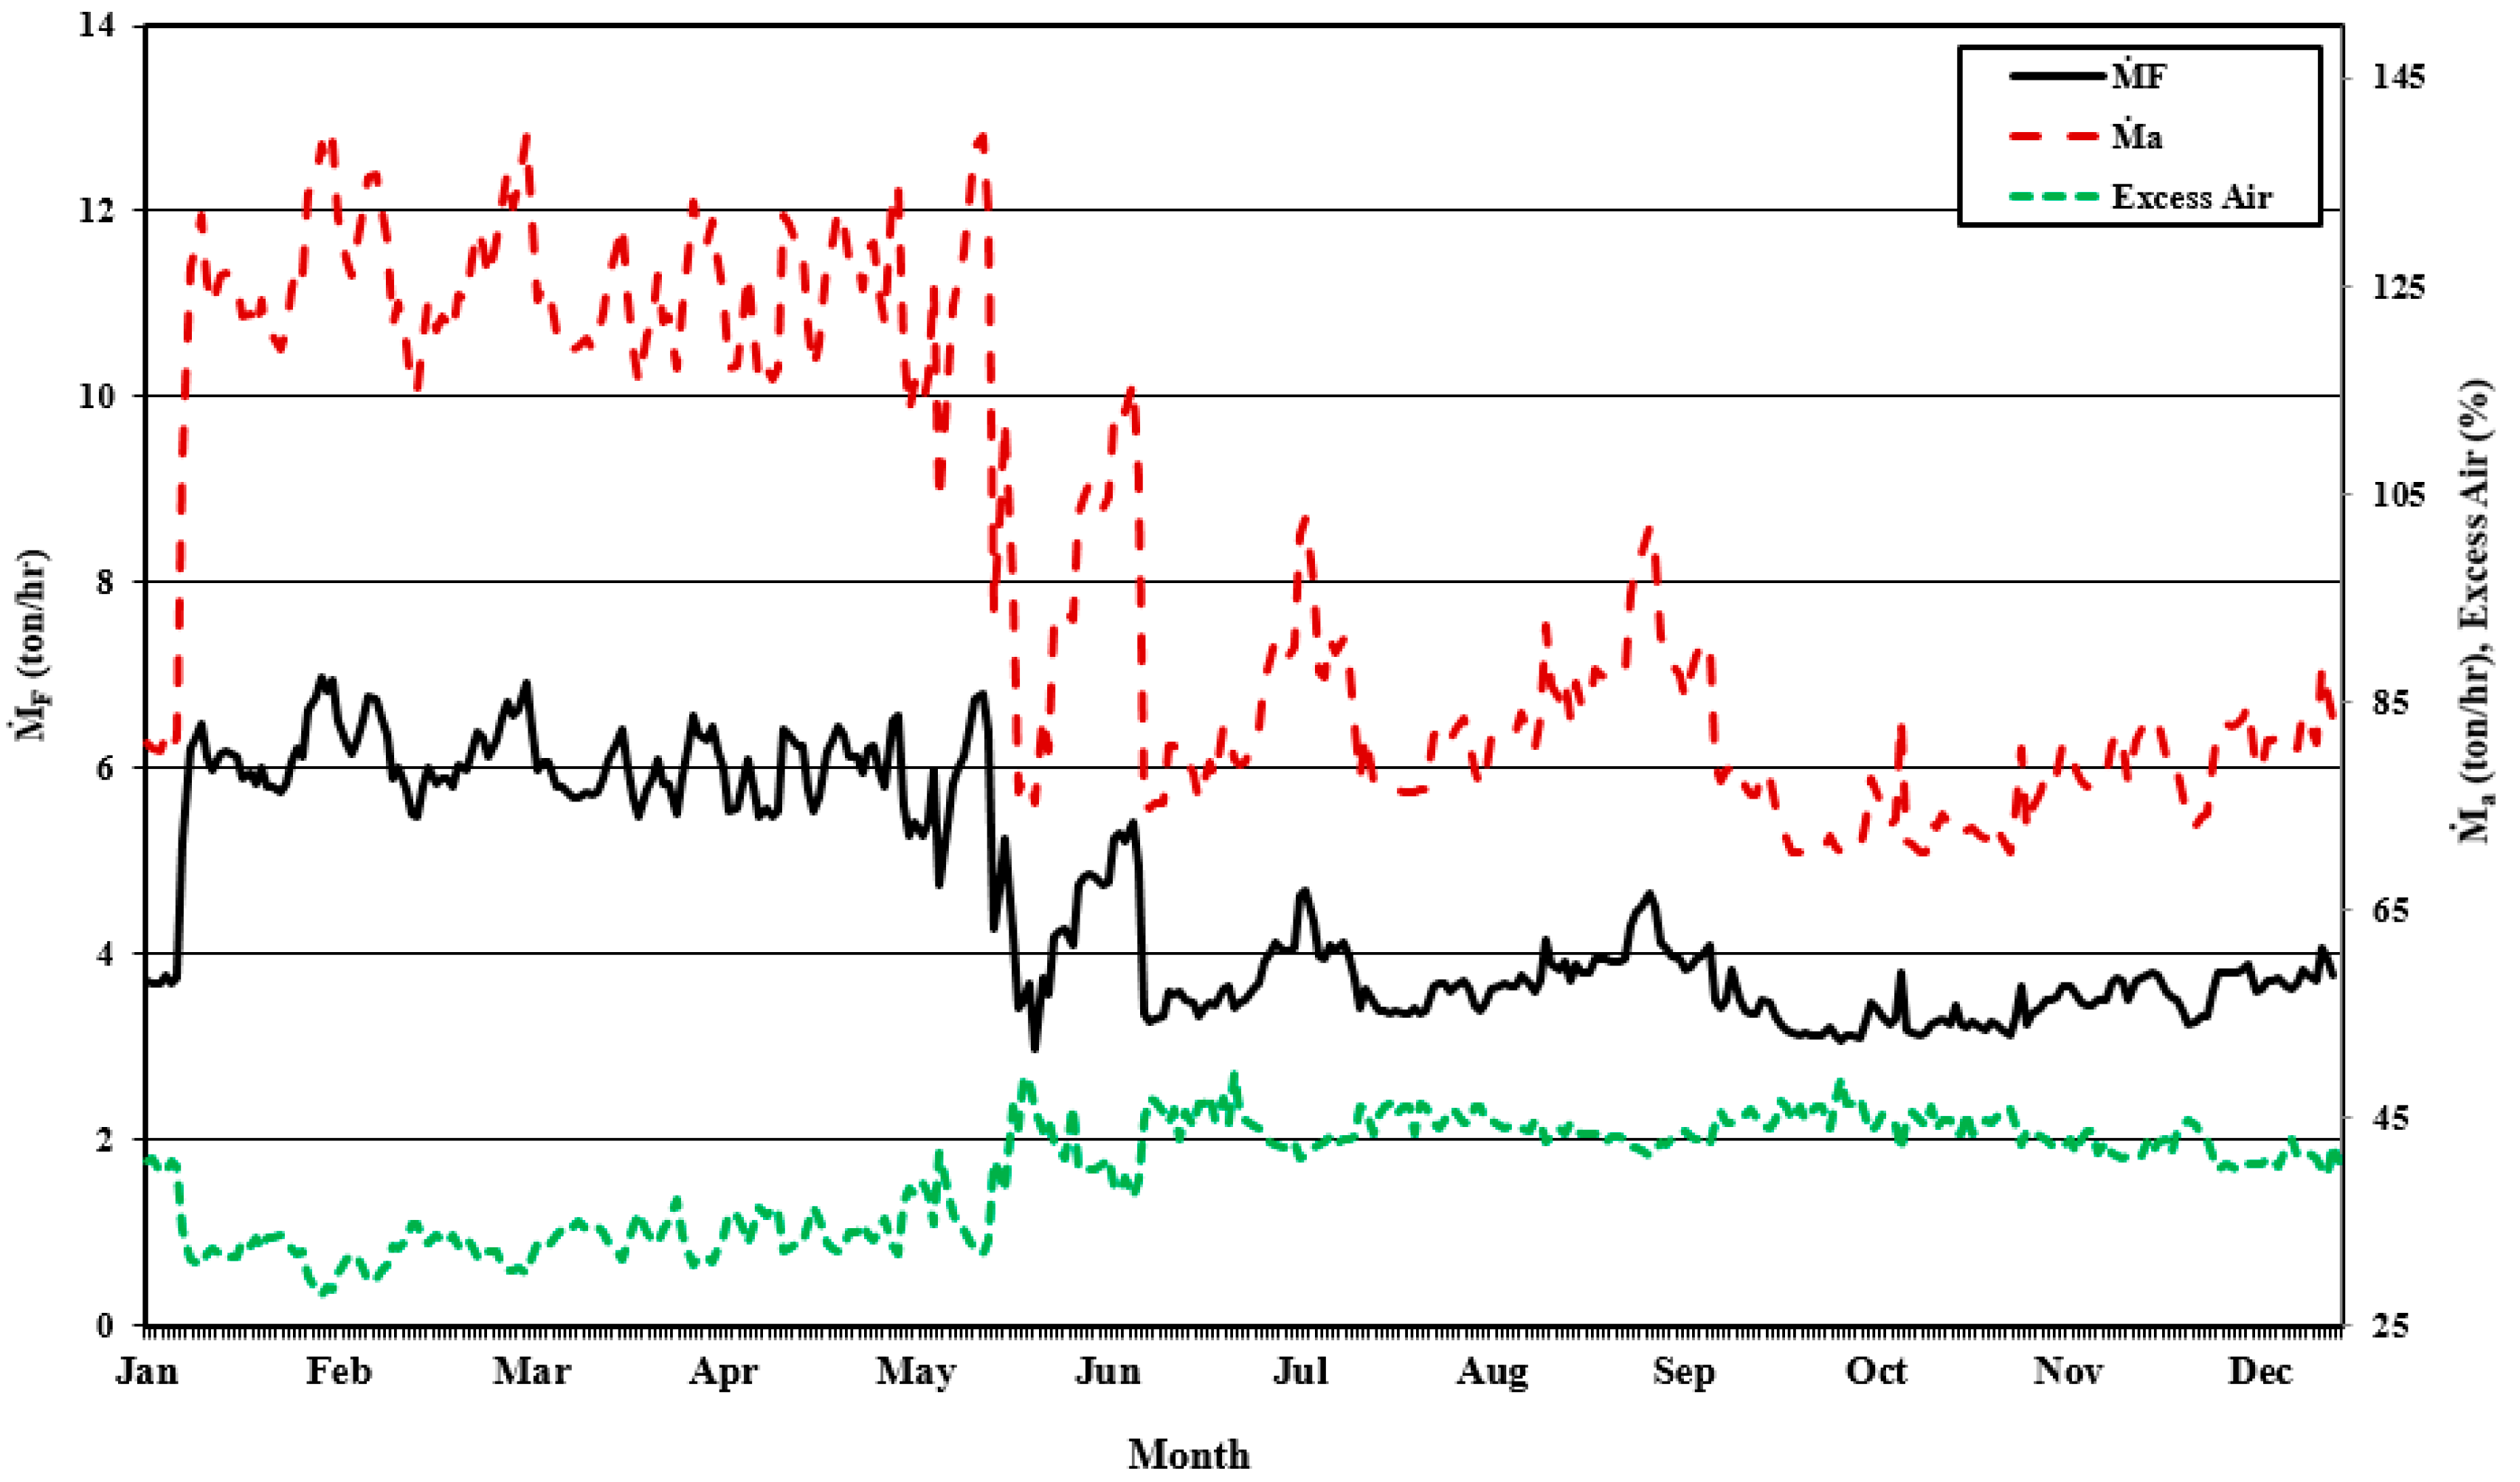
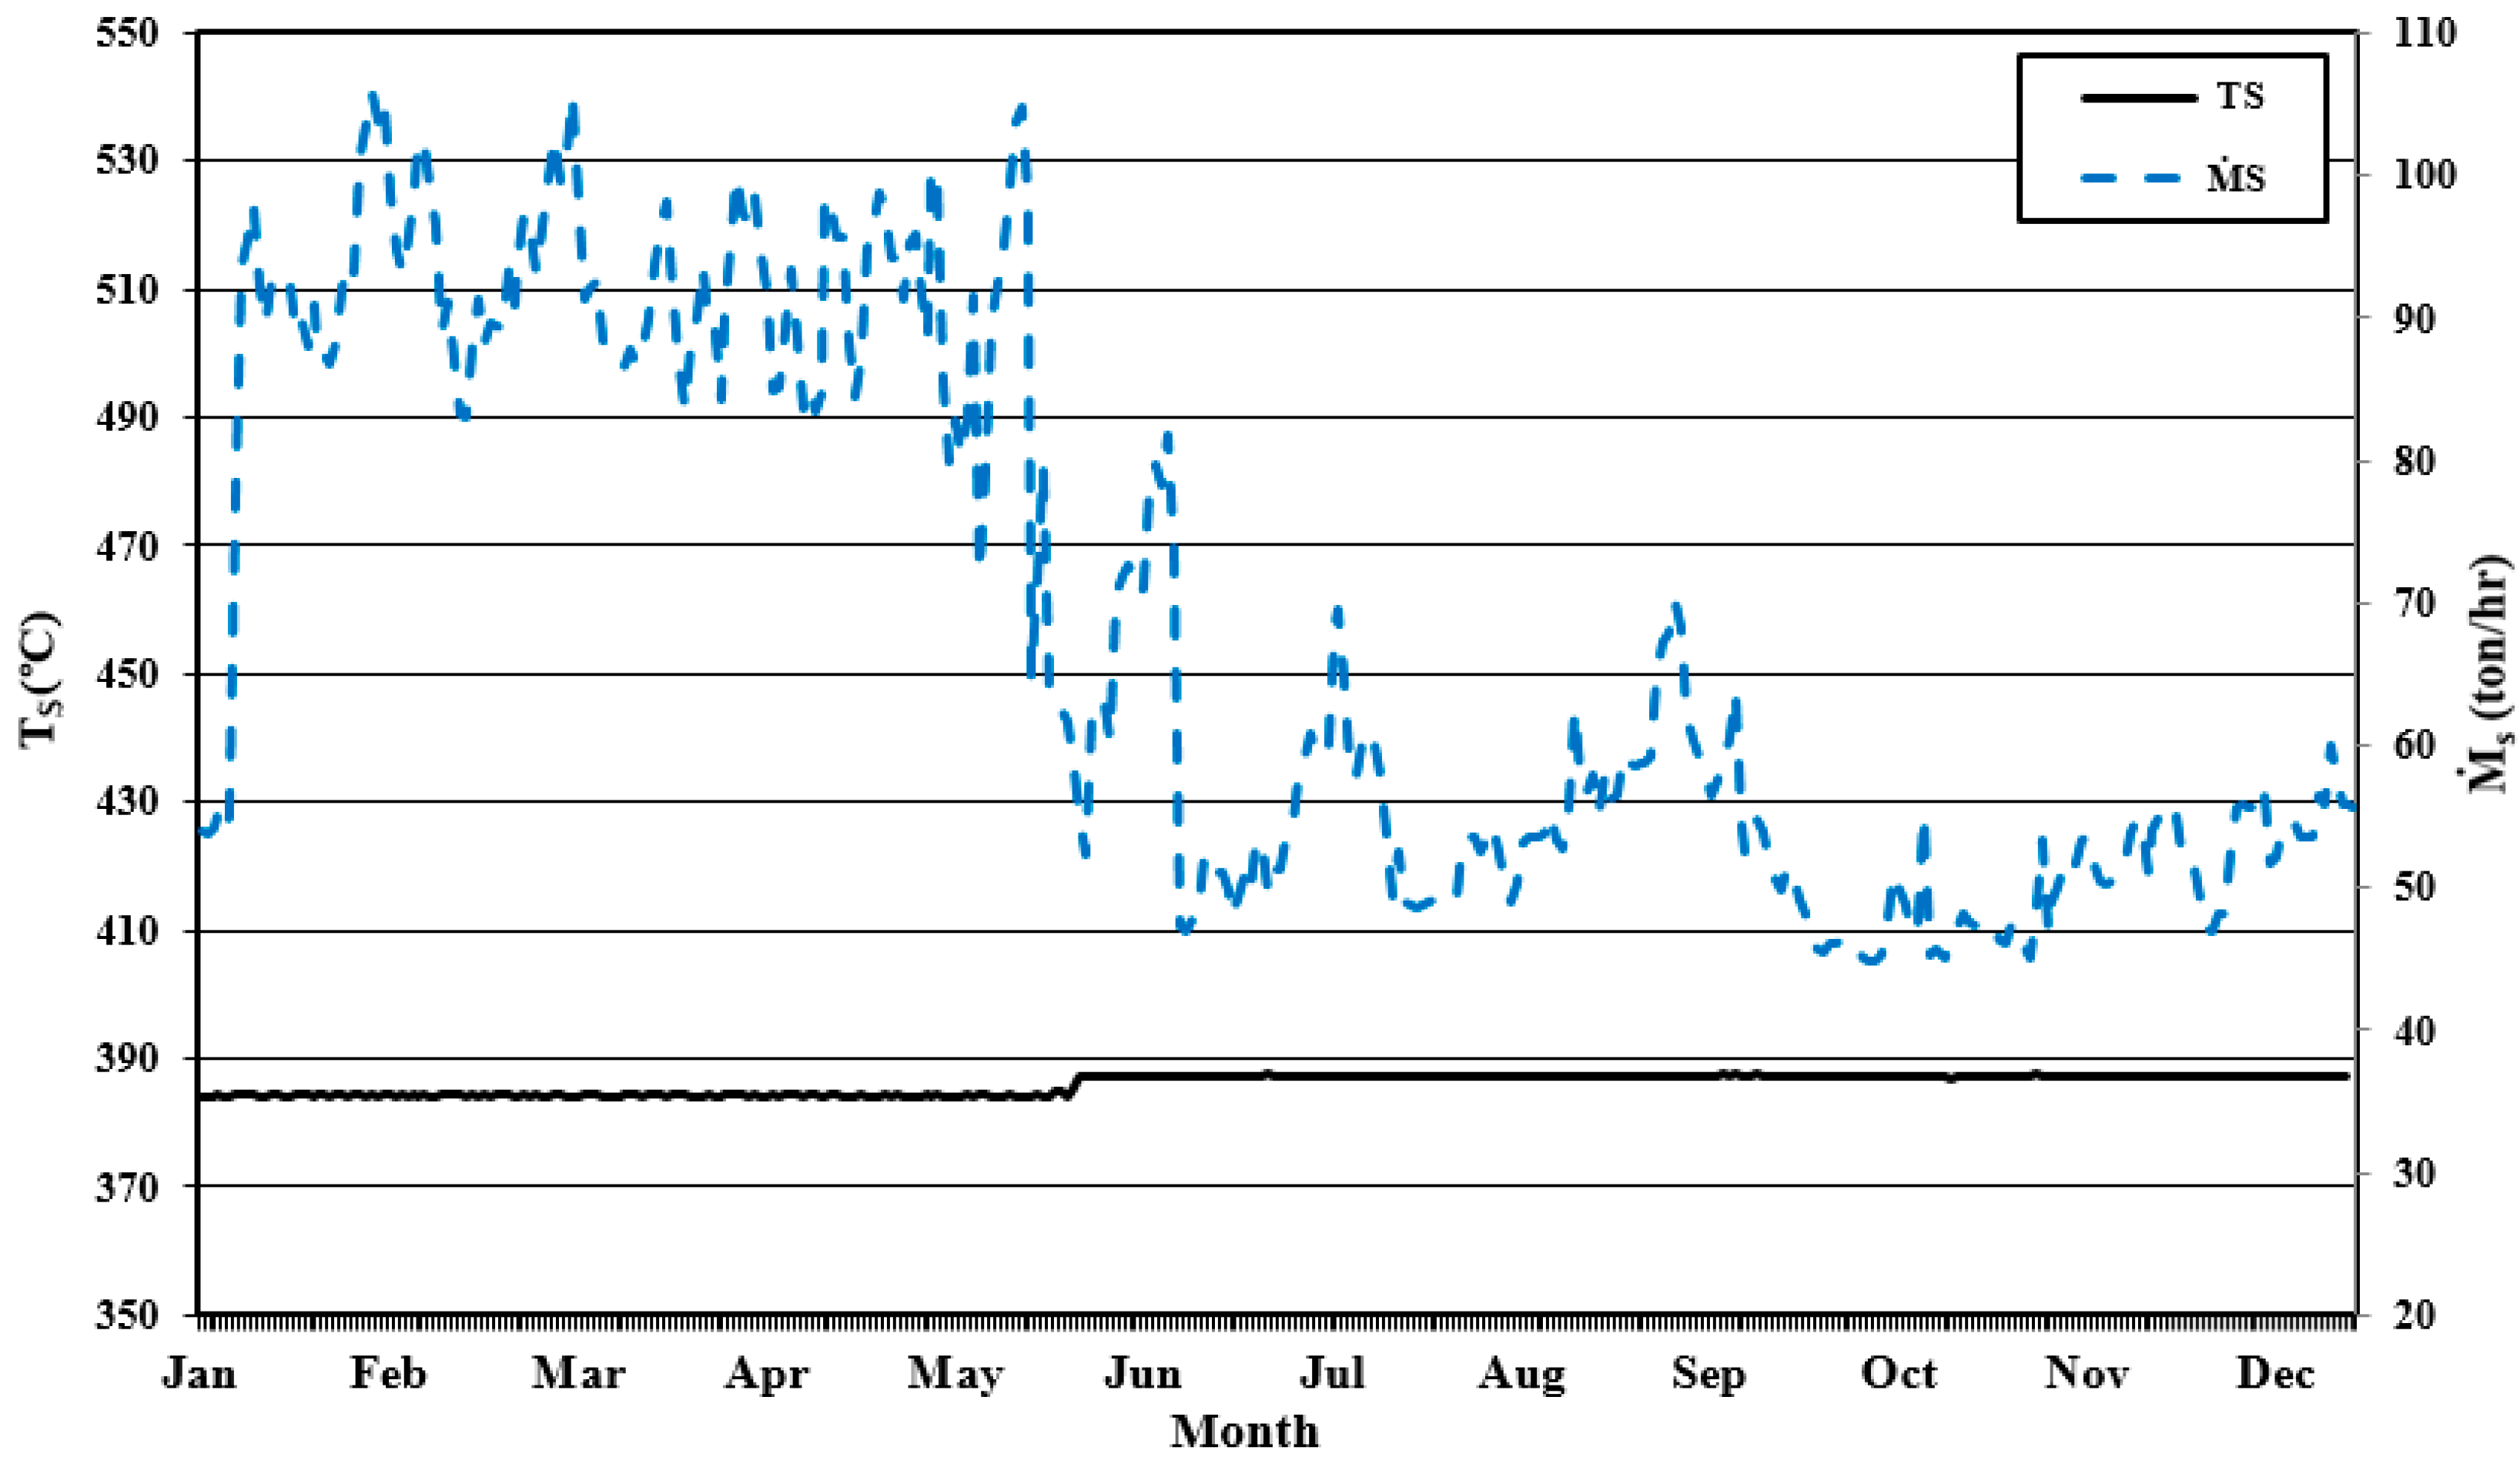
4.1. The Environmental and Operational Parameters of the Boiler

In this section, the environmental and operational parameters of the boiler used in the simulation are presented. Figure 5 shows the average daily ambient air temperature and the relative humidity of the South Pars Gas Complex for all days of 2016. Note from this figure, the boiler works in hot weather conditions, such that the refinery’s ambient temperature is above 30 °C for eight months of the year. Moreover, in most months, the relative humidity is above 50%, so that in August (as one of the warm months of the year), the relative humidity reaches about 60%.
The variation of the average daily exhaust temperature of the boiler stack and wind speed on the exterior of the boiler body is shown in Figure 6. As seen, the combustion exhaust temperature of the boiler varies from 250 °C to 280 °C during the year. The average daily wind speed is approximately constant during the year.
Figure 7 shows the variation of the average daily inlet air and fuel flow rates into the combustion chamber and excess air percentages in 2016. As can be seen in this figure, the largest input of air and fuel flow to combustion chamber occurred during cold months and this is due to the operating conditions of the refinery, which should work at full load. Reducing the steam production in the warm months increases the percentage of excess air significantly. As evident in the previous investigations, the percentage of excess air has a significant effect on the boiler performance and discharge of air pollutants. Accordingly, determining its optimal amount on different days of the year can lead to an improved performance and reduce the production of air pollutants. Therefore, considering the large variations in excess air percentage during the year of 29–49%, it is necessary to arrive at an optimal value. At the same time, care should be taken to ensure that its value does not go lower than the critical excess air percentage.
Figure 8 shows the average daily temperature and volumetric flow rate of steam during the year. Similar to as presented in Figure 7, owing to the full-load operation of the refinery, the boiler produces a higher steam flow rate during the cold months of the year. In fact, the results show that, in the warm months, owing to the refinery’s need for less steam, the steam boiler operates at partial loads. As can be seen in this figure, the steam temperature is approximately 385 °C on different days of the year.

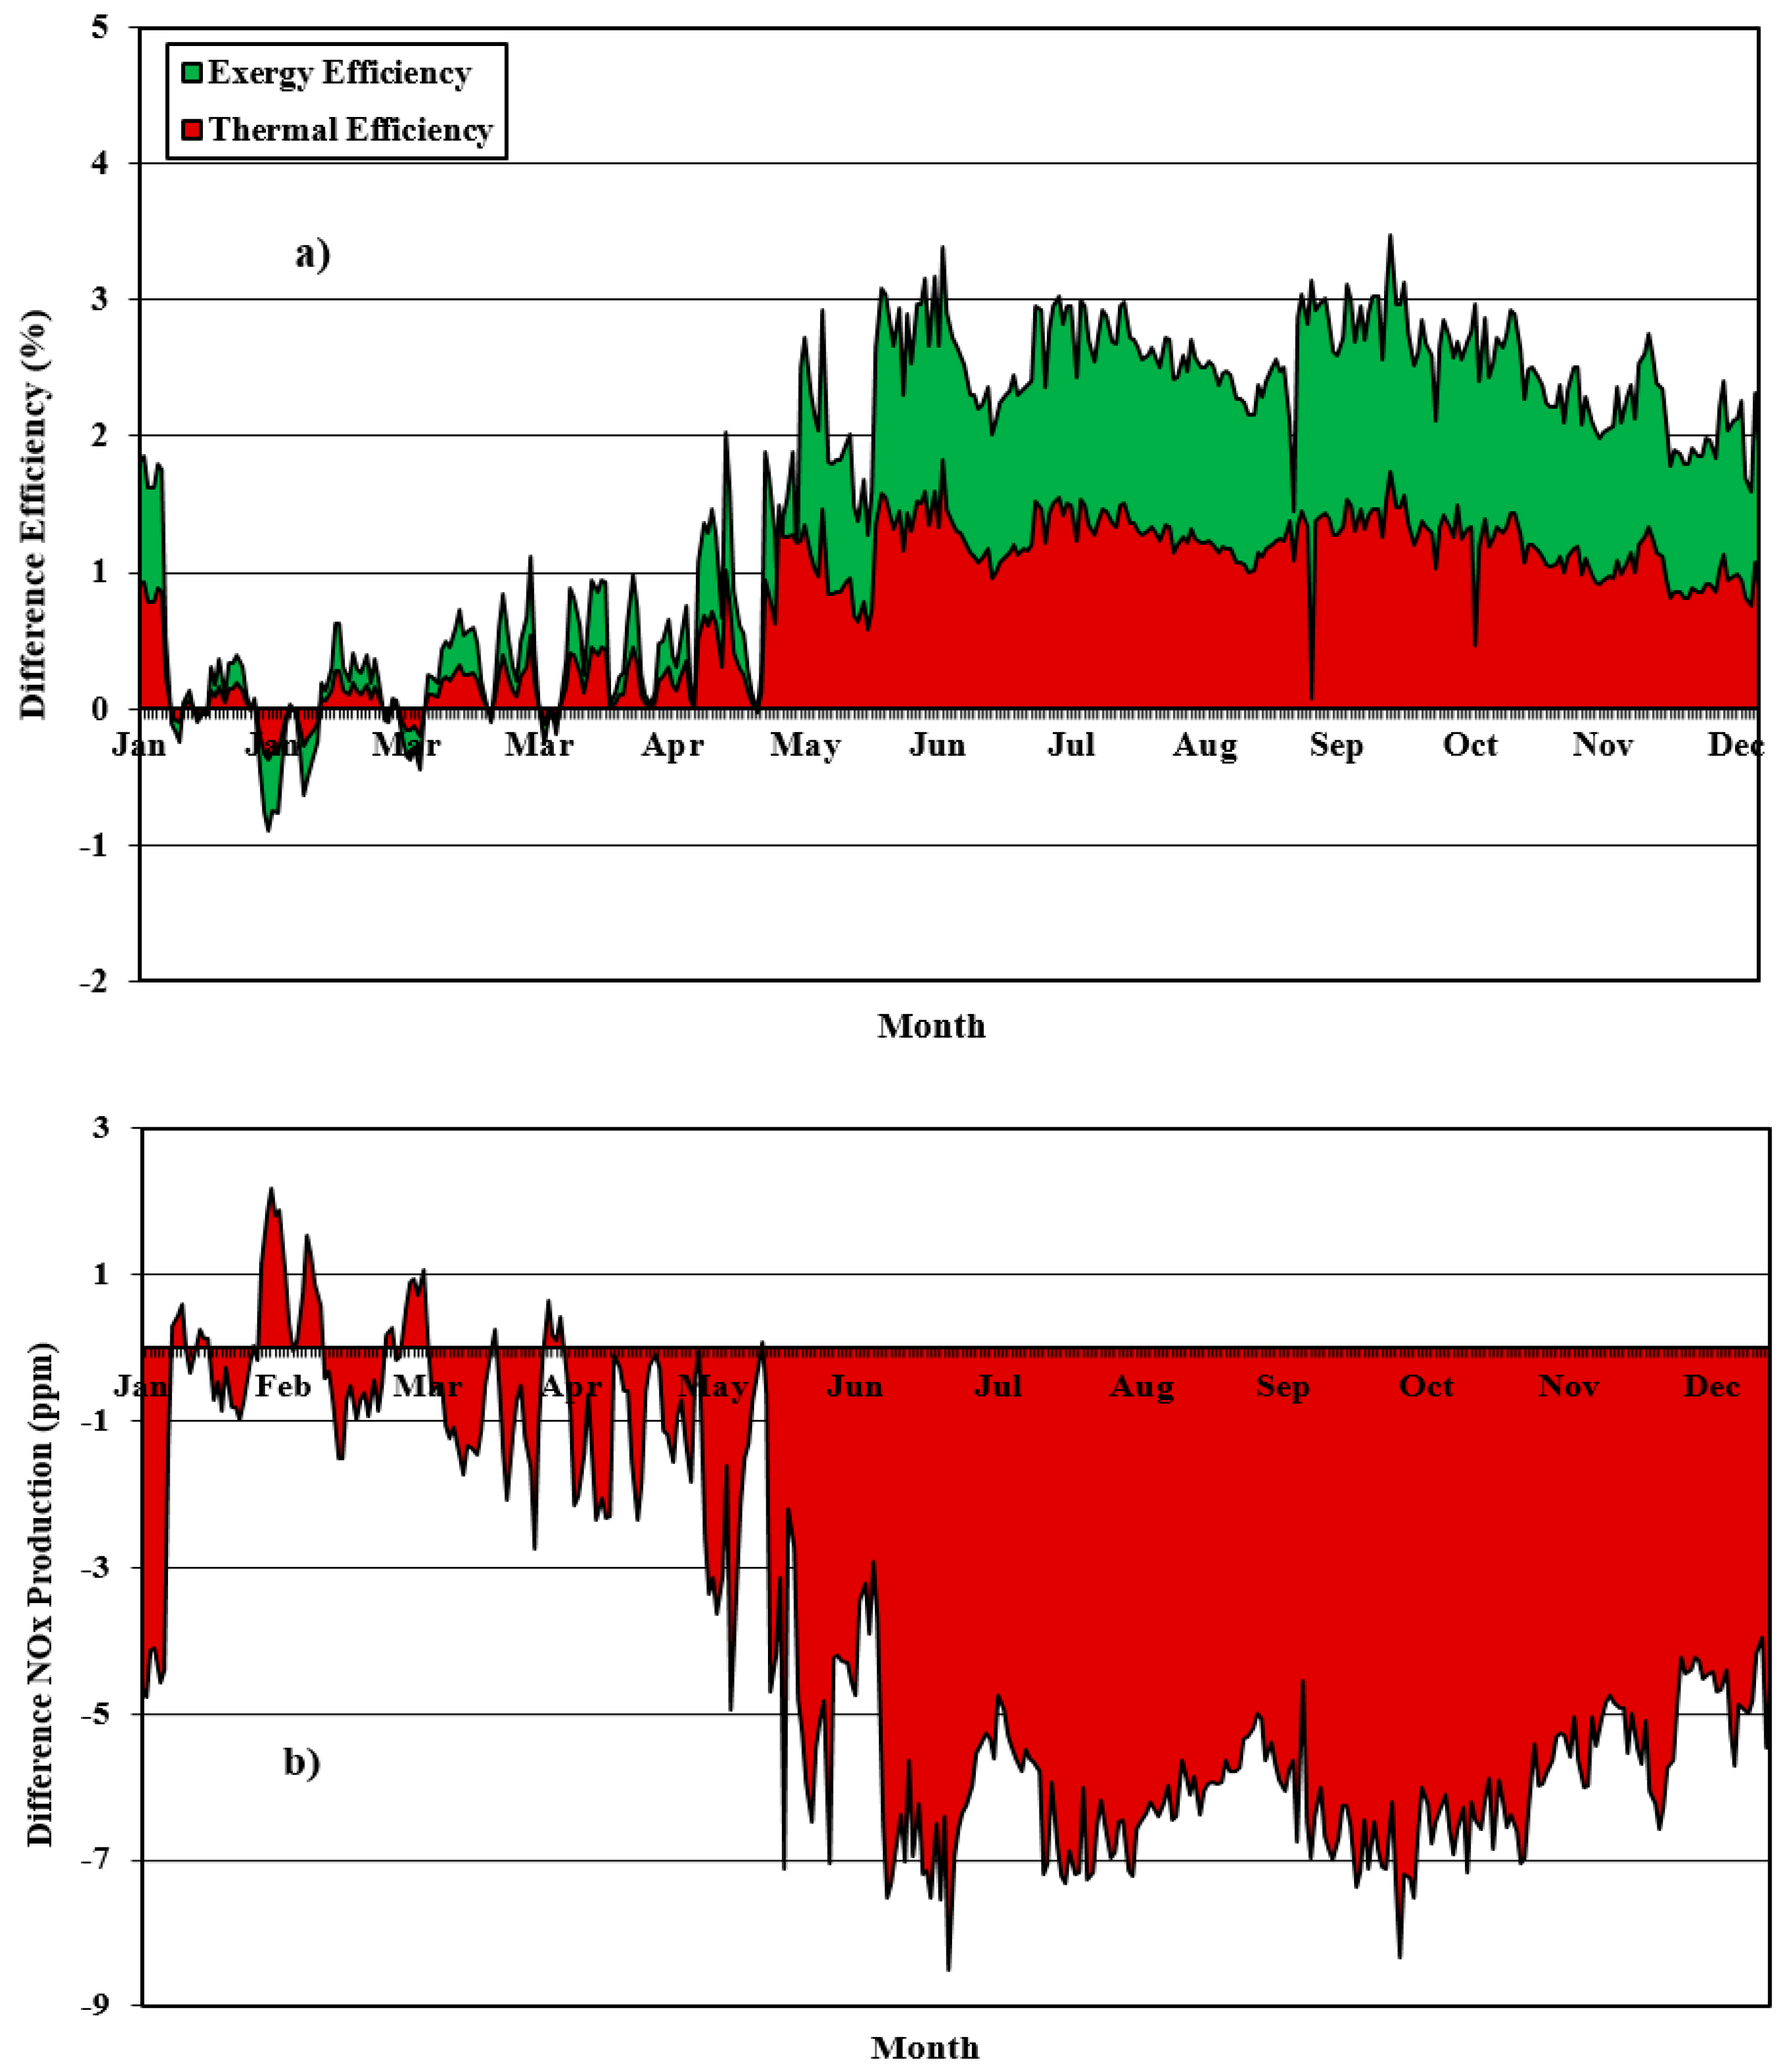
4.2. Results of Energy, Exergy, and Environmental Analyses

In this section, the results of energy, exergy, and environmental analyses are presented. The variations of body and stack losses, and thermal efficiencies of the boiler are shown in Figure 9. As seen, a significant portion of heat loss, between 200 and 450 (kJ/s), is related to the stack of the boiler. This is while the heat loss of the boiler body is considered to be between 10 and 35 (kJ/s), which is insignificant compared to the stack loss. The actual thermal efficiency of the boiler is from 83% to 87% during the year, and the variations of the boiler thermal efficiency depend on the operating conditions, i.e., with a higher operating load, the thermal efficiency increases. It is also evident that as the excess air percentage increases, the boiler thermal efficiency decreases.
The variation of average daily total exergy produced in the combustor due to the combustion process is shown in Figure 10. As shown, the total exergy is a sum of thermomechanical and chemical exergies, and the amount of chemical exergy is greater than that of thermomechanical exergy. As also seen, the flow of chemical exergy is approximately constant throughout the year.
Figure 11 shows the average daily ratio of the exergy losses of the combustion gases to the exergy of the fuel into the combustion chamber of the boiler. This figure also presents the exergy efficiencies of the combustor and boiler. As evident, the exergy efficiencies of the boiler and combustor are dependent on the boiler’s load condition and the excess air percentage. Therefore, the process of both efficiencies is similar throughout the year. On the other hand, in the warm months, owing to the boiler’s operating conditions, the ratio of exergy of waste combustion gases to the exergy of intake fuel for the refinery boiler increases.
Figure 12 shows the average daily NOx production of the South Pars refinery boiler during the year. Based on the previous studies, one of the parameters affecting the production of NOx is the percentage of excess air. It is clear that, as the percentage of excess air decreases, the NOx production rate decreases. In fact, the figure shows that, if the power plant operates at low partial loads, the rate of NOx production greatly increases. Therefore, keeping environmental concerns in mind, it would be beneficial for the refinery boiler to operate at 100% load.
The Grossmann exergy flow diagram of the South Pars refinery boiler is drawn in Figure 13. It is distinguished from the diagrams in that the exergy loss of the refinery boiler is considerable, which is due to exhaust of hot gases to the atmosphere.

4.3. Results of Optimization

As mentioned, adjustment of the excess air percentage is one of the most effective ways to improve the boiler performance and consequently reduce the emission of air pollutants. Based on the results of previous studies, the reduction of excess air, so that it falls below the critical excess air ratio, leads to incomplete combustion and the production of carbon monoxide. Therefore, in determining the optimal amount of excess air percentage of the boiler, this restriction must be considered. For this purpose, the presence of carbon monoxide in combustion products was investigated numerically and experimentally. According to available results, the optimal excess air percentage was determined as 31.86%, as recorded on 13 January 2016. Based on the experimental results, carbon monoxide was not found in the combustion products, and it can be confirmed that complete combustion was carried out on this said day. On the other hand, according to Figure 9, the thermal efficiency is relatively high. It should be noted that on certain days of the year, the excess air percentage was lower than the selected value, but due to the uncertainty of whether complete combustion occurred and the lack of experimental results, these values were discarded. Accordingly, in Figure 14, the results of optimized thermal and exergy efficiencies and NOx production are presented by optimizing the excess air percentage. As is evident, by optimizing the excess air, the thermal and exergy efficiencies will be uniform throughout the year. Furthermore, the optimization increased energy and exergy efficiencies and decreased NOx production on most days of the year.
Finally, Figure 15 illustrates the rate of change in (a) thermal and exergy efficiencies and (b) production of NOx pollution with optimizing excess air percentage throughout the year. As evident, the difference between exergy efficiencies of current and optimized conditions goes up by 3% in the warm months. Moreover, by optimizing the excess air percentage, the exergy efficiency increases more than the thermal efficiency. On the other hand, optimizing the excess air percentage reduces the production of NOx pollution on most days of the year.

5. Conclusions

Understanding the behavior of steam boilers and studying the effects of various parameters on their performance as well as their impact on the environment are attractive subjects. Boilers are of great importance in natural gas refineries because of their contribution to sweetening natural gas. Hence, a thermo-environmental investigation was applied using a case study of the fourth refinery boiler at the South Pars Gas Complex with an aim to study the key operational parameters, such as energy and exergy efficiencies and NOx production. To fulfill this objective, nine environmental and operational parameters of the refinery boiler, including the relative humidity, ambient temperature, wind speed on the boiler body, air and fuel flow rates entering the combustion chamber, temperature of the boiler feed water, the flow rate and temperature of the steam, and finally the temperature of the exhaust gas from the stack, were measured and recorded every two hours and averaged daily for the entire year. Using these actual data, the body and exhaust losses, energy and exergy efficiencies, and production of NOx were calculated. Further, by finding the optimal amount of excess air percentage, the effect of its application on the performance of the refinery boiler on different days was investigated.

Author Contributions

Conceptualization, M.D.-D.; methodology, S.K. and M.D.-D.; software, S.K.; validation, S.K.; formal analysis, S.K. and A.E.-M.; investigation, S.K., A.E.-M. and M.D.-D.; writing—original draft preparation, S.K., A.E.-M. and M.D.-D.; writing—review and editing, S.K., A.E.-M. and M.D.-D.; visualization, S.K. and A.E.-M.; supervision, M.D.-D. and A.E.-M.; project administration, M.D.-D. All authors have read and agreed to the published version of the manuscript.

Funding

This research received no external funding.

Institutional Review Board Statement

Not applicable.

Informed Consent Statement

Not applicable.

Data Availability Statement

Not applicable.

Conflicts of Interest

The authors declare no conflict of interest.

Nomenclatures

A surface area of the boiler (m2)
g ¯ molar Gibbs functions (kJ/kg)
H heat energy (kJ/s)
m ˙ mass flow rate (kg/s)
N number of molar
P pressure (Pa)
R gas constant (J/kgK)
T temperature (°C)
V speed (m/s)
Greek Symbol
ε emission coefficient of the external surface of the boiler
λ the ratio of the actual air-to-fuel ratio to the stoichiometric air-to-fuel ratio
ϕnormalizing the actual fuel-to-air ratio by the stoichiometric fuel-to-air ratio
ψ exergy (kJ)
Subscripts
0ambient
1the outer surface of the boiler
t0limited death
t00ambient conditions
aair
a s air in stoichiometric mode
chchemical
Eflue gas (stack)
eexit
Ffuel
f Fuel-air in actual mode
f s Fuel-air in stoichiometric mode
iinlet
Lloss
Ththermomechanical
Ttotal
wwind
Pproduct
Ssteam
Abbreviations
EAexcess air
LHVlower heating value
M W the molecular weight of wet flue gases

References

  1. Xu, X.; Wang, C.; Zhou, P. GVRP considered oil-gas recovery in refined oil distribution: From an environmental perspective. Int. J. Prod. Econ. 2021, 235, 108078. [Google Scholar] [CrossRef]
  2. Zhang, L.; Gao, T.; Cai, G.; Hai, K.L. Research on electric vehicle charging safety warning model based on back propagation neural network optimized by improved gray wolf algorithm. J. Energy Storage 2022, 49, 104092. [Google Scholar] [CrossRef]
  3. Wang, H.; Luo, Q. Can a colonial legacy explain the pollution haven hypothesis? A city-level panel analysis. Struct. Chang. Econ. Dyn. 2022, 60, 482–495. [Google Scholar] [CrossRef]
  4. Nazeer, M.; Hussain, F.; Khan, M.I.; Asad-ur-Rehman, E.R.; El-Zahar, Y.-M.; Chu, M.Y. Theoretical study of MHD electro-osmotically flow of third-grade fluid in micro channel. Appl. Math. Comput. 2021, 420, 126868. [Google Scholar] [CrossRef]
  5. Chu, Y.-M.; Shankaralingappa, B.M.; Gireesha, B.J.; Alzahrani, F.; Khan, M.I.; Khan, S.U. Combined impact of Cattaneo-Christov double diffusion and radiative heat flux on bio-convective flow of Maxwell liquid configured by a stretched nano-material surface. Appl. Math. Comput. 2021, 419, 126883. [Google Scholar] [CrossRef]
  6. Zhao, T.-H.; Khan, M.I.; Chu, Y.-M. Artificial neural networking (ANN) analysis for heat and entropy generation in flow of non-Newtonian fluid between two rotating disks. Math. Methods Appl. Sci. 2021. [Google Scholar] [CrossRef]
  7. Chu, Y.-M.; Nazir, U.; Sohail, M.; Selim, M.M.; Lee, J.-R. Enhancement in thermal energy and solute particles using hybrid nanoparticles by engaging activation energy and chemical reaction over a parabolic surface via finite element approach. Fractal Fract. 2021, 5, 119. [Google Scholar] [CrossRef]
  8. Einstein, D.; Worrell, E.; Khrushch, M. Steam Systems in Industry: Energy Use and Energy Efficiency Improvement Potentials; Lawrence Berkeley National Laboratory, University of California: Berkeley, CA, USA, 2001. [Google Scholar]
  9. Li, C.; Gillum, C.; Toupin, K.; Donaldson, B. Environmental performance assessment of utility boiler energy conversion systems. Energy Convers. Manag. 2016, 120, 135–143. [Google Scholar] [CrossRef]
  10. Ebrahimi-Moghadam, A.; Kowsari, S.; Farhadi, F.; Deymi-Dashtebayaz, M. Thermohydraulic sensitivity analysis and multi-objective optimization of Fe3O4/H2O nanofluid flow inside U-bend heat exchangers with longitudinal strip inserts. Appl. Therm. Eng. 2020, 164, 114518. [Google Scholar] [CrossRef]
  11. Ebrahimi-Moghadam, A.; Deymi-Dashtebayaz, M.; Jafari, H.; Niazmand, A. Energetic, exergetic, environmental and economic assessment of a novel control system for indirect heaters in natural gas city gate stations. J. Therm. Anal. Calorim. 2020, 141, 2573–2588. [Google Scholar] [CrossRef]
  12. Shokouhi Tabrizi, A.H.; Niazmand, H.; Farzaneh-Gord, M.; Ebrahimi-Moghadam, A. Energy, exergy and economic analysis of utilizing the supercritical CO2 recompression Brayton cycle integrated with solar energy in natural gas city gate station. J. Therm. Anal. Calorim. 2021, 145, 973–991. [Google Scholar] [CrossRef]
  13. Ebrahimi-Moghadam, A.; Farzaneh-Gord, M. Energy, exergy, and eco-environment modeling of proton exchange membrane electrolyzer coupled with power cycles: Application in natural gas pressure reduction stations. J. Power Sources 2021, 512, 230490. [Google Scholar] [CrossRef]
  14. Ebrahimi-Moghadam, A.; Moghadam, A.J.; Farzaneh-Gord, M. Comprehensive techno-economic and environmental sensitivity analysis and multi-objective optimization of a novel heat and power system for natural gas city gate stations. J. Clean. Prod. 2020, 262, 121261. [Google Scholar] [CrossRef]
  15. Rosen, M.A.; Dincer, I. A study of industrial steam process heating through exergy analysis. Int. J. Energy Res. 2004, 28, 917–930. [Google Scholar] [CrossRef]
  16. Saidur, R.; Ahamed, J.U.; Masjuki, H.H. Energy, exergy and economic analysis of industrial boilers. Energy Policy 2010, 38, 2188–2197. [Google Scholar] [CrossRef]
  17. Aljundi, I.H. Energy and exergy analysis of a steam power plant in Jordan. Appl. Therm. Eng. 2008, 29, 324–328. [Google Scholar] [CrossRef]
  18. Kang, Y.; Wong, V.K.F. Boiler Combustion performance comparing different fuels. Energy Syst. Div. (ASME) 1994, 33, 7–14. [Google Scholar]
  19. Rosen, M.A.; Tang, R. Effect of altering combustion air flow on a steam power plant: Energy and exergy analysis. Int. J. Energy Res. 2007, 31, 219–231. [Google Scholar] [CrossRef]
  20. Rosen, M.A.; Tang, R. Assessing and improving the efficiencies of a steam power plant using exergy analysis. Int. J. Exergy 2006, 3, 362–390. [Google Scholar] [CrossRef]
  21. Habib, M.A.; AL-Bagawi, S. Thermodynamic performance analysis of the Ghazlan power plant. Energy 1995, 20, 1121–1130. [Google Scholar] [CrossRef]
  22. Li, C.; Gillum, C.; Toupin, K.; Donaldson, B. Biomass boiler energy conversion system analysis with the aid of exergy-based methods. Energy Convers. Manag. 2015, 103, 665–673. [Google Scholar] [CrossRef]
  23. Kumar Singh, O. Assessment of thermodynamic irreversibility in different zones of a heavy fuel oil fired high pressure boiler. J. Therm. Anal. Calorim. 2016, 123, 829–840. [Google Scholar] [CrossRef]
  24. Zhong, B.J.; Shi, W.W.; Fu, W.B. Effects of fuel characteristics on the NO reduction during the reburning with coals. Fuel. Process Techno 2002, 79, 93–106. [Google Scholar] [CrossRef]
  25. Qi, G.; Zhang, S.; Liu, X.; Guan, J.; Chang, Y.; Wang, Z. Combustion adjustment test of circulating fluidized bed boiler. Appl. Therm. Eng. 2017, 124, 1505–1511. [Google Scholar] [CrossRef]
  26. Wang, J.; Lou, H.; Yang, F.; Cheng, F. Numerical simulation of a decoupling and Re-burning combinative Low-NOx coal grate boiler. J. Clean. Prod. 2018, 188, 977–988. [Google Scholar] [CrossRef]
  27. Li, Z.; Liu, G.; Zhu, Q.; Chen, Z.; Ren, F. Combustion and NOx emission characteristics of a retrofitted down-fired 660 MWe utility boiler at different loads. Appl. Energy 2011, 88, 2400–2406. [Google Scholar] [CrossRef]
  28. Li, S.; Xu, T.; Hui, S.; Wei, X. NOx emission and thermal efficiency of a 300 MWe utility boiler retrofitted by air staging. Appl. Energy 2009, 86, 1797–1803. [Google Scholar] [CrossRef]
  29. McAllister, S.; Chen, J.; Carlos Fernandez-Pello, A. Thermodynamics of Combustion. In Fundamentals of Combustion Processes; Elsevier: Amsterdam, The Netherlands, 2011; Chapter 2; pp. 15–47. [Google Scholar]
  30. Aroa, V. Cheek Fired Heater Performance. Hyd. Proc. J. 1958, 64, 85–87. [Google Scholar]
  31. Cengel, Y.A.; Boles, M.A. Thermodynamics an Engineering Approach, 6th ed.; McGraw-Hill: New York, NY, USA, 2008. [Google Scholar]
  32. Ebrahimi-Moghadam, A.; Jabari Moghadam, A.; Farzaneh-Gord, M.; Arabkoohsar, A. Performance investigation of a novel hybrid system for simultaneous production of cooling, heating, and electricity. Sustain. Energy Technol. Assess. 2021, 43, 100931. [Google Scholar] [CrossRef]
  33. Niazmand, A.; Farzaneh-Gord, M.; Deymi-DashteBayaz, M. Exergy analysis and Entropy generation of a Reciprocating Compressor applied in CNG stations carried out on the basis Models of Ideal and Real Gas. Appl. Therm. Eng. 2017, 124, 1279–1291. [Google Scholar] [CrossRef]
  34. Deymi-DashteBayaz, M.; Arabkoohsar, A.; Darabian, F. Energy and Exergy Analysis of Fluidized Bed Citric Acid Dryers. Int. J. Exergy 2017, 22, 218–234. [Google Scholar] [CrossRef]
  35. Wang, A.; Wang, S.; Ebrahimi-Moghadam, A.; Farzaneh-Gord, M.; Moghadam, A.J. Techno-economic and techno-environmental assessment and multi-objective optimization of a new CCHP system based on waste heat recovery from regenerative Brayton cycle. Energy 2021, 241, 122521. [Google Scholar] [CrossRef]
  36. Ebrahimi-Moghadam, A.; Farzaneh-Grod, M. Optimal operation of a multi-generation district energy hub based on electrical, heating, and cooling demands and hydrogen production. Appl. Energy 2022, 309, 118453. [Google Scholar] [CrossRef]
  37. Ertesvag, I.S. Sensitivity of chemical exergy for atmospheric gases and gaseous fuels to variations in ambient conditions. Energy Convers. Manag. 2017, 48, 1983–1995. [Google Scholar] [CrossRef]
  38. Moran, M.J.; Shapiro, H.N. Fundamentals of Engineering Thermodynamics, 5th ed.; John Wiley & Sons, Inc.: Hoboken, NJ, USA, 2006; pp. 620–669. [Google Scholar]
  39. Ameri, M.; Mokhtari, H.; Bahrami, M. Energy, Exergy, Exergoeconomic and Environmental (4E) Optimization of a Large Steam Power Plant: A Case Study; Springer: Berlin/Heidelberg, Germany, 2016; Volume 40, pp. 11–20. [Google Scholar]
Figure 1. Boilers in the fourth refinery of the South Pars Gas Complex.
Sustainability 14 02592 g001
Figure 2. Schematic of a combustion chamber and heat transfer in the boiler.
Sustainability 14 02592 g002
Figure 3. Flowchart of different modeling procedure steps.
Sustainability 14 02592 g003
Figure 4. Schematic diagram of direct fired heater thermal balance.
Sustainability 14 02592 g004
Figure 5. Average daily ambient temperature and relative humidity in South Pars Gas Complex.
Sustainability 14 02592 g005
Figure 6. Average daily exhaust temperature and air velocity on the boiler body.
Sustainability 14 02592 g006
Figure 7. Average daily fuel and air intake into the combustion chamber and excess air percentage.
Sustainability 14 02592 g007
Figure 8. Average daily steam consumption rate of the refinery and steam boiler production temperature.
Sustainability 14 02592 g008
Figure 9. Average daily thermal efficiency and the heat losses of body and stack of boiler.
Sustainability 14 02592 g009
Figure 10. Average daily of thermomechanical, chemical, and total exergies of the combustor.
Sustainability 14 02592 g010
Figure 11. Average daily exergy efficiencies of the combustor and boiler and the ratio of exergy of waste combustion gases (Ψ2) to the exergy of fuel intake (Ψ1) for the refinery boiler.
Sustainability 14 02592 g011
Figure 12. Average daily NOX production.
Sustainability 14 02592 g012
Figure 13. Grossman diagram of the exergy stream of the boiler.
Sustainability 14 02592 g013
Figure 14. Average daily thermal and exergy efficiencies and production of NOx pollution with optimizing excess air percentage.
Sustainability 14 02592 g014
Figure 15. Average daily rate of change in (a) thermal and exergy efficiencies and (b) production of NOx pollution throughout the year.
Sustainability 14 02592 g015
Table 1. Specifications of the boiler of the fourth refinery.
ItemValue
Boiler capacity165,000 kg/h
Steam temperature390 ± 5 °C
Steam pressure46 ± 0.5 barg
Feed water temperature128 °C
Lower heating value (LHV)45,300 kJ/kg
Table 2. Percent molar of natural gas (fuel) boilers.
ComponentsPercent Molar (%)
Methane (CH4)92.723
Ethane (C2H6)1.573
Propane (C3H8)0.407
n- Bhutan (C4H10)0.226
n- Pentane (C5H12)0.002
Carbon dioxide (CO2)1.403
Nitrogen (N2)3.432
Other components0.235
Total100
Table 3. List of recorded value in the fourth refinery of South Pars Gas Complex.
SubstancesValue
MinMax
Boiler fuel flow rate2.98 ton/h6.97 ton/h
Air intake flow rate (to combustion chamber)70.4 ton/h139.4 ton/h
Steam-generated flow rate44.9 ton/h105.6 ton/h
Boiler feed water flow rate45.5 ton/h109.4 ton/h
Exhaust temperature (stack)251.7 °C279 °C
Steam-generated temperature381.7 °C387.6 °C
Table 4. Measured and calculated results of NOx emission.
DateNOX (ppm)Difference
(Percentage %)
MeasuredNumerical
13/1/20167067.34
13/5/20168667.7921
13/8/20166767.95−1.4
13/11/20167868.7612
Publisher’s Note: MDPI stays neutral with regard to jurisdictional claims in published maps and institutional affiliations.

