
Review of the Impact of IT on the Environment and Solution with a Detailed Assessment of the Associated Gray Literature


Abstract
:1. Introduction
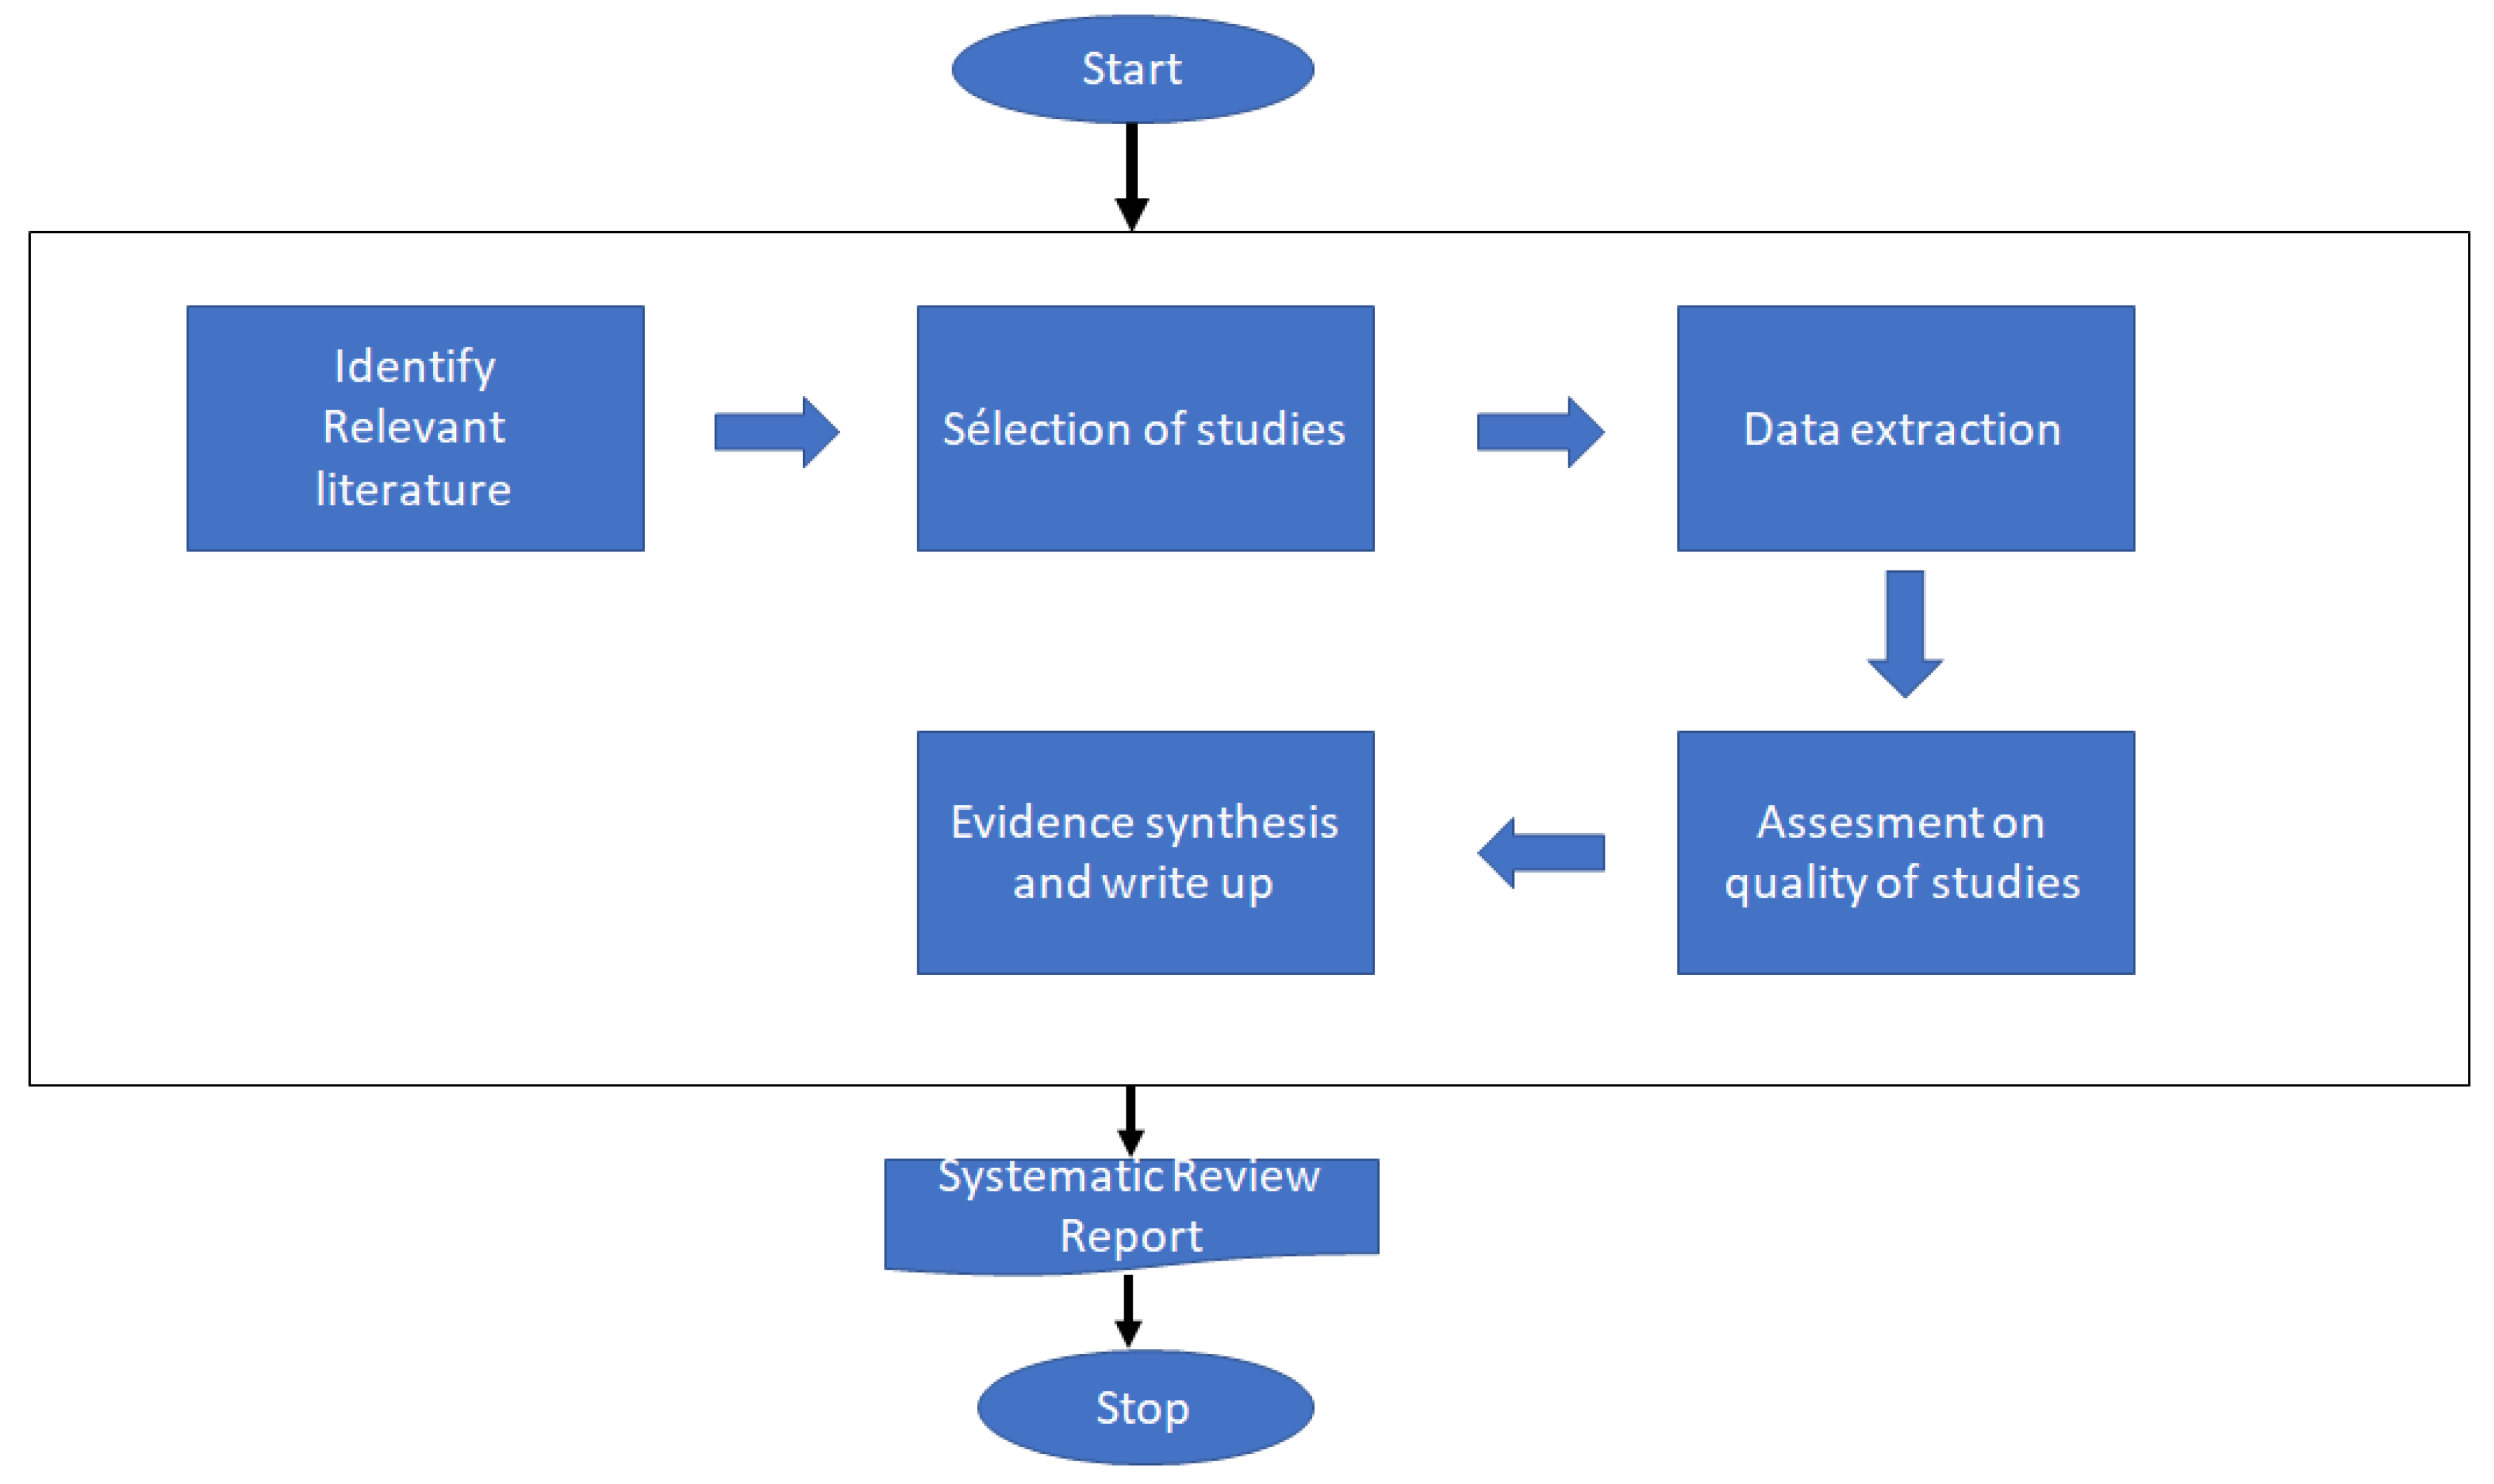
2. Methodology
2.1. Research Questions
- RQ1: What research has been conducted on green computing practices?
- RQ2: What are the tools and future perspective that influence actors to implement green computing practices?
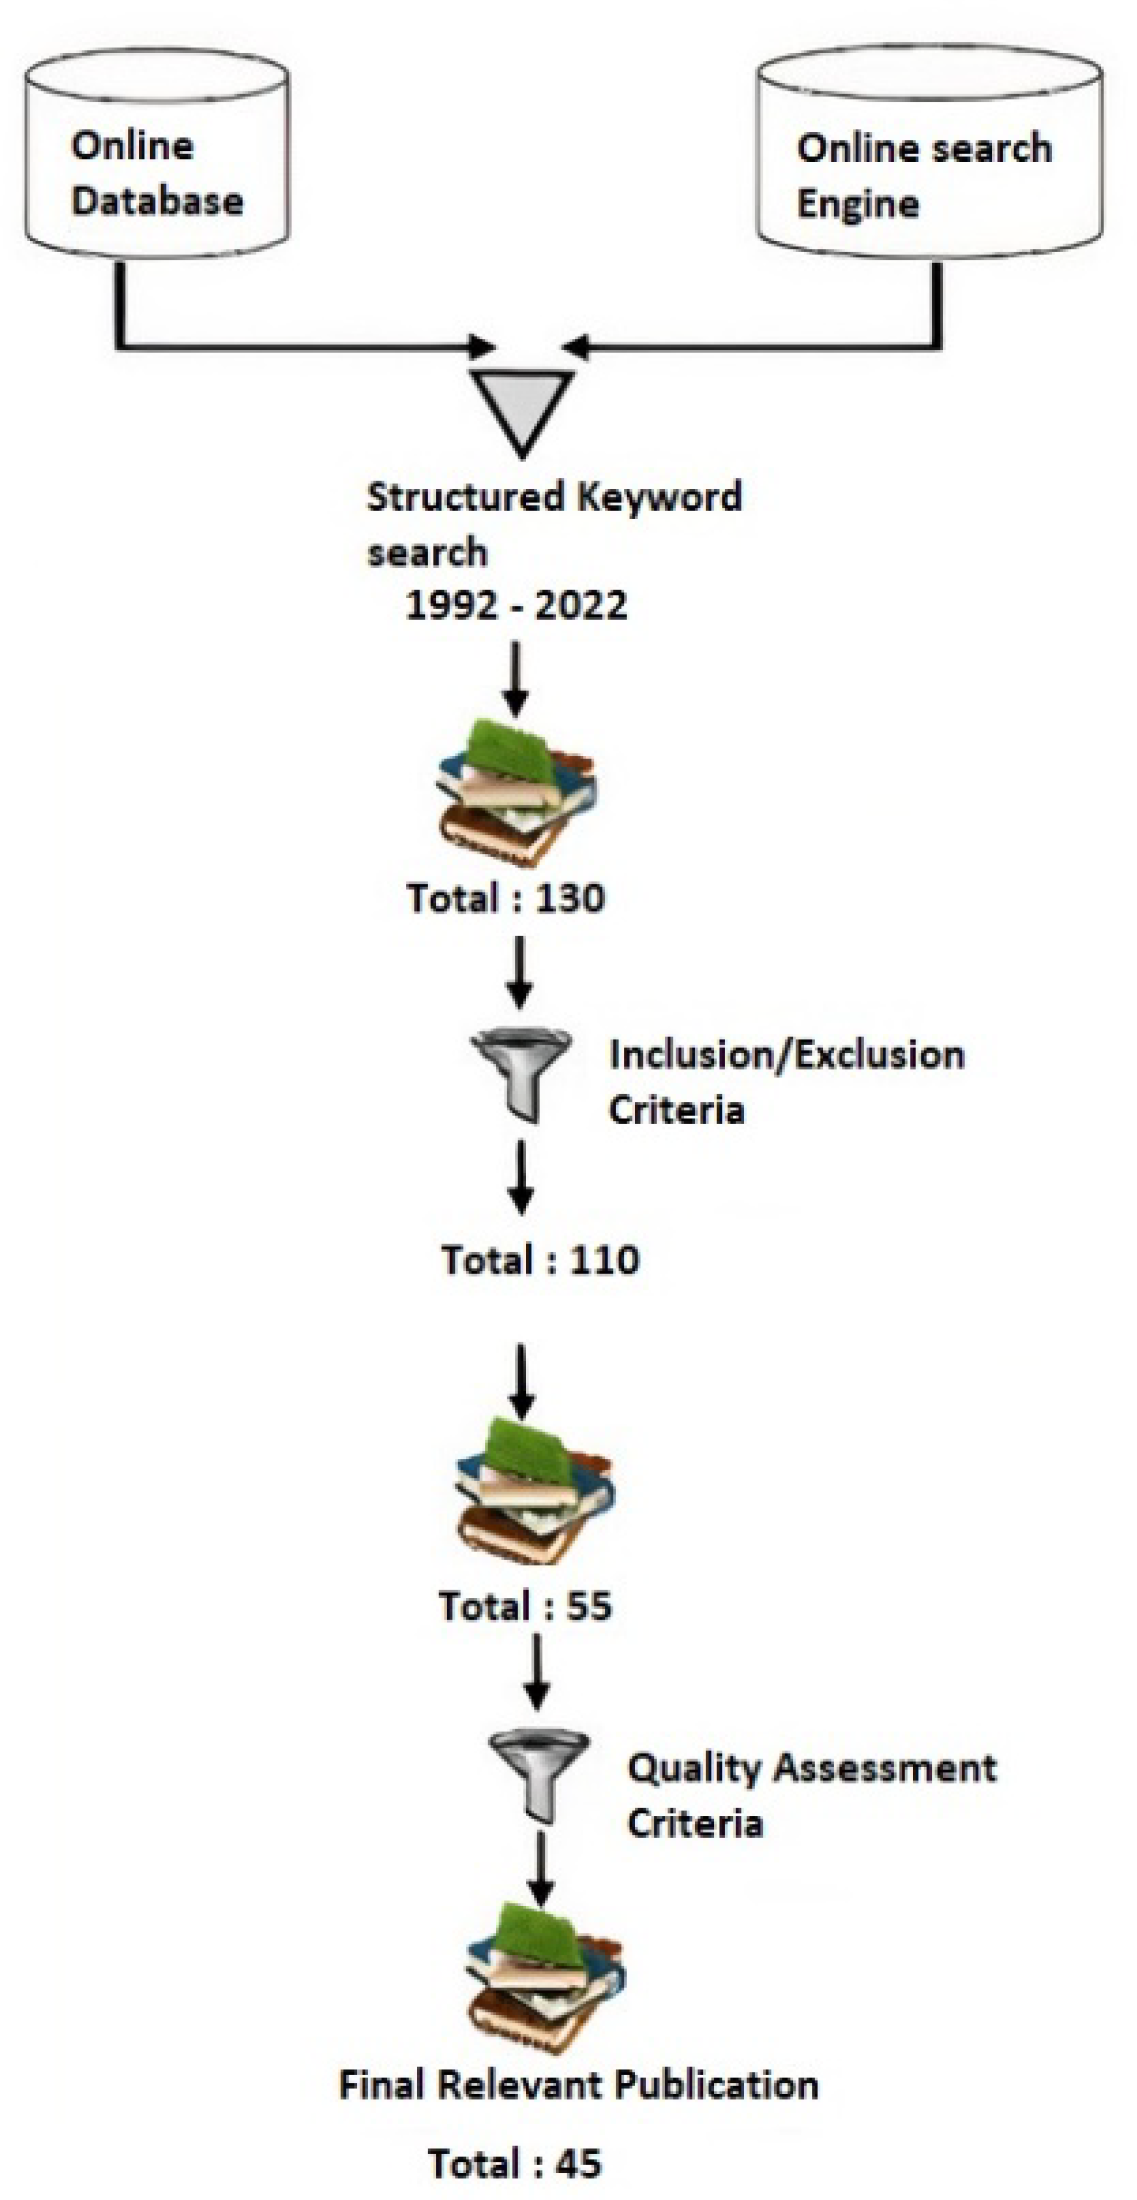
2.2. Conducting the Review
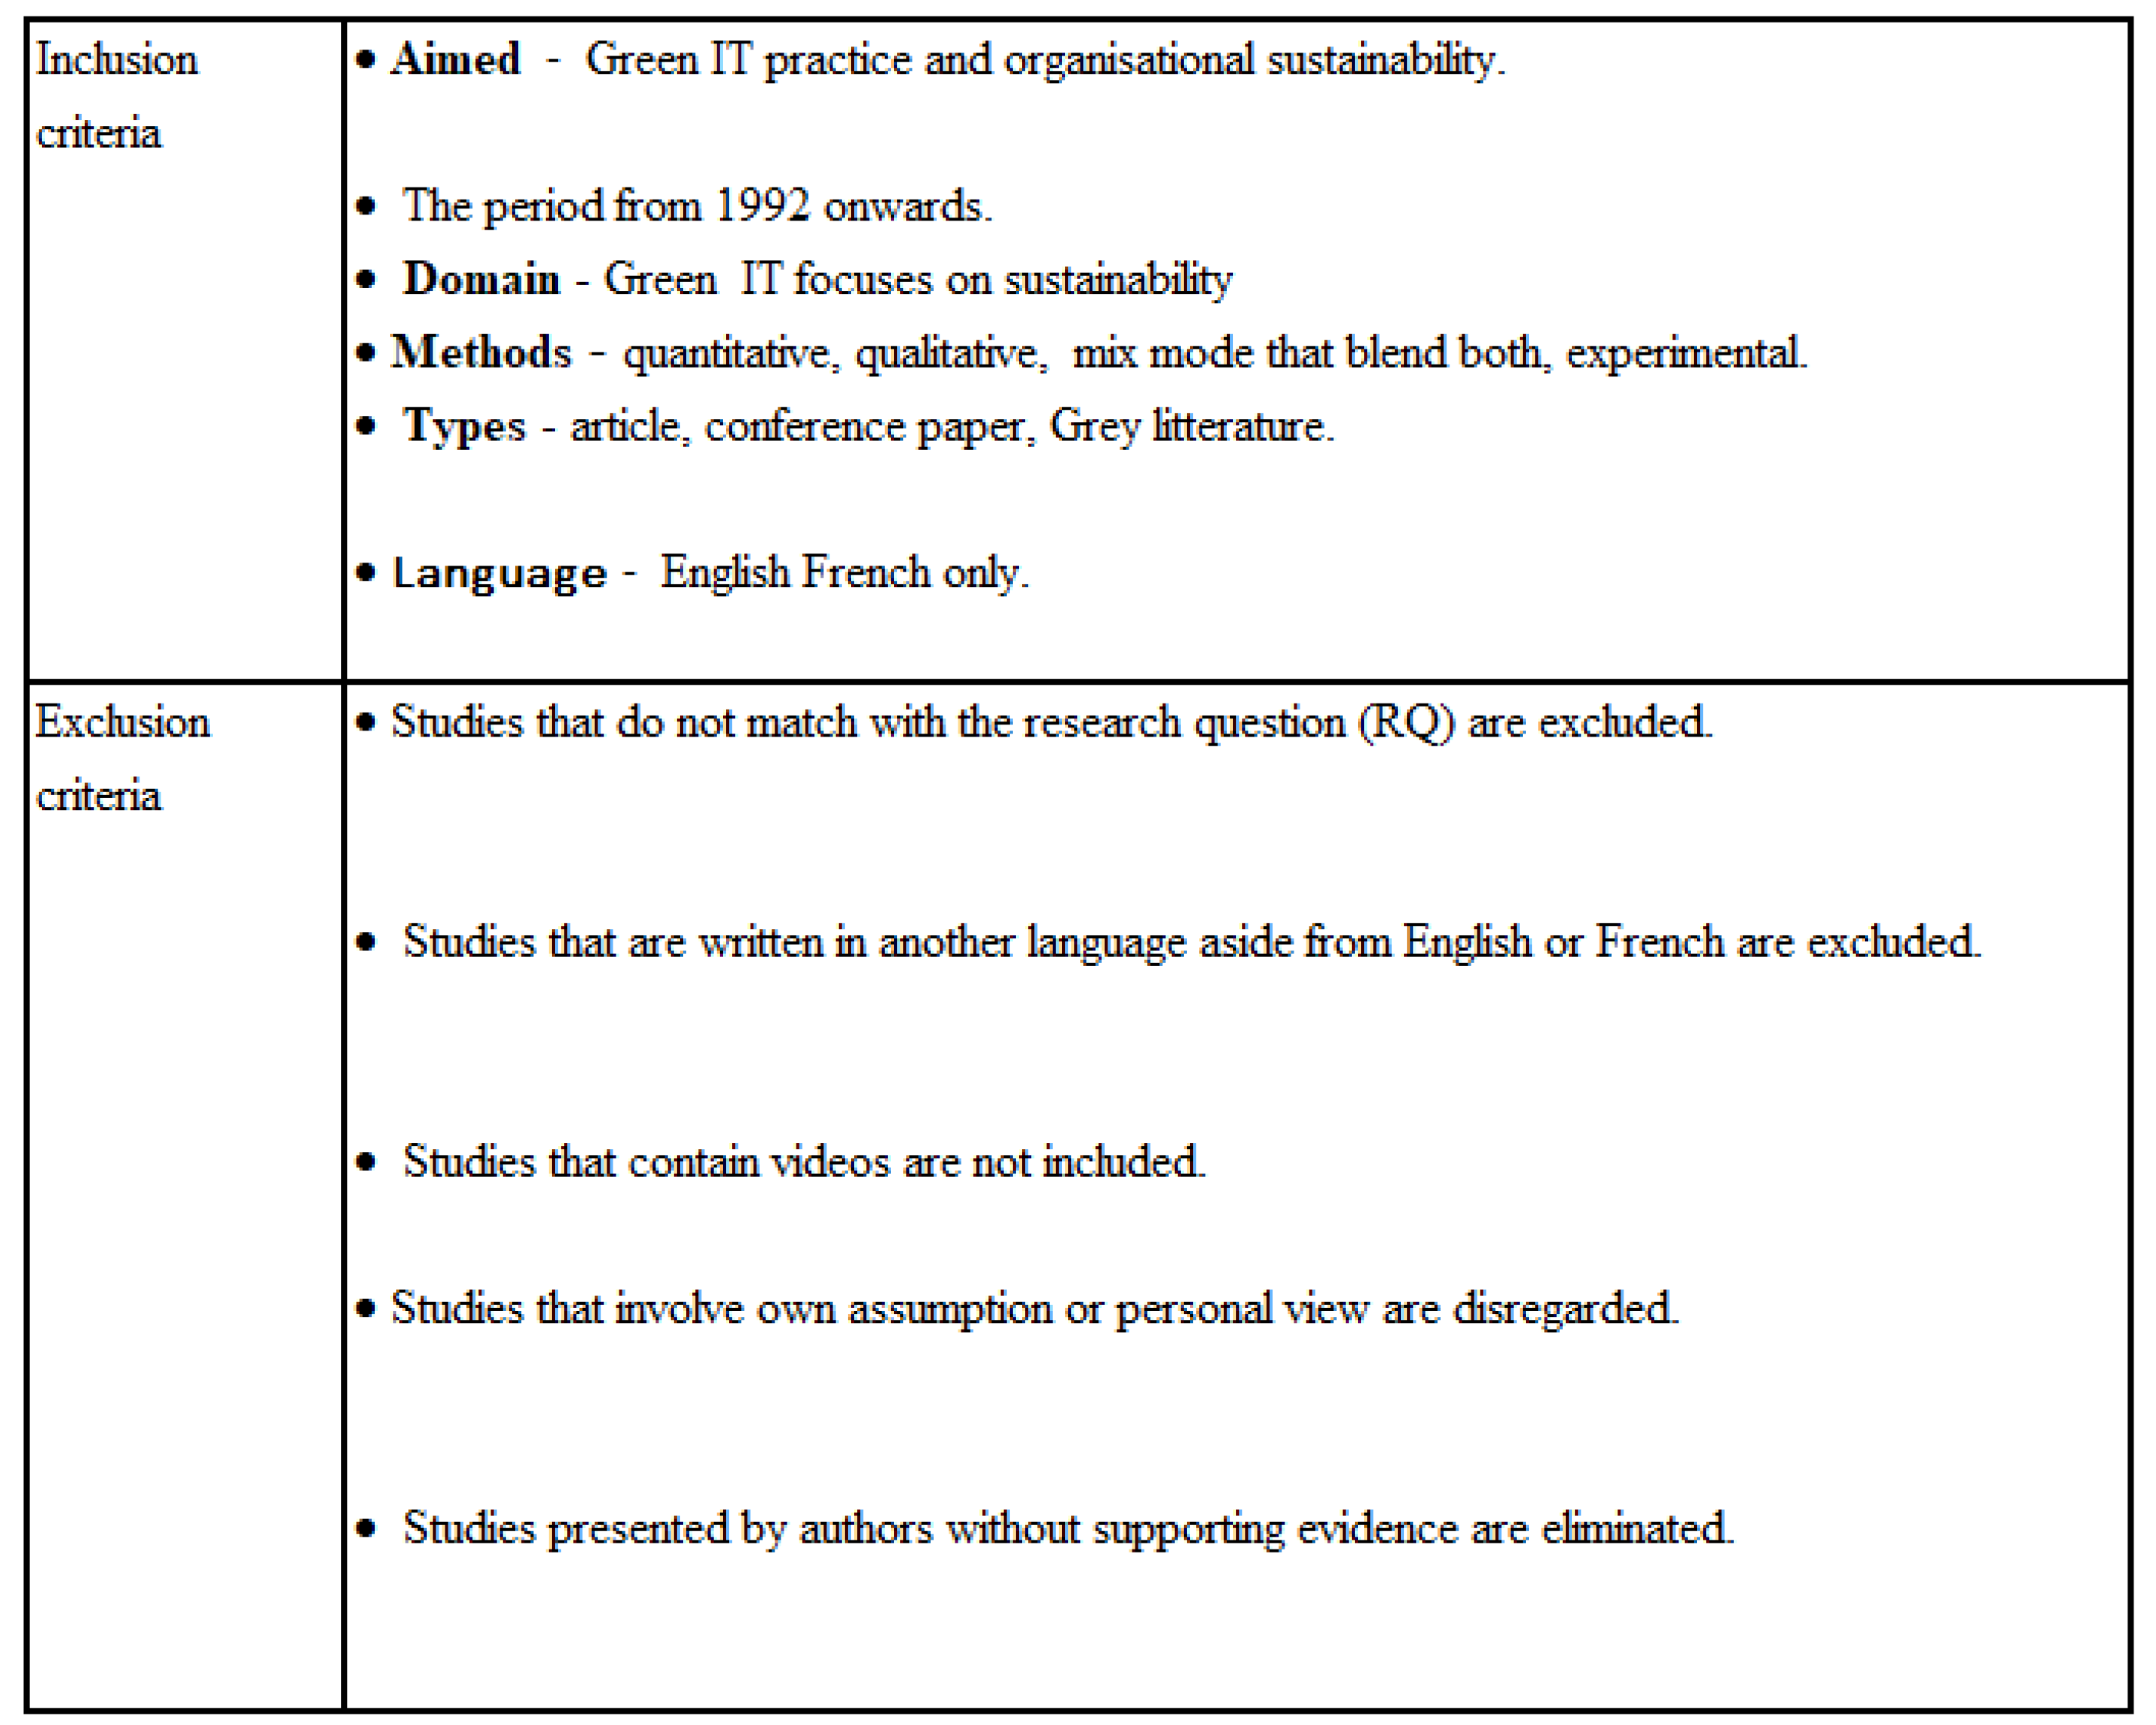
2.3. Inclusion and Exclusion Criteria
3. State of the Art
3.1. Définition
- Reduce the economic, social and environmental footprint of digital technology;
- Reduce the nuisances of the digital sector through its various stages: manufacture of computer equipment, use (energy consumption) and end of life (management and recovery of waste, pollution, depletion of non-renewable resources);
- Making digital technology accessible and ethical for all.
3.2. Key Concept
3.2.1. LCA
- ISO 14041: Objective and scope of research;
- ISO 14041: Inventory;
- ISO 14042: Impact analysis;
- ISO 14043: Interpretation of results.
- The production phase has the greatest impact;
- The transport phase has a very low impact on all environmental indicators, with the exception of ozone depletion where it generates 10% of the pollution;
- The use phase is responsible for 1% to 19% of the effects.
- LCD screen;
- Electronic components, except for the battery and the screen;
- Lithium–ion battery;
- Charger.
- Battery capacity;
- Load frequency;
- The efficiency of the billing chain;
- Use of external batteries.
- The battery capacity increases with the size of the screen;
- For the most popular smartphones, the battery supply voltage varies slightly (between 3.7 V and 3.85 V), ranging from 3.8 V to 3.82 V;
- The considerable difference in battery capacity associated with the corresponding autonomy, in most models, tries to maintain a battery life between 12 and 14 h (or 1.5 days of use).
3.2.2. Rebound Effect
3.2.3. WEEE
3.2.4. PUE
3.2.5. Cloud HyperScale
4. Sectors and Solution
4.1. DC
Solution
4.2. Networks
Solution
4.3. Equipment
- Use it as long as possible to avoid making new ones;
- Promote ecological design without chemicals that are harmful to the environment and users, and promote recycling.
Solution
5. Perspective
5.1. DC
5.2. Networks
5.3. Equipment
6. Other Perspective
6.1. IOT
6.2. 4G/5G Telecoms
6.3. Block Chain and Cryptocurrency
6.4. AI
7. Conclusions
- Hardware and software design;
- their development;
- and the purchasing sector.
- end-users (business services, support functions, also called “Internal Customers” by the IOC);
- and employees responsible for waste management.
Author Contributions
Funding
Institutional Review Board Statement
Informed Consent Statement
Data Availability Statement
Conflicts of Interest
References
- Accord de Paris. Available online: https://www.novethic.fr/lexique/detail/accord-de-paris.html (accessed on 13 April 2021).
- Pour une Sobriété Numérique: Le Nouveau Rapport du Shift Publié. The Shift Project, 4 October 2018. Available online: https://theshiftproject.org/article/pour-une-sobriete-numerique-rapport-shift/ (accessed on 5 May 2021).
- Cisco Annual Internet Report—Cisco Annual Internet Report (2018–2023) White Paper, Cisco. Available online: https://www.cisco.com/c/en/us/solutions/collateral/executive-perspectives/annual-internet-report/white-paper-c11-741490.html (accessed on 24 December 2021).
- Analyse du Cycle de Vie: Définition, Exemple ET Combien ça Coûte? Altermaker, 12 September 2019. Available online: https://altermaker.fr/analyse-cycle-de-vie/ (accessed on 16 November 2021).
- Shahzad, M.; Qu, Y.; Zafar, A.U.; Appolloni, A. Does the interaction between the knowledge management process and sustainable development practices boost corporate green innovation? Bus. Strat. Environ. 2021, 30, 4206–4222. [Google Scholar] [CrossRef]
- El Mzabi, A.; Khihel, F. Green IT une solution informatique pour l’environnement. Rev. Afr. Manag. 2018, 3. [Google Scholar] [CrossRef]
- Barnett, T.; Jain, S.; Andra, U.; Khurana, T. Cisco Visual Networking Index (VNI); Cisco Systems, Inc.: San Jose, CA, USA, 2022; p. 78. [Google Scholar]
- Empreinte Environnementale du Numérique Mondial, Green IT. Available online: https://www.greenit.fr/empreinte-environnementale-du-numerique-mondial/ (accessed on 12 April 2021).
- Lean ICT—Les Impacts Environnementaux du Numérique, The Shift Project. Available online: https://theshiftproject.org/lean-ict/ (accessed on 25 May 2021).
- Méthodologie de L’analyse du Cycle de Vie (ACV)—La Collecte des Données. Available online: http://stockage.univ-valenciennes.fr/MenetACVBAT20120704/acvbat/chap03/co/ch03_220_3-3-2.html (accessed on 14 October 2021).
- Andrae, A.S.; Vaija, M.S. To which degree does sector specific standardization make life cycle assessments comparable?—The case of global warming potential of smartphones. Challenges 2014, 5, 409–429. [Google Scholar] [CrossRef]
- Conseil, D.M. Etudes ACV (Analyse Cycle de Vie) Ordinateurs et TéLéphones Portables, Le Blog de DM Conseil—Actualités TIC. Available online: http://dmconseil.over-blog.com/article-etudes-acv-analyse-cycle-de-vie-ordinateurs-et-telephones-portables-49486289.html (accessed on 19 August 2021).
- Clément, L.-P.P.-V.; Jacquemotte, Q.E.; Hilty, L.M. Sources of variation in life cycle assessments of smartphones and tablet computers. Environ. Impact Assess. Rev. 2020, 84, 106416. [Google Scholar] [CrossRef]
- Court, V.; Sorrell, S. Digitalisation of Goods: A systematic review of the determinants and magnitude of the impacts on energy consumption. Environ. Res. Lett. 2020, 15, 043001. [Google Scholar] [CrossRef]
- Pour une Transition Numérique ÉCologique. Available online: https://www.senat.fr/rap/r19-555/r19-55512.html (accessed on 11 March 2021).
- CO2 Emission Intensity—European Environment Agency. Available online: https://www.eea.europa.eu/data-and-maps/daviz/co2-emission-intensity-5#tab-googlechartid_chart_11_filters=%7B%22rowFilters%22%3A%7B%7D%3B%22columnFilters%22%3A%7B%22pre_config_ugeo%22%3A%5B%22European%20Union%20(current%20composition)%22%5D%7D%7D (accessed on 19 August 2021).
- Gossart, C. TIC et politiques environnementales: L’épreuve de l’effet rebond. Netcom Réseaux Commun. Territ. 2008, 247–254. [Google Scholar] [CrossRef]
- Berthoud, F.; Parry, M. Évaluation des impacts environnementaux de l’informatique. Quels outils? Quelles limites? Termin. Technol. L’information Cult. Société 2010, 106–107. [Google Scholar] [CrossRef]
- Appolloni, A.; Jabbour, C.J.C.; D’Adamo, I.; Gastaldi, M.; Settembre-Blundo, D. Green recovery in the mature manufacturing industry: The role of the green-circular premium and sustainability certification in innovative efforts. Ecol. Econ. 2021, 193, 107311. [Google Scholar] [CrossRef]
- Uddin, M.; Alsaqour, R.; Shah, A.; Saba, T. Power usage effectiveness metrics to measure efficiency and performance of data centers. Appl. Math. Inf. Sci. 2014, 8, 2207. [Google Scholar] [CrossRef] [Green Version]
- Jones, N. How to stop data centres from gobbling up the world’s electricity. Nature 2018, 561, 163–166. [Google Scholar] [CrossRef] [PubMed]
- Masanet, E.; Shehabi, A.; Lei, N.; Smith, S.; Koomey, J. Recalibrating global data center energy-use estimates. Science 2020, 367, 984–986. [Google Scholar] [CrossRef]
- Les Data Centers en Route Vers la Neutralité Carbone—CCFI. Available online: https://www.ccfi.asso.fr/les-data-centers-en-route-vers-la-neutralite-carbone/ (accessed on 2 July 2021).
- Uddin, M.; Rahman, A.A. Energy efficiency and low carbon enabler green IT framework for data centers considering green metrics. Renew. Sustain. Energy Rev. 2012, 16, 4078–4094. [Google Scholar] [CrossRef]
- Malmodin, J.; Lundén, D. The Energy and Carbon Footprint of the Global ICT and E&M Sectors 2010–2015. Sustainability 2018, 10, 3027. [Google Scholar] [CrossRef] [Green Version]
- The Carbon Footprint of Streaming Video: Fact-Checking the Headlines—Analysis, IEA. Available online: https://www.iea.org/commentaries/the-carbon-footprint-of-streaming-video-fact-checking-the-headlines (accessed on 3 August 2021).
- Cisco News The EMEAR Network, 18 February 2020. Available online: https://news-blogs.cisco.com/emear/fr/2020/02/18/rapport-annuel-sur-linternet-cisco-prevoit-que-la-5g-supportera-plus-de-10-des-connexions-mobiles-mondiales-dici-2023/ (accessed on 28 October 2021).
- Welch, C. Google Confirms Dark Mode Is a Huge Help for Battery Life on Android, The Verge, 8 November 2018. Available online: https://www.theverge.com/2018/11/8/18076502/google-dark-mode-android-battery-life (accessed on 18 August 2021).
- P. 31 M. 2015|19:00 GMT. Moore’s Law Might Be Slowing Down, but Not Energy Efficiency—IEEE Spectrum, IEEE Spectrum: Technology, Engineering, and Science News. Available online: https://spectrum.ieee.org/computing/hardware/moores-law-might-be-slowing-down-but-not-energy-efficiency (accessed on 2 June 2021).
- Les Achats Eco-Labellisés et les Labels Green IT, Comment s’y Retrouver ? Actu-Environnement. Available online: https://www.actu-environnement.com/blogs/dominique-ortoli/96/labels-normes-greenit-eco-labellisation-RSE-139.html (accessed on 6 August 2021).
- Hafs, A. Premieres Initiatives Permettant de Reduire L’impact Environnemental des Data Centers, Digital Corner, 24 November 2020. Available online: https://www.digitalcorner-wavestone.com/2020/11/premieres-initiatives-permettant-de-reduire-limpact-environnemental-des-datacenters/ (accessed on 6 August 2021).
- Andrae, A.S.G.; Edler, T. On Global Electricity Usage of Communication Technology: Trends to 2030. Challenges 2015, 6, 117–157. [Google Scholar] [CrossRef] [Green Version]
- Tabaa, M.; Monteiro, F.; Bensag, H.; Dandache, A. Green Industrial Internet of Things from a smart industry perspectives. Energy Rep. 2020, 6, 430–446. [Google Scholar] [CrossRef]
- E-Waste Day: 82% of India’s E-Waste Is Personal Devices. Available online: https://www.downtoearth.org.in/blog/waste/e-waste-day-82-of-india-s-e-waste-is-personal-devices-6188 (accessed on 28 December 2021).
- “Lean ICT: Towards Digital Sobriety”: Our New Report, The Shift Project, 5 March 2019. Available online: https://theshiftproject.org/en/article/lean-ict-our-new-report (accessed on 6 August 2021).
- Ray, P.P. The green grid saga-a green initiative to data centers: A review. Indian J. Comput. Sci. Eng. 2010, 1, 333–339. [Google Scholar]
- Data Centres and Data Transmission Networks—Analysis, IEA. Available online: https://www.iea.org/reports/data-centres-and-data-transmission-networks (accessed on 14 April 2021).
- Le Macbook Pro, Fabrique de Pollution. Available online: https://www.terraeco.net/Le-MacBook-Pro,39936.html (accessed on 22 March 2021).
- Numérique, Levier Pour L’environnement, la RSE, L’économie Circulaire et Sobriété Numérique (5G, IA...), Livosphere—Conseil Innovation: IA IoT, RSE Economie Circulaire, 9 September 2020. Available online: http://www.livosphere.com/2020/09/09/politique-de-sobriete-numerique-numerique-levier-pour-l-environnement-la-rse-l-economie-circulaire/ (accessed on 7 June 2021).
- Saidi, K.; Toumi, H.; Zaidi, S. Impact of information communication technology and economic growth on the electricity consumption: Empirical evidence from 67 countries. J. Knowl. Econ. 2017, 8, 789–803. [Google Scholar] [CrossRef]
- x38: Notre Consommation de Données en 10 ans, Green IT, 13 October 2020. Available online: https://www.greenit.fr/2020/10/13/x38-notre-consommation-de-donnees-en-10-ans/ (accessed on 2 July 2021).
- Greening, L.A.; Greene, D.L.; Difiglio, C. Energy efficiency and consumption—The rebound effect—A survey. Energy Policy 2000, 28, 389–401. [Google Scholar] [CrossRef]
- Stoll, C.; Klaaßen, L.; Gallersdörfer, U. The Carbon Footprint of Bitcoin. Joule 2019, 3, 1647–1661. [Google Scholar] [CrossRef]
- Bitcoin Causing Carbon Dioxide Emissions Comparable to Las Vegas or Hamburg: Hardware and IP Addresses Analyzed to Assess the Carbon Footprint of the Cryptocurrency, ScienceDaily. Available online: https://www.sciencedaily.com/releases/2019/06/190613104533.htm (accessed on 7 May 2021).
- Hsueh, G. Carbon Footprint of Machine Learning Algorithms. Senior Projects Spring 2020. Available online: https://digitalcommons.bard.edu/senproj_s2020/296 (accessed on 28 December 2021).
- Jailani, S.F.A.K.; Abdullah, L.M. Systematic Literature Review on Green IT Practice and Executional Factors. Int. J. Supply Chain. Manag. 2017, 6, 147–154. [Google Scholar]


Publisher’s Note: MDPI stays neutral with regard to jurisdictional claims in published maps and institutional affiliations. |
© 2022 by the authors. Licensee MDPI, Basel, Switzerland. This article is an open access article distributed under the terms and conditions of the Creative Commons Attribution (CC BY) license (https://creativecommons.org/licenses/by/4.0/).
Share and Cite
Guillaume, B.; Benjamin, D.; Vincent, C. Review of the Impact of IT on the Environment and Solution with a Detailed Assessment of the Associated Gray Literature. Sustainability 2022, 14, 2457. https://doi.org/10.3390/su14042457
Guillaume B, Benjamin D, Vincent C. Review of the Impact of IT on the Environment and Solution with a Detailed Assessment of the Associated Gray Literature. Sustainability. 2022; 14(4):2457. https://doi.org/10.3390/su14042457
Chicago/Turabian StyleGuillaume, Bourgeois, Duthil Benjamin, and Courboulay Vincent. 2022. "Review of the Impact of IT on the Environment and Solution with a Detailed Assessment of the Associated Gray Literature" Sustainability 14, no. 4: 2457. https://doi.org/10.3390/su14042457