Article

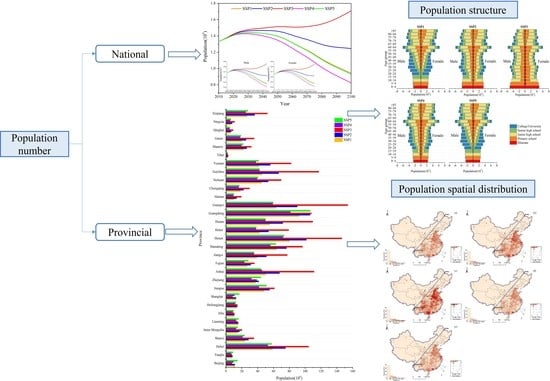
Estimating China’s Population over 21st Century: Spatially Explicit Scenarios Consistent with the Shared Socioeconomic Pathways (SSPs)

1
Key Laboratory of Land Surface Pattern and Simulation, Institute of Geographic Sciences and Natural Resources Research, Chinese Academy of Sciences (CAS), Beijing 100101, China
2
College of Resources and Environment, University of Chinese Academy of Sciences (UCAS), Beijing 100049, China
3
Bureau of Development and Planning, Chinese Academy of Sciences (CAS), Beijing 100864, China
*
Author to whom correspondence should be addressed.
Sustainability 2022, 14(4), 2442; https://doi.org/10.3390/su14042442
Submission received: 20 January 2022 / Revised: 11 February 2022 / Accepted: 15 February 2022 / Published: 21 February 2022
(This article belongs to the Topic Climate Change and Environmental Sustainability)

Abstract

:
Accurate and reliable subnational and spatially explicit population projections under shared socioeconomic pathways (SSPs) for China will be helpful for understanding long-term demographic changes and formulating targeted mitigation and adaptation policies under climate change. In this study, national and provincial populations for China by age, sex, and education level to 2100 under five SSPs were estimated using the population-development-environment model. These parameters include fertility, mortality, migration, and education and consider the most recent birth policy in China. To quantify these projections spatially, the gridded population was provided at 1 km × 1 km by spatial downscaling. Results show the national population is highest under SSP3, with 1.71 × 10⁹ people in 2100. Guangdong, Henan, and Shandong are the most populous in SSP1, 2, 4, 5, while Guangxi is the most populous province in SSP3, reaching 1.54 × 10⁸ people. The differences in education level among scenarios are obvious, especially in 2100 where education level for SSP1 and SSP5 is the highest. The spatial distribution of population varies across the country, with the majority of the population concentrated in southern and eastern China, especially in the coastal regions. Our results under different SSPs could provide a reference to project disaster risks, formulate relevant policies and guide sustainable development from a long-term perspective.

Graphical Abstract

1. Introduction

Increasing greenhouse gas emissions as a result of human activity are considered the main cause of global warming [1]. The dramatic and rapid growth in population and economic activities in the 20th century has brought unprecedented pressures to bear on the climate and the environment [2,3,4]. Generally, the population directly influences the challenges related to climate change, including, but not limited to, influencing social development and economic growth, determining the amounts of resource consumption and pollutant emissions, and affecting the number of residents exposed to natural disasters [5,6,7]. Apart from total population size, the structure (age, sex, and education level) and distribution of the population are important factors in climate and global environmental change research. These are important sources of population heterogeneity, and their changing composition is directly relevant in the anticipation of socioeconomic challenges to mitigate and adapt to climate change. For example, population aging is considered a highly important socioeconomic challenge under climate change which will significantly increase the cost of adaptation but can only be quantitatively addressed if the age structure of populations is considered in the projection model [8]. The rise in the educational composition of the population is beneficial to a broad range of social and economic development. It lessens the pressure of adapting to climate change, which has seldom been included in population projections [9]. Females, children, and elder people are more vulnerable and susceptible to extreme climate events than males and young adults. The spatial distribution in the population is perhaps even more important in determining the potential risk of the population to natural disasters with climate change [10,11]. Thus, accurate and robust predictions of population size, structure (age, sex, and education level), and spatial distribution will help studies of the impact of climate change on social economy, human health, resource demand and allocation, and provide a scientific basis for the design of strategies to control greenhouse gas emissions and the formulation of mitigation and adaptation policies [12,13,14]. Moreover, these three quantitatively modeled and projected dimensions can be directly related with, and give reference to, many of the Sustainable Development Goals (SDGs) such as SDG4 (quality education), SDG5 (gender equality), SDG13 (climate actions), and to the main components of the human development index (HDI) [15,16].
Climate scenarios form the basis of climate change research, and the rational setting of socioeconomic development scenarios is the core of climate change impact assessment [17]. The Intergovernmental Panel on Climate Change (IPCC) published Shared Socioeconomic Pathways (SSPs) that describe future socioeconomic conditions under various scenarios in 2014 [12]. SSPs are reference pathways that describe plausible alternative trends in the evolution of society and ecosystems over the 21st century in the absence of climate change or climatic policies [18]. Five such SSP scenarios (SSP1–5) have been developed. Specifically, SSP1 is a sustainable development scenario, with rapid technological change that lessens reliance on carbon energy sources; SSP2 describes a medium scenario that maintains the current trend of development and gradually reduces dependence on carbon energy sources; SSP3 is a regionalized scenario that leads to reduced trade flows, unfavorable institutional development and low adaptive capacity to climate change; SSP4 is an inequality scenario with relatively rapid technological development in low carbon energy sources in key emitting regions, however, in other regions development proceeds slowly, leaving these regions highly vulnerable to climate change with limited adaptive capacity; SSP5 describes a scenario that focuses on mitigating challenges driven by high investments in human capital, leading to a world that is less vulnerable to the adaptations required of climate change [19]. Studies of population and economic changes in more than 150 countries have already obtained preliminary results based on these SSPs. Previous studies have made some progress in developing population and economic projections at global and national scales in the various SSPs [20,21,22]. However, with the increasing demand for population analysis in small areas related to climate change, the projected size, gender, age, education, and other structures of the sub-local levels, as well as the spatial distribution of the future population, have received less attention [23,24].
Currently, China is the most populous country in the world, although India is projected to overtake it within a decade. China has special policies and institutional constraints regarding population growth, structural changes, and spatial characteristics. Despite the growing demand for local population projections, relatively few local population forecasts exist for China, and the spatial resolution of the projected data is not high [25,26]. Moreover, existing Chinese population projection studies using the SSPs are usually limited. For example, in 2017 the International Institute for Applied Systems Analysis (IIASA) developed a global population projection at the national scale from 2010 to 2100 using the SSPs by dividing all countries into three groups (HiFert, LoFert, and Rich-OECD) [8,19]. The variation in population growth parameters among different country groups and SSP scenarios were considered in the projection. However, the specific Chinese economic development model, household registration policies, and migration laws were not taken into account in the projection. Since the projection was developed at the national scale, they were unable to combine targeted population changes with the localized economic and social development at subnational scales such as provincial. However, the method for grouping different regions provided us with ideas for conducting research and setting parameters at the provincial scale in China (See details in Materials and Methods). Furthermore, the population estimates under the existing SSP pathways have not yet taken into account the impact of changes in population policy in China [27,28,29]. Lack of detailed and accurate population projections as to size and structure at subnational scales and spatially clear populations may hinder our understanding of the demographic changes in China’s provinces and is not conducive to analyzing the impact of climate change on the population of the country as a whole [30]. Therefore, there is an urgent need to make projections of China’s population concerning age, sex, and education, as well as a high-resolution spatial distribution of population size under the different SSPs.
To fill these knowledge gaps, a consistent and equitable population projection at subnational and gridded scale under future diverse SSPs for China has been the subject of scarce research. Taking into account the latest national population policies in China, we estimated the annual provincial population in China using population structures for sex (male, female), age (0–85+, divided into 18 age groups separated into cohorts of five years), and education level (illiterate, primary school, junior high school, senior high school, and college/university, consistent with the categories in the Chinese census) under SSPs from 2011 to 2100. On this basis, gridded population data were provided by spatially downscaling the total population in the SSPs to a spatial resolution of 1 km × 1 km. The main target of this study is quantification of the trend and change of population for China under different SSPs to characterize the variation of population among scenarios. This distinguishes the characteristics of age, sex, and education structure in the future. Furthermore, it also identifies high-value population regions to support decision-makers in formulating targeted population policies and climate change mitigation and adaptation strategies.

2. Materials and Methods

2.1. Materials

Population data in the base period 2010 were obtained from the sixth national census of China conducted in 2010, which has high accuracy in population statistics. The data used in this study include population by sex and 18 age groups (0–85+) on the total population and death population, the fertility data of women of childbearing age as well as the education level (illiterate, primary school, junior high school, senior high school, and college/university) of 31 provinces in mainland China, excluding Hong Kong, Macao, and Taiwan. Additionally, statistical population data by sex and age from 2011–2019 were obtained from national and provincial statistical yearbooks to compare to results of population projections to examine the accuracy.

2.2. Population-Development-Environment (PDE) Model

A PDE model was proposed by the International Institute for Applied Systems Analysis (IIASA), which involves many classic algorithms for population estimation, including the composition estimation algorithm based on queue sorting and the extended life continuity algorithm under the multi-population state [31]. Over the past decades, the model has been developed and improved by many scholars and been used in global and regional population estimation in different development states [32].
The PDE model simulates the natural cascade movement of the newborn population and population of different age structures by setting parameters such as fertility rate, mortality rate, migration rate, and realizes the mutual conversion between multiple states. The population of t + 1 years old in a certain year was calculated as follows:
P t + 1 = P t · ( 1 D t + 1 ) + M t + 1
where P t + 1 is the population of t + 1 years old in the current year; P t is the population of t years old in the previous year; D t + 1 is the mortality rate of t + 1 years old people in the current year, and M t + 1 is the net migration population of t + 1 years old people in the current year.
Also, the number of new-born people in a certain year is calculated as follows:
P c = t = 15 49 W t · F t
where P c is the number of new-born people in the current year, W t is the number of women at childbearing age (15–49) in the t years old in the current year, and F t is the fertility rate of the t years old women in the current year.

2.3. Demographic Parameter Setting under Different SSPs

With reference to population projections conducted by IIASA for different classifications of 150 countries in the world, hypotheses of the low, medium, and high fertility, mortality, migration rate, and educational attainment in the future were proposed [19,33]. The parameters were set in combination with the lately birth policy in China, which replaced the one-child policy of 1979–2015 (Table 1).
Each SSP corresponds to a combination of fertility, mortality, migration rate, and educational attainment. SSP1 is a sustainable development scenario that attaches importance to education, and has high medical and educational standards, resulting in low fertility and mortality, and the migration rate is maintained at a medium level. SSP2 describes the business-as-usual scenario and maintains the current development trend of fertility, mortality, migration rate, and education attainment. SSP3 is a global regional rivalry scenario, the education level only maintains the current enrollment rate, low education level brings higher fertility and mortality and the migration rate is considered as low. SSP4 is an unbalanced development scenario, and the educational progress varies from province to province. The well-developed provinces will experience higher progression rate development while the poor province in the economy will remain at the current level of progression rate. In this case, the fertility and mortality rates are low, which is consistent with the global assumption and the migration rate is considered to be moderate. SSP5 describes a fossil-fueled development scenario, with similar fertility, mortality, and education development conditions to SSP1, but a high degree of marketization and globalization makes migration rates higher than SSP1 in this scenario.

2.3.1. Fertility

Among the three hypotheses about fertility, the medium hypothesis maintains the current fertility rate. According to previous studies of the fertility intentions of Chinese women following the most recent more-than-one-child policy, the average number of children that Chinese women aged 15–49 are willing to have is 1.8–1.9 [34,35,36]. Following the introduction of the new birth policy in 2015, the new birth rate of women in China was expected to increase slightly [37], reaching a peak of 1.9 in 2019 and then gradually decreasing and stabilizing at 1.8 [38,39].
Under the assumption of high/low fertility rate, the fertility value was set based on the prediction scheme proposed by the Vienna Institute of Demography according to an analysis of the population input model of 41 low-fertility countries and finally evaluated by more than 170 experts [40,41]. It is predicted that, from 2010, the fertility rate was likely to gradually increase/decrease compared with the medium hypothesis, with 20% higher/lower fertility in 2030, 25% higher/lower in 2050, and maintaining the previous level after 2050. The total fertility rate of women in China in the period 2010–2050 was obtained by refining the rate using equal growth every five years [42]. Accordingly, the total fertility of each province was converted based on the fertility data in 2010, with the proportion of fertility of all age groups remaining unchanged in 2010. Furthermore, the gender ratio of men to women in China fluctuated 1.0219–1.0674 between 1995 and 2010 according to data from the China Statistical Yearbook in 2011. Therefore, the gender ratio of the new population was set in the range from 1.02 to 1.07. The total fertility rate and by age groups at three assumptions are shown in Supplementary Tables S1–S4.

2.3.2. Mortality

We calculated the basic mortality rate and life expectancy of each province in China in 2010 using the death toll of different age groups. According to the output data from the global conditional convergence model obtained from IIASA and the evaluation of the expert group, under the medium hypothesis, the life expectancy per capita will increase by 2 years every 10 years before 2050, and by 1 year every 10 years after 2050 [43,44]. That is, life expectancy will increase by 0.2/a before 2050 and by 0.1/a after 2050. Under the high/low hypothesis, life expectancy per capita is lower/higher than that of the medium hypothesis, that is, 0.1/a lower/higher than the medium hypothesis. The gap between the low/high hypothesis and the medium hypothesis remains unchanged.

2.3.3. Migration

The immigration rate is based on previous studies of global immigration and the immigrant population. The current level remains at the medium assumption, and the net immigration of each province remains unchanged [45]. The migration population under the high assumption gradually increases to twice that of the level in 2010 within 15 years, and then remains unchanged. The migration population under the low assumption will gradually decrease to zero and then remain unchanged. The total net migration population of each province was calculated according to the floating population of each province within five years in the long census table. The average value was taken as the initial migration rate datum for each province, and then the corresponding conversion was made according to the population of each age group calculated every year.

2.3.4. Education

The education level of Chinese residents is evaluated into five levels: illiterate, primary school, junior high school, senior high school, and college/university according to the actual situation of the Chinese population and the results of the census. The assumption of educational attainment has been divided into three levels: low, medium, and high. The educational attainment under low assumption supposes the education of each will not be developed or developed at a slow speed, and only maintaining the current level of progression rates of each province of China in 2010. High-level educational attainment assumes that each province develops rapidly and gradually approaches the level of the most developed countries in the world (i.e., South Korea), which would take 30–40 years according to statistics of UN [40]. The current progression rates for primary school, primary school to junior high school, junior high school to senior high school, and senior high school to college/university are 100%, 99.9%, 98.7%, and 78.0%, respectively [46]. Therefore, the progression rate of each province in China under the high assumption increases year by year, before reaching this level in 2050 and remaining unchanged thereon. The medium assumption is a secondary education hypothesis between high and low levels. Thus, the progression rate of each province in this assumption is the average of the above two assumptions in this study. In SSP4, assumptions of educational attainment for different provinces depend on the economic development level, and the grouping of provinces is shown in Supplementary Table S5.

2.4. Population Spatialization

We used a multi-factor weighting-based approach to downscale the projected provincial population to a gridded level referring to a previous study [47]. The gridded population in 2010 was spatialized based on the comprehensive consideration of factors closely related to the population, such as land use, night-time light, residential density, etc. The weight was calculated and standardized to obtain the total weight of the three factors for the provincial level. On this basis, the gridded population was computed by the proportion of weight as follow:
P g i = P × W i W
where P g i is grid unit value of population after spatialization. P is the provincial population where the grid is located; W i the total weight of land use, night-time light, and residential density where the grid is located; W is the total weight of the province.
P = p o p i p o p 2010 × t
where P is the predicted grid pixel value of a province in that year, p o p 2010 is the population of a province in 2010, p o p i is the predicted population of a province in that year, and t is the grid pixel value of the province in 2010.

2.5. Error Verification

To verify the accuracy of the population predictions, the relative error (RE), determination coefficient (R2), root mean square error (RMSE), Nash–Sutcliffe efficiency (NSE), RMSE-observations standard deviation ratio (RSR), and percent bias (PBIAS) were used to evaluate the predicted results of the model according to traditional demographics [48,49], which are computed as follows:
R E = | U X | U
R 2 = ( i = 1 n ( X i X ¯ ) ( U i U ¯ ) ) 2 i = 1 n ( X i X ¯ ) 2 i = 1 n ( U i U ¯ ) 2
R M S E = 1 n i = 1 n ( U i X i ) 2
N S E = 1 i = 1 n ( U i X i ) 2 i = 1 n ( U i U ¯ ) 2
R S R = i = 1 n ( U i X i ) 2 i = 1 n ( U i U ¯ ) 2
P B I A S = i = 1 n ( U i X i ) 100 i = 1 n U i
where X is the predicted value, U is the real value of the statistical data, i represents the different provinces, X ¯ is the mean of the predicted values, and U ¯ is the mean of the statistics. Among the indicators, the value of RE approaching 0 and the value of R2 approaching 1 indicate that the model is performing better. It is commonly accepted that the lower the value of RMSE, the better the performance of the model and the accuracy of prediction. For RSR and NSE, the accuracy of prediction is rated as “Very Good” (0.00 ≤ RSR ≤ 0.50, 0.75 ≤ NSE ≤ 1.00), “Good” (0.50 < RSR ≤ 0.60, 0.65 < NSE ≤ 0.75), “Satisfactory” (0.60 < RSR ≤ 0.70, 0.50 < NSE ≤ 0.65), or “Unsatisfactory” (RSR > 0.70, NSE ≤ 0.5). The optimal value of PBIAS is 0.0, with low-magnitude values indicating accurate model simulation [48].

3. Results

3.1. National Population Projections in SSPs from 2011–2100

Figure 1 shows the estimated results of the total population and for males and females in China under five SSPs. The population under SSP1, SSP2, SSP4, and SSP5 all increased firstly and then decreased and reached their peaks around 2030, which were 1.44 × 10⁹ (2032), 1.46 × 10⁹ (2037), 1.42 × 10⁹ (2027), and 1.44 × 10⁹ (2032) people, respectively. While the population change under the SSP3 path is different from other paths, the populations increased before the middle of the century and decreased around the 2060s and then continued to increase till the end of this century, which reached its peak in 2100 with 1.71 × 10⁹ people. The population in 2100 under SSP3 is 3.68 times that of SSP4. The changing trend of the population for males and females is similar to the total population of each SSP, while the number of males is larger than that of females in all SSPs.
The comparison between the predicted population in SSP2 and statistical population during 2011–2019 is shown in Table S6, and the results of error analysis are shown in Table S7. The mean value of RE was 0.39% during 2011–2019, a value of 0.59% in 2019 is the highest, and the value of 0.10% in 2016 is the lowest. Considering the huge population base in China, the RE of the total population is relatively low, and the predicted values are quite accurate. Results of error analysis show that R2 between the predicted and statistical values reached 0.99, which was almost 1. Besides, other evaluation indicators, such as RMSE and PBIAS, were also at quite low values. Moreover, NSE and RSR also showed the model performs “Very Good”. All results indicate that the predicted value of the total population is quite accurate.

3.2. Provincial Population Projections in SSPs from 2011–2100

Projections of the provincial population in 2100 under SSP1–5 are shown in Figure 2. Among the 31 provinces, Guangdong, Henan, and Shandong were the most populous in SSP1, SSP2, SSP4, and SSP5, and presently have the larger populations. While in SSP3, Guangxi was projected to be the most populous province, reaching 1.54 × 10⁸ people, followed by Henan, Guizhou, Anhui, and Hunan. These provinces are located in central and western China, with relatively low economic development, high fertility rate, and main emigration. Under SSP3, with high GHG emissions and low living conditions, these provinces magnified the originally high fertility rate and caused a sharp increase in the newborn population. In addition, most of the provinces have the highest population estimation under SSP3 among five SSPs due to the high fertility rate. While for some provinces, such as Beijing, Shanghai, Tianjin, and Zhejiang, where the economic level is high and population migration is dominated by immigration, their largest population was likely to appear in SSP5, which emphasizes economic development as the orientation. Although the economically developed provinces have lower fertility rates, they can attract more people to migrate from provinces with lower levels of economic development, thereby realizing their own labor force growth.
Figure S1 shows the statistical values of the population for 31 provinces in 2011, 2015, and 2018 and the projections for the same years in SSP2. The result shows that the predicted values were nearly equal to the statistical value in each of the three years in most of the provinces. Table S8 presents the values of error analysis between the predicted and counted provincial populations. The R2 values were all close to 1 in 2011, 2015, and 2018, which shows there was a strong correlation between the predicted and statistical provincial populations. Moreover, the absolute values of RMSE, NSE, RSR, and PBIAS were projected to increase over time, but the overall RMSE values were not more than 1.00, the PBIAS values were not more than 0.3, and both the NSE and NSR values indicated “Very Good.” All indicators proved the accuracy of predicting the population of the province.

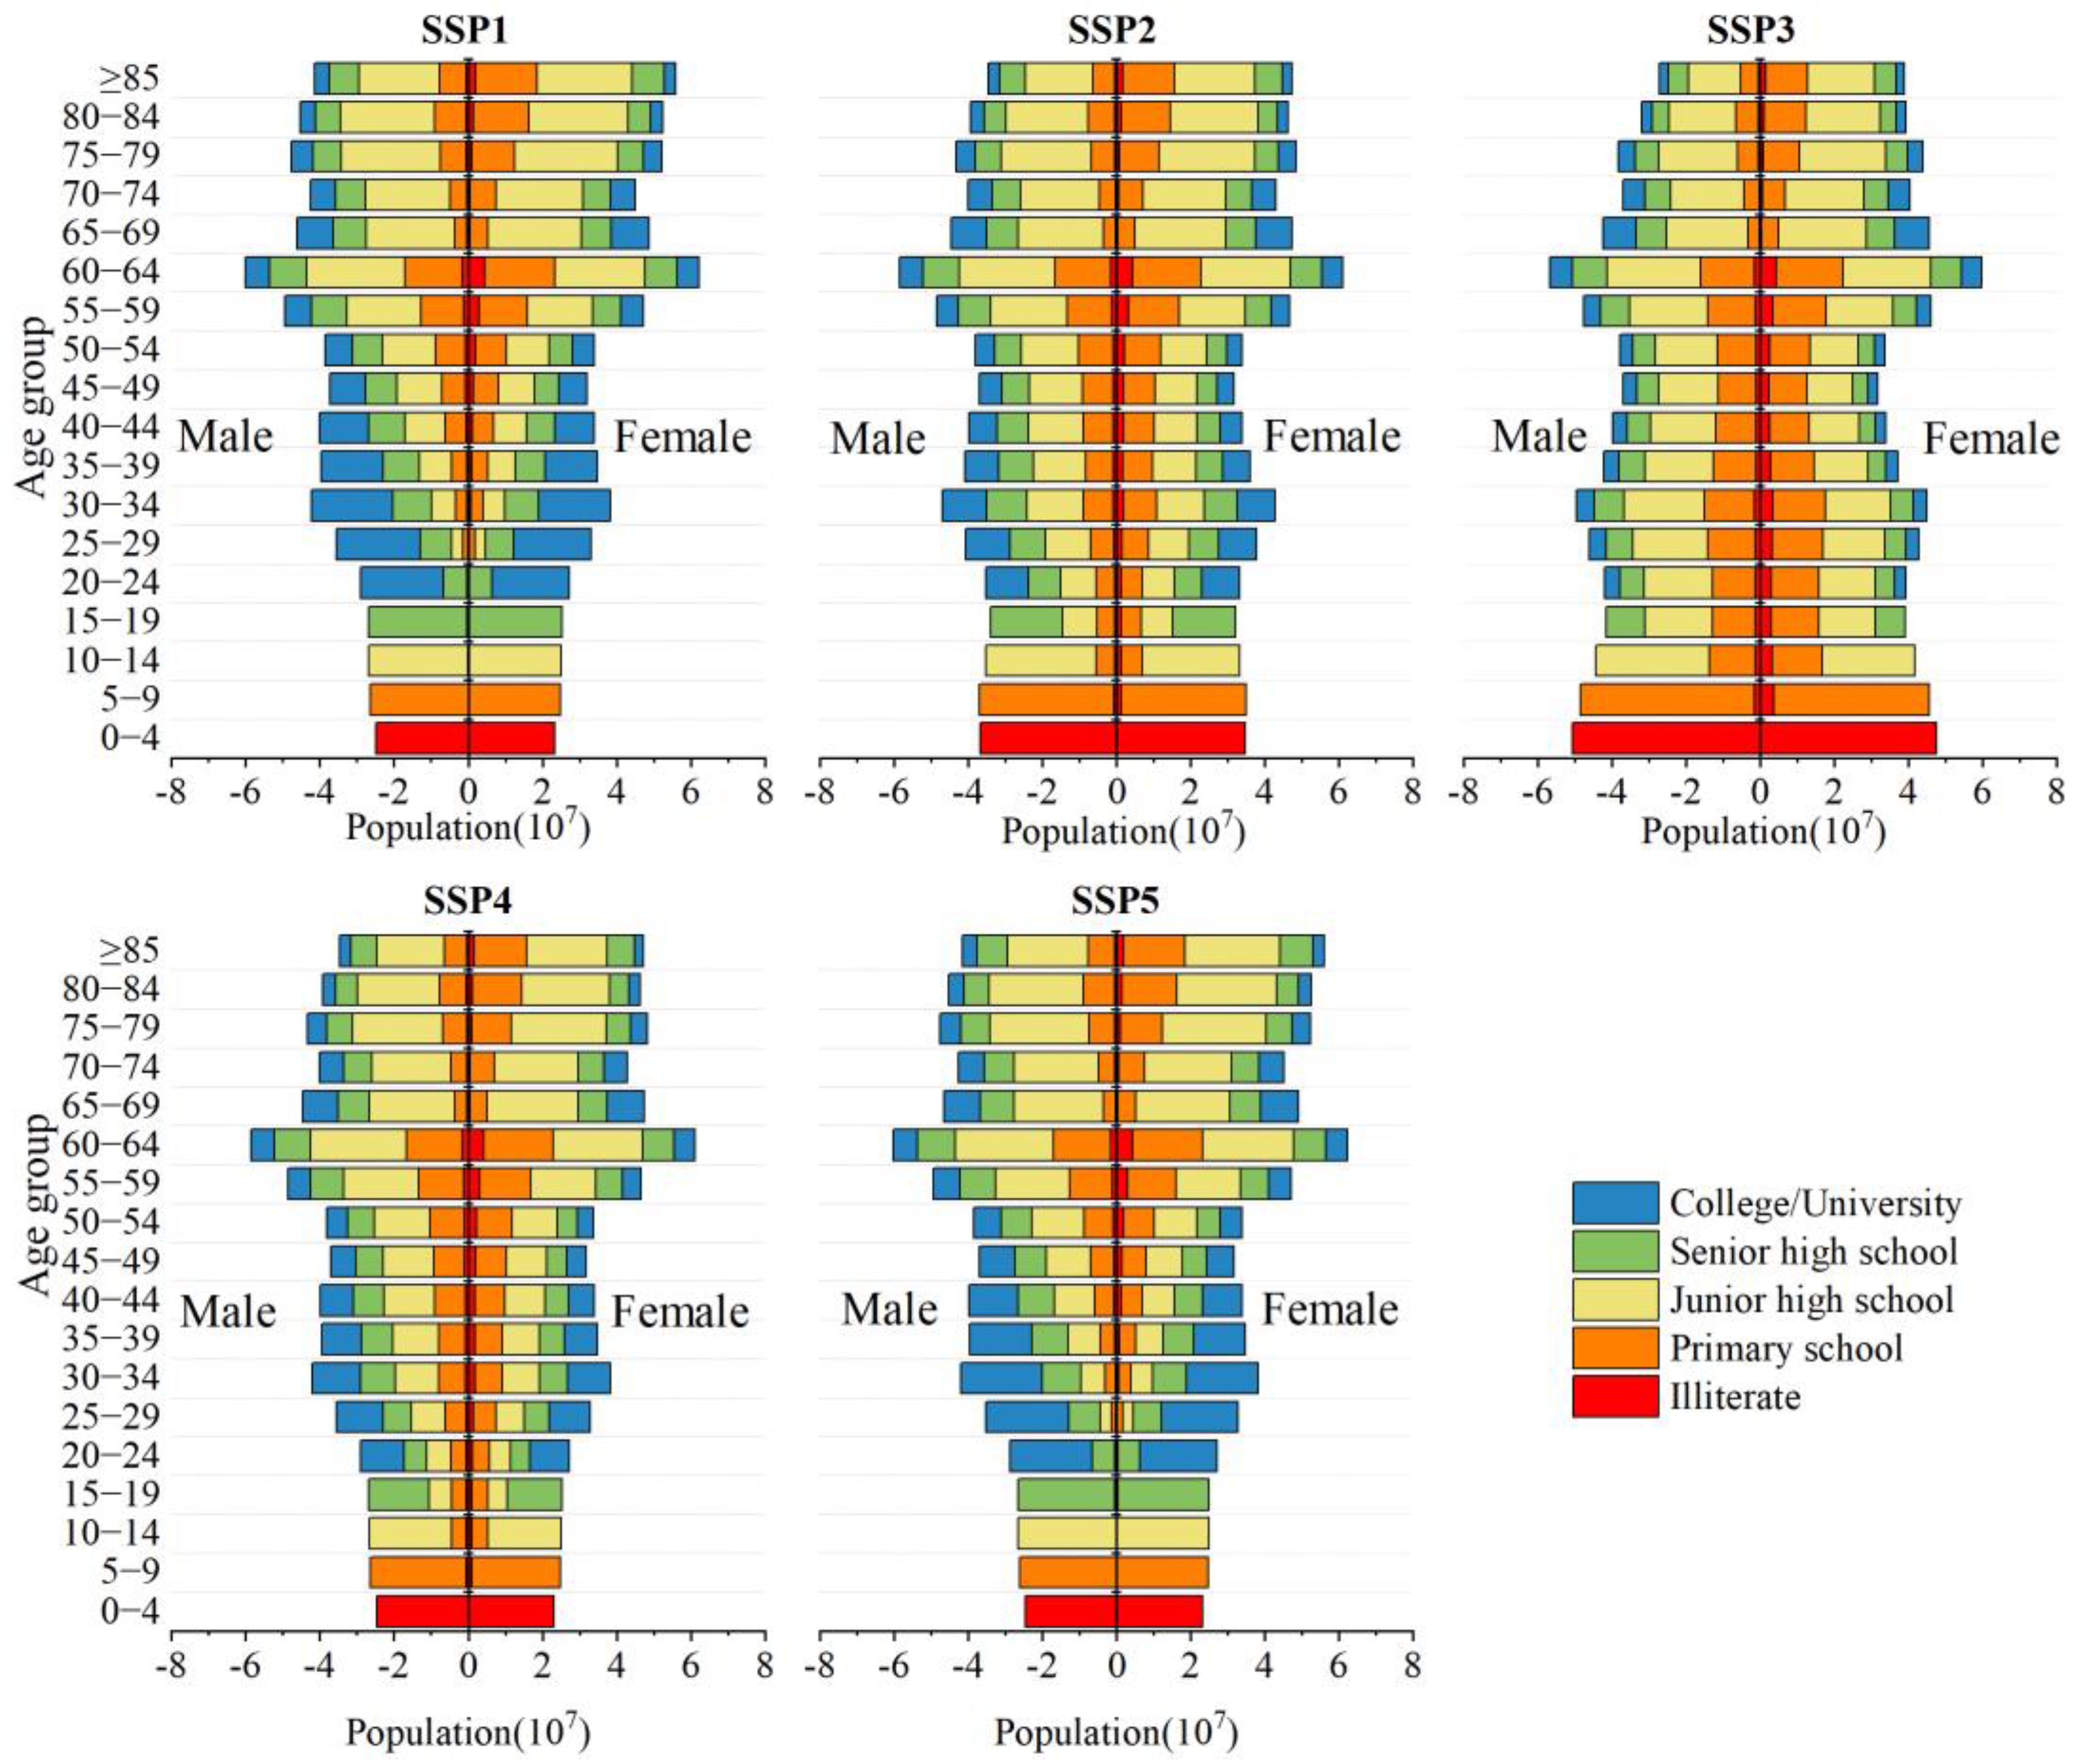
3.3. Provincial Population Projections by Age, Sex, and Education in SSPs from 2011–2100

The population age structure in 2050 under SSP1–5 was projected to be relatively similar, the differences were manifested in the number of newborn populations (Figure 3). The newborn population in SSP2 and SSP3 was higher than the other three SSPs. While for the age structure in 2100, there were obvious differences among five SSPs (Figure 4). For SSP1 and SSP5, which adopted a population development model with low fertility and low mortality. The age structure was likely to show an “inverted triangle” in 2100, which indicated the living standard of residents was relatively high, but they were facing serious population aging and labor shortage. The age structure under SSP4 also shows an “inverted triangle”, however, the elderly population in SSP4 was less than that of SSP1 and SSP5 as a result of the adaptation challenges it faces, and life expectancy is limited. SSP2 maintains the current level of socioeconomic development, the distribution of all age groups is balanced, and the labor force is sufficient. Age structure in SSP3 shows a “pyramid” shape, which means the labor force was sufficient, and the aging problem was slightly lighter than other scenarios.
For population sex structure, there was some similarity under the five SSPs. For example, in 2050 (Figure 3), the number of male populations ranging from 0 to 59 years old was larger than that of the female populations. The reason is that the sex ratio of the newborn population is over 1, and the mortality rate for both males and females is almost equal. While for the population over 60 years old, the number of females was higher than that of males due to females having a longer life expectancy than males.
The differences in education level among different scenarios were obvious, especially in 2100 (Figure 4). SSP1 and SSP5 adopted a model with high education level, so the education level of most adults was senior high school or college or university. For education level for SSP2 and SSP4, the proportion at senior high school or college or university was lower than under SSP1 and SSP5, but it still took up nearly 50% of each age group for adults over 20 years old. For SSP3, which maintains the current education level, the proportion of education level lower than senior high school was projected to take up nearly 80% of each age group for adults over 20 years old.
A comparison of the population projections by sex and age groups in 2015 under the SSP2 scenario and the statistical population in 2015 is shown in Figure S2. Results show that the predicted population was higher than the statistical population for ages above 75 years and was lower than the statistical population in the other age groups, but the differences between the predicted and statistical populations for different age groups were not obvious. Table S9 shows the results of various error analysis indicators between the predicted and statistical values for 18 different age groups and sex. The R2 values for both men and women were nearly equal to 1. The values of RMSE and PBIAS for males were higher than those for females, but all of the values for both genders were quite low. Moreover, the values of NSE and NSR indicated “Very Good” performance. The results show that the accuracy of the prediction of population by gender and age groups was quite high.

3.4. Spatialization of Provincial Population Projections in SSPs

The spatialized population projections for China in 2050 and 2100 under the five SSPs are shown in Figures S3 and S5, respectively. The spatial distribution of population varied across the country, with the majority of the population concentrated in southern and eastern China, especially in the coastal regions, while the distribution in the northwest of the country was sparse. The variation is quite clear when comparing the two sides of the Hu line [50], an imaginary line that diagonally divides the area of China into two parts, stretching from the city of Heihe in Heilongjiang Province to Tengchong in Yunnan Province. It is also called the “geo-demographic demarcation line”; the west of the line occupies 56.2% of the area of China, but only 5.9% of the population, while the east of the line occupies 43.8% of the area, but 94.1% of the population. The difference in the spatial distribution of the population in these five scenarios in 2050 was not obvious. For the population distribution in 2100 (Figure 5), the population of Guangxi, Henan, Guizhou, and Hunan were much higher than the other four SSPs.
Figure 6 shows the RE values between the statistical population in 2015 at the county level and the predicted spatialized population in 2015 under SSP2, which has been summed up to the county level. Results show that the RE values of most counties (85%) were lower than 0.1, and those of a few counties (10%) were between 0.1 and 0.3, which indicate the accuracy in predicting the spatial distribution of the population. However, there were several areas with relatively high errors, such as Nima County in Tibet and Tengchong County in Yunnan, which may be attributed to the small statistical populations in these areas, a few absolute errors in predicting values may result in a relative high RE. The results of error analysis for different statistical indicators shown in Table S10 also indicate that the accuracy of spatialization is high.

4. Discussion

Forecasting population growth based on age, sex, and education as well as mapping the spatial distribution of projected populations, is essential for China to formulate effective planning and resource allocation measures. Using population data from the sixth national census of China in 2010, we provide detailed population projections according to age, sex, and education in 31 provinces as well as the spatially estimated population at a resolution of 1 km × 1 km of China annually during the period 2011–2100 under five different SSP scenarios. The trend of total population change under the five SSPs is similar to the projections from IIASA, which also indicate the highest value of population occurring around 2030 [8]. However, the peak value of each scenario in our study is higher than theirs, which may be attributed to the fact that the IIASA did not consider the latest two-child and third-child policies implemented in China. Therefore, the fertility rate set in our research is higher than IIASA. In addition, 2010 was selected as our research benchmark because the quality of life and medical standards of Chinese residents have rapidly improved, so it can better reflect the current increase in average life expectancy of residents, and therefore have a certain impact on population forecasts.
In this study, we have produced a set of high-quality, detailed forecasts at higher temporal and spatial resolution because the mean value of RE in national and provincial population projections is smaller and the RMSE for the spatialized population is more acceptable in our study compared with the previous research results in Chinese population projections [25,51]. Besides, to avoid accidental verification results, much statistical data for different years was used to verify the projection accuracy. More quantitative statistics, such as NSE, PBIAS, and RSR, which have been proved to be good indicators of the model evaluation, were also selected in our study [48]. The results of all error index statistics indicate our projections are reasonable and accurate.
There are also some limitations in our study. First, even though we have improved the accuracy of population forecasts in taking into account the impact of the most recent birth policy in China, there are still subjective factors in the population parameter settings, and the possible changes in population parameters during the 21st century are likely to lead to uncertainty in projection, which needs to be improved in further research. The base period 2010 was obtained from the sixth national census of China but it is well known that China conducted the seventh national census of China in 2020. However, the data for this have not yet been fully disclosed and so are currently insufficient to support our detailed projections. It is meaningful to adjust the base year and update the population projections when the latest data are available. Second, in the process of spatialization, the potential population migration which may be caused by the impact of climate change in the future has not been taken into consideration. It has been proved that climate change and extreme climate events have reduced the livability of some densely populated areas and are leading to potential immigrants in the future. A potential way to get a more nuanced understanding of population migration caused by the impact of climate change may be to develop a framework by integrating “bottom-up” insights related to place-based physical systems and social contexts, including potential adaptive responses [52]. Furthermore, the changing climate was projected, when including effects on immigration, to result in the displacement of human populations and lead to huge economic cost. A cost which would be different under different SSPs and therefore hard to currently quantify due to a lack of detailed data and mature methods. Future work can be conducted based on our localized and spatially explicit population projections, combined with probabilistic models and large empirical datasets to assess the social and economic cost of displacement from mere response to disaster displacement to proactively addressing vulnerability and exposure, thereby reducing displacement risk and lessening economic risk [53]. Overall, based on our existing research, more comprehensive and in-depth assessments of future population change, the driving factors of spatial demographic changes across multiple scales in different SSPs, and population risks can be conducted in further studies. Also, potential refinement and/or alternative downscaling methods could be attempted and applied in future population spatialization, such as the gravity-based downscaling model, the modified dasymetric mapping model, which may be helpful in decreasing the uncertainty in the results [29,54]. Despite the limitations discussed above, our projections represent a major step forward in precise structure and spatially explicit population under different scenarios. Our results can be used to support the identification and modeling of at-risk populations in environmental, epidemiological, climate or disaster management applications; in determining variables that favor future sustainability and resiliency including the drivers of climate change, the determinants of exposure and vulnerability to hazards, the inputs to spatial projections of land use, energy use, and emissions; and in assessing the impacts of extreme events, sea-level rise, and other climate-related outcomes.

5. Conclusions

This study described new national and provincial populations for China in the 21st century under five SSPs and by three dimensions: size, structure (age, sex, and education), and spatial distribution (1 km × 1 km). The results present a major step forward as compared with the earlier scenarios that only considered total population size and were insufficient in describing the spatial variation of the population at the subnational scale. Our spatially explicit projections of the population with dynamic change structures provide a much richer picture to capture the socioeconomic challenges to both climate change mitigation and adaptation. For example, spatial projections of the population could be used as one determinant of future projections of land cover, land use, food security, and spatial distributions of air pollutions. Furthermore, the population structure projections are useful in quantifying future vulnerability and risk to the population of being affected by diverse extreme climate events. Moreover, we set localized parameters according to the actual social and economic situation of different provinces in China, which could give reference for other countries in developing subnational population projections.
This study produces four key findings. Firstly, the change of population in China is various under different SSPs. The population under the SSP1, SSP2, SSP4, and SSP5 will reach their peaks around 2030 and range from 1.42 × 10⁹ to 1.46 × 10⁹ people. While the population in SSP3 will reach its peak in 2100 with 1.71 × 10⁹ people, which is 3.68 times that of 2100 under SSP4. The number of males is larger than that of females in all SSPs and their changing trends are similar to the total population of each SSP. Secondly, Guangdong, Henan, and Shandong are projected to be the most populous provinces in SSP1, SSP2, SSP4, and SSP5 among the 31 provinces in China, while in SSP3, Guangxi is the most populous province, reaching 1.54 × 10⁸ people, followed by Henan, Guizhou, Anhui, and Hunan. Most provinces have the highest population estimation under SSP3 due to the high fertility rate except for Beijing, Shanghai, Tianjin, and Zhejiang, whose largest population is projected to appear in SSP5. Thirdly, sex structure was similar under the five SSPs with the passage of time, while the difference of age structure and education level among the five SSPs in 2100 is much more obvious than that in 2050, educational attainment is highest in SSP1 and SSP5 and lowest in SSP3. In 2100, the age structure for SSP1, SSP4, and SSP5 show an “Inverted triangle”, SSP3 showed “pyramid-shaped”, while SSP2 maintains the current level of socioeconomic development, and the distribution of all age groups is balanced. Fourthly, the spatial variation for the Chinese population is quite clear, with the majority of the population concentrated in southern and eastern China, especially in the coastal regions, while the distribution in the northwest is sparse. For population distribution in 2100, the population of Guangxi, Henan, Guizhou, and Hunan are much higher than the other four SSPs. Our results may strengthen the assessment of demographic, socioeconomic, and environmental outcomes, especially those related to climate change mitigation and adaptation.
There are also some uncertainty and limitations that exist in this study. For example, the selection of base period and data source, the setting of population parameters, and the usage of the spatial downscaling model. These subjective factors could not be completely eliminated in future population projections. However, more efforts could be taken to overcome them in future studies, such as by applying the latest available statistical data as the base year, reflecting the new birth policy change in the setting of population parameters, and incorporating more spatial downscaling models, which will be helpful to further decrease uncertainty and improve the credibility of projections.

Supplementary Materials

The following supporting information can be downloaded at: https://www.mdpi.com/article/10.3390/su14042442/s1, Figure S1: Comparison of the population projections for China in the SSP2 scenario and the statistical values of the total population: (a) 2011; (b) 2015; (c) 2018; Figure S2: Comparison of population projections of 18 age groups in China in 2015 in the SSP2 scenario and in the statistical data: (a) men; (b) women. Figure S3: Spatial distribution of population projections for China in 2050 under the five shared socioeconomic pathways (SSPs): (a) SSP1; (b) SSP2; (c) SSP3; (d) SSP4; (e) SSP5; Table S1: Total fertility rate of China under different assumptions during 2011–2050. Table S2:Low assumption: Fertility rate of women of childbearing age by age group (‰). Table S3: Medium assumption: Fertility rate of women of childbearing age by age group (‰). Table S4: High assumption: Fertility rate of women of childbearing age by age group (‰). Table S5: Provinces grouping with different educational attainment. Table S6: Evaluation of total population errors during 2011–2019. Table S7: Correlation between the statistical evaluation indicators of the predicted and statistical total populations during 2011–2019. Table S8: Statistical evaluation indicators of provincial population in 2011, 2015, and 2018. Table S9: Statistical evaluation indicators of 18 different age groups and two genders in the population of China in 2015. Table S10: Values of the statistical evaluation indicators at the county level following spatialization.

Author Contributions

Conceptualization, J.C. and Y.L. (Yujie Liu); formal analysis, J.C. and E.Z.; funding acquisition, Y.L. (Yujie Liu); methodology, J.C. and Y.L. (Yujie Liu); project administration, Y.L. (Yujie Liu); resources, Y.L. (Yujie Liu); supervision, Y.L. (Yujie Liu), T.P. and Y.L. (Yanhua Liu); writing—original draft, J.C. and E.Z.; writing—review & editing, J.C., Y.L. (Yujie Liu) and T.P. All authors have read and agreed to the published version of the manuscript.

Funding

This research was funded by the Strategic Priority Research Program of the Chinese Academy of Sciences, grant number XDA28060200, the National Natural Science Foundation of China for Excellent Young Scholars, grant number 42122003, and the Youth Innovation Promotion Association, Chinese Academy of Sciences, grant number Y202016.

Data Availability Statement

The population data of the sixth national census of China are available online (http://www.stats.gov.cn/english/ (accessed on 19 January 2022)).

Conflicts of Interest

The authors declare no conflict of interest.

References

  1. IPCC. Climate Change 2013: The physical science basis. In Contribution of Working Group I to the 5th Assessment Report of the Intergovernmental Panel on Climate Change; Stocker, T.F., Qin, D.H., Plattner, G.K., Tignor, M., Eds.; Cambridge University Press: Cambridge, UK; New York, NY, USA, 2013. [Google Scholar]
  2. Diaz, D.; Moore, F. Quantifying the economic risks of climate change. Nat. Clim. Chang. 2017, 7, 774–782. [Google Scholar] [CrossRef]
  3. Forzieri, G.; Cescatti, A.; e Silva, F.B.; Feyen, L. Increasing risk over time of weather-related hazards to the European population: A data-driven prognostic study. Lancet Planet. Health 2017, 1, e200–e208. [Google Scholar] [CrossRef]
  4. Min, S.-K.; Zhang, X.; Zwiers, F.W.; Hegerl, G.C. Human contribution to more-intense precipitation extremes. Nature 2011, 470, 378–381. [Google Scholar] [CrossRef] [PubMed]
  5. Shang, J.; Li, P.; Li, L.; Chen, Y. The relationship between population growth and capital allocation in urbanization. Technol. Forecast. Soc. Chang. 2018, 135, 249–256. [Google Scholar] [CrossRef]
  6. Brown, T.C.; Mahat, V.; Ramirez, J.A. Adaptation to Future Water Shortages in the United States Caused by Population Growth and Climate Change. Earth Future 2019, 7, 219–234. [Google Scholar] [CrossRef] [Green Version]
  7. Huang, J.; Qin, D.; Jiang, T.; Wang, Y.; Feng, Z.; Zhai, J.; Cao, L.; Chao, Q.; Xu, X.; Wang, G.; et al. Effect of Fertility Policy Changes on the Population Structure and Economy of China: From the Perspective of the Shared Socioeconomic Pathways. Earth Future 2019, 7, 250–265. [Google Scholar] [CrossRef]
  8. Kc, S.; Lutz, W. The human core of the shared socioeconomic pathways: Population scenarios by age, sex and level of education for all countries to 2100. Glob. Environ. Chang. 2017, 42, 181–192. [Google Scholar] [CrossRef] [Green Version]
  9. Jiang, L.; O’Neill, B.C. Global urbanization projections for the Shared Socioeconomic Pathways. Glob. Environ. Chang. 2017, 42, 193–199. [Google Scholar] [CrossRef] [Green Version]
  10. Chen, J.; Liu, Y.; Pan, T.; Ciais, P.; Ma, T.; Liu, Y.; Yamazaki, D.; Ge, Q.; Peñuelas, J. Global socioeconomic exposure of heat extremes under climate change. J. Clean. Prod. 2020, 277, 123275. [Google Scholar] [CrossRef]
  11. Liu, Y.; Chen, J. Future global socioeconomic risk to droughts based on estimates of hazard, exposure, and vulnerability in a changing climate. Sci. Total. Environ. 2021, 751, 142159. [Google Scholar] [CrossRef]
  12. IPCC. Part A: Global and Sectoral Aspects. Contribution of Working Group II to the Fifth Assessment Report of the Intergovernmental Panel on Climate Change. In Climate Change 2014: Impacts, Adaptation, and Vulnerability; Cambridge University Press: Cambridge, UK; New York, NY, USA, 2014. [Google Scholar]
  13. Gerland, P.; Raftery, A.E.; Ševčíková, H.; Li, N.; Gu, D.; Spoorenberg, T.; Alkema, L.; Fosdick, B.K.; Chunn, J.; Lalic, N.; et al. World population stabilization unlikely this century. Science 2014, 346, 234–237. [Google Scholar] [CrossRef] [Green Version]
  14. Lutz, W.; Kc, S. Global Human Capital: Integrating Education and Population. Science 2011, 333, 587–592. [Google Scholar] [CrossRef] [PubMed] [Green Version]
  15. United Nations. Transforming Our World: The 2030 Agenda for Sustainable Development. Available online: https://www.un.org/development/desa/socialperspectiveondevelopment/2015/08/26/transforming-our-world-the-2030-agenda-for-sustainable-development/ (accessed on 19 January 2022).
  16. Soergel, B.; Kriegler, E.; Weindl, I.; Rauner, S.; Dirnaichner, A.; Ruhe, C.; Hofmann, M.; Bauer, N.; Bertram, C.; Bodirsky, B.L.; et al. A sustainable development pathway for climate action within the UN 2030 Agenda. Nat. Clim. Chang. 2021, 11, 656–664. [Google Scholar] [CrossRef]
  17. van Vuuren, D.; Riahi, K.; Moss, R.; Edmonds, J.; Thomson, A.; Nakicenovic, N.; Kram, T.; Berkhout, F.; Swart, R.; Janetos, A.; et al. A proposal for a new scenario framework to support research and assessment in different climate research communities. Glob. Environ. Chang. 2012, 22, 21–35. [Google Scholar] [CrossRef] [Green Version]
  18. O’Neill, B.C.; Kriegler, E.; Riahi, K.; Ebi, K.L.; Hallegatte, S.; Carter, T.R.; Mathur, R.; van Vuuren, D. A new scenario framework for climate change research: The concept of shared socioeconomic pathways. Clim. Chang. 2014, 122, 387–400. [Google Scholar] [CrossRef] [Green Version]
  19. Riahi, K.; Van Vuuren, D.P.; Kriegler, E.; Edmonds, J.; O’Neill, B.C.; Fujimori, S.; Bauer, N.; Calvin, K.; Dellink, R.; Fricko, O.; et al. The Shared Socioeconomic Pathways and their energy, land use, and greenhouse gas emissions implications: An overview. Glob. Environ. Chang. Hum. Policy Dimens. 2017, 42, 153–168. [Google Scholar] [CrossRef] [Green Version]
  20. Jiang, L. Internal consistency of demographic assumptions in the shared socioeconomic pathways. Popul. Environ. 2014, 35, 261–285. [Google Scholar] [CrossRef] [Green Version]
  21. Lutz, W.; Butz, W.P.; KC, S. World Population and Human Capital in the Twenty-First Century; Oxford University Press: Oxford, UK, 2014. [Google Scholar]
  22. United-Nations. World Population Prospect: The 2010 Revision; United Nations: New York, NY, USA, 2012. [Google Scholar]
  23. Chi, G. Can knowledge improve population forecasts at subcounty levels? Demography 2009, 46, 405–427. [Google Scholar] [CrossRef] [PubMed]
  24. Raymer, J.; Abel, G.J.; Rogers, A. Does Specification Matter? Experiments with Simple Multiregional Probabilistic Population Projections. Environ. Plan. A Econ. Space 2012, 44, 2664–2686. [Google Scholar] [CrossRef] [Green Version]
  25. Gaughan, A.E.; Stevens, F.R.; Huang, Z.; Nieves, J.J.; Sorichetta, A.; Lai, S.; Ye, X.; Linard, C.; Hornby, G.M.; Hay, S.I.; et al. Spatiotemporal patterns of population in mainland China, 1990 to 2010. Sci. Data 2016, 3, 160005. [Google Scholar] [CrossRef] [PubMed]
  26. Zeng, C.; Zhou, Y.; Wang, S.; Yan, F.; Zhao, Q. Population spatialization in China based on night-time imagery and land use data. Int. J. Remote Sens. 2011, 32, 9599–9620. [Google Scholar] [CrossRef]
  27. Hachadoorian, L.; Gaffin, S.R.; Engelman, R. Projecting a Gridded Population of the World Using Ratio Methods of Trend Extrapolation. In Ecological Studies; Springer: Berlin/Heidelberg, Germany, 2011; pp. 13–25. [Google Scholar]
  28. Jones, B.; O’Neill, B.C. Spatially explicit global population scenarios consistent with the Shared Socioeconomic Pathways. Environ. Res. Lett. 2016, 11, 084003. [Google Scholar] [CrossRef]
  29. Murakami, D.; Yamagata, Y. Estimation of Gridded Population and GDP Scenarios with Spatially Explicit Statistical Downscaling. Sustainability 2019, 11, 2106. [Google Scholar] [CrossRef] [Green Version]
  30. Cao, G.-Y.; Lutz, W.; Lutz, W. China’s future urban and rural population by level of education. In The End of World Population Growth in the 21st Century: New Challenges for Human Capital Formation and Sustainable Development; Earthscan: London, UK, 2004. [Google Scholar]
  31. Lutz, W. Population-Development-Environment: Understanding Their Interactions in Mauritiusby Wolfgang Lutz. Population 1995, 50, 525–526. [Google Scholar] [CrossRef] [Green Version]
  32. Cuaresma, J.C. Income projections for climate change research: A framework based on human capital dynamics. Glob. Environ. Chang. 2017, 42, 226–236. [Google Scholar] [CrossRef] [Green Version]
  33. Samir, K.C.; Lutz, W. Demographic scenarios by age, sex and education corresponding to the SSP narratives. Popul. Environ. 2014, 35, 243–260. [Google Scholar] [CrossRef]
  34. Qi, M.D.; Dai, M.Y.; Zheng, Y.Y. Discuss the impact and tendency of the Universal Two-child Policy on China’s birth rate fluctuation. China Popul. Resour. Environ. 2016, 26, 1–10. [Google Scholar] [CrossRef]
  35. Wang, J.; Wang, G.Z. Measurement and analysis of the family poverty-stricken covered areas. Chin. J. Popul. Sci. 2013, 4, 26–35. [Google Scholar]
  36. Zhuang, Y.; Yu, J.; Wang, Z.; Li, C.; Qi, J.; Hui, W.; Min, Q. Fertility Intention of Rural and Urban Residents in China: Results from the 2013 National Fertility Intention Survey. Popul. Res. 2014, 38, 3–13. [Google Scholar]
  37. Wang, G. Rethinking the problems in the research of China’s family planning policy adjustment. Chin. J. Popul. Sci. 2015, 2, 126. [Google Scholar]
  38. Group NPDSR. Research Report on National Population Development Strategy; China Population Press: Beijing, China, 2007. [Google Scholar]
  39. Zhai, Z.W.; Li, L.; Chen, J.J. The impact of the two child policy on China’s population in the future. Dongyue Trib. 2016, 37, 77–88. [Google Scholar]
  40. Fuchs, R.; Goujon, A.; Beguy, D.; Casterline, J.; Castro-Martin, T.; Courbage, Y.; Yepez-Martinez, B. Future fertility in low fertility countries. In World Population and Human Capital in the Twenty-First Century; Oxford University Press: New York, NY, USA, 2014; Volume 39, pp. 39–146. [Google Scholar]
  41. Goujon, A.; Fuchs, R. The Future Fertility of High Fertility Countries: A Model Incorporating Expert Arguments; IIASA: Laxenburg, Austria, 2013. [Google Scholar]
  42. Tong, J.; Jing, Z.; Cheng, J.; Lige, C.; Yanjun, W.; Hemin, S.; Anqian, W.; Jinlong, H.; Buda, S.; Run, W. National and Provincial Population Projected to 2100 under the Shared Socioeconomic Pathways in China. Clim. Chang. Res. 2017, 13, 128–137. (In Chinese) [Google Scholar] [CrossRef]
  43. Caselli, G.; Drefahl, S.; Luy, M.; Wegner-Siegmundt, C.; Guillot, M.; Meslé, F.; Robles, A.; Rogers, R.G.; Tu, E.J.-C.; Zhao, Z. Future Mortality in Low-Mortality Countries. Inst. für Demogr.-VID 2021, 1, 1–50. [Google Scholar] [CrossRef]
  44. Potančoková, M.; Bauer, R.; Goujon, A.; Striessnig, E. Summary of Data, Assumptions and Methods for New Wittgenstein Centre for Demography and Global Human Capital (WIC) Population Projections by Age, Sex and Level of Education for 195 Countries to 2100; IIASA: Laxenburg, Austria, 2013. [Google Scholar]
  45. Abel, G.J. Estimating global migration flow tables using place of birth data. Demogr. Res. 2013, 28, 505–546. [Google Scholar] [CrossRef] [Green Version]
  46. Goujon, A.; Samir, K.C. The past and future of human capital in south-east asia. Asian Popul. Stud. 2008, 4, 31–56. [Google Scholar] [CrossRef]
  47. Xu, X. Chinese Population Spatial Distribution Kilometer Grid Dataset. 2017. Available online: https://www.resdc.cn/DOI/DOI.aspx?DOIid=32 (accessed on 19 January 2022).
  48. Moriasi, D.N.; Arnold, J.G.; Van Liew, M.W.; Bingner, R.L.; Harmel, R.D.; Veith, T.L. Model Evaluation Guidelines for Systematic Quantification of Accuracy in Watershed Simulations. Trans. Am. Soc. Agric. Biol. Eng. 2007, 50, 885–900. [Google Scholar] [CrossRef]
  49. Smith, S.K.; Tayman, J.; Swanson, D.A. State and Local Population Projections: Methodology and Analysis. Duke University: Durham, NC, USA, 2001. [Google Scholar]
  50. Hu, H.Y. The distribution of China’s Population. Acta Geogr. Sin. 1935, 2, 33–74. [Google Scholar]
  51. Chen, Y.; Guo, F.; Wang, J.; Cai, W.; Wang, C.; Wang, K. Provincial and gridded population projection for China under shared socioeconomic pathways from 2010 to 2100. Sci. Data 2020, 7, 83. [Google Scholar] [CrossRef] [Green Version]
  52. Horton, R.M.; de Sherbinin, A.; Wrathall, D.; Oppenheimer, M. Assessing human habitability and migration. Science 2021, 372, 1279–1283. [Google Scholar] [CrossRef]
  53. Desai, B.; Bresch, D.N.; Cazabat, C.; Hochrainer-Stigler, S.; Mechler, R.; Ponserre, S.; Schewe, J. Addressing the human cost in a changing climate. Science 2021, 372, 1284–1287. [Google Scholar] [CrossRef]
  54. Jones, B.; O’Neill, B.C. Historically grounded spatial population projections for the continental United States. Environ. Res. Lett. 2013, 8, 044021. [Google Scholar] [CrossRef] [Green Version]
Figure 1. The total population in China from 2010 to 2100 under five shared socioeconomic pathways (SSPs).
Sustainability 14 02442 g001
Figure 2. Total population of 31 provinces in China under five shared socioeconomic pathways (SSPs) in 2100.
Sustainability 14 02442 g002
Figure 3. Population structure by age, sex, and education level in China under the five shared socioeconomic pathways (SSPs) in 2050.
Sustainability 14 02442 g003
Figure 4. Population structure by age, sex, and education level in China under the five shared socioeconomic pathways (SSPs) in 2100.
Sustainability 14 02442 g004
Figure 5. Spatial distribution of population projections for China in 2100 under the five shared socioeconomic pathways (SSPs): (a) SSP1; (b) SSP2; (c) SSP3; (d) SSP4; (e) SSP5 (blue line is the Hu Line, an imaginary line that diagonally divides the area of China into two parts, stretching from the city of Heihe in Heilongjiang Province to Tengchong in Yunnan Province, which is also called the “geo-demographic demarcation line”).
Sustainability 14 02442 g005
Figure 6. Spatial distribution of relative error (RE) values of the spatialized grid population projections in the SSP2 scenario and the statistical values for China in 2015.
Sustainability 14 02442 g006
Table 1. Assumptions of the population under the five SSPs in China.
Population ParametersSSP1SSP2SSP3SSP4SSP5
FertilityLowMediumHighLowLow
MortalityLowMediumHighMediumLow
MigrationMediumMediumLowMediumHigh
EducationHighMediumLowLow/Middle/HighHigh
Publisher’s Note: MDPI stays neutral with regard to jurisdictional claims in published maps and institutional affiliations.

