
Optimal Process Network for Integrated Solid Waste Management in Davao City, Philippines


Abstract
:1. Introduction
2. Materials and Methods
2.1. Study Area
2.2. Methodology
2.2.1. MFA
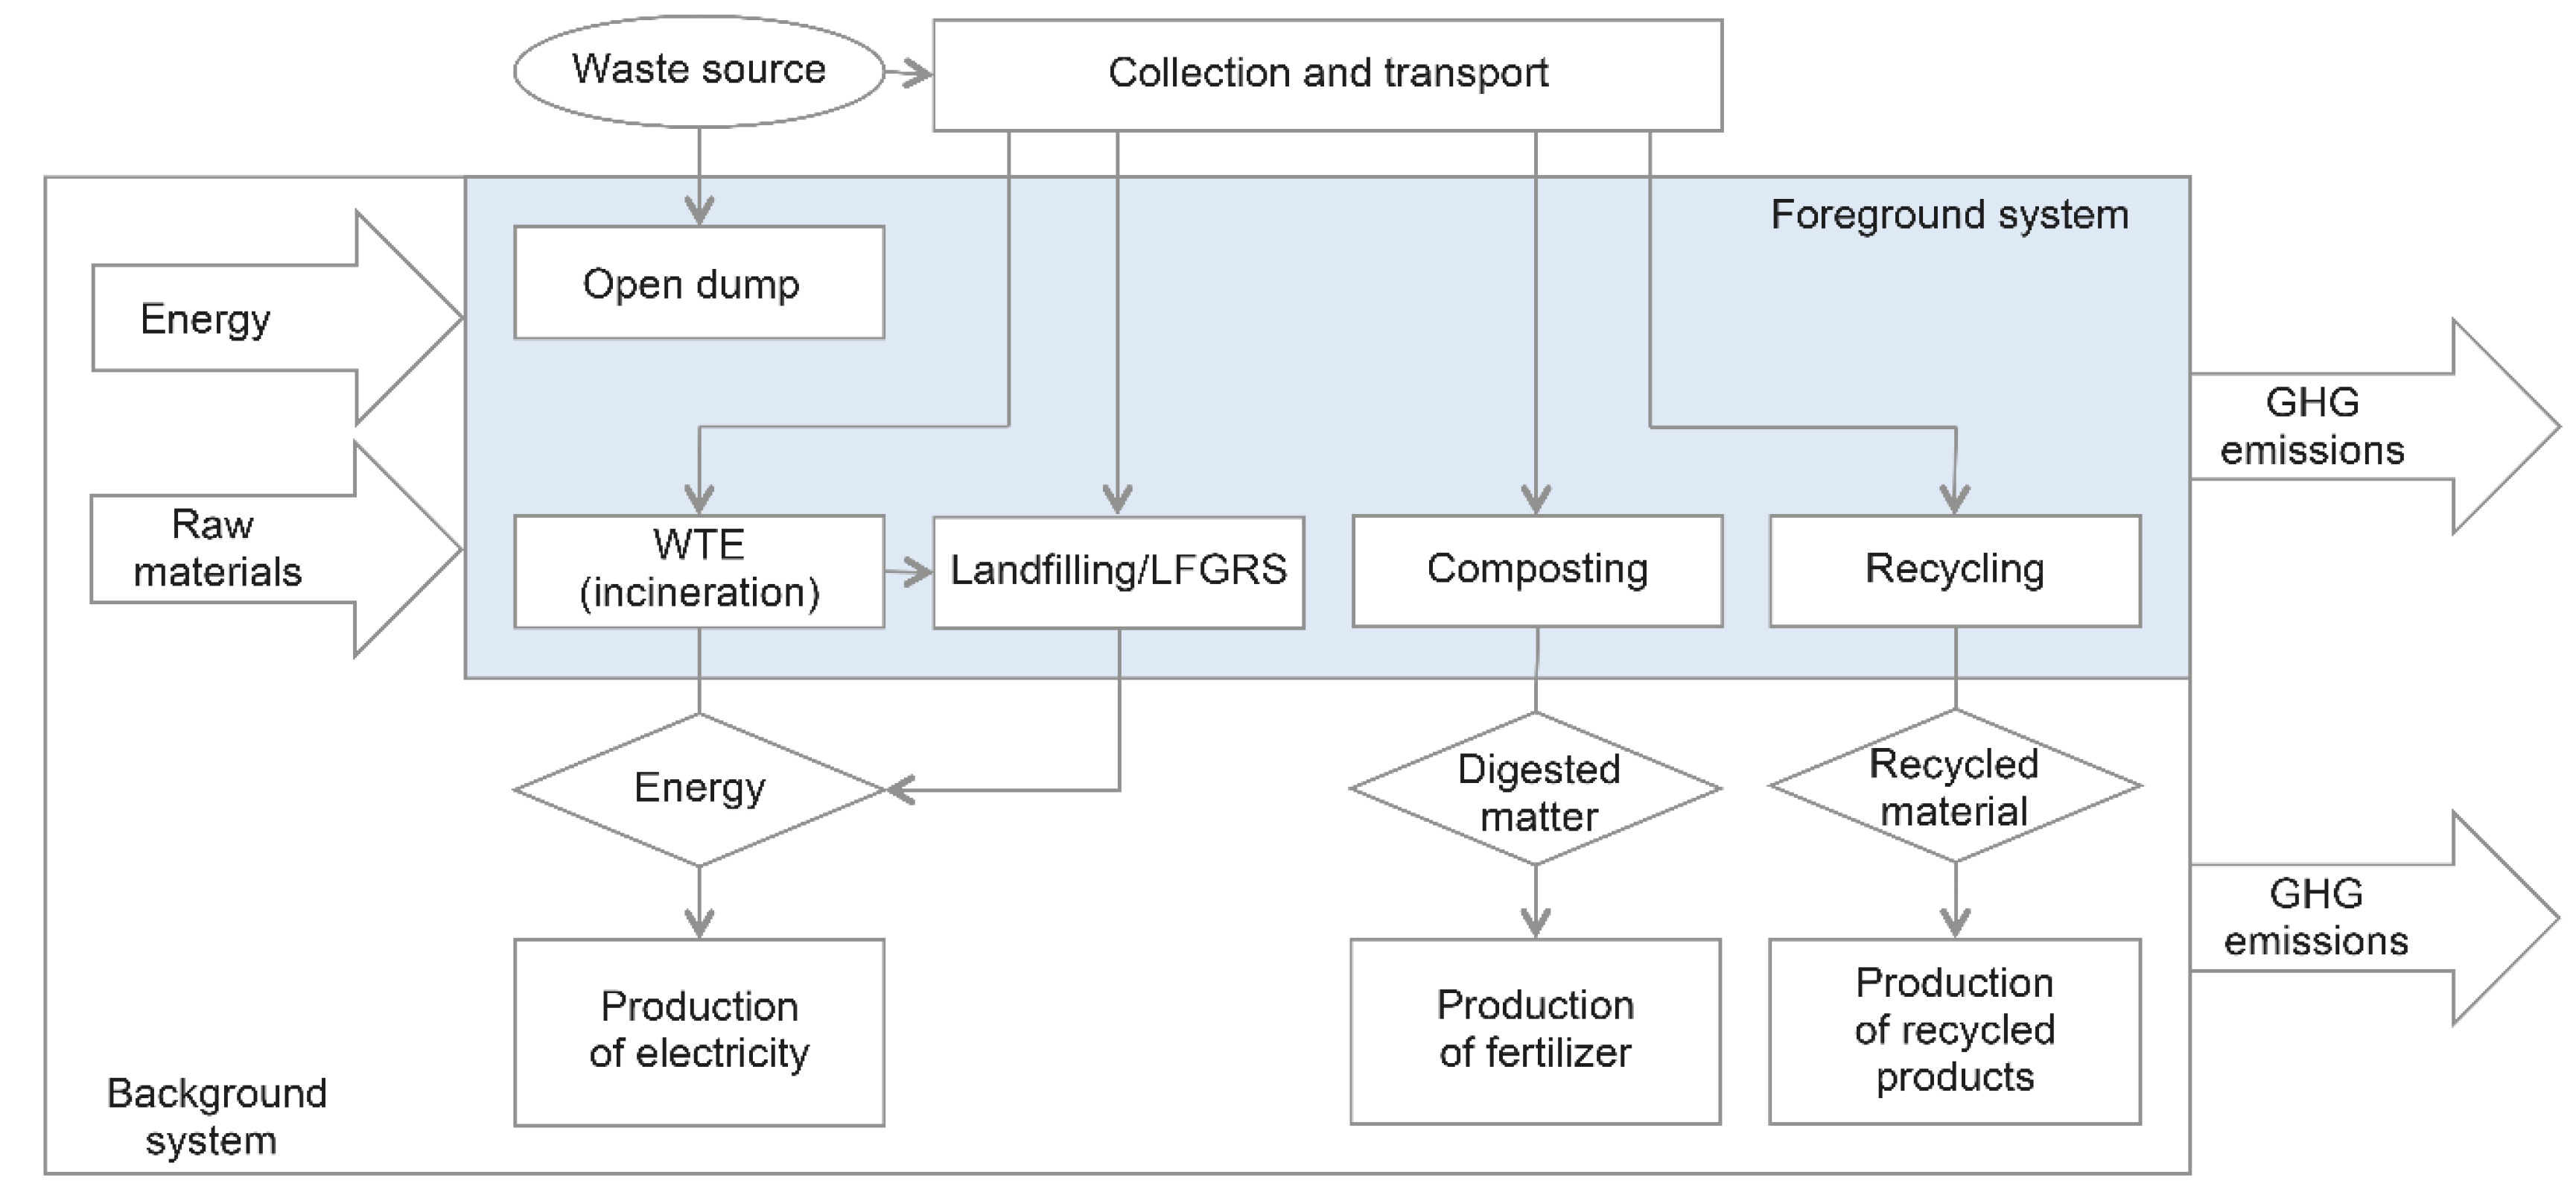
2.2.2. LCA
2.2.3. LP Optimization
2.3. Description of Alternative Scenarios
2.3.1. Examining the Effectiveness of Additional Treatment and Disposal Methods, and Source-Separated Collection
2.3.2. Establishing an Environmentally Friendly Future MSWM System
2.3.3. Examining the Effectiveness of Waste Separation
2.4. Sensitivity Analysis
3. Results and Discussion
3.1. MFA of Current and Future Scenarios
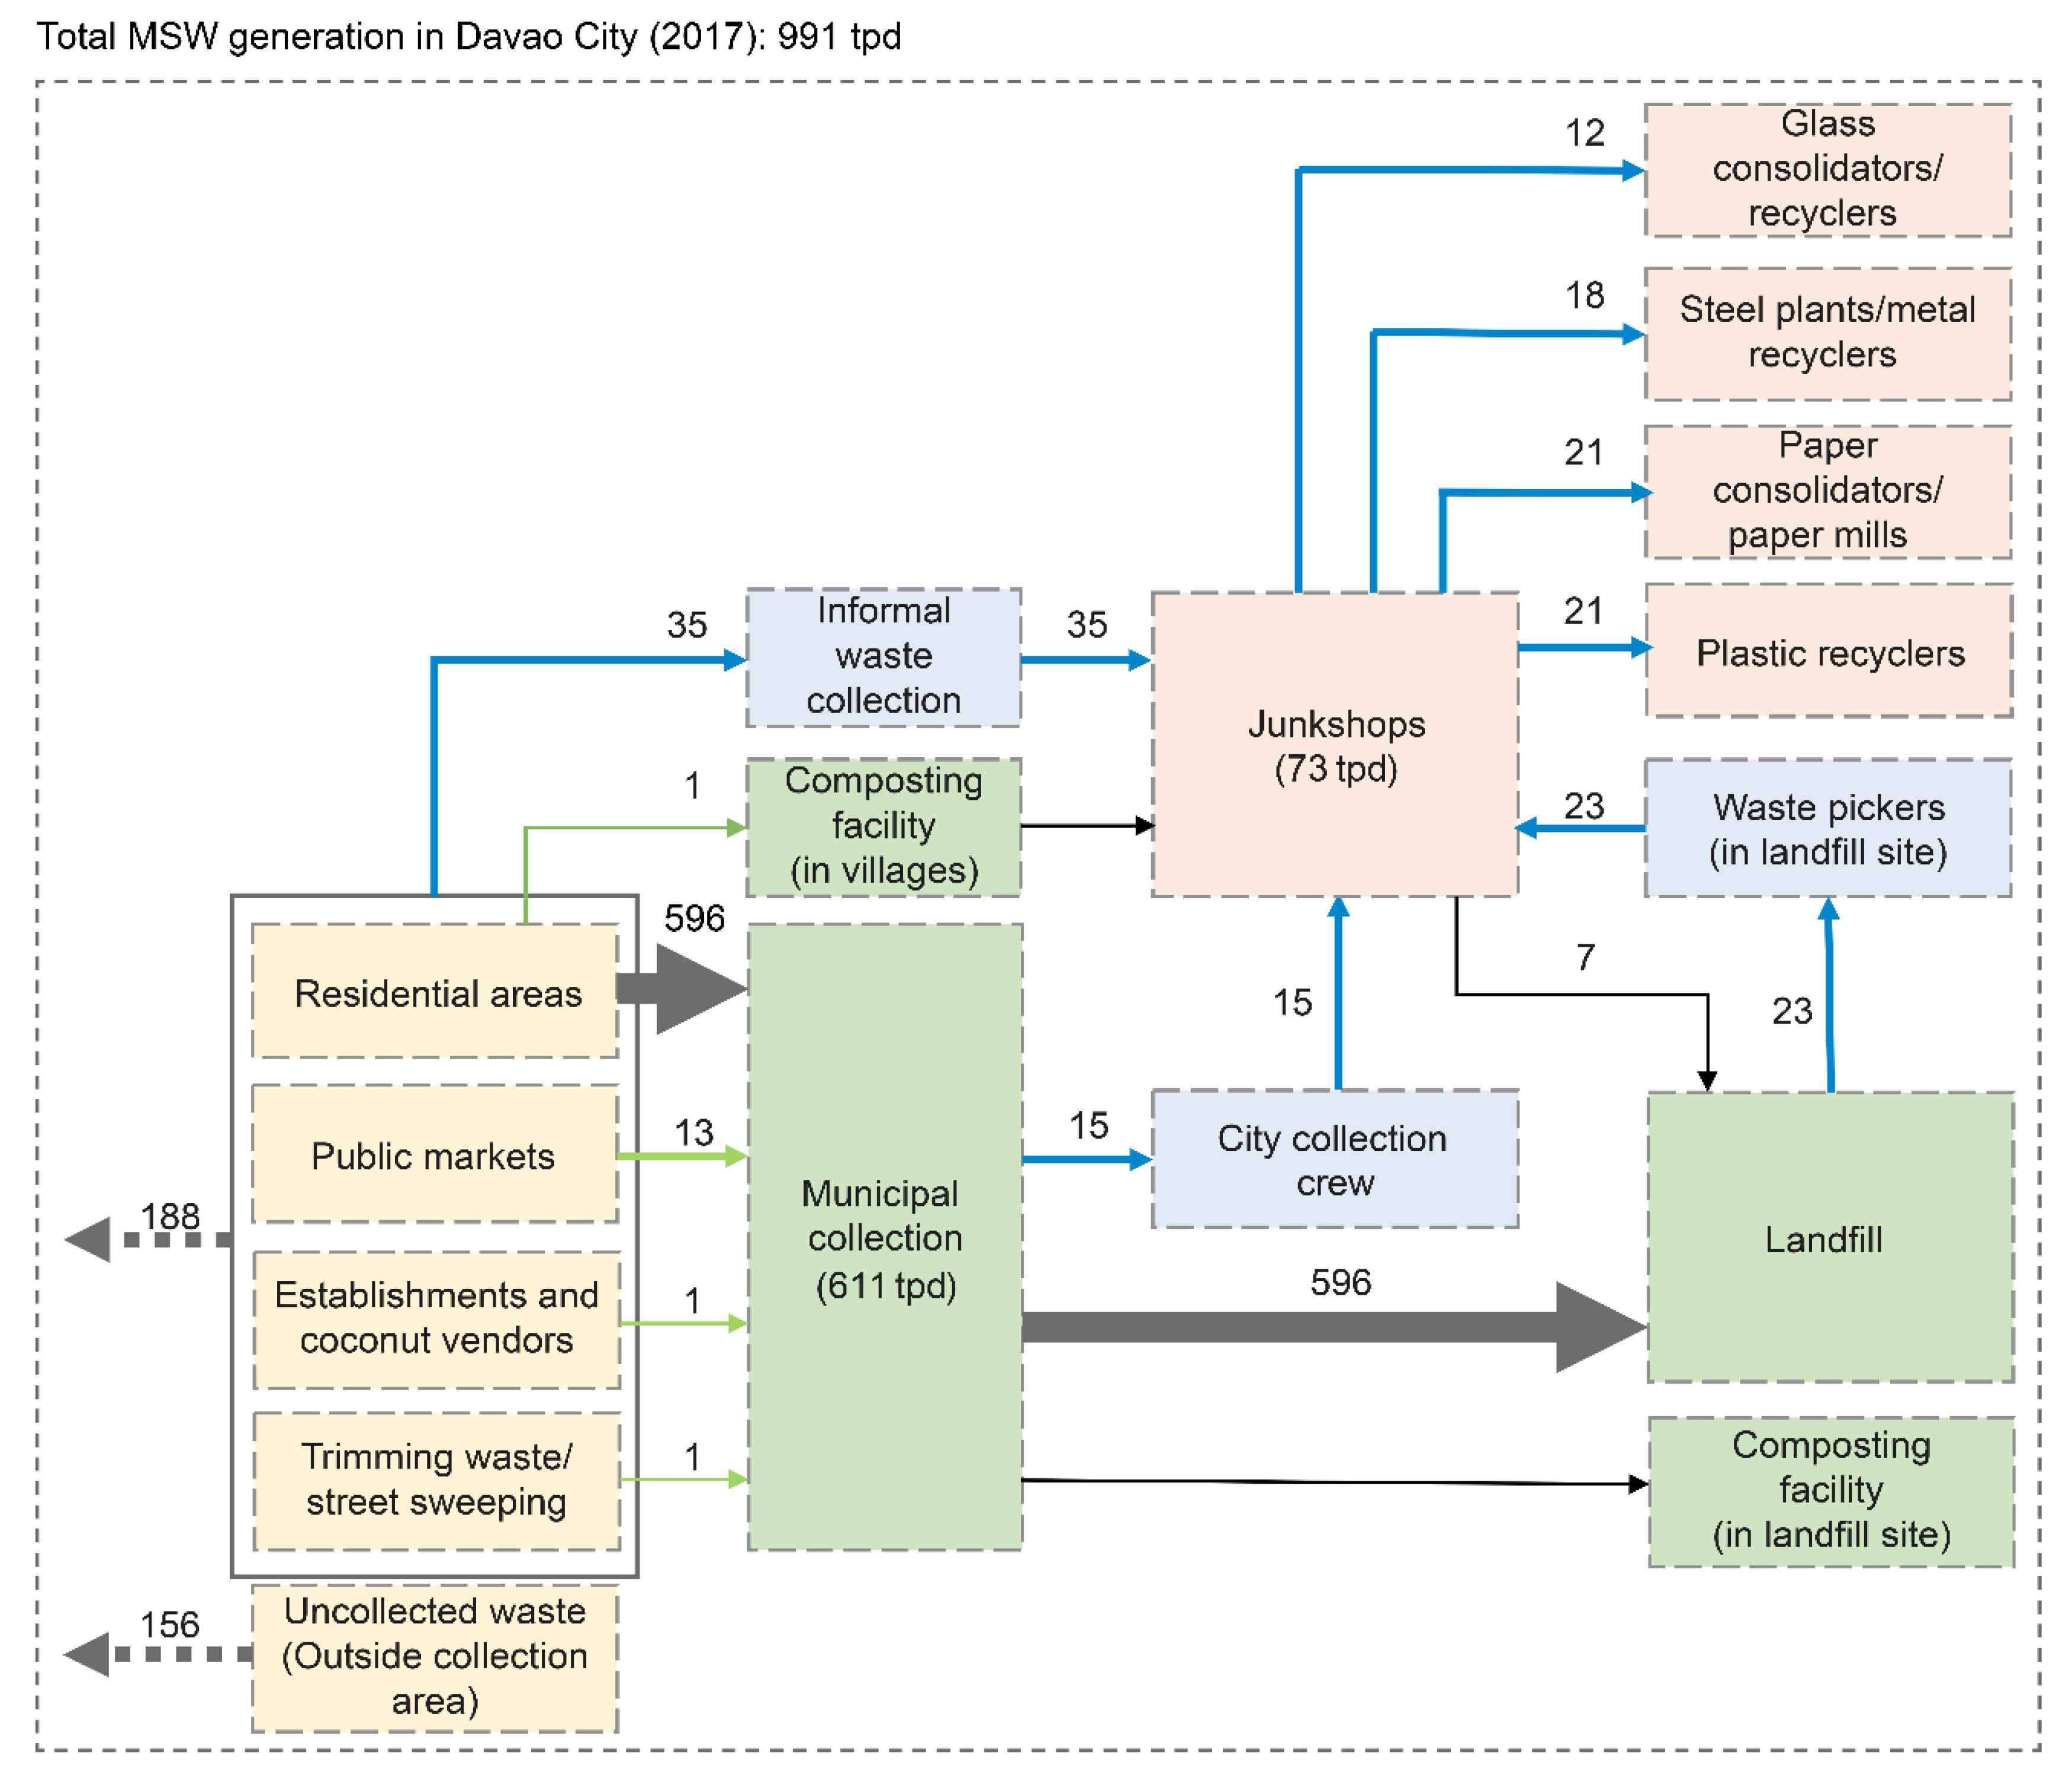
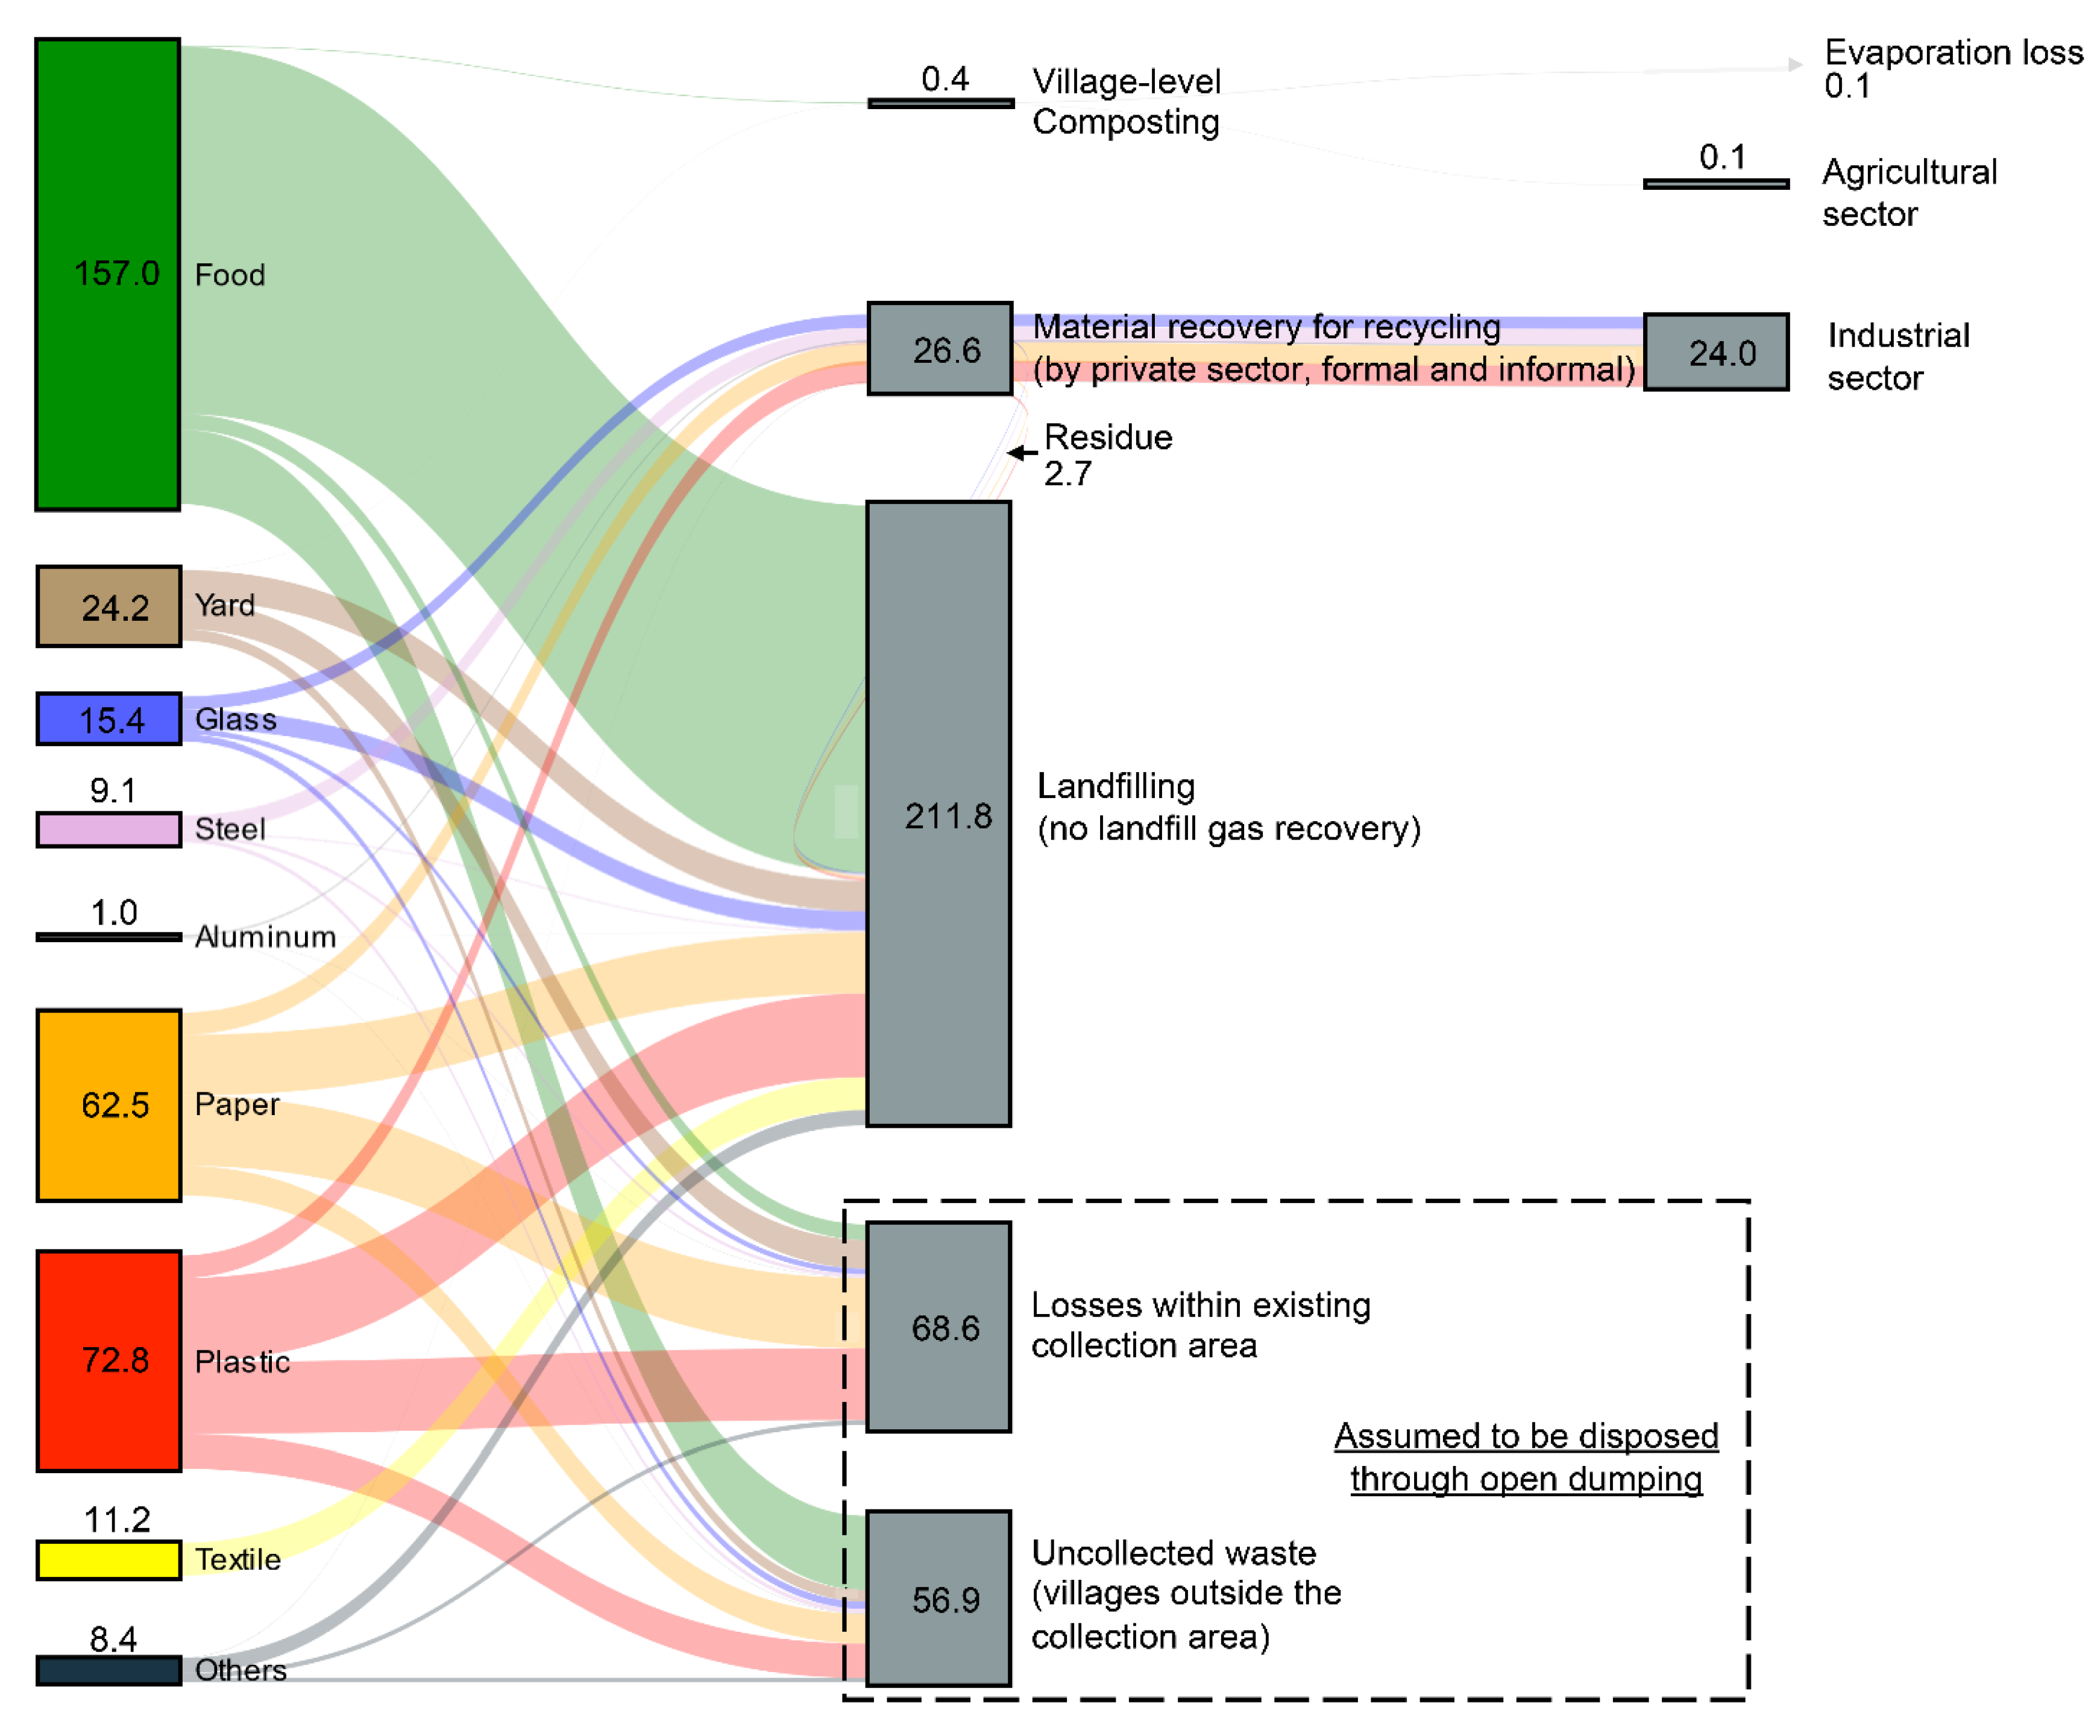
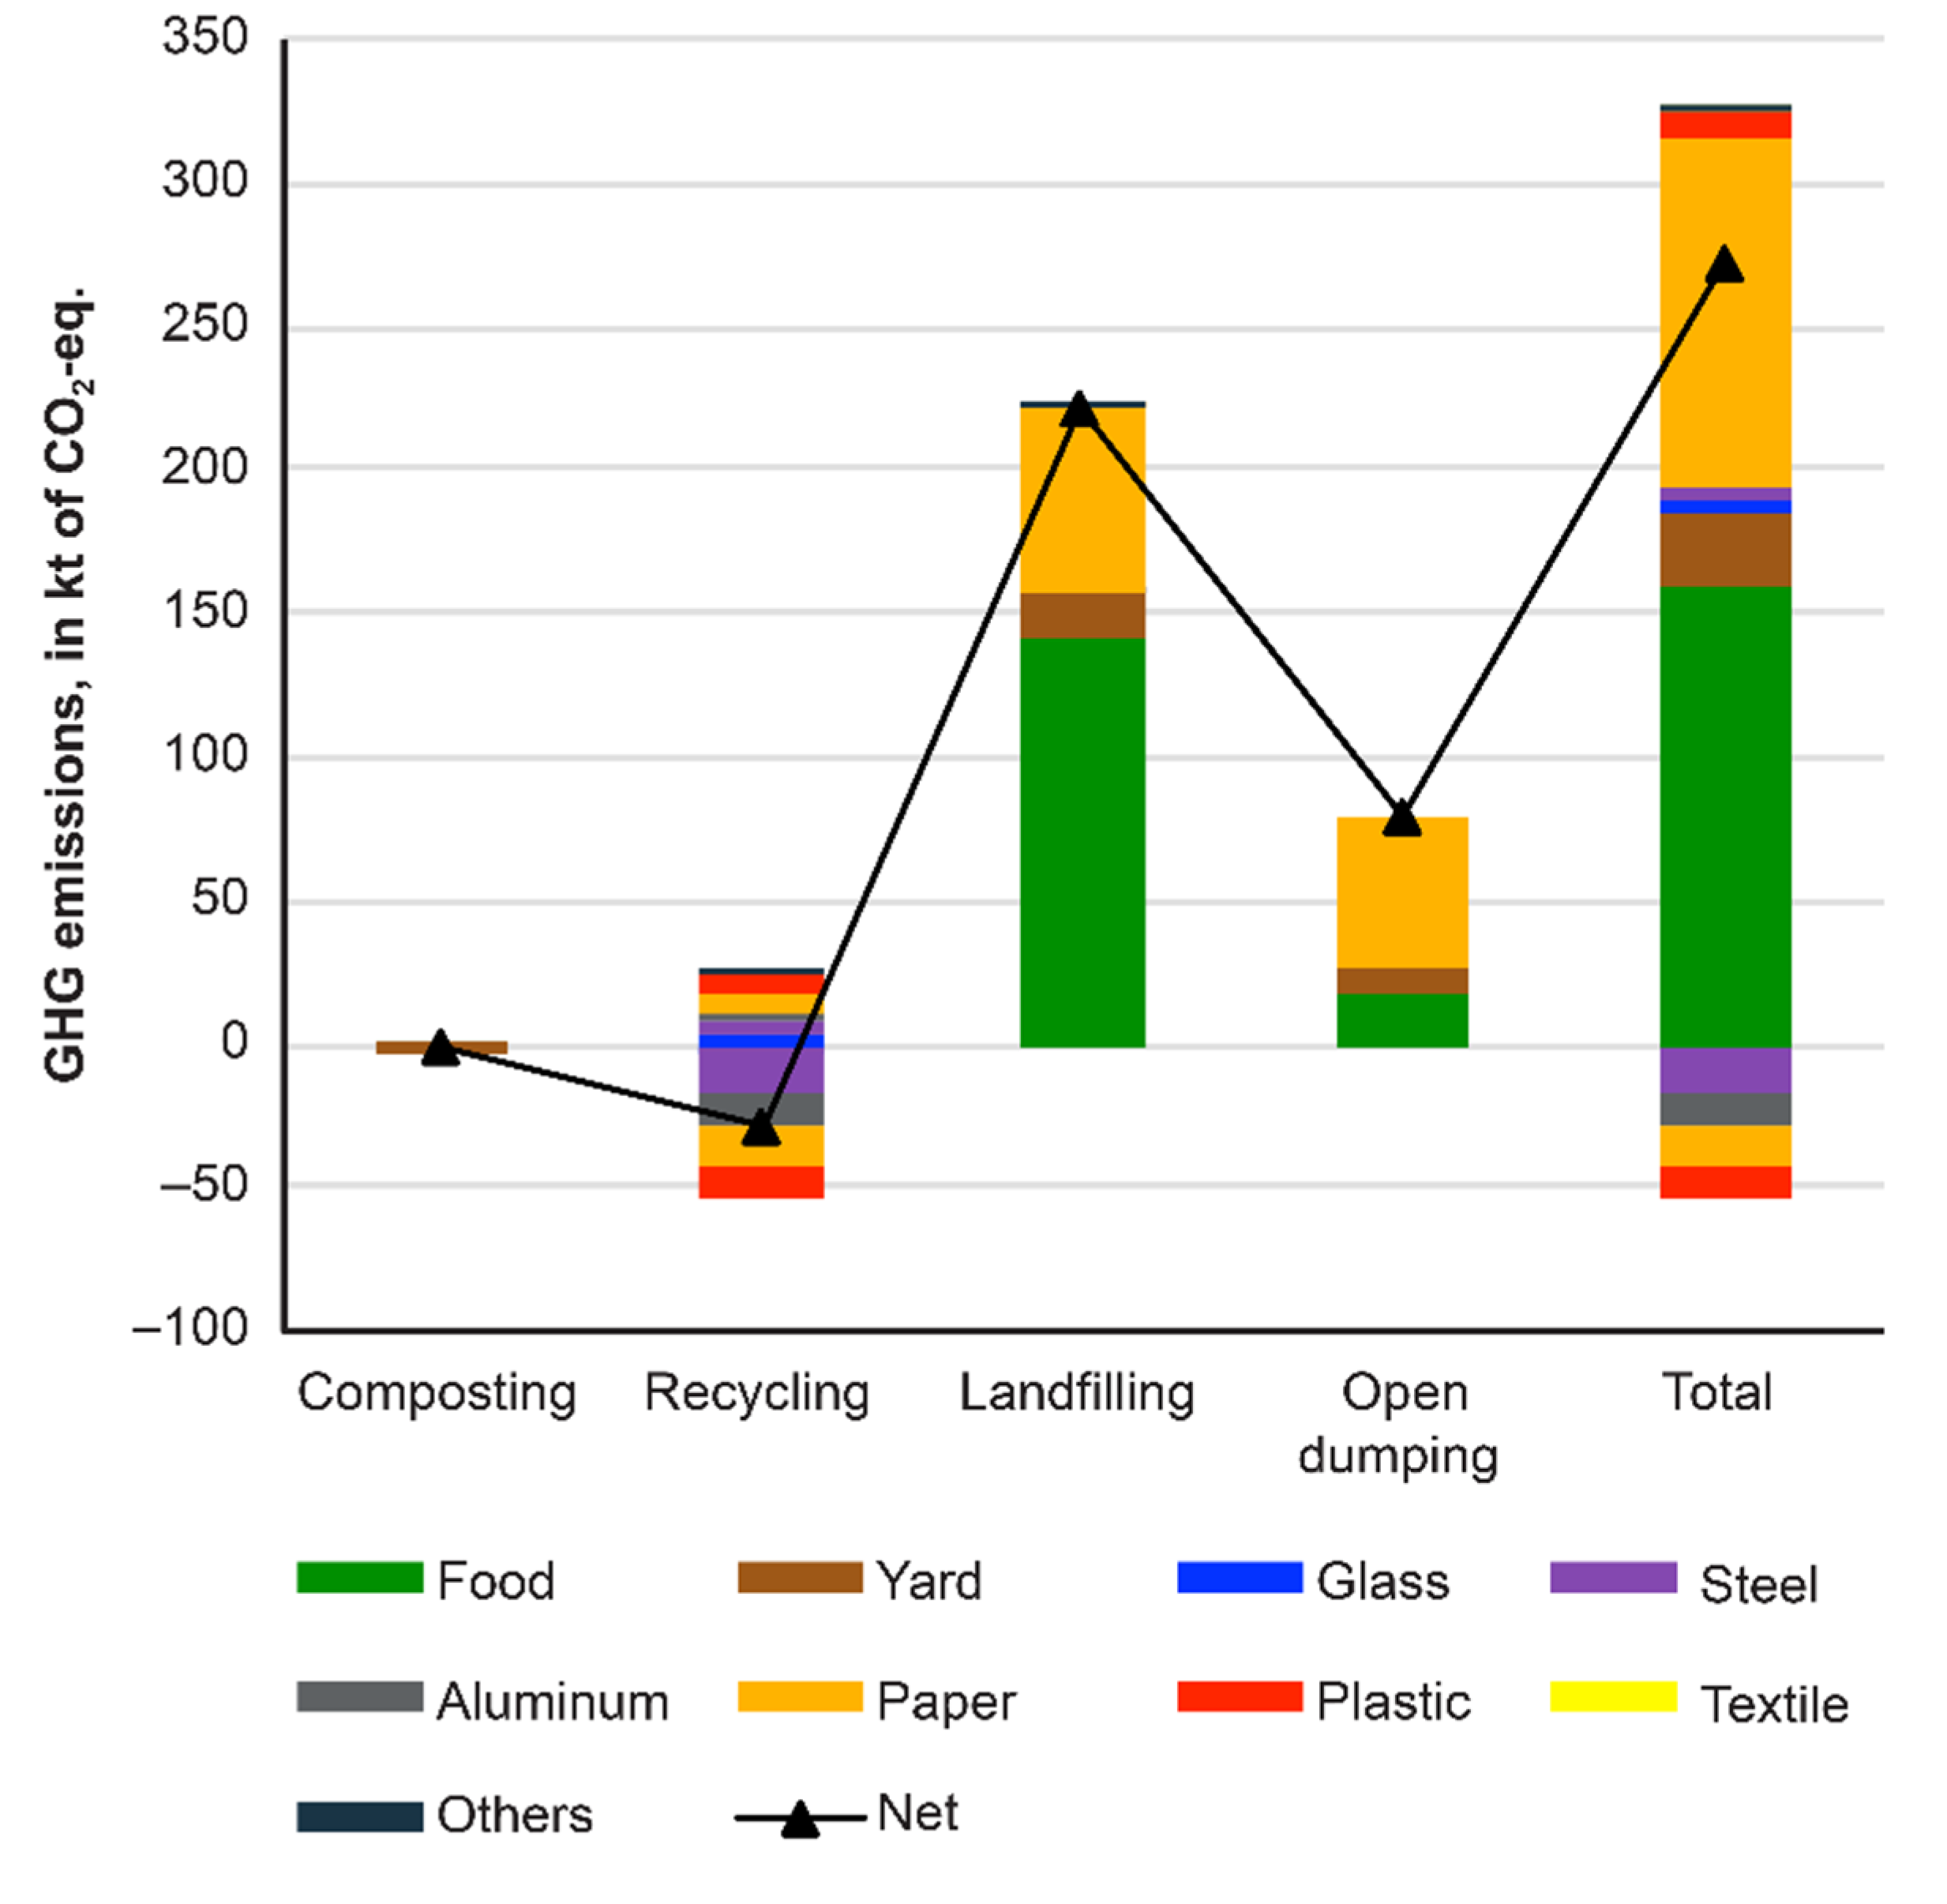
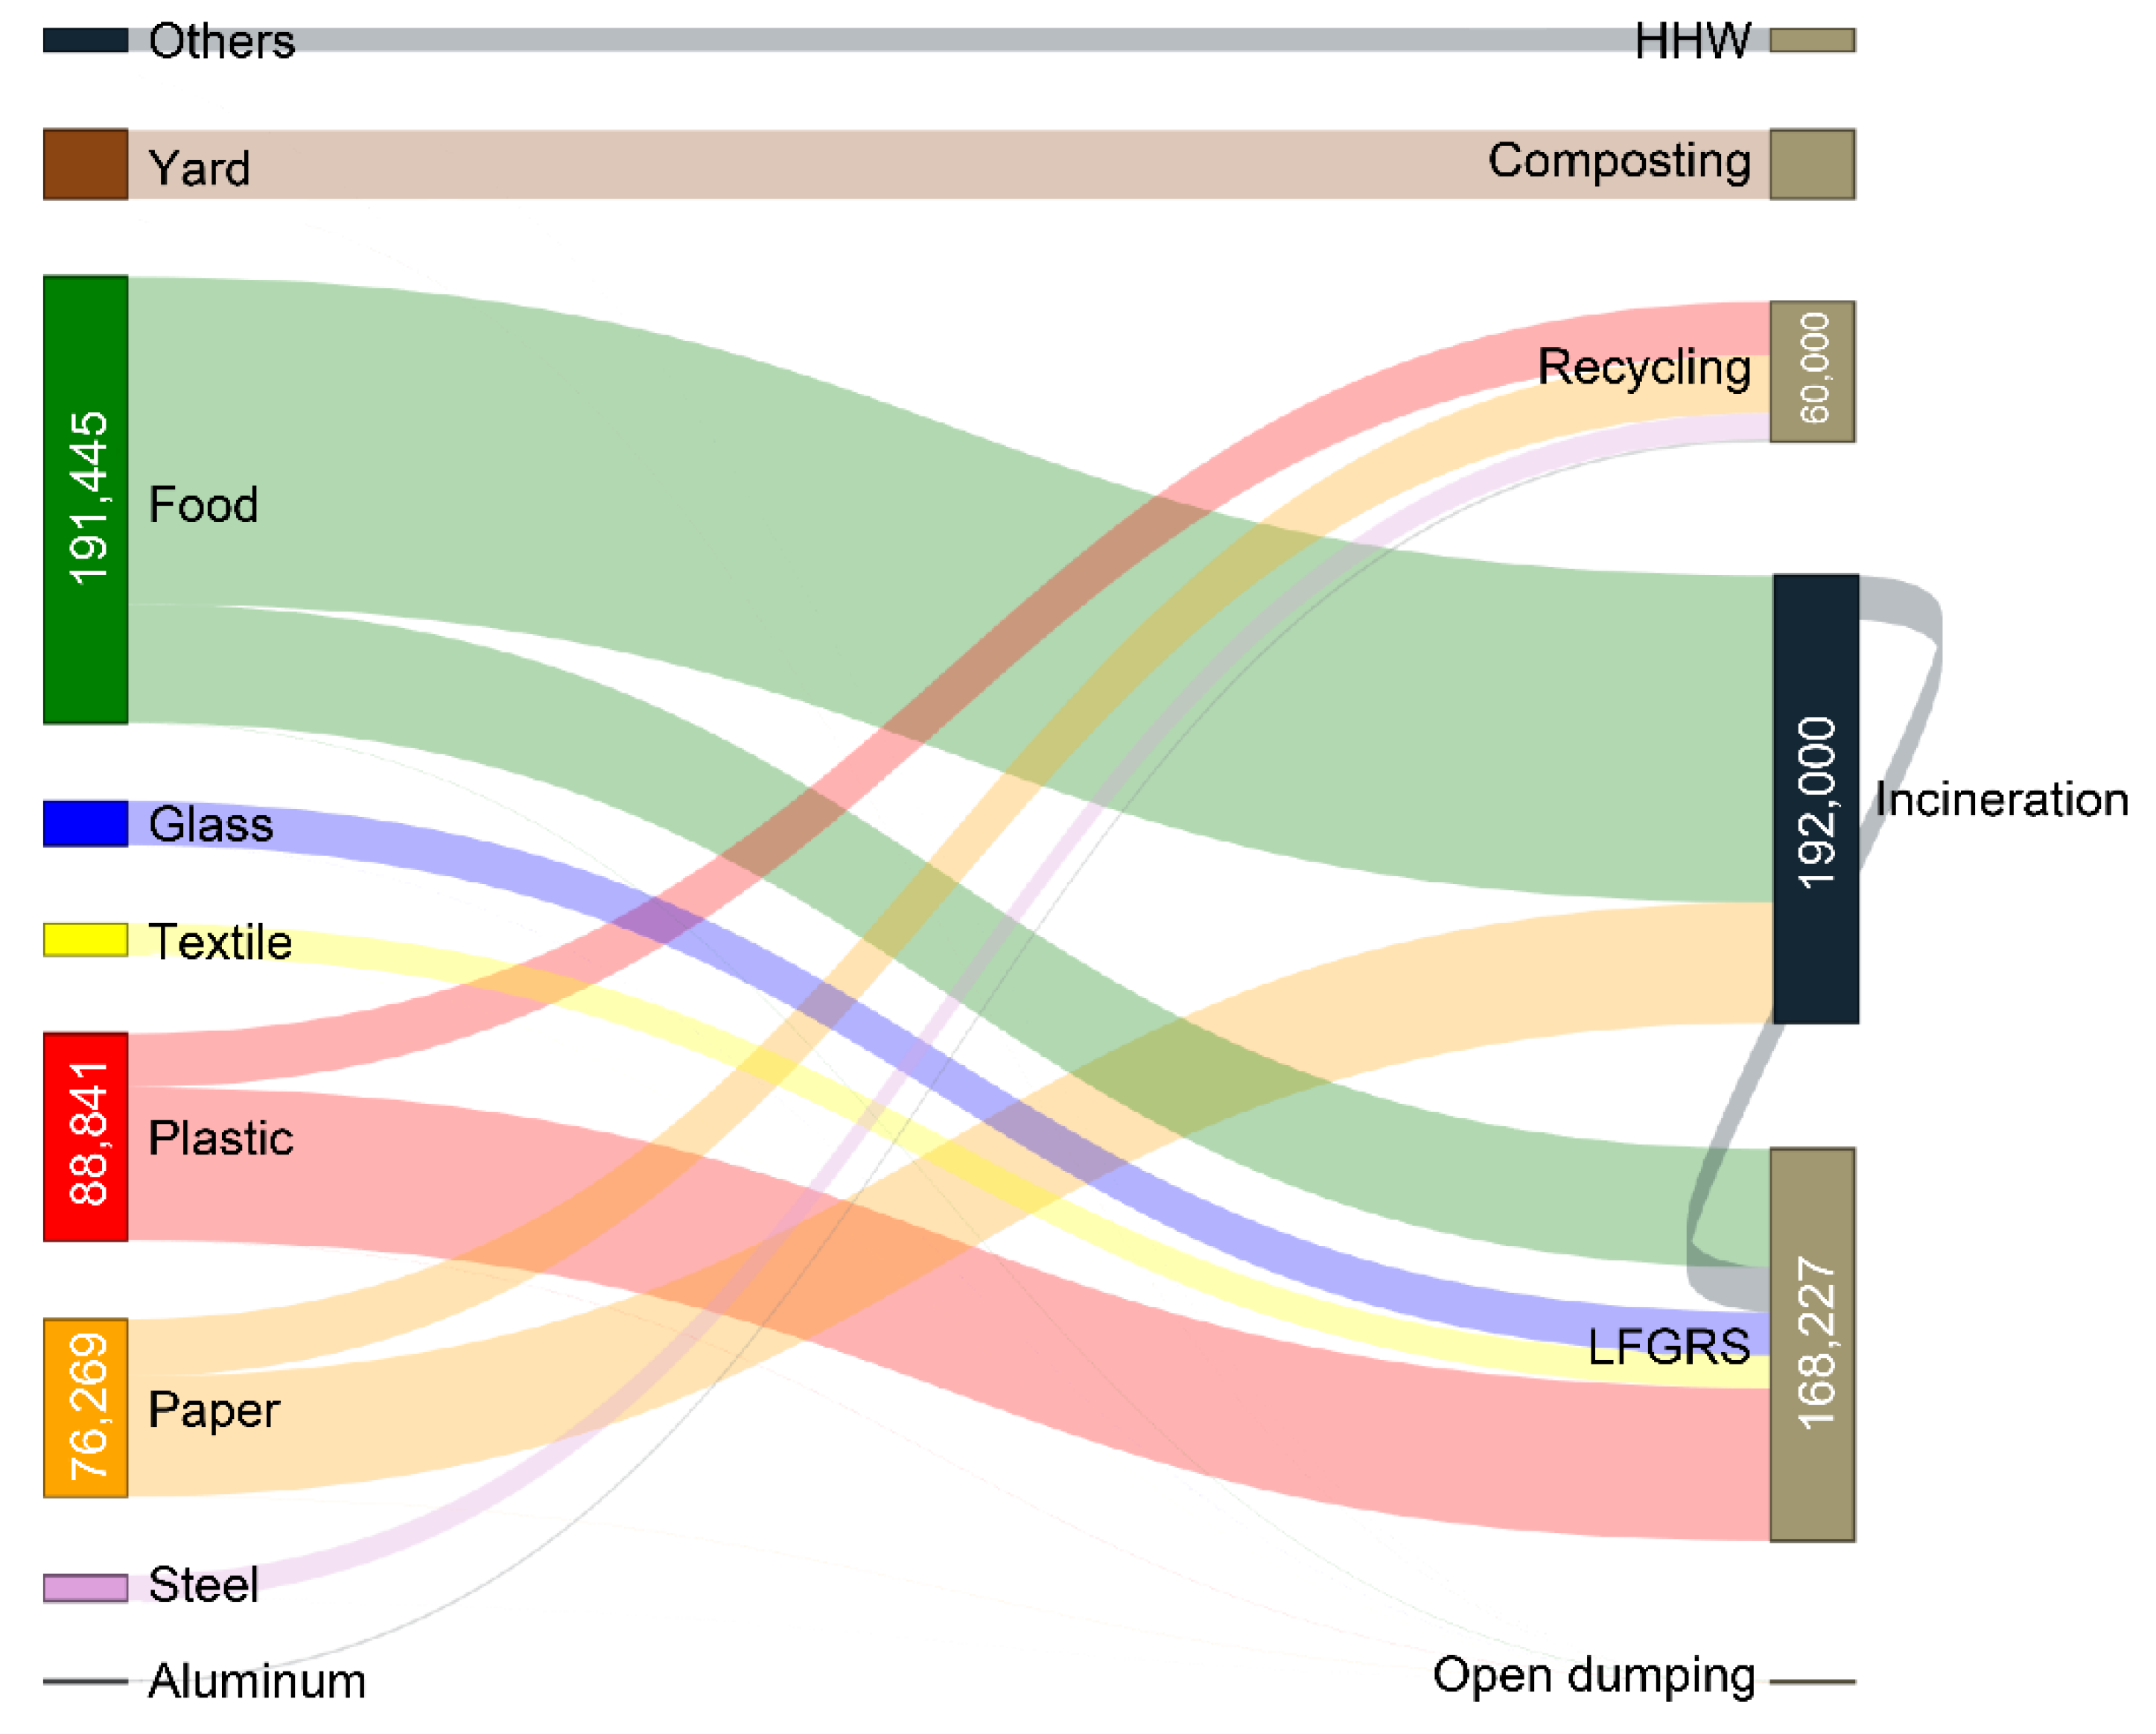
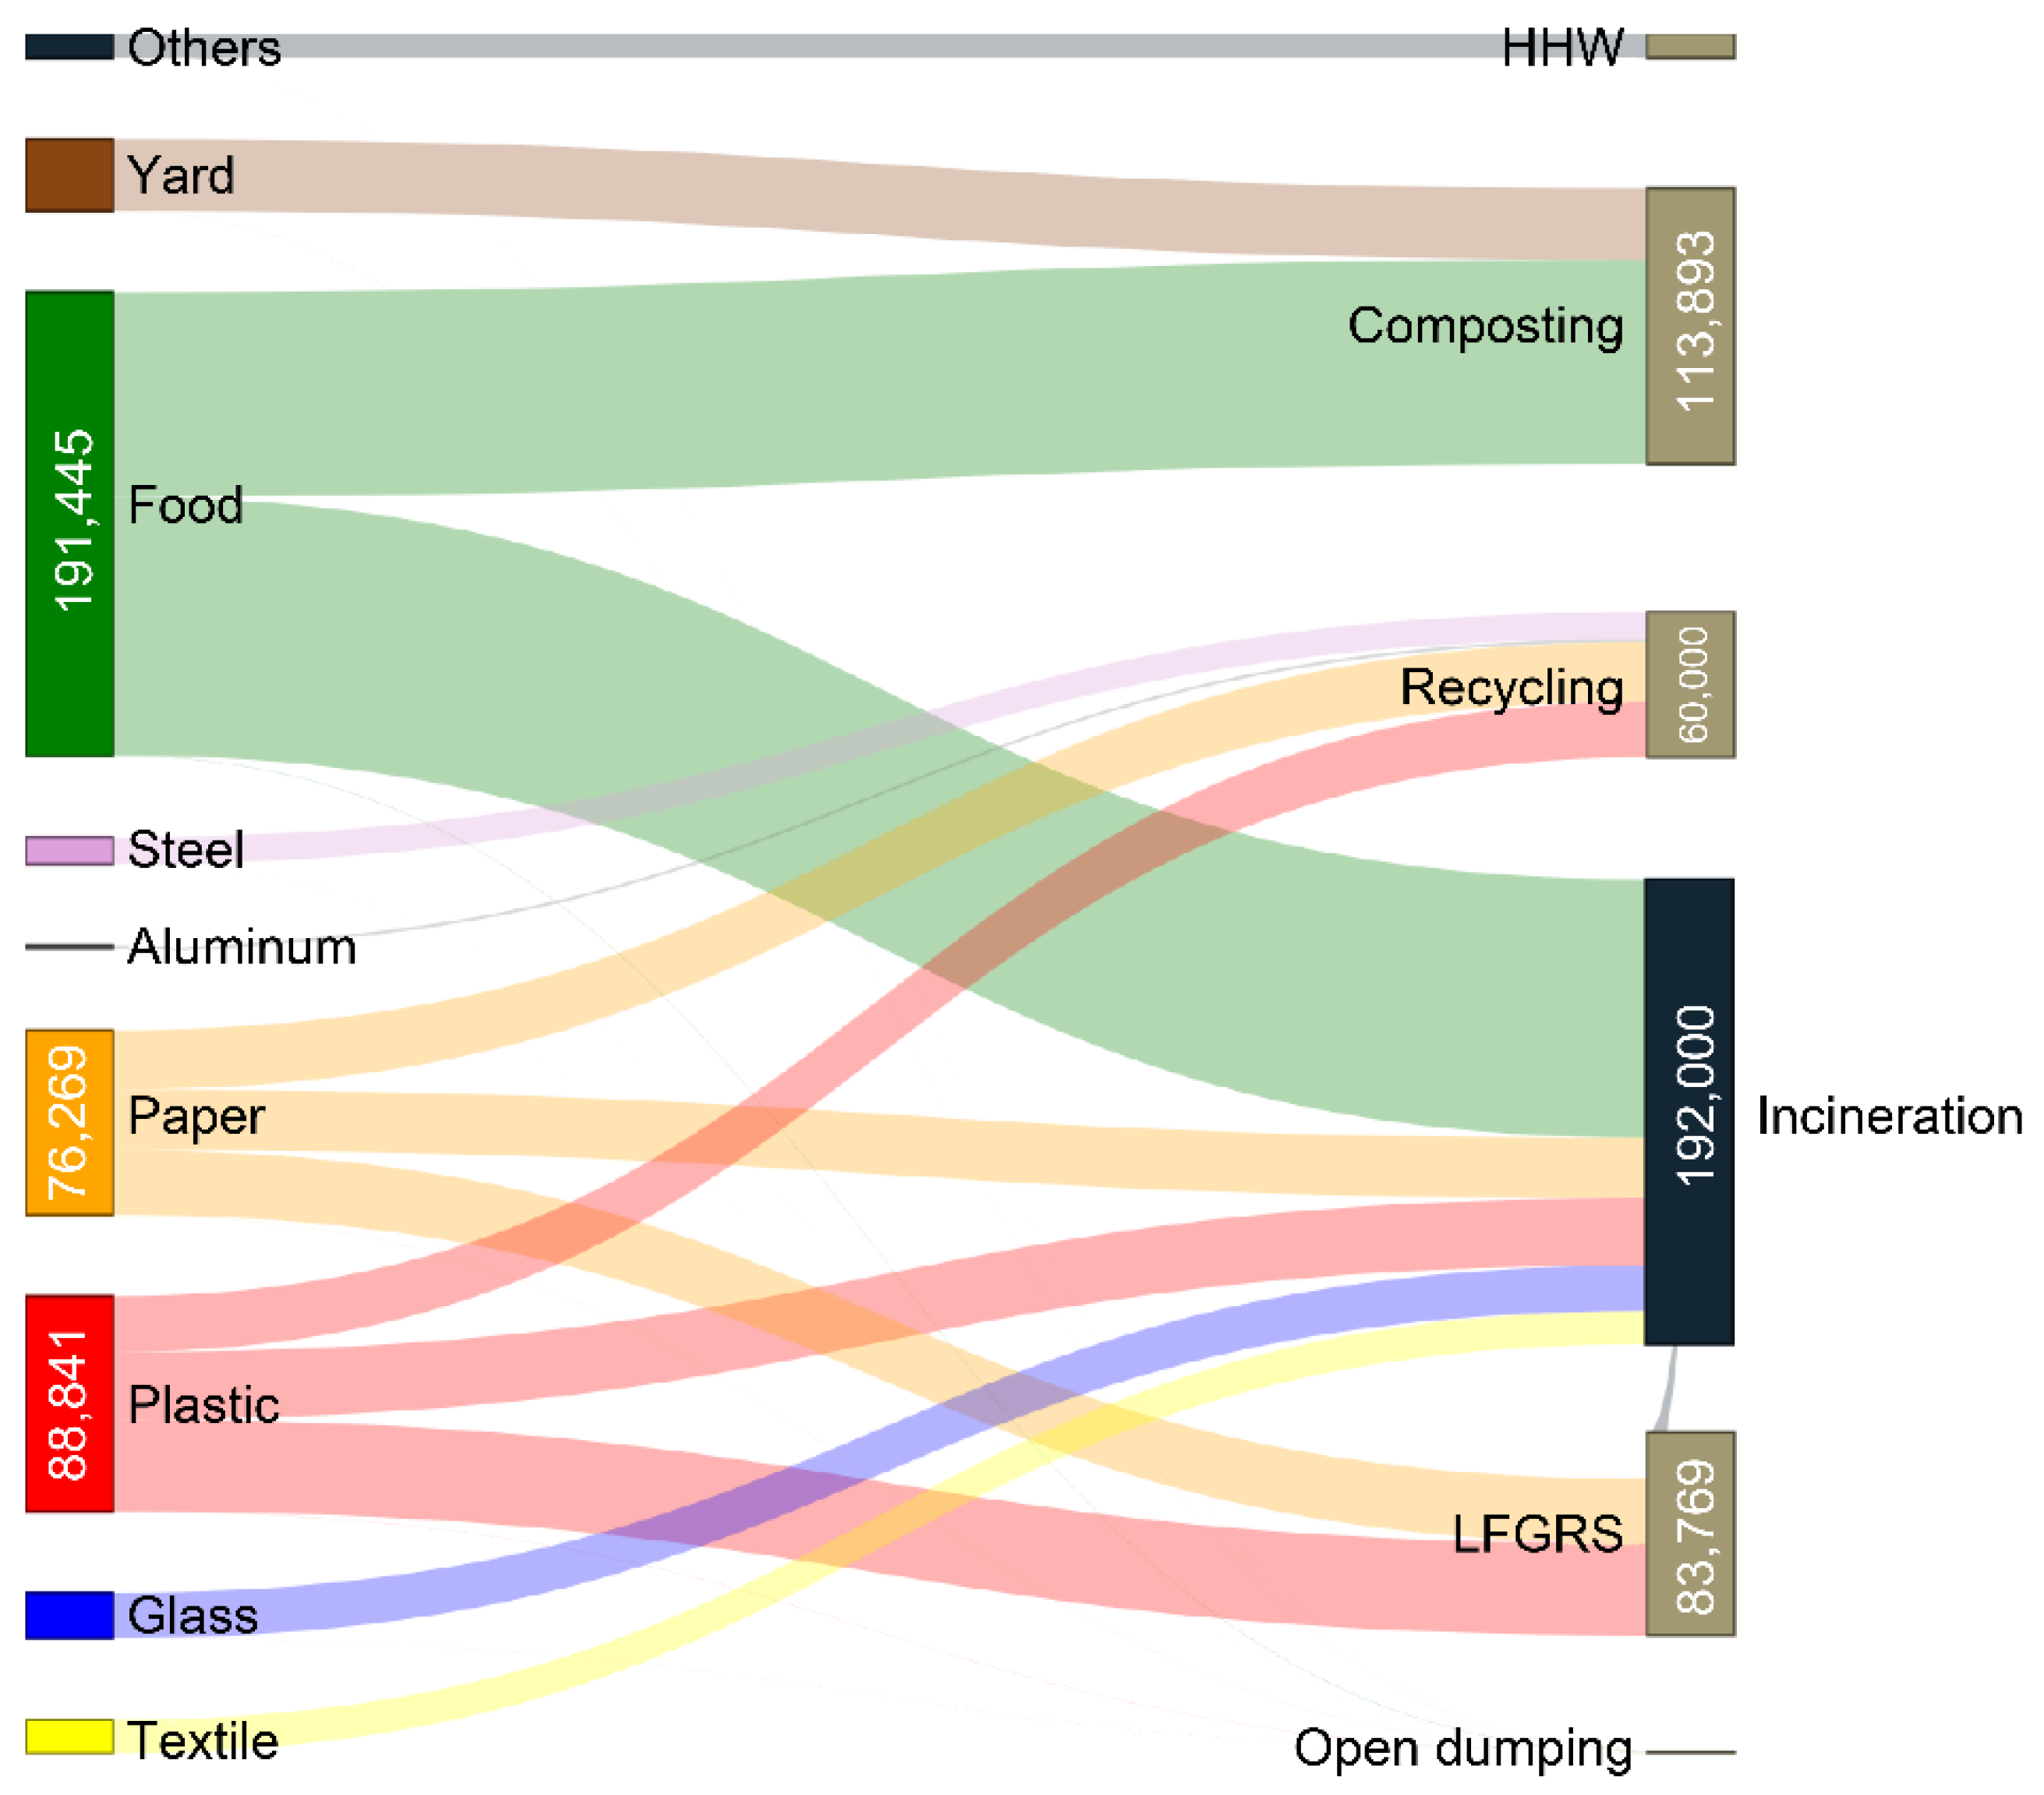
3.1.1. MFA of the MSWM System in 2017
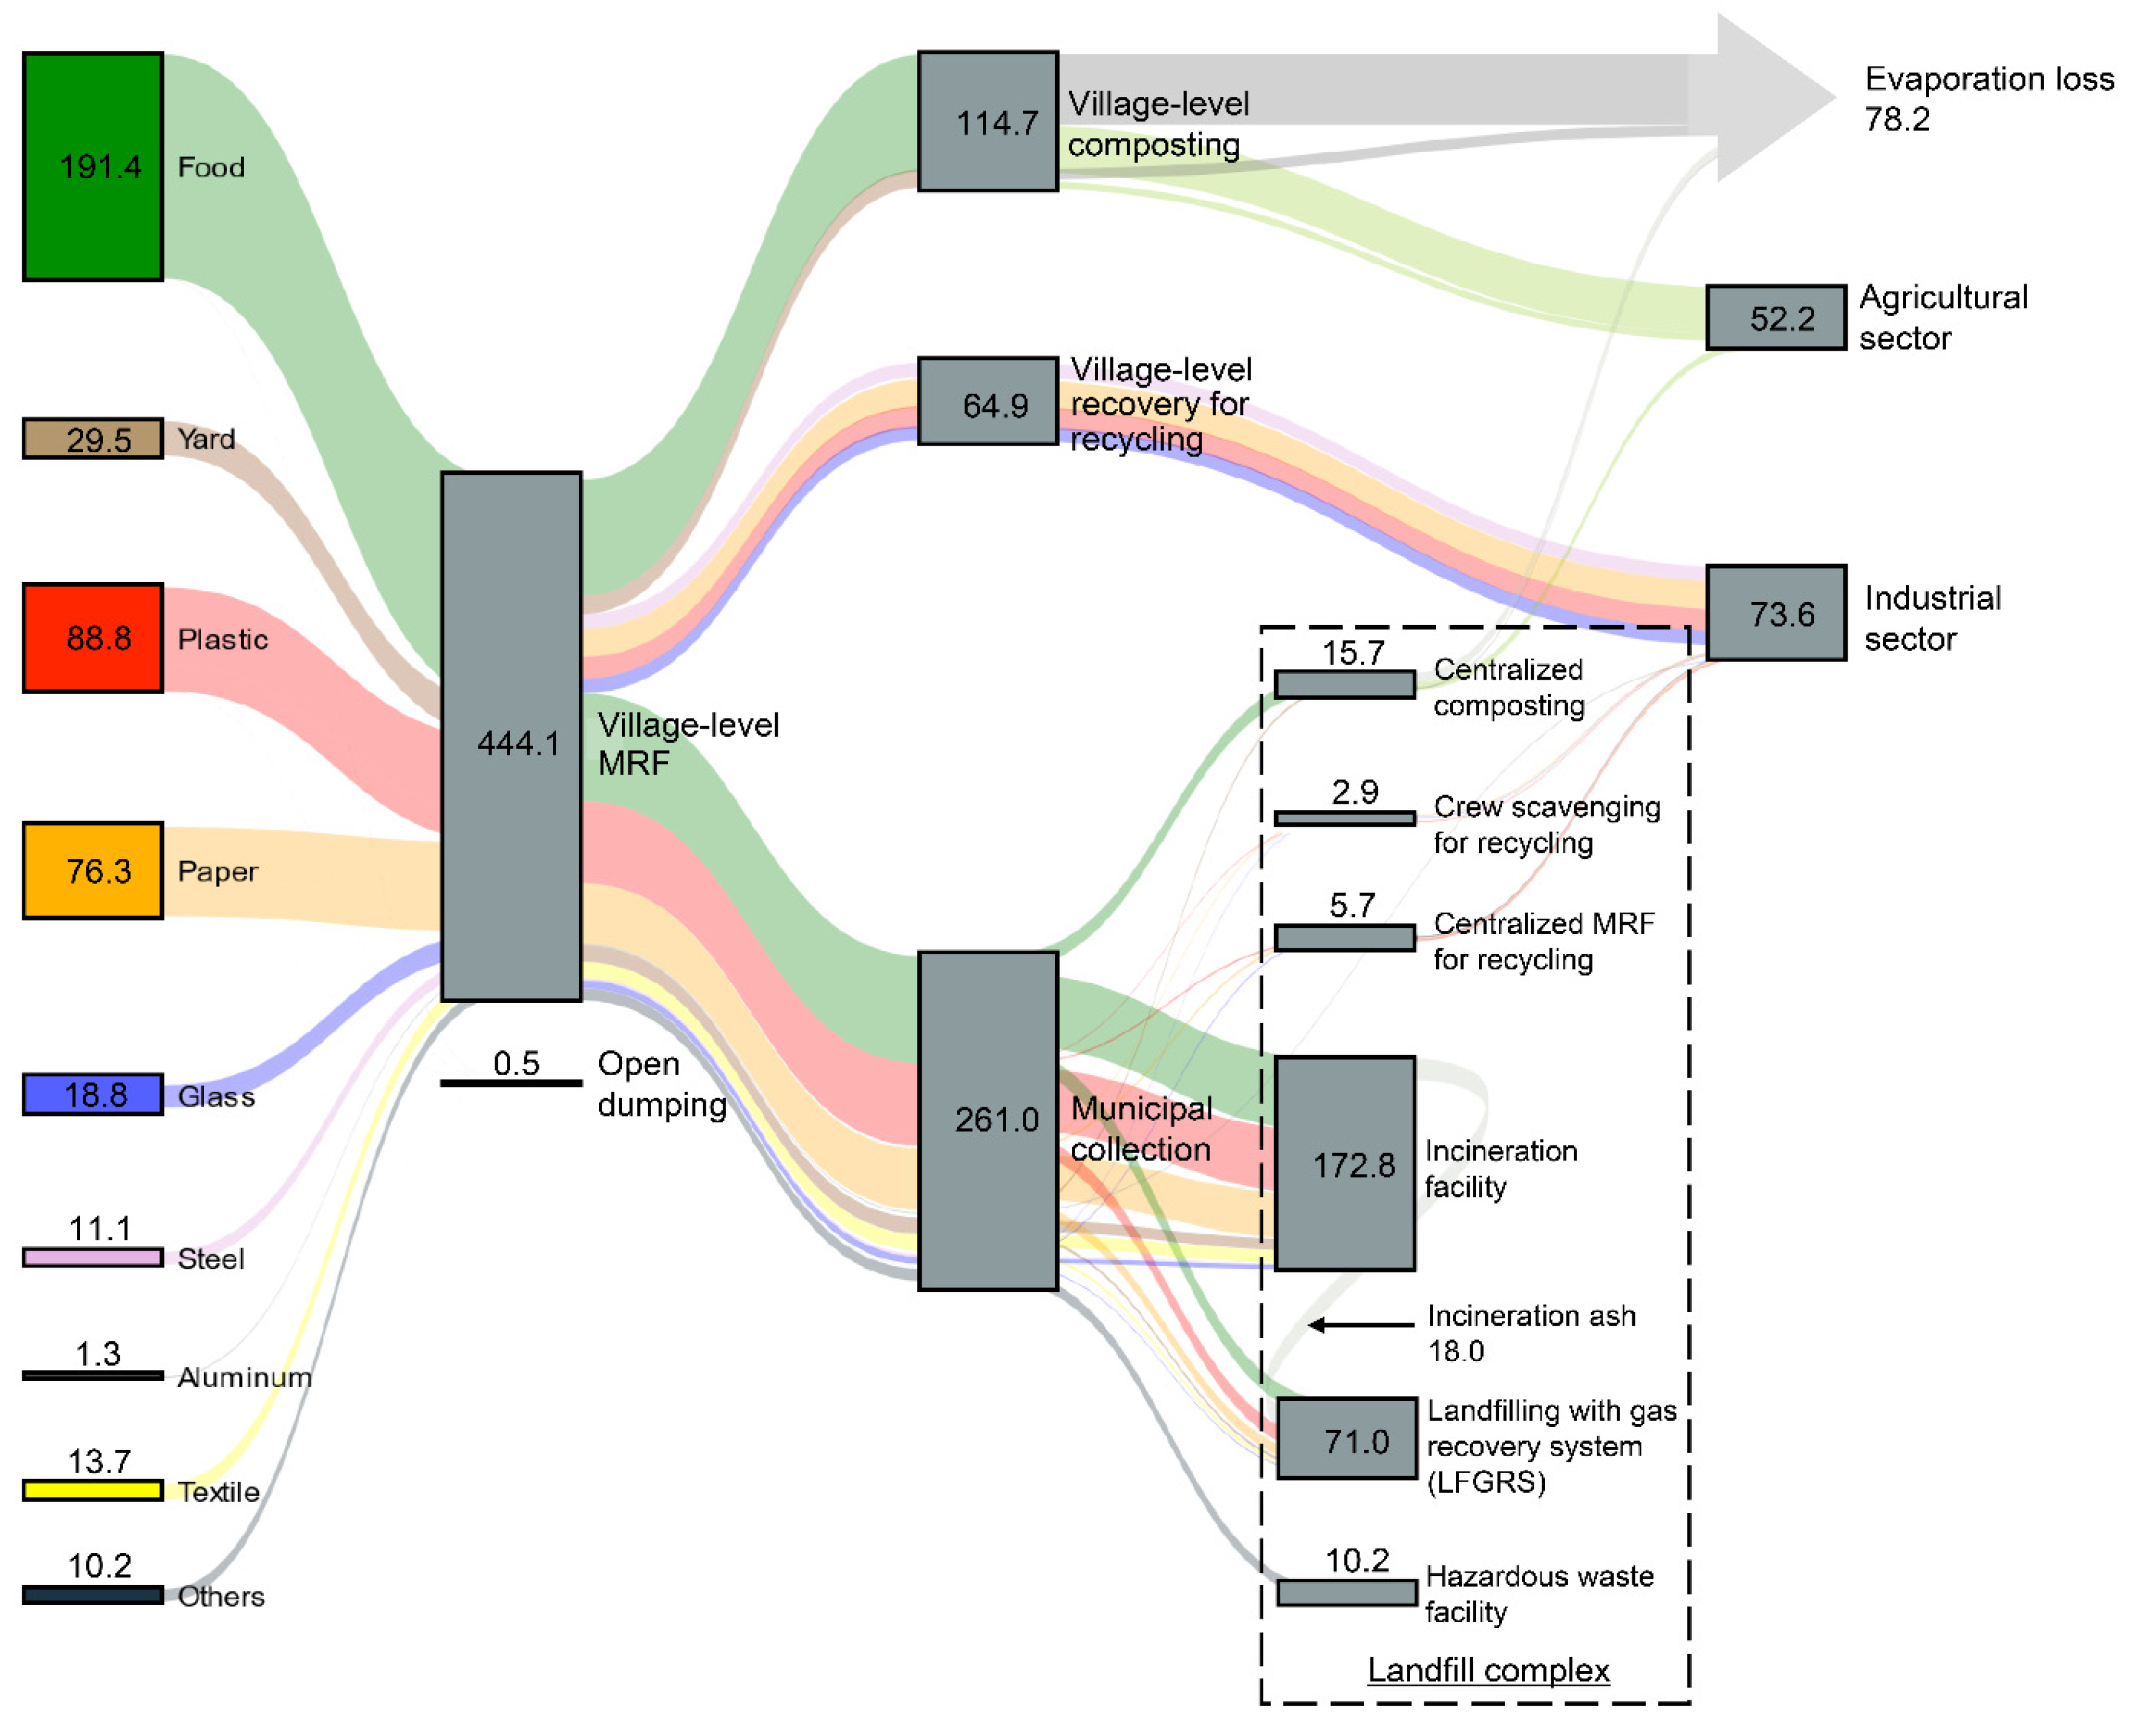
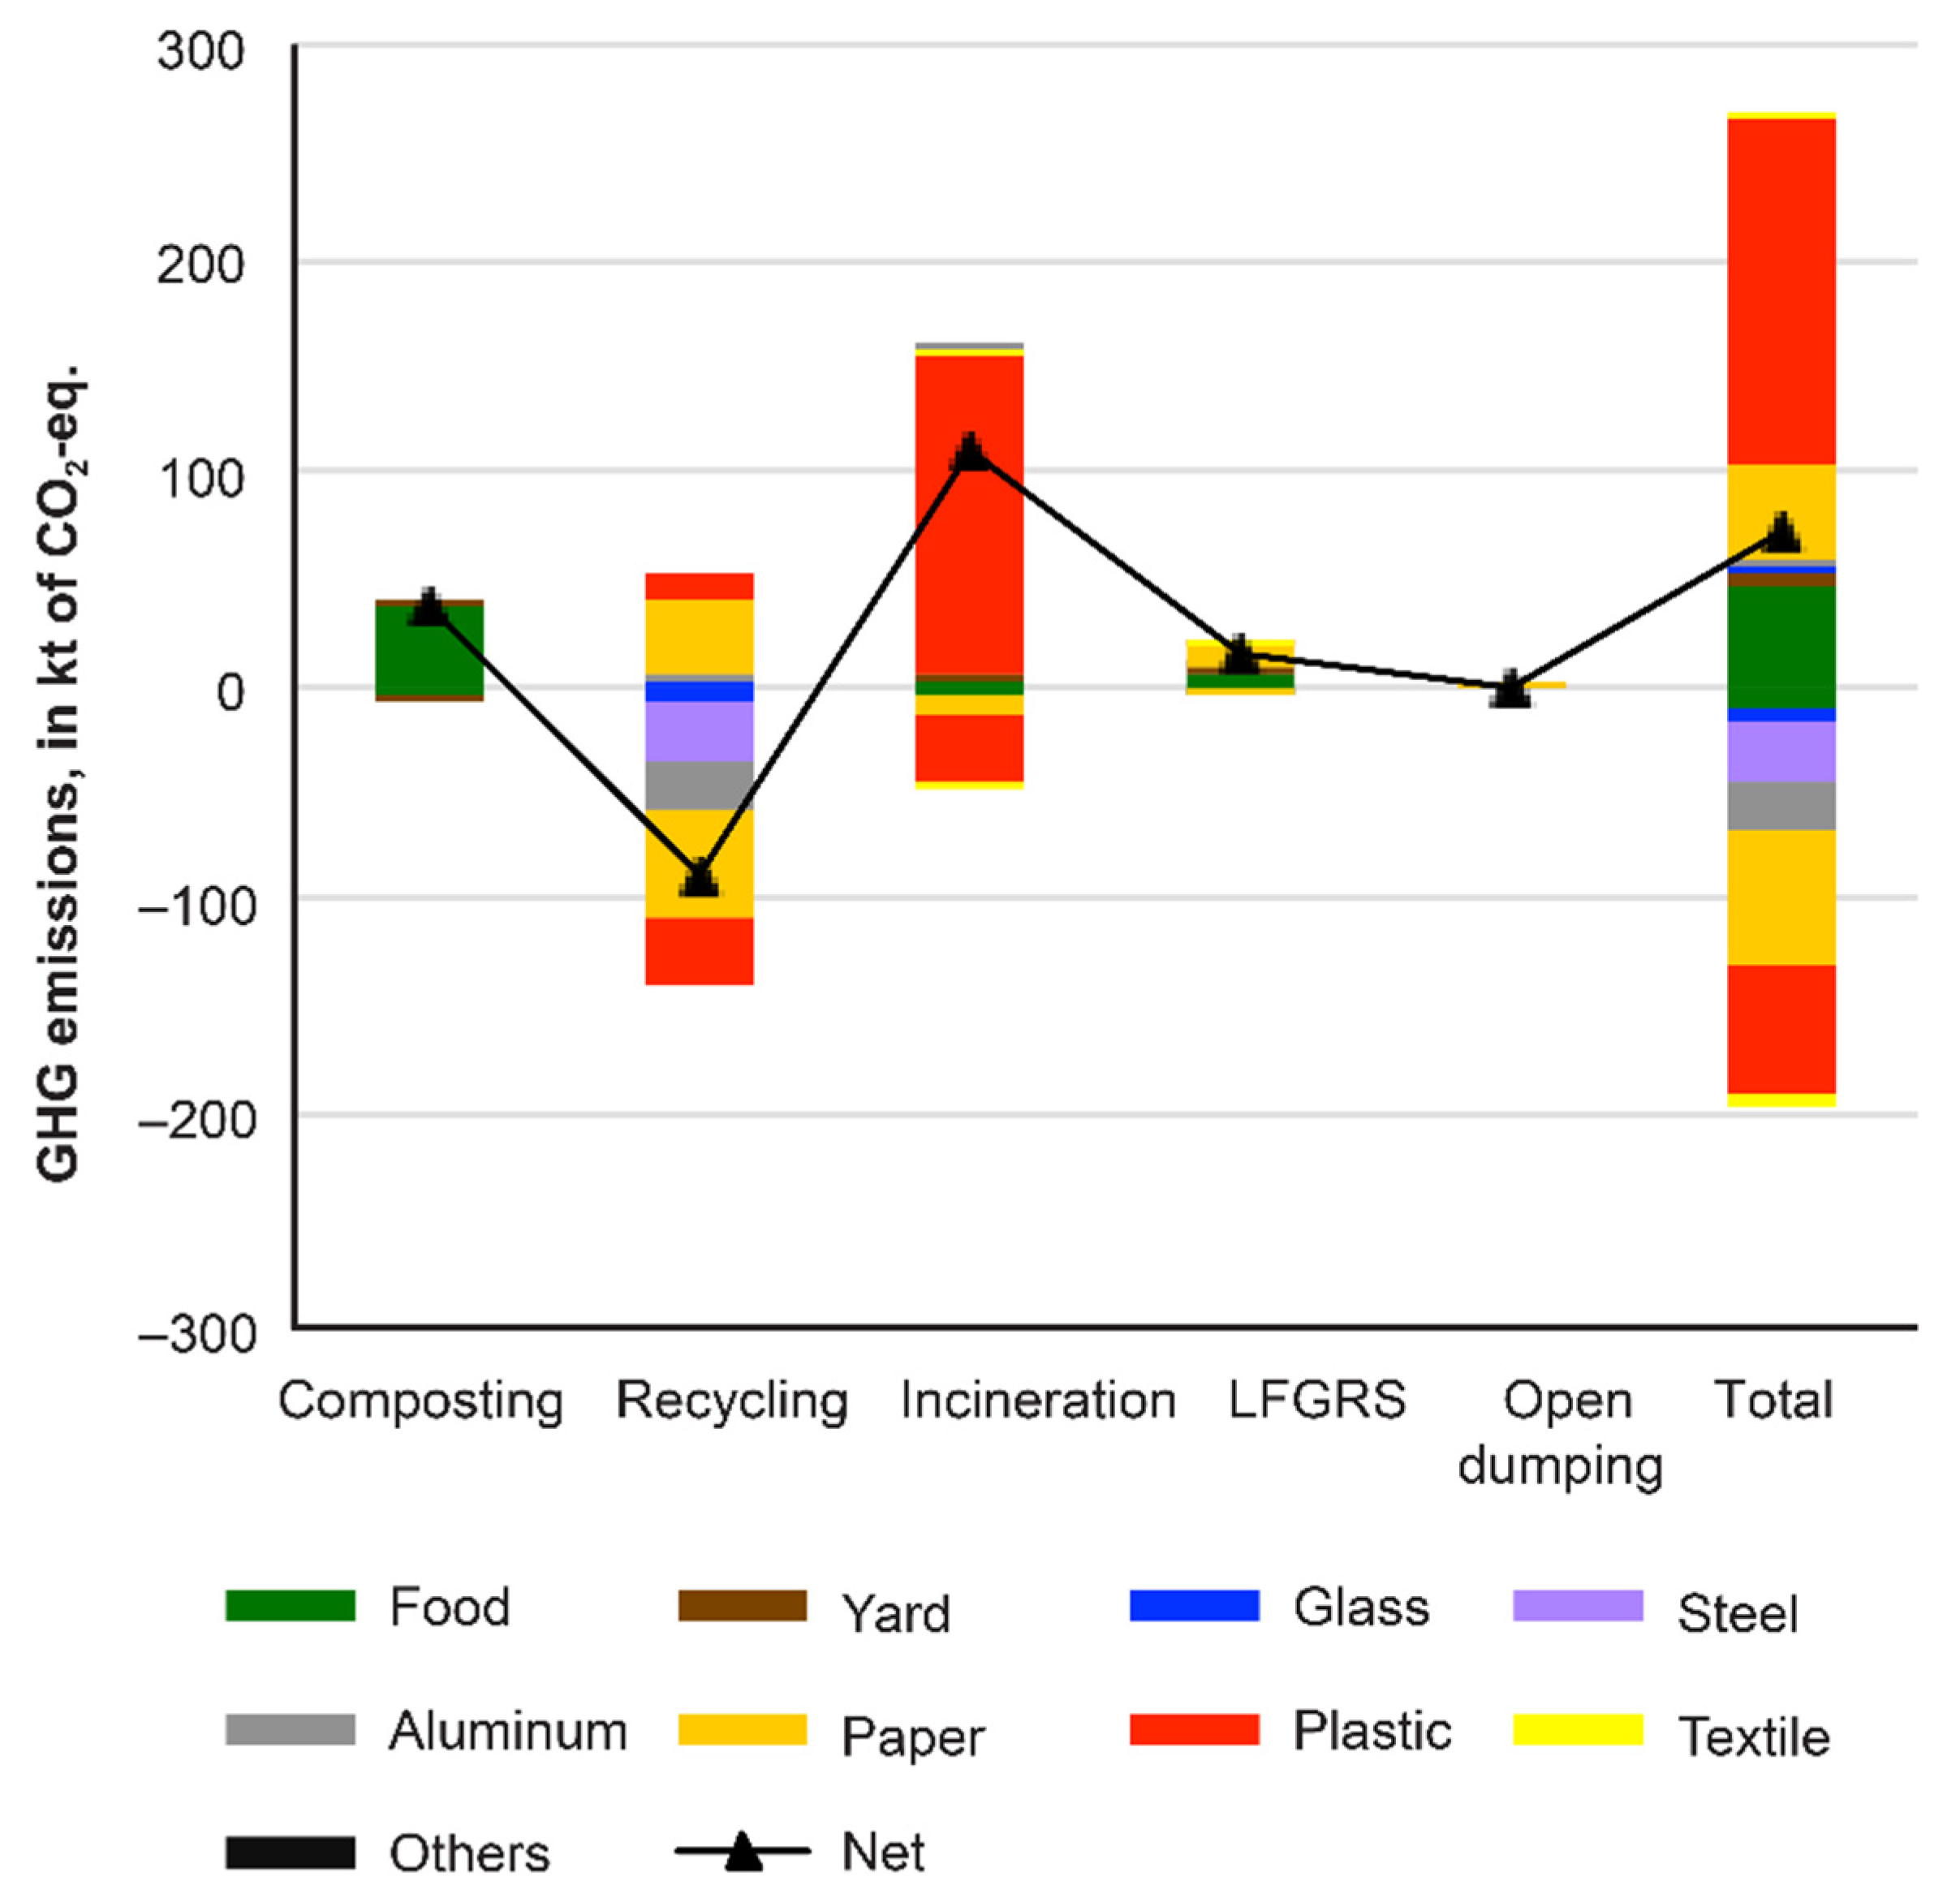
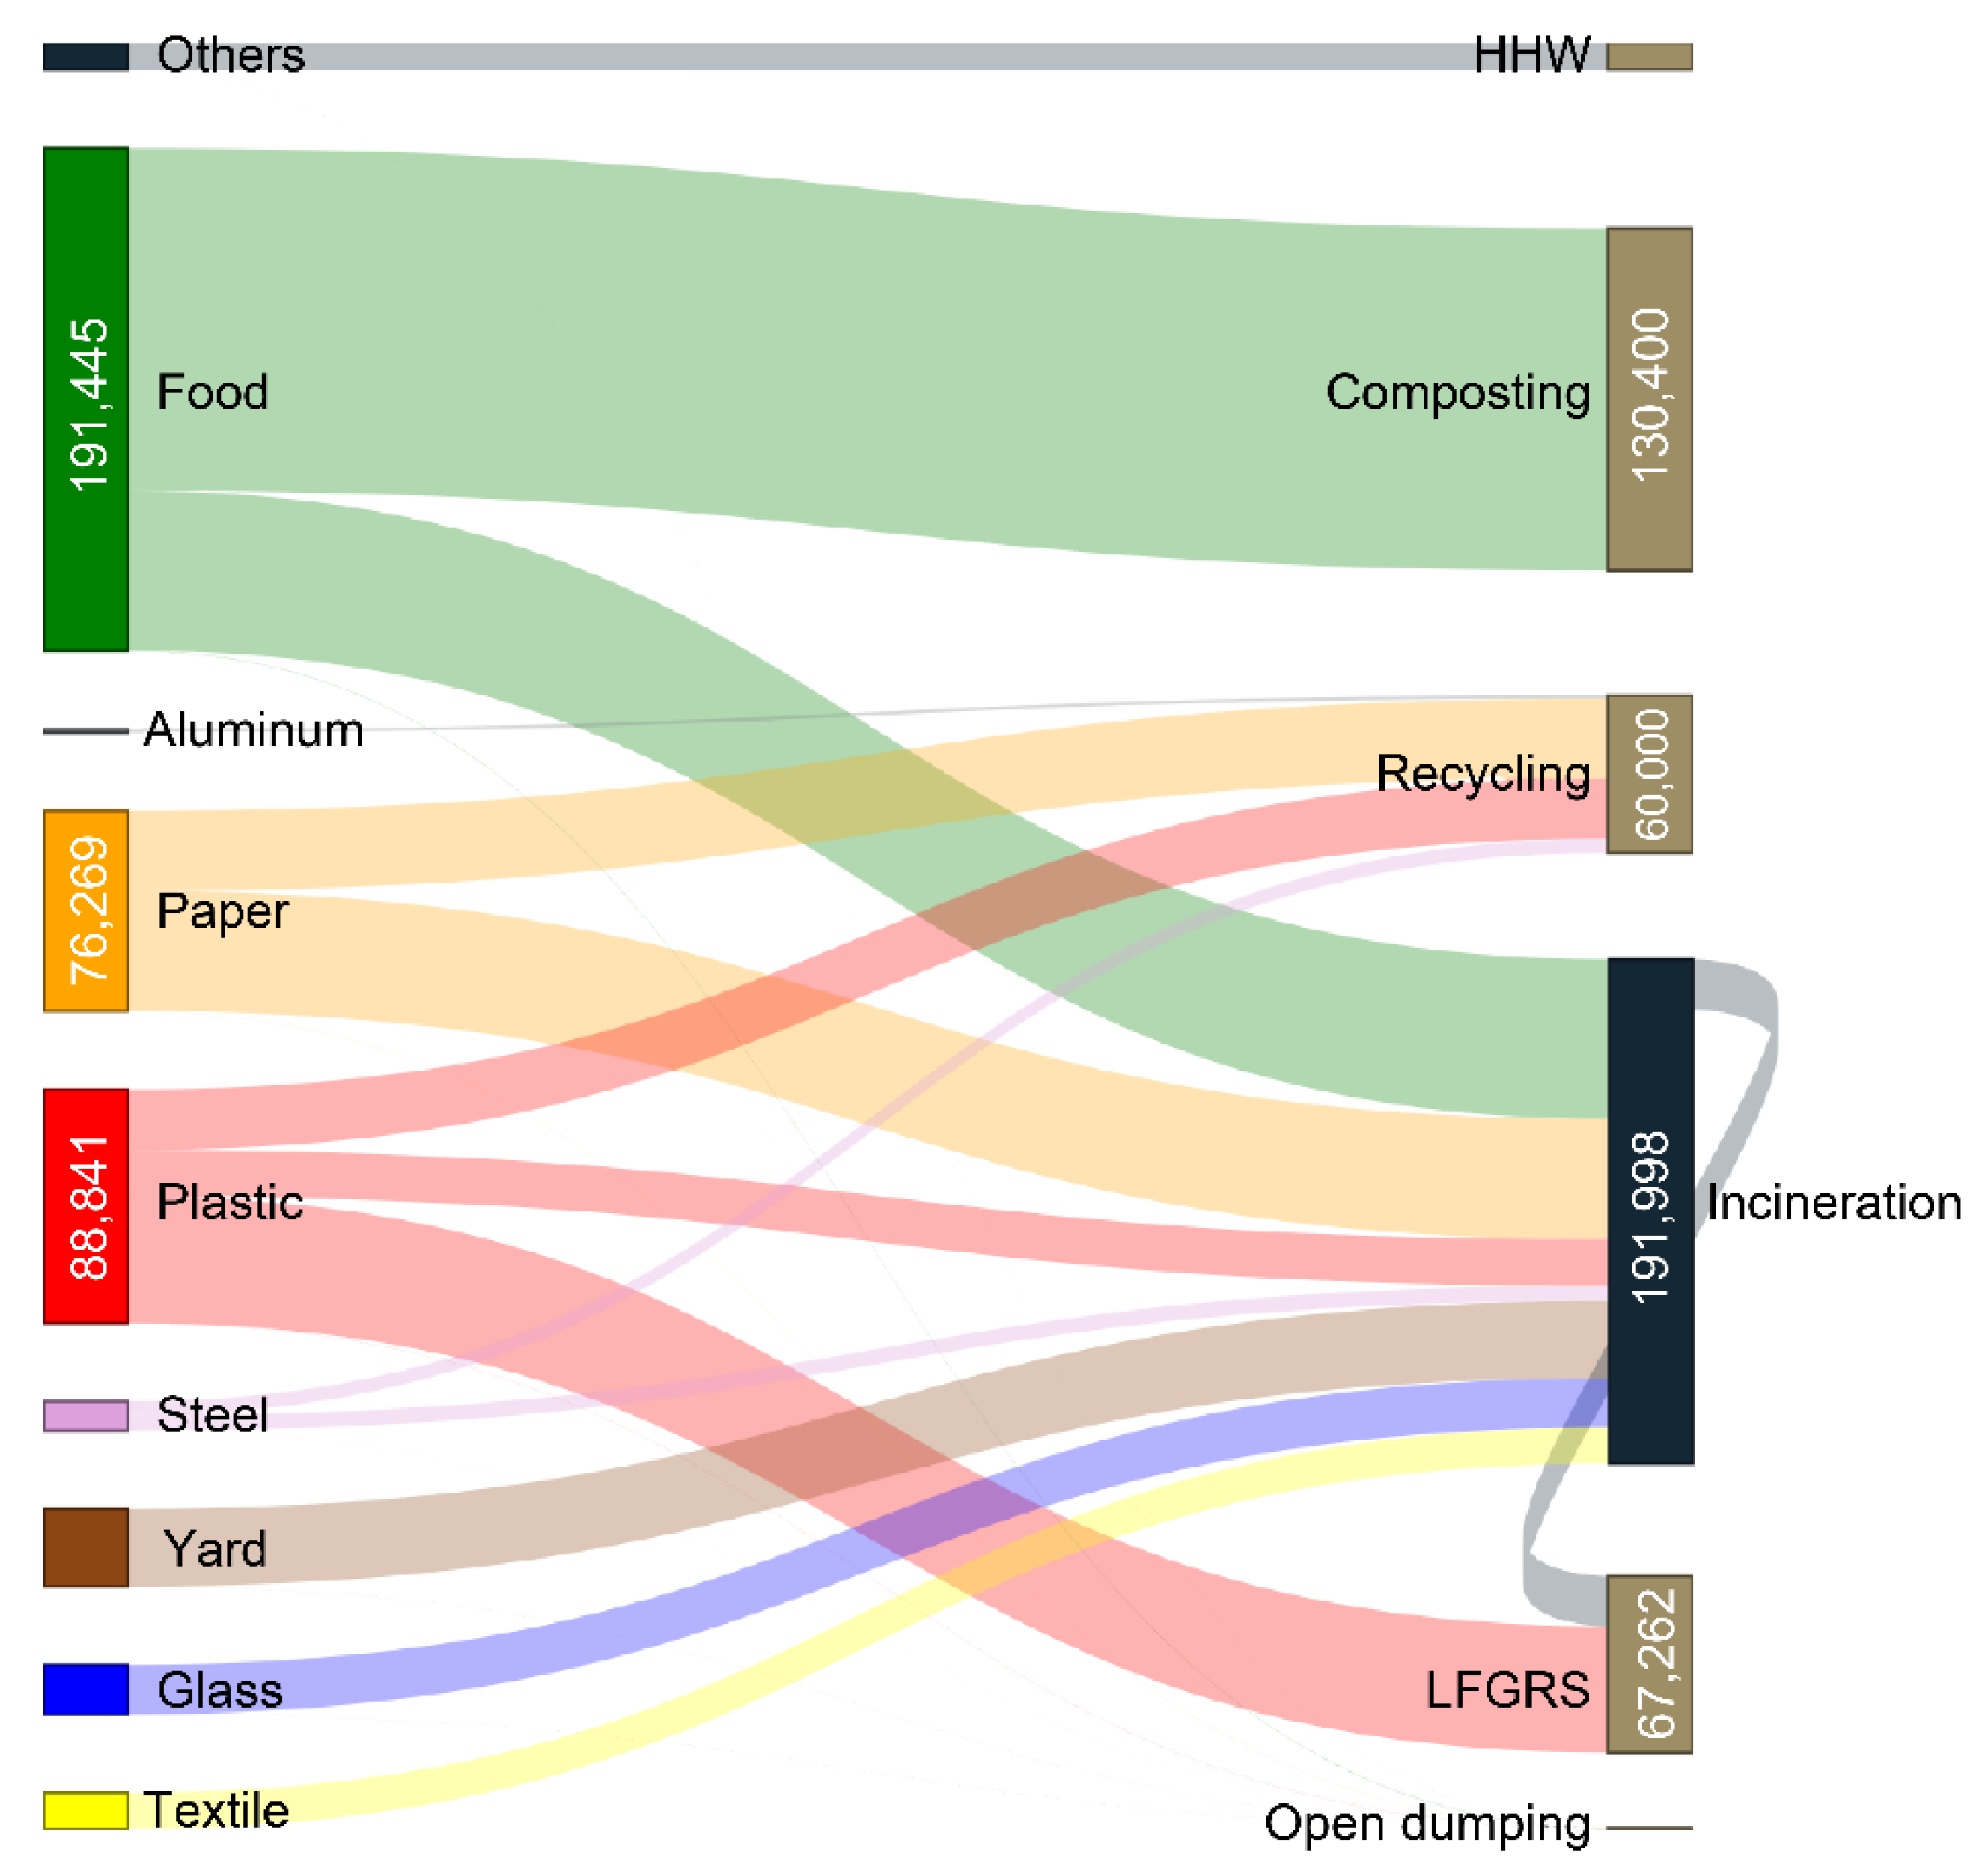
3.1.2. MFA of the MSWM System in 2027
3.2. Comparison of Current and Future Scenarios
3.3. Sensitivity Analysis
3.3.1. Sensitivity Analysis of Landfill Waste to Separation Rate
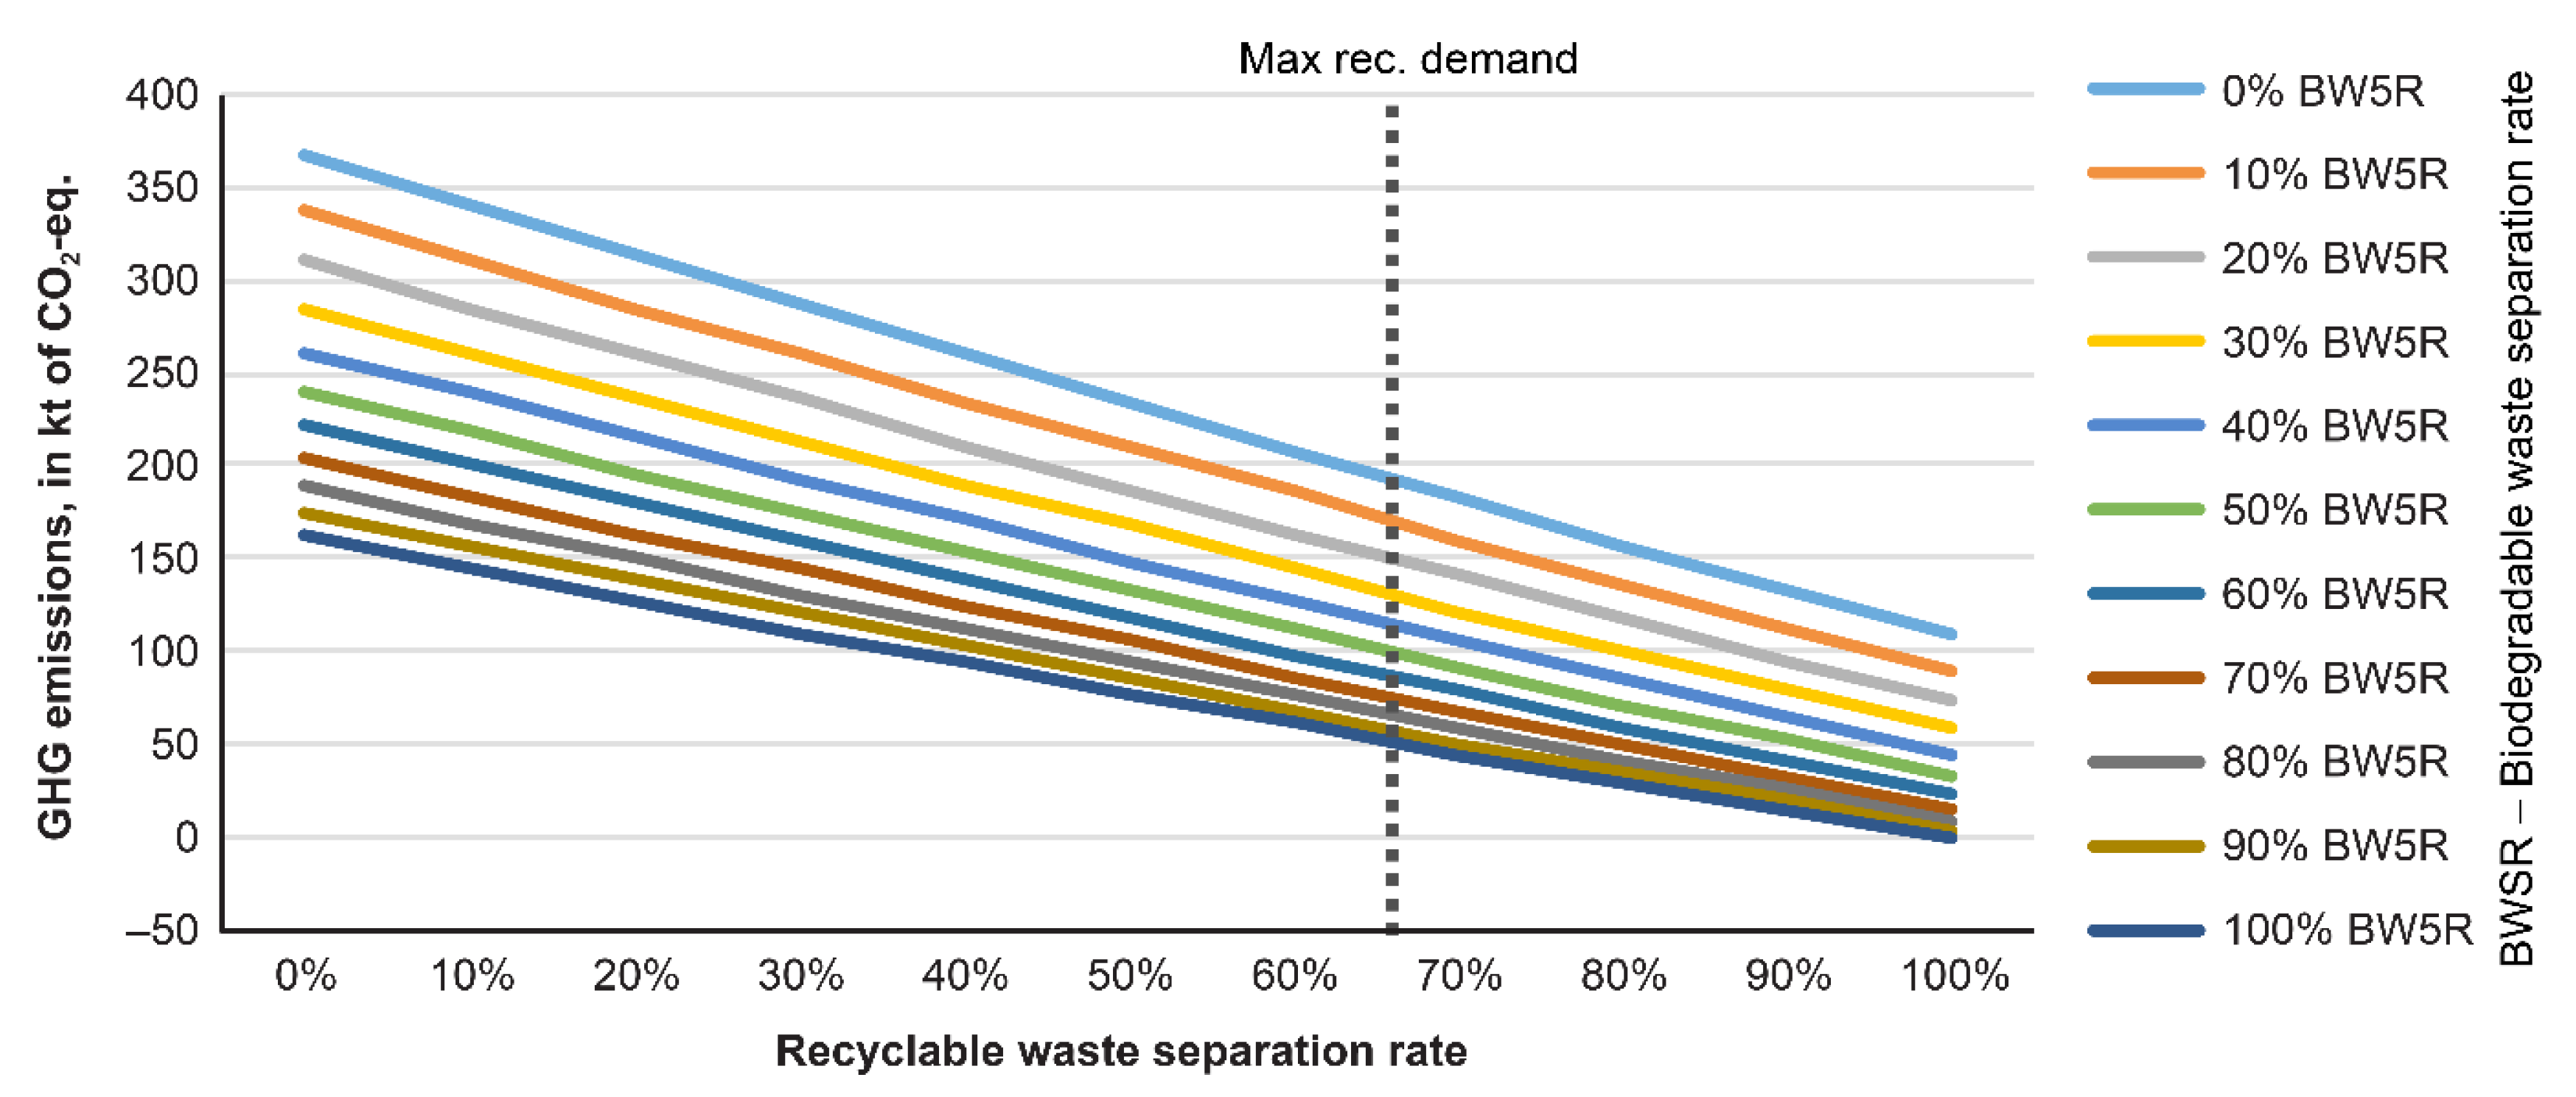
3.3.2. Sensitivity Analysis of System GHG Emissions to Separation Rate
3.3.3. Sensitivity Analysis of System GHG Emissions to Plastic Waste Generation
3.4. LP Optimization of the 2027 Scenario
3.5. Implications of the Ratio between Recyclable and Residual Fractions of MSW
4. Conclusions
Supplementary Materials
Author Contributions
Funding
Institutional Review Board Statement
Informed Consent Statement
Data Availability Statement
Conflicts of Interest
References
- Scheinberg, A.; Spies, S.; Simpson, M.H.; Mol, A.P.J. Assessing urban recycling in low- and middle-income countries: Building on modernized mixtures. Habitat Int. 2011, 35, 188–198. [Google Scholar] [CrossRef]
- Liamsanguan, C.; Gheewala, S.H. The holistic impact of integrated solid waste management on greenhouse gas emissions in Phuket. J. Clean. Prod. 2008, 16, 1865–1871. [Google Scholar] [CrossRef]
- Dong, J.; Ni, M.; Chi, Y.; Zou, D.; Fu, C. Life cycle and economic assessment of source-separated MSW collection with regard to greenhouse gas emissions: A case study in China. Environ. Sci. Pollut. Res. 2013, 20, 5512–5524. [Google Scholar] [CrossRef]
- Tan, S.T.; Lee, C.T.; Hashim, H.; Ho, W.S.; Lim, J.S. Optimal process network for municipal solid waste management in Iskandar Malaysia. J. Clean. Prod. 2014, 71, 48–58. [Google Scholar] [CrossRef]
- Troschinetz, A.M.; Mihelcic, J.R. Sustainable recycling of municipal solid waste in developing countries. Waste Manag. 2009, 29, 915–923. [Google Scholar] [CrossRef]
- Pandyaswargo, A.H.; Onoda, H.; Nagata, K. Energy recovery potential and life cycle impact assessment of municipal solid waste management technologies in Asian countries using ELP model. Int. J. Energy Environ. Eng. 2012, 3, 28. [Google Scholar] [CrossRef] [Green Version]
- Guerrero, L.A.; Maas, G.; Hogland, W. Solid waste management challenges for cities in developing countries. Waste Manag. 2013, 33, 220–232. [Google Scholar] [CrossRef] [PubMed]
- Menikpura, S.N.M.; Gheewala, S.H.; Bonnet, S.; Chiemchaisri, C. Evaluation of the effect of recycling on sustainability of municipal solid waste management in Thailand. Waste Biomass Valorization 2013, 4, 237–257. [Google Scholar] [CrossRef]
- Ferronato, N.; Torretta, V. Waste mismanagement in developing countries: A review of global issues. Int. J. Environ. Res. Public Health 2019, 16, 1060. [Google Scholar] [CrossRef] [Green Version]
- Kazuva, E.; Zhang, J. Analyzing municipal solid waste treatment scenarios in rapidly urbanizing cities in developing countries: The case of Dar es Salaam, Tanzania. Int. J. Environ. Res. Public Health 2019, 16, 2035. [Google Scholar] [CrossRef] [PubMed] [Green Version]
- Oosterveer, P.; Spaargaren, G. Meeting social challenges in developing sustainable environmental infrastructures in East African cities. In Social Perspectives on the Sanitation Challenge; Springer: Dordrecht, The Netherlands, 2010; pp. 11–30. [Google Scholar]
- Menikpura, S.N.M.; Sang-Arun, J.; Bengtsson, M. Integrated solid waste management: An approach for enhancing climate co-benefits through resource recovery. J. Clean. Prod. 2013, 58, 34–42. [Google Scholar] [CrossRef]
- City Government of Davao. 10-Year Solid Waste Management Plan of Davao City for 2018–2027; City Government of Davao: Davao City, Philippines, 2017.
- Republic of the Philippines. Republic Act 9003—The ecological solid waste management act of the Philippines 2000. In Proceedings of the Eleventh Congress of the Philippines, Third Regular Session, Quezon City, Philippines, 26 January 2001. [Google Scholar]
- Japan International Cooperation Agency. Davao City Infrastructure Development Plan and Capacity Building Project—Final Report—Summary. 2018. Available online: http://open_jicareport.jica.go.jp/pdf/12308706.pdf (accessed on 1 October 2019).
- Japan International Cooperation Agency. Collaboration Program with the Private Sector for Disseminating Japanese Technology for Waste to Energy System in Davao City—Final Report. 2016. Available online: http://open_jicareport.jica.go.jp/pdf/12302113.pdf (accessed on 1 October 2019).
- Gunamantha, M.; Sarto, S. Life cycle assessment of municipal solid waste treatment to energy options: Case study of KARTAMANTUL region, Yogyakarta. Renew. Energy 2012, 41, 277–284. [Google Scholar] [CrossRef]
- Premakumara, D.G.J.; Menikpura, S.N.M.; Singh, R.K.; Hengesbaugh, M.; Magalang, A.A.; Ildefonso, E.T.; Valdez, M.D.C.M.; Silva, L.C. Reduction of greenhouse gases (GHGs) and short-lived climate pollutants (SLCPs) from municipal solid waste management (MSWM) in the Philippines: Rapid review and assessment. Waste Manag. 2018, 80, 397–405. [Google Scholar] [CrossRef] [PubMed]
- Chen, Y.; Cui, Z.; Cui, X.; Liu, W.; Wang, X.; Li, X.; Li, S. Life cycle assessment of end-of-life treatments of waste plastics in China. Resour. Conserv. Recycl. 2019, 146, 348–357. [Google Scholar] [CrossRef]
- Badran, M.F.; El-Haggar, S.M. Optimization of municipal solid waste management in Port Said–Egypt. Waste Manag. 2006, 26, 534–545. [Google Scholar] [CrossRef]
- Dai, C.; Li, Y.P.; Huang, G.H. A two-stage support-vector-regression optimization model for municipal solid waste management—A case study of Beijing, China. J. Environ. Manag. 2011, 92, 3023–3037. [Google Scholar] [CrossRef]
- Ng, W.; Varbanov, P.; Klemeš, J.; Hegyhati, M.; Bertok, B.; Heckl, I.; Lam, H. Waste to energy for small cities: Economics versus carbon footprint. Chem. Eng. Trans. 2013, 35, 889–894. [Google Scholar] [CrossRef]
- Rodionov, M.A.; Nakata, T. Design of an optimal waste utilization system: A case study in St. Petersburg, Russia. Sustainability 2011, 3, 1486–1509. [Google Scholar] [CrossRef] [Green Version]
- Santibañez-Aguilar, J.E.; Ponce-Ortega, J.M.; Betzabe González-Campos, J.B.; Serna-González, M.; El-Halwagi, M.M. Optimal planning for the sustainable utilization of municipal solid waste. Waste Manag. 2013, 33, 2607–2622. [Google Scholar] [CrossRef]
- Yousefloo, A.; Babazadeh, R. Designing an integrated municipal solid waste management network: A case study. J. Clean. Prod. 2020, 244, 118824. [Google Scholar] [CrossRef]
- Nakatani, J. Life-cycle inventory analysis of recycling: Mathematical and graphical frameworks. Sustainability 2014, 6, 6158–6169. [Google Scholar] [CrossRef] [Green Version]
- Manfredi, S.; Tonini, D.; Christensen, T.H.; Scharff, H. Landfilling of waste: Accounting of greenhouse gases and global warming contributions. Waste Manag. Res. 2009, 27, 825–836. [Google Scholar] [CrossRef] [PubMed]
- Friedrich, E.; Trois, C. GHG emission factors developed for the recycling and composting of municipal waste in South African municipalities. Waste Manag. 2013, 33, 2520–2531. [Google Scholar] [CrossRef]
- Astrup, T.; Møller, J.; Fruergaard, T. Incineration and co-combustion of waste: Accounting of greenhouse gases and global warming contributions. Waste Manag. Res. 2009, 27, 789–799. [Google Scholar] [CrossRef] [PubMed]
- Boldrin, A.; Andersen, J.K.; Møller, J.; Christensen, T.H.; Favoino, E. Composting and compost utilization: Accounting of greenhouse gases and global warming contributions. Waste Manag. Res. 2009, 27, 800–812. [Google Scholar] [CrossRef] [PubMed] [Green Version]
- Fruergaard, T.; Astrup, T.; Ekvall, T. Energy use and recovery in waste management and implications for accounting of greenhouse gases and global warming contributions. Waste Manag. Res. 2009, 27, 724–737. [Google Scholar] [CrossRef] [PubMed]
- Pachauri, R.K.; Allen, M.R.; Barros, V.R.; Broome, J.; Cramer, W.; Christ, R.; Church, J.A.; Clarke, L.; Dahe, Q.D.; Dasqupta, P.; et al. Climate Change 2014: Synthesis Report. Contribution of Working Groups I, II and III to the Fifth Assessment Report of the Intergovernmental Panel on Climate Change; IPCC: Geneva, Switzerland, 2014; p. 151. [Google Scholar]
- Asian Development Bank. Materials Recovery Facility Tool Kit; Asian Development Bank: Mandaluyong City, Philippines, 2013; Available online: https://www.adb.org/sites/default/files/publication/30220/materials-recovery-facility-tool-kit.pdf (accessed on 1 December 2020).
- Japan International Cooperation Agency. Davao City Infrastructure Development Plan and Capacity Building Project Final Report Vol. 1 Part I Present Situation and Annex. 2018. Available online: http://open_jicareport.jica.go.jp/pdf/12308714_01.pdf (accessed on 1 October 2019).
- Japan International Cooperation Agency. The Study on Recycling Industry Development in the Republic of the Philippines Final Report. 2008. Available online: https://openjicareport.jica.go.jp/pdf/11882404_02.pdf (accessed on 1 November 2019).
- Japan International Cooperation Agency. Davao City Infrastructure Development Plan and Capacity Building Project Final Report Vol. 2 Part II Development Plan Part III Capacity Development. 2018. Available online: http://open_jicareport.jica.go.jp/pdf/12308722_01.pdf (accessed on 1 October 2019).
- Department of Energy. Power Supply Procurement Plan. 2019. Available online: https://www.doe.gov.ph/sites/default/files/pdf/du_csp/2019-2028_DLPC_PSPP.pdf (accessed on 1 December 2020).


| Material Composition | Composition (%) | MSW Separation Categorization (%) | ||||
|---|---|---|---|---|---|---|
| Biodegradable | Recyclable | Residual | Special | |||
| Food | 43.40 | 43.40 | ||||
| Yard, wood | 6.68 | 6.68 | ||||
| Glass, ceramic, stone | 4.26 | 3.51 | 0.75 | |||
| Metals | Steel | 2.52 | 2.52 | |||
| Aluminum | 0.29 | 0.29 | ||||
| Paper | 17.29 | 6.88 | 10.41 | |||
| Plastic, rubber | 20.14 | 5.22 | 14.92 | |||
| Textile | 3.11 | 3.11 | ||||
| Others | 2.31 | 2.31 | ||||
| Total | 100.00 | 50.08 | 18.42 | 29.19 | 2.31 | |
| Biodegradable Waste Separation Rate | ||||||||||||
|---|---|---|---|---|---|---|---|---|---|---|---|---|
| 0% | 10% | 20% | 30% | 40% | 50% | 60% | 70% | 80% | 90% | 100% | ||
| Recyclable waste separation rate | 0% | 258 | 242 | 226 | 210 | 194 | 178 | 163 | 148 | 133 | 119 | 105 |
| 10% | 250 | 233 | 217 | 201 | 186 | 170 | 155 | 140 | 126 | 111 | 98 | |
| 20% | 240 | 224 | 208 | 193 | 177 | 162 | 147 | 132 | 118 | 104 | 90 | |
| 30% | 231 | 215 | 200 | 184 | 169 | 154 | 139 | 125 | 110 | 97 | 83 | |
| 40% | 222 | 206 | 191 | 175 | 160 | 145 | 131 | 117 | 103 | 89 | 76 | |
| 50% | 213 | 197 | 182 | 167 | 152 | 137 | 123 | 109 | 95 | 82 | 69 | |
| 60% | 204 | 188 | 173 | 158 | 143 | 129 | 115 | 101 | 88 | 75 | 63 | |
| 70% | 195 | 179 | 164 | 149 | 135 | 121 | 107 | 93 | 80 | 68 | 56 | |
| 80% | 185 | 170 | 155 | 140 | 126 | 112 | 99 | 86 | 73 | 61 | 49 | |
| 90% | 176 | 161 | 146 | 132 | 118 | 104 | 91 | 78 | 66 | 54 | 43 | |
| 100% | 166 | 151 | 137 | 123 | 109 | 96 | 83 | 70 | 58 | 47 | 36 | |
| Performance Indicator | Local Plan | Min GHG | Max Rev | Min LF |
|---|---|---|---|---|
| GHG emissions (kt CO2-eq/yr) | 73.5 | −88.7 (−80.6) | 6.1 (19.0) | −19.5 (−5.0) |
| Recovered energy (GWh/yr) | 106.8 * | 69.5 (54.5) | 82.7 (82.7) | 52.0 (67.2) |
| Revenue (million PHP/yr) | 1631 * | 1830 (1203) | 2274 (1488) | 1603 (1366) |
| Landfill waste (kt/yr) | 71.0 | 163.9 (168.2) | 67.3 (83.8) | 67.3 (83.8) |
Publisher’s Note: MDPI stays neutral with regard to jurisdictional claims in published maps and institutional affiliations. |
© 2022 by the authors. Licensee MDPI, Basel, Switzerland. This article is an open access article distributed under the terms and conditions of the Creative Commons Attribution (CC BY) license (https://creativecommons.org/licenses/by/4.0/).
Share and Cite
Olalo, K.F.; Nakatani, J.; Fujita, T. Optimal Process Network for Integrated Solid Waste Management in Davao City, Philippines. Sustainability 2022, 14, 2419. https://doi.org/10.3390/su14042419
Olalo KF, Nakatani J, Fujita T. Optimal Process Network for Integrated Solid Waste Management in Davao City, Philippines. Sustainability. 2022; 14(4):2419. https://doi.org/10.3390/su14042419
Chicago/Turabian StyleOlalo, Kristin Faye, Jun Nakatani, and Tsuyoshi Fujita. 2022. "Optimal Process Network for Integrated Solid Waste Management in Davao City, Philippines" Sustainability 14, no. 4: 2419. https://doi.org/10.3390/su14042419