Article

Application of Fuzzy Analytic Hierarchy Process in Environmental Economics Education: Under the Online and Offline Blended Teaching Mode

1
Shaanxi Key Laboratory of Environmental Engineering, School of Environmental and Municipal Engineering, Xi’an University of Architecture and Technology, Xi’an 710055, China
2
School of Environmental and Municipal Engineering, Xi’an University of Architecture and Technology, Xi’an 710055, China
3
School of Building Services Science and Engineering, Xi’an University of Architecture and Technology, Xi’an 710055, China
4
Xi’an University of Architecture and Technology of South Australia An De College, Xi’an University of Architecture and Technology, Xi’an 710055, China
5
Wuhan Survey Bureau of Hydrology and Water Resources of Hubei Province, Wuhan 430074, China
*
Author to whom correspondence should be addressed.
Sustainability 2022, 14(4), 2414; https://doi.org/10.3390/su14042414
Submission received: 17 December 2021 / Revised: 10 February 2022 / Accepted: 14 February 2022 / Published: 20 February 2022
(This article belongs to the Topic Advances in Online and Distance Learning)

Abstract

:
This study used fuzzy analytic hierarchy process (FAHP) to evaluate students’ performance in an environmental economics course under the mode of online and offline blended teaching (OOBT). OOBT was a new teaching mode combining traditional offline teaching with online teaching platform, which could improve students’ after-class learning efficiency and eliminate the limitations of traditional classroom teaching by using an online teaching platform. However, at present, the evaluation methods of OOBT students’ achievement have been scarce. Therefore, this article adopted FAHP to evaluate students’ performance under OOBT. The evaluated course was environmental economics. The results showed that FAHP was not completely dependent on students’ paper scores, and could evaluate students’ scores from group work, attendance, class discussions, and other aspects. The use of OOBT and FAHP led to overall improvement in students’ scores, the average score increased by 7.38, and 81.55% of students were in the middle grade. The case study showed that the integration of FAHP into OOBT could scientifically assign the weight of each evaluation index, make complex performance evaluation problems organized, and fully reflect the comprehensive quality of students. It could also understand students’ dynamics in time, and continuously optimize the course structure according to the feedback information.

1. Introduction

Thanks to the information age, the online and offline blended teaching mode (OOBT) was created as a new teaching mode that integrates online and offline teaching [1,2]. At the end of 2019, as COVID-19 swept the world [3,4,5], the spring semester of 2020 would be postponed, requiring universities to make full use of online teaching resources and actively carry out online teaching. OOBT is a flexible learning strategy that combines the innovations and technological advances of online learning with the interaction and participation of traditional classroom learning [6], breaking the constraints of traditional offline teaching on time and place, realizing the integration of high-quality resources, and the sharing of rich teaching resources [7] and receiving positive feedback [7,8,9].
The Internet has been applied to online teaching in USA since 1998 [10], but it was not until 2013 that OOBT was presented by Manjot [11] from India. Since then, OOBT has spread as a new teaching method in the field of teaching. Compared with solely online teaching, OOBT has its advantages, but there still exist some issues on evaluating students’ performance.
How to evaluate students’ performance under OOBT mode has become a concern of teachers and students. In previous years, many methods of student achievement evaluation have been proposed and applied by scholars. For example, Alina [12] used an argumentation scoring tool in her elementary language arts class to assess the quality of students’ argumentation in text-based discussions. The argumentation scoring tool focused on assessing the quality of classroom discussions for students and teachers. Most teachers found the argument scoring tool helpful in their practice, but they had some difficulties in understanding it, so the method of assessing student performance should be easy to understand. Gulk [13] used the cumulative scoring system to evaluate students’ teaching achievements in social and art disciplines. Unlike the traditional method of evaluating student performance by final exams, the cumulative scoring system introduced continuous monitoring and a rating-based accumulation system, observed the whole process and scored, and used weighting factors to correct the learning process in time, filling the gap of learning process monitoring. However, cumulative scoring system did not take other performance of students into account. Chaudhari [14] developed a soft computing model for student evaluation. The soft computing model used fuzzy logic and considered subject-wise and other activity performance. Using a computer to evaluate was convenient, but this model lacked practical application. Miyazoe [15] used a performance-centered hybrid learning assessment (PA) method to evaluate students’ performance in an undergraduate English course of a university in Tokyo. PA focused on ability improvement, but lacked a necessary quantification method, and did not take the students’ personality and some subjective factors into account. Alibek [16] used the fuzzy calculation method to evaluate students’ grades and assigned weights to the students’ grades, but the sample size was too small, and the results might be accidental, so it needed as many data as possible to avoid accidental errors. Efendi [17] proposed an optimized weighted fuzzy optimization model to evaluate students’ performance, but the model was more complicated, which might cause problems in application. Therefore, the method should be simple and effective. All of the above methods had their drawbacks. None of these evaluation methods could scientifically evaluate students’ performance and show students’ individuality at the same time. It was worth mentioning that the fuzzy set method could eliminate the fuzzy uncertainty caused by the judgment, but it could not be used to evaluate the weight alone. Therefore, the fuzzy set method must be used together with other classical weight methods. As a common method on assigning weights, analytic hierarchy process (AHP) could further process the data obtained by fuzzy set method. AHP can transform decision making into a hierarchy of related criteria [18], and is widely used in complex decision-making problems in various fields [19]. The fuzzy analytic hierarchy process (FAHP) formed by the combination of fuzzy set method and analytic hierarchy process has solved the uncertainty problem to a large extent, and it is a simple and useful decision-making method.
Therefore, this study would adopt FAHP to evaluate OOBT students’ performance, observe changes in student performance, and determine if FAHP could perform well on assessing student achievement. Based on the undergraduate course Environmental Economics of Xi’an University of Architecture and Technology, online learning data of students would be collected with the help of Superstar Learning Platform in the autumn semesters of the last two years. Combined with the offline learning performance, the establishment of student performance evaluation system gave full play to the advantages of FAHP in the process of assessment, providing reference for building high-quality class and the construction of a scientific and reasonable OOBT performance evaluation system.

2. Methods

The study used a coupling of fuzzy set method and AHP to evaluate student performance. Firstly, the uncertain linguistic variables, proposed by experts, were transformed into mathematical variables and corresponding indicators by the fuzzy set method, and then the students’ achievement evaluation system was constructed by the AHP, and the weights of the indicators were assigned to calculate the final grades. Although the AHP has been widely used and proved, it has still relied on the subjective evaluation of experts and could not be 100% objective [20,21], so the fuzzy set method was introduced to eliminate the subjective interference as much as possible and characterize uncertain factors. The fuzzy set method was to solve the subjective interference in the AHP [22].

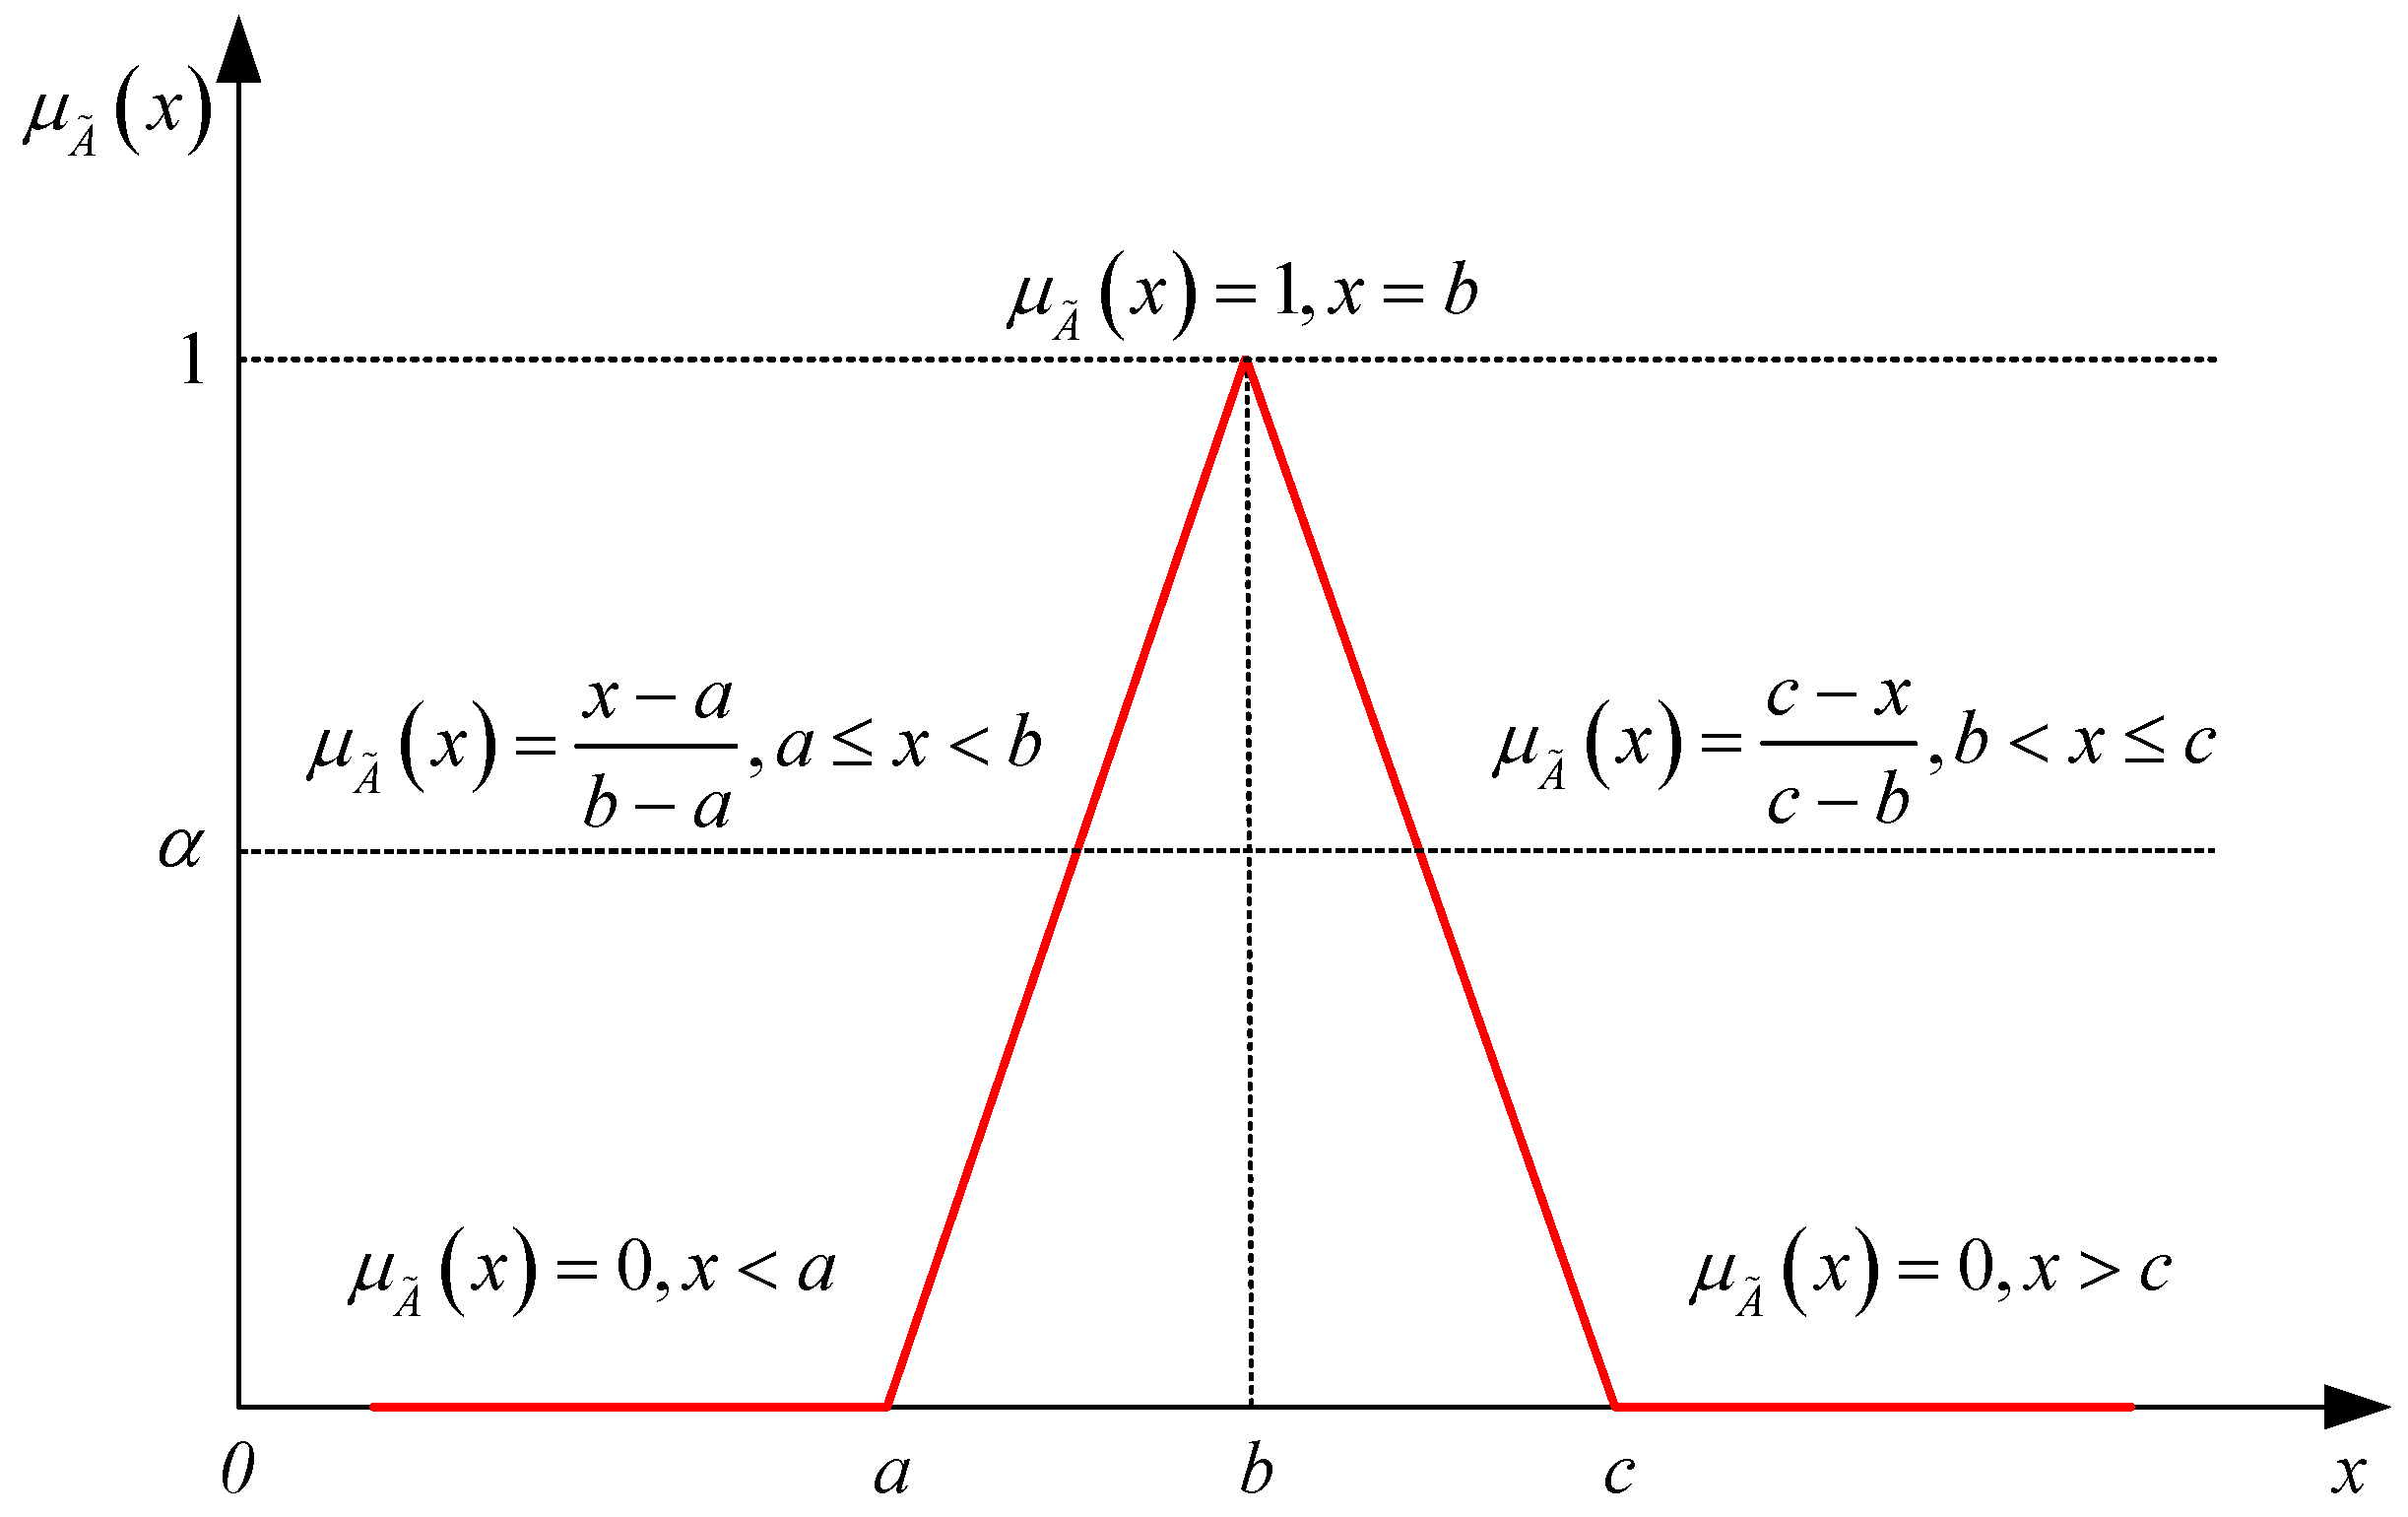
2.1. Fuzzy Set Method

The establishment of fuzzy sets provides a natural way to express problems in which the imprecision was caused by the absence of a clear definition of its membership [23]. For example, the common word “young” was a typical fuzzy concept, and its meaning was easy to express. However, the specific age that could be classified as young cannot give a clear boundary. Therefore, the fuzzy set method was introduced to solve such problems. In a fuzzy set, μ A ˜ ( x ) was called the membership of x with respect to the fuzzy set A ˜   . The closer μ A ˜ ( x ) was to 1, the more likely element x belongs to A ˜   ; on the contrary, the closer μ A ˜ ( x ) was to 0, the more unlikely element x belongs to A ˜   . To build a comparative matrix, a proper membership function is needed when analyzing and solving problems with uncertain information. Here, triangular fuzzy numbers (TFN), often expressed as A ˜ = ( a ,   b ,   c ) , are generally used as the membership function to express the vagueness of the problem because of convenience of calculating. Equation (1) and Figure 1 show the membership function.
μ A ˜ ( x ) = { 0 , x < a x a b a , a x b c x c b , b < x c 0 , x > c
For any two TFNs such as A ˜ 1 = ( a 1 ,   b 1 ,   c 1 ) and A ˜ 2 = ( a 2 ,   b 2 ,   c 2 ) , their arithmetic operations are shown in Chen’s paper [24].

2.2. Fuzzy Analytic Hierarchy Process

Multi-criteria, multi-factor, and multi-objective were included in the performance evaluation system. For such decision-making problems, American operational research scientist Saaty proposed analytic hierarchy process (AHP) as a response [25]. AHP studies the combination of quantitative analysis and qualitative analysis, decomposes the complex multi-criteria decision-making problem into hierarchical structure, determines the importance of each layer of decision-making by pairwise comparison, and obtains the priority weight of each layer relative to the upper layer. After merging, the optimal decision has the highest weight. This method is widely used due to its simplicity and ease of use. Decision makers prefer AHP and its widespread use in the literature [22].
However, in the process of performance evaluation, it is difficult for teachers as decision makers of score evaluation to express the intensity of preference and provide accurate comparison. Therefore, the conventional AHP cannot deal with fuzzy problems. For example, in the performance evaluation containing excellent, good, medium, qualified, and unqualified, the section span was too large. It might cause a fuzzy evaluation, and the results were difficult to distinguish under the same rating.
Scholars proposed to introduce fuzzy sets into AHP to construct a fuzzy analytic hierarchy process (FAHP), construct judgment matrix by pairwise comparison, determine the relative importance of evaluation indicators, and calculate their weights to solve such problems. The fuzzy comprehensive degree Si based on TFN in FAHP is calculated as in Equations (2)–(9) [24].
S i = j = 1 m M i j [ i = 1 n j = 1 m M i j ] 1
j = 1 m M i j = ( j = 1 m a i j , j = 1 m b i j , j = 1 m c i j ) , i = 1 ,   2 ,   ,   n
i = 1 n j = 1 m M i j = ( i = 1 n j = 1 m a i j , i = 1 n j = 1 m b i j , i = 1 n j = 1 m c i j )
[ i = 1 n j = 1 m M i j ] - 1 = ( 1 / i = 1 n j = 1 m c i j ,   1 / i = 1 n j = 1 m b i j ,   1 / i = 1 n j = 1 m a i j )
V ( S j S i ) = h e i g h t ( S i S j ) = { 1 b j b i 0 a i c j ( a i c j ) / [ ( b j c j ) ( b i a i ) ] ,   o t h e r w i s e
V ( S S 1 , S 2 , S 3 , , S k ) = V [ ( S S 1 ) and ( S S 2 ) and ( S S k ) ]   = min V ( S S i )   ,   i = 1 , 2 , 3 , , k
Suppose the weight could be expressed as in Equation (8):
ω = ( d ( A 1 ) , d ( A 2 ) , , d ( A n ) ) T
Then, normalize the weight using Equation (9):
ω i = d ( A i ) ¯ / n = 1 k d ( A n ) ¯
ω = ( ω 1 , ω 2 , , ω k ) is the weight of each factor. Similarly, the weight of sub-factors at the next level can also be calculated.
In order to reduce the influence of teachers’ subjectivity on students’ performance evaluation, it is necessary to design an objective and fair hierarchical structure of examination indicators [20,22,24]. The hierarchical structure divides the various factors in the complex performance evaluation problem into interconnected and orderly levels to make them organized. After the establishment of the hierarchy, it is necessary to compare the factors in each level, construct the judgment matrix, determine the relative importance, and use the appropriate scale value to solve the weight of each index in the hierarchy quantitatively. For such fuzzy problems, Kahraman proposed a triangular fuzzy conversion scale and linguistic scale [26]. The pairwise comparison between factors was obtained by issuing a questionnaire to the expert committee. The questionnaire was filled out in the form of linguistic variables. Linguistic variables were variables composed of words in natural language or artificial language. Compared with digital variables, linguistic variables could better express emotions and judgments, and make more intuitive judgments in pairwise comparison. The conversion scale between linguistic variables and TFN is shown in Table 1.
For a research objects with n factors, the relative importance of factors i and j can be expressed as a ˜ i j = ( a i j , b i j , c i j ) . Each factor is compared in pairs, and the judgment matrix A ˜ = ( a ˜ i j ) n × m can be expressed as Equation (10):
A ˜ = [ 1 a ˜ 12 a ˜ 1 n a ˜ 21 1 a ˜ 2 n a ˜ n 1 a ˜ n 2 1 ] = [ 1 a ˜ 12 a ˜ 1 n 1 / a ˜ 12 1 a ˜ 2 n 1 / a ˜ 1 n 1 / a ˜ 2 n 1 ]
In order to ensure the fairness and credibility of the evaluation results, consistency index and consistency ratio are usually used to measure the consistency of the judgment matrix. When verifying consistency, it is necessary to defuzzify the judgment matrix. Chang proposed a method that could clearly show the preference tendency and risk tolerance of decision makers, and complete the transformation of fuzzy numbers into clear numbers under multi-scenario uncertainty [27].
( a i j α ) λ = [ λ a i j α + ( 1 λ ) c i j α ] ,   0 λ 1 ,   0 α 1
In Equation (11), a i j α = ( b i j a i j ) × α + a i j represents the left endpoint value after α-cut on a i j , while c i j α = c i j ( c i j b i j ) × α represents the right endpoint value after α-cut on a i j . α shows the stable or fluctuating state of teachers’ preference when evaluating students’ performance, and any number between 0 and 1 is available. When α = 0, the uncertainty is the largest, otherwise the uncertainty is the smallest, and the evaluation decision is more stable. Risk tolerance λ refers to the psychological state of teachers in decision making. When λ = 0, this means that the teacher is highly pessimistic, and vice versa. α and λ usually use 0.1, 0.3, 0.5, 0.7, 0.9 numbers to represent different states.
After defuzzifying each TFN in a fuzzy judgment matrix into a clear number, the clean matrix can be expressed as in Equation (12).
[ ( A α ) λ ] = [ ( a i j ) λ ] = [ 1 ( a 12 α ) λ ( a 1 n α ) λ ( a 12 α ) λ 1 ( a 2 n α ) λ ( a n 1 α ) λ ( a n 2 α ) λ 1 ]
A quantitative index to measure the inconsistency of a judgment matrix is called the consistency index (CI). When CI = 0, the judgment matrix is highly consistent. The greater the CI, the more serious the inconsistency of the judgment matrix. The consistency ratio (CR) is defined as a ratio between the consistency of a given evaluation matrix and consistency of a random matrix. RI(n) is a random number, which depends on the dimension of the matrix. If CR ≤ 0.1, the consistency of the matrix satisfies the condition, otherwise the judgment matrix must be adjusted. For more information on CI, please refer to Chen’s paper [24]. More information about the random index of random matrix can be found in Zadeh’s book [23].
The expert committee needed to fill out the opinions according to the questionnaire according to the relevant knowledge reserve. Each questionnaire constituted an independent judgment matrix that contained the experts’ evaluation opinions. In order to unify multiple opinions, it was necessary to aggregate the opinions of experts to form a group consensus matrix A ˜ K = { a ˜ i j k } , where a ˜ i j k = ( a i j , b i j , c i j ) indicated that expert k considered the relative importance of factor i compared with factor j. In Equation (13), the aggregation process of group judgment matrices is represented [24].
a i j = min k = 1 , 2 , , k ( a i j k ) b i j = k 1 k b i j k k c i j = max k = 1 , 2 , , k ( c i j k )

2.3. Steps of Students’ Performance Evaluation

When establishing the performance evaluation system, attention must be fixed on the weight of the evaluation factor and the subfactor. The research steps of this paper were as follows: (1) establish an expert panel of experienced teachers to discuss and revise the student performance indicator hierarchy; (2) understand teachers’ views through language questionnaires and assess the importance of one indicator to another; (3) transform questionnaire content into TFNs with language scale; (4) defuzzify the TFNs, transform fuzzy matrix into clear matrix, and verify the consistency of the questionnaire one by one; (5) aggregate multiple single fuzzy judgment matrices into group fuzzy judgment matrices after passing the inspection; (6) calculate the fuzzy comprehensive degree and solve the factor weight and subfactor weight.

2.4. Environmental Economics

Environmental economics and its related disciplines have trained a large number of environmental talents [28], and could help achieve the optimal allocation of resources to promote sustainable development [29]. Sustainable management of natural resources also requires young professionals [30], and the status of environmental economics in environmental management will also become more prominent [31].

3. Case Analysis

3.1. Data Source

The data in this paper were derived from the online and offline blended teaching courses offered by the College of Environment and Municipal Engineering of Xi’an University of Architecture and Technology. Taking the performance evaluation of environmental economics for 103 undergraduates majoring in environmental science in the past 2 years as an example, comparative analysis and research were carried out. Some students were taught by traditional offline teaching method, and the score evaluation adopted the mode oftest score, which accounted for 70% of the total grades and the usual performance, which accounted for 30% of the total grades. Other students were taught in online and offline blended teaching mode (OOBT), whose performance was evaluated by the process assessment based on FAHP. The data were from the actual performance of offline teaching on the superstar learning platform.
This study invited nine environmental engineering teachers to form an expert committee to explore and formulate a framework of student performance assessment indicators for environmental economics. The framework consisted of six assessment factors, namely, classroom order, communication, attendance, learning status, grouping tasks, and knowledge-point examination. Each factor was divided into subfactors, as shown in Table 2.
The rationality of the indicator system referred to the comprehensive consideration [32] of online and offline levels and the indicators involved. The relevant data and materials were consulted during the design [33,34,35,36,37], the front-line teachers were also asked, and the evaluation indicators were designed as objectively and comprehensively as possible. Among the established indicators, factors such as classroom order [33,37], communication [33,34,35,36,37], checking work attendance [33,34,35,36,37], learning state [34,37], grouping tasks [33,34,35,37], and examination of knowledge points [33,34,35,36] are included. The actual student achievement conformed to the teaching law for many years, which also proved the rationality of the indicator system. The integrity of the indicator system refers to the comprehensive observation of elements [38]. It was necessary to pay attention not only to the changes in a single element, but also to the coupling relationship and action process between each element, so as to systematically grasp the overall change in students’ grades [38].

3.2. Result Analysis

The FAHP was used to process and analyze the data. Firstly, the relative importance was collected by questionnaire survey for the expert committee. Then, the linguistic variables in the questionnaire were transformed into mathematical variables to construct the fuzzy judgment matrix. Finally, defuzzification was carried out and the consistency of the judgment matrix was tested one by one. In this study, α = 0.5 and λ = 0.5 indicated that the uncertainty of the environment does not fluctuate during decision making. Nine judgment matrices were aggregated by using Equation (13). The representative group fuzzy judgment matrix is shown in Table 3.
Table 3 was defuzzified as shown in Table 4. It was verified that the clear judgment matrix CR = 0.00784, and the results met the consistency test. Similarly, the fuzzy judgment matrix of subfactors was transformed into a clear judgment matrix, and the consistency was tested one by one, with all meeting the requirements.
The fuzzy comprehensive degree Si was calculated by using Equations (2)–(5) and the group fuzzy judgment matrix of Table 4 was calculated. The results were S1 = (0.039, 0.132, 0.603), S2 = (0.040, 0.168, 0.682), S3 = (0.041, 0.162, 0.813), S4 = (0.042, 0.197, 0.708), S5 = (0.040, 0.171, 0.708), and S6 = (0.041, 0.172, 0.603).
The relative importance of the factors in the student performance evaluation system through Equations (7)–(9) is shown in Table 5.
ω’ = (0.896, 0.956, 0.957, 1, 0.962,0.957)T. Normalized by Equation (14), factor weight ω = (ω1, ω2, ω3, ω4, ω5, ω6)T= (0.156, 0.166, 0.167, 0.174, 0.170, 0.167)T. Similarly, the weight of subfactors can be obtained in turn: ω1 = (0.504, 0.496)T, ω2 = (0.488, 0.512)T, ω3 = (0.297, 0.385, 0.318)T, ω4 = (0.372, 0.297, 0.331)T, ω5 = (0.482, 0.518)T, ω6 = (0.520, 0.480)T.
This course evaluates students’ scores according to students’ performance in class, online data, group report, and other forms. Each index score was 100%, and the weight of the index was the actual score of the students, as shown in Table 6.
The teaching effect of the curriculum was shown in Figure 2. The use of double-pronged OOBT and FAHP process assessment led to an overall improvement in students’ scores and the average score increased by 7.38. All students achieved the qualified standard (scored 60), of which 84 students were in the middle score segment (scored 70–89), accounting for 81.55% of the total. There were eight people in the high segment (scored 90–100), accounting for 7.77% of the total. Meanwhile, the evaluation of students was more objective. In addition, with the teaching methods and contents feedback optimized, the assessment methods were open and transparent and each score of the performance was well-founded. It also could warn students with low scores. The cancellation of the face-to-face examination eliminates the fear and resistance of some students to the final examination, and increases their enthusiasm for learning. At the same time, online teaching resources could broaden students’ horizons, cultivate students’ self-learning ability, and improve their enthusiasm for learning environmental economics.

4. Conclusions

In this paper, fuzzy analytic hierarchy process (FAHP) was used to evaluate students’ performance, and the indexes in the evaluation system were quantitatively analyzed. FAHP reduced the influence of subjective factors in the process evaluation scoring system and made the weight of each evaluation index clear. On the one hand, the influence of subjective factors in the process evaluation scoring system was reduced, and the weight of each evaluation index was clarified; on the other hand, the teaching effect of OOBT could be tested, and the teaching arrangement could be adjusted in time according to students’ feedback. FAHP overcame the uncertainty of OOBT, and provided a detailed calculation process which could be quickly completed by computer. Case studies showed that the integration of FAHP into OOBT could scientifically and fairly allocate the weight of each evaluation index, and made the complex problem of performance evaluation organized, and the overall performance of students followed the normal distribution, which accorded with the teaching law. In addition, FAHP could highlight the student’s personality, and the comprehensive quality of students was fully reflected. What is more, the students’ dynamics could be understood in time. The curriculum structure was continuously optimized according to the feedback information, which could help to build high-quality courses.
The improvement in OOBT students’ average score evaluated by FAHP might have the following reasons: (1) The process assessment was more complete, which enabled students to learn actively and improved learning positivity. (2) Group discussions and class speeches deepened the impression of knowledge points. (3) In addition to offline course exams, online exercises could also help students better master knowledge, and the addition of excellent online resources could also improve students’ subjective initiative. (4) The addition of normal grades such as sign-in reduced the occurrence of skipping classes and improved the effectiveness of teaching.
This study only evaluated student performance in environmental economics courses. It is hoped that it can be used as a reference for the application of FAHP on student performance evaluation of other disciplines in the future. We also hope that other disciplines can further make applications of this method in the future, and explore the feedback from more perspectives. Further studies are needed to establish whether teaching software that matches different online teaching platforms, has high visualization, simple operation, wide application scope, and provides performance warning and other functions could be developed.

Author Contributions

Investigation, Y.L. (Yalin Liu); methodology, Y.Z.; project administration, Y.L. (Yanzheng Liu); supervision, Q.L.; validation, Y.C. and Q.Z.; writing—original draft, Y.Z.; writing—review & editing, J.T. All authors have read and agreed to the published version of the manuscript.

Funding

This work was supported by the First-class Professional Sub-project in Shaanxi Province (Project Nos. YLZY0303C02), Key Scientific Research Project of Education Department of Shaanxi Province (Project Nos. 21JT025), and First-class Professional Sub-project in Xi’an University of Architecture and Technology (Project Nos. YLZY1301K02).

Institutional Review Board Statement

Not applicable.

Informed Consent Statement

Not applicable.

Data Availability Statement

Please contact the corresponding author.

Acknowledgments

The authors are grateful to the editors and the anonymous reviewers for their insightful comments and helpful suggestions.

Conflicts of Interest

The authors declare no conflict of interest.

References

  1. Yen, S.C.; Lo, Y.; Lee, A.; Enriquez, J.M. Learning online, offline, and in-between: Comparing student academic outcomes and course satisfaction in face-to-face, online, and blended teaching modalities. Educ. Inf. Technol. 2018, 23, 2141–2153. [Google Scholar] [CrossRef]
  2. Marie, S.M.J.A. Improved pedagogical practices strengthens the performance of student teachers by a blended learning approach. Soc. Sci. Humanit. Open 2021, 4, 100199. [Google Scholar] [CrossRef]
  3. Alvarez-Risco, A.; Mlodzianowska, S.; García-Ibarra, V.; Rosen, M.A.; Del-Aguila-Arcentales, S. Factors Affecting Green Entrepreneurship Intentions in Business University Students in COVID-19 Pandemic Times: Case of Ecuador. Sustainability 2021, 13, 6447. [Google Scholar] [CrossRef]
  4. Alvarez-Risco, A.; Del-Aguila-Arcentales, S.; Yáñez, J.A.; Rosen, M.A.; Mejia, C.R. Influence of Technostress on Academic Performance of University Medicine Students in Peru during the COVID-19 Pandemic. Sustainability 2021, 13, 8949. [Google Scholar] [CrossRef]
  5. Alvarez-Risco, A.; Del-Aguila-Arcentales, S.; Rosen, M.A.; García-Ibarra, V.; Maycotte-Felkel, S.; Martínez-Toro, G.M. Expectations and Interests of University Students in COVID-19 Times about Sustainable Development Goals: Evidence from Colombia, Ecuador, Mexico, and Peru. Sustainability 2021, 13, 3306. [Google Scholar] [CrossRef]
  6. Müller, C.; Mildenberger, T. Facilitating flexible learning by replacing classroom time with an online learning environment: A systematic review of blended learning in higher education. Educ. Res. Rev. 2021, 34, 100394. [Google Scholar] [CrossRef]
  7. Suwannaphisit, S.; Anusitviwat, C.; Tuntarattanapong, P.; Chuaychoosakoon, C. Comparing the effectiveness of blended learning and traditional learning in an orthopedics course: A retrospective cohort study. Ann. Med. Surg. 2021, 72, 103037. [Google Scholar] [CrossRef]
  8. Yigit, T.; Koyun, A.; Yuksel, A.S.; Cankaya, I.A. Evaluation of Blended Learning Approach in Computer Engineering Education. Procedia-Soc. Behav. Sci. 2014, 141, 807–812. [Google Scholar] [CrossRef] [Green Version]
  9. Farahani, I.; Laeer, S.; Farahani, S.; Schwender, H.; Laven, A. Blended learning: Improving the diabetes mellitus counseling skills of German pharmacy students. Curr. Pharm. Teach. Learn. 2020, 12, 963–974. [Google Scholar] [CrossRef]
  10. Jerold, W.; Wallis, J.; Parker, A. Use of the internet for teaching in nuclear medicine. Semin. Nucl. Med. 1998, 28, 165–176. [Google Scholar]
  11. Kaur, M. Blended Learning - Its Challenges and Future. Procedia-Soc. Behav. Sci. 2013, 93, 612–617. [Google Scholar] [CrossRef] [Green Version]
  12. Reznitskaya, A.; Wilkinson, I.A. The Argumentation Rating Tool: Assessing and supporting teacher facilitation and student argumentation during text-based discussions. Teach. Teach. Educ. 2021, 106, 103464. [Google Scholar] [CrossRef]
  13. Gulk, E.B.; Kasyanik, P.M.; Zakharov, K.P.; Olennikova, M.V.; Nazarov, D.A. Academic performance assessment based on accumulative rating system at polytechnic university. Adv. Intell. Syst. Comput. 2018, 716, 251–260. [Google Scholar]
  14. Chaudhari, O.K.; Gupta, R.; Thakre, T.A. Soft computing model for students’ evaluation in educational institute. In Proceedings of the International Conference on Research Frontiers in Sciences, Nagpur, India, 5–6 February 2021; IOP Publishing Ltd.: Wales, England, 2021. [Google Scholar]
  15. Miyazoe, T. Students’ Evaluation of Performance-Centred Blended Learning Assessment in Japan: Can-Do and Cannot-Do Notions. In Proceedings of the 14th International Conference on Blended Learning, Nagoya, Japan, 10–13 August 2021; Springer Science and Business Media Deutschland GmbH: Berlin/Heidelberg, Germany, 2021. [Google Scholar]
  16. Barlybayev, A.; Sharipbay, A.; Ulyukova, G.; Sabyrov, T.; Kuzenbayev, B. Student’s Performance Evaluation by Fuzzy Logic. Procedia Comput. Sci. 2016, 102, 98–105. [Google Scholar] [CrossRef] [Green Version]
  17. Nasibov, E.N.; Kinay, A.Ö. An iterative approach for estimation of student performances based on linguistic evaluations. Inf. Sci. 2009, 179, 688–698. [Google Scholar] [CrossRef]
  18. Wang, F.; Yeap, S.P. Using magneto-adsorbent for methylene Blue removal: A decision-making via analytical hierarchy process (AHP). J. Water Process Eng. 2021, 40, 101948. [Google Scholar] [CrossRef]
  19. Han, B.B.; Ming, Z.F.; Zhao, Y.H.; Wen, T.; Xie, M.L. Comprehensive risk assessment of transmission lines affected by multi-meteorological disasters based on fuzzy analytic hierarchy process. Int. J. Electr. Power Energy Syst. 2021, 133, 107190. [Google Scholar] [CrossRef]
  20. Liu, Y.; Eckert, C.M.; Earl, C.A. A review of fuzzy AHP methods for decision-making with subjective judgements. Expert Syst. Appl. 2020, 161, 113738. [Google Scholar] [CrossRef]
  21. Zalhaf, A.S.; Elboshy, B.; Kotb, K.M.; Han, Y.; Almaliki, A.H.; Aly, R.M.H.; Elkadeem, M.R. A High-Resolution Wind Farms Suitability Mapping Using GIS and Fuzzy AHP Approach: A National-Level Case Study in Sudan. Sustainability 2022, 14, 358. [Google Scholar] [CrossRef]
  22. Tsai, H.C.; Lee, A.S.; Lee, H.N.; Chen, C.N.; Liu, Y.C. An application of the fuzzy delphi method and fuzzy AHP on the discussion of training indicators for the regional competition. Taiwan National Skills Competition, in the Trade of Joinery. Sustainability 2020, 12, 4290. [Google Scholar] [CrossRef]
  23. Zadeh, L.A. Fuzzy sets. Inf. Control. 1965, 8, 338–353. [Google Scholar] [CrossRef] [Green Version]
  24. Chen, J.F.; Hsieh, H.N.; Do, Q.H. Evaluating teaching performance based on fuzzy AHP and comprehensive evaluation approach. Appl. Soft Comput. 2015, 28, 100–108. [Google Scholar] [CrossRef]
  25. Saaty, L.T. How to make a decision. The analytic hierarchy process. Eur. J. Oper. Res. 1990, 48, 9–26. [Google Scholar] [CrossRef]
  26. Kahraman, C.; Ertay, T.; BüyüköZkan, G. A fuzzy optimization model for QFD planning process using analytic network approach. Eur. J. Oper. Res. 2006, 171, 390–411. [Google Scholar] [CrossRef]
  27. Chang, C.W.; Wu, C.R.; Lin, H.L. Applying fuzzy hierarchy multiple attributes to construct an expert decision-making process. Expert Syst. Appl. 2009, 36, 7363–7368. [Google Scholar] [CrossRef]
  28. Tong, Y.F.; Zhou, W. Development and challenge: Review on China’s Population, Resources and Environmental Economics in past 20 years. China Popul. Resour. Environ. 2018, 28, 171–176. [Google Scholar]
  29. Bender, S. Environmental economics and ecological economics: The contribution of interdisciplinarity to understanding, influence and effectiveness. Environ. Conserv. 2011, 38, 140–150. [Google Scholar] [CrossRef] [Green Version]
  30. Saidan, M.; Hayek, B.A.; Hmoud, N.A.; Maradan, D.; Zein, K. Environmental meso-economics in university curriculum: New master program in environmental technology and management. Clean Technol. Environ. Policy 2011, 13, 191–194. [Google Scholar] [CrossRef]
  31. Wang, J.N.; Lu, Y.T.; Cao, D. The Updated Progress and Perspective of Environmental Economics in China. China Popul. Resour. Environ. 2004, 14, 27–31. [Google Scholar]
  32. Huang, W.P.; Li, J. The Construction of the Evaluation System of Students’ Achievement in Ideological and Political Theory Courses in Higher Vocational Colleges. West. China Qual. Educ. 2019, 5, 22–24. [Google Scholar]
  33. Wang, Y.Y.; Mi, L.A.; Li, Y.L. How to Evaluate Students’ Achievements in Distance Education. Distance Educ. China 1999, Z1, 57–60, 76. [Google Scholar]
  34. Pang, F.J.; Zhou, W.H. The application of fuzzy comprehensive evaluation model in the evaluation of course achievement of college students. J. Archit. Educ. Inst. High. Learn. 2018, 27, 119–121. [Google Scholar]
  35. Yang, G.R.; Zhang, X.J. Research on Evaluation Method and lndex System of ln-post Practice for Design Majors in Higher Vocational Colleges. Vocat. Tech. Educ. 2021, 42, 57–61. [Google Scholar]
  36. Zhu, M.; Yu, Z.; Liu, H.R. Evaluation System of Higher Mathematics Course in Colleges Based on the Analysis of AHP. Educ. Forum 2021, 4, 136–140. [Google Scholar]
  37. Yin, X.H.; Zhang, Y.; Wang, J.H. Construction and Practice of Mixed Teaching Evaluation Index System for Applied Colleges and Universities—Take Computer Network Basis Course for Example. Educ. Forum 2021, 9, 5–10. [Google Scholar]
  38. Qian, J.L.; Yang, B.; Zhang, H.; Yang, H.W.; Tan, C.H.; Dai, X. Development of an indicator system of wetland resources based on multidimensional comprehensive observation. Resour. Sci. 2020, 42, 1921–1931. [Google Scholar]
Figure 1. A triangular fuzzy number.
Sustainability 14 02414 g001
Figure 2. Score statistics of environmental science students. The horizontal axis indicated grade sections, while the vertical axis showed the number of students.
Sustainability 14 02414 g002
Table 1. The conversion relation between linguistic scale and fuzzy scale.
Linguistic ScaleTriangular Fuzzy Scale Triangular Fuzzy
Reciprocal Scale
Identical(1, 1, 1)(1, 1, 1)
Equally important(1/2, 1, 3/2)(2/3, 1, 2)
Weakly more important(1, 3/2, 2)(1/2, 2/3, 1)
Strongly more important(3/2, 2, 5/2)(2/5, 1/2, 2/3)
Very strongly more
important
(2, 5/2, 3)(1/3, 2/5, 1/2)
Absolutely most important(5/2, 3, 7/2)(2/7, 1/3, 2/5)
Table 2. Hierarchical structure of student performance index.
Assessment FactorsSubfactors
Classroom order (U1)Discipline in class (U11)
Network classroom discipline (U12)
Communication (U2)Group discussion (U21)
Online topic discussion (U22)
Check work attendance (U3)Late arrival and early departure (U31)
Absenteeism (U32)
Number of online task points completed (U33)
Learning state (U4)Classroom listening (U41)
Online reading duration (U42)
Question answering (U43)
Grouping tasks (U5)Data making (U51)
Data report (U52)
Examination of knowledge points (U6)Homework completion (U61)
Chapter test (U62)
Table 3. Group fuzzy judgment matrix.
U1U2U3U4U5U6
U1(1, 1, 1)(0.4, 0.702, 2)(0.4, 0.847, 2)(0.4, 0.685, 2)(0.4, 0.693, 2)(0.5, 0.902, 2.5)
U2(0.5, 1.423, 2.5)(1, 1, 1)(0.4, 1.013, 2.5)(0.5, 0.914, 2.5)(0.333, 0.976, 2.5)(0.4, 0.809, 2)
U3(0.5, 1.180, 3)(0.4, 0.987, 2.5)(1, 1, 1)(0.4, 0.896, 3)(0.4, 0.867, 3)(0.5, 0.986, 3)
U4(0.5, 1.442, 2.5)(0.4, 1.013, 2.5)(0.4, 1.168, 2.5)(1, 1, 1)(0.5, 1.397, 2.5)(0.5, 1.182, 2.5)
U5(0.5, 1.292, 3)(0.4, 0.980, 3)(0.333, 1.262, 2.5)(0.4, 0.716, 2)(1, 1, 1)(0.5, 1, 2)
U6(0.4, 1.109, 2)(0.5, 1.236, 2.5)(0.4, 1.015, 2)(0.4, 0.885, 2)(0.5, 1.046, 2)(1, 1, 1)
Table 4. Group clear judgment matrix.
U1U2U3U4U5U6
U11.0000.9511.0240.9430.9471.201
U21.0521.0001.2571.2071.2381.005
U30.9770.7961.0001.2981.2841.368
U41.0610.8290.7701.0001.4491.341
U51.0570.8080.7790.6901.0001.125
U60.8330.9960.7310.7460.8891.000
Table 5. Comparison of fuzzy comprehensive degree V (SiSj).
V (S1Sj) V (S2Sj) V (S3Sj) V (S4Sj) V (S5Sj) V (S6Sj)
V (S1S2)0.940V (S2S1)1V (S3S1)1V (S4S1)1V (S5j1)1V (S6S1)1
V (S1S3)0.949V (S2S3)1V (S3S2)0.992V (S4S2)1V (S5S2)1V (S6S2)1
V (S1S4)0.896V (S2S4)0.956V (S3S4)0.957V (S4S3)1V (S5S3)1V (S6S3)1
V (S1S5)0.935V (S2S5)0.995V (S3S5)0.988V (S4S5)1V (S5S4)0.962V (S6S4)0.957
V (S1S6)0.933V (S2S6)0.994V (S3S6)0.987V (S4S6)1V (S5S6)0.999V (S6S5)1
Table 6. Calculation table of students’ comprehensive scores.
Examination
Content
(Factors)
Assessment Indicators
(Subfactors)
WeightScore of this ItemWeighted Score
Classroom orderDiscipline in class0.079806.320
Network classroom discipline0.077856.545
CommunicationGroup discussion0.081826.642
Online topic discussion0.085756.375
Check work attendanceLate arrival and early departure0.049904.410
Absenteeism0.0641006.400
Number of online task points completed0.054924.968
Learning stateClassroom listening0.065785.070
Online reading duration0.052824.264
Question answering0.072705.040
Grouping tasksData making0.082786.396
Data report0.088817.128
Examination of knowledge pointsHomework completion0.087786.786
Chapter test0.080745.920
Comprehensive evaluation score82.264
Publisher’s Note: MDPI stays neutral with regard to jurisdictional claims in published maps and institutional affiliations.

