Article

Forecast of Electric Vehicle Sales in the World and China Based on PCA-GRNN

1
School of Electrical Engineering and Artificial Intelligence, Xiamen University Malaysia, Sepang 43900, Malaysia
2
College of Ocean Information Engineering, Jimei University, Xiamen 361021, China
*
Author to whom correspondence should be addressed.
Sustainability 2022, 14(4), 2206; https://doi.org/10.3390/su14042206
Submission received: 7 January 2022 / Revised: 31 January 2022 / Accepted: 10 February 2022 / Published: 15 February 2022
(This article belongs to the Topic Frontier Research in Energy Forecasting)

Abstract

:
Since electric vehicles (EVs) could reduce the growing concerns on environmental pollution issues and relieve the social dependency of fossil fuels, the EVs market is fast increased in recent years. However, a large growth in the number of EVs will bring a great challenge to the present traffic system; thus, an acceptable model is necessary to forecast the sales of EVs in order to better plan the appropriate supply of necessary facilities (e.g., charging stations and sockets in car parks) as well as the electricity required on the road. In this study, we propose a model to predict the sales volume and increase rate of EVs in the world and China, using both statistics and machine learning methods by combining principle component analysis and a general regression neural network, based on the previous 11 years of sales data of EVs. The results indicate that a continuing growth in the sales of EVs will appear in both the world and China in the coming eight years, but the sales increase rate is slowly and continuously deceasing because of the persistent growth of the basic sales volume. The results also indicate that the increase rate of sales of EVs in China is higher than that of the world, and the proportion of sales of EVs in China will increase gradually and will be above 50% in 2025. In this case, large accessory facilities for EVs are required in China in the coming few years.

1. Introduction

The continuously augmented threat of global climate change, environment deterioration, and resource absence due to the increasing consumption of non-renewable fossil fuels has been a world-wide problem, which needs to be resolved in the near future for human sustainable development. With the speeding of industrialization process and the growth of the development of the economy, large quantity consumption of energy resources based on fossil fuels has resulted in the worsening of the ecological environment and rising carbon dioxide emissions, the main greenhouse gas [1]. In the past twenty years, the World Environmental Organization and several other international organizations have been working on environmental protection for sustainable development [2]. With the continuing development of civil industries, China has a strong foreign dependence of crude oil, up to 60% since 2013 [3,4,5]. In this case, the future economic growth would be greatly affected based on the supply of traditional fossil fuels from overseas. On the other hand, with the enhancement of industry and economics, the quantity of motor vehicles is quickly increasing in the world, which not only results in the consumption of large amount of fossil fuels (e.g., oil and natural gas) but also the release of abounding greenhouse gases, sulfur dioxide, oxynitride, and microparticles into the atmosphere, which cause the temperature to increase and the formation of haze [6,7]. Since 2013, the CO2 emissions from vehicles accounted for 15.9% of total carbon dioxide emissions in the world [8]. Therefore, the switch towards a substantially carbon-free and energy-efficient transport mode is an ongoing global goal. The electrification of the transportation via the development of electrical vehicles (EVs) is considered to be a promising pathway for many countries to reduce the air pollution from on-road vehicles as well as to reduce fossil fuels dependence in order to strengthen national energy security [9,10,11,12,13]. For example, EVs are an important technology in reducing greenhouse gases emission in the European Union to achieve the targets of decarbonizing the energy sector [14].
Currently, even though the adoption of EVs is influenced by many barriers, such as high retail prices, the limited range of rechargeable batteries, and the lack of supporting infrastructure [15], in particular charging stations and electricity grid network [16], the spread of EVs is still encouraged by many governments; for example, in 2030, Germany will not produce fossil fuel-consuming vehicles. The popularization of EVs requires supplying the necessary charging grid for these vehicles throughout all countries. Moreover, to ensure there are enough charging sockets for EVs, they will need to be encountered in multiplicity in car parks, homes, working places, shopping centers, and roads [17]. Consequently, the electricity demand will cause a momentous increase in road power stations, which is not set up well currently. In this case, it is necessary to forecast the sales volume of EVs, which would be accomplished by using reference data for a city or country to subsequently build up the supporting infrastructure for the popularization of EVs.
In recent years, mainly two approaches have been utilized to forecast the future amounts of products (such as EVs and their charging loads [18,19]), i.e., statistical and machine learning methods. For the former, time series analysis [20], grey theory [21], autoregressive integral moving average model [22], exponential smoothing method [23], Monte Carlo simulation method [24], and Kalman filtering [25] are widely applied. However, the randomness of personal behavior induces a strong influence on the accuracy and strength of the prediction results. Consequently, machine learning technology has demonstrated its effectiveness for short-tern forecasting [26].
Principle component analysis (PCA) is a dimension reduction technique, which linearly transforms the original space into a new one with a smaller dimension and simultaneously describes the variability of the original data as much as possible. After the original data are decomposed, the amount of information data becomes very huge with all of the sub-bands, and consequently the dimension of the feature space is too high, which results in a large amount of computation. For this case, a reasonable route of data dimension reduction with minimizing the loss of the original data information needs to be set up [27]. Based on this principle, PCA constructs a set of orthogonal bases to project the high dimensional data to a hyperplane and then converts them to relatively low dimensional ones [28]. As the model of dimension reduction, PCA mainly operates by creating a few new variables, which are uncorrelated from the original variables and retain the most information on the original variables as high as possible [29]. Using the PCA method, we can speed up the training and recognition process of classifiers with less, but still the most representative data. A general regression neural network (GRNN) is a parallel radial basis neural network [30] consisting of four layers: input, pattern, summation, and output [31,32], which has a strong non-linear mapping ability and flexible network structure as well as high-fault tolerance and robustness. It has a great advantage in the approximation ability and learning speed [33]. The relevant inputs used for GRNN training are often quite subjective, and the type of input variables used for training can vary across different noise engineers due to their experience.
In this article, we combine PCA and GRNN to predict the sales of EVs in the world and China based on the sales data in previous 11 years; moreover, the effect of the sales of EVs in China on the sales of EVs in the world is also presented. However, the sales of EVs and electricity grid forecasting have been previously reported with different approaches and point of views [34,35,36]; the current study proposes a model to forecast the quantified market demand for EVs based on both the sales volume and an increase rate based on artificial intelligence, which has rarely been reported previously. The motivation of this work is to offer an assisting reference for energy dispatching of electricity grid and facilitate the operational efficiency of charging EVs. The main contribution of this article is to develop an easy model for forecasting the sales of EVs in a faster and more direct approach based on both statistical (PCA) and machine learning (GRNN) methods [37,38,39], which would help us to adjust or reformulate some technology tactics and market measurements according to the forecast results. However, due to the limited data that is applied and the one-step ahead forecasting that is considered in this paper, plus that the effects of political and economic policies are not considered, the current model may exist with some limitations; for this case, a model with multiple variables for the forecasting of the sales of EVs is highly expected in future studies.

2. Methodologies

2.1. PCA Model Establishment

The PCA algorithm model serves as the theoretical basis for our research on the sales of EVs, which eliminates redundant data items and allows the data to be more directly displayed.
(1)
Derivation and ideological basis
First, we select item data among the variational data, which can generally summarize or replace the original data we want to apply. For example, suppose that we have an n- dimensional data set, which has m data in total, described as x(1), x(2), …, x(m). If the n dimension of the m date is going to be reduced to n’, due to the dimension reduction, some data should be discarded, which will inevitably cause certain losses to the final result. When n = 2, and n’ = 1, we need to reduce these m data from a 2-dimension (2D) model to 1D. The data on a 2D model can be understood as the arbitrary distribution of points scattered on a plane as should in Figure 1. When reduce to 1D, the point arbitrarily distributed on this plane is picked out by the method of minimum loss to become a point on a line. Essentially, PCA takes the direction with the largest variance as the main characteristic and de-correlates the data in each orthogonal direction; that is, it makes them uncorrelated in a different orthogonal direction.
In this 2D plane, as displayed in Figure 1, all scattered points can establish coordinate bases, and these coordinates can be in any direction. However, in these vector bases, two vector directions are shown, as indicated with U1 and U2. Obviously, U1 must be more representative of the original data than U2. Firstly, the linear distance from each data of the sample data to the vector direction U1 is shorter than U2; secondly, the projection of the sample data group in this vector direction is as scattered as possible compared with U2. Therefore, combined with the dimension reduction idea and algorithm standard, we can clearly deduce two equivalent models of PCA. Since only one derivation conclusion is needed, in this model, only the linear distance of the distribution points is unilaterally applied for the formula derivation.
(2)
PCA equivalent derivation of model based on minimum linear distance
Supposing an n-dimension data group, which has m number data (x(1), x(2), x(3), , x(m)), which have been all centralized; i.e., new coordinates can be obtained through projection {w1, w2, w3, …, wn}, where w is the orthogonal basis; i.e., if we reduce these sample data from n dimension to n’ dimension, we need to discard some of the new coordinates, the new coordinate system is {w1′, w2′, w3′,…, wn’}. Thus, we obtain the projection of sample point x(i) in n’ dimensional coordinate system is z(i) = (z1′(i), z2′(i), z3′(i), , zn’(i))T. Recover the original data x(i) with z(i), then,
x ( i ) = j = 1 n z j ( i ) w j = W z ( i )  
where w is the matrix composed of standard orthogonal basis.
After we analyze the data, we can consider standardizing the entire sample, thus we need to minimize the formula,
i = 1 m x ¯ ( i ) x ( i ) 2 2
in view of the space requirements, we directly calculate the results,
i = 1 m x ¯ ( i ) x ( i ) 2 2 = t r ( W T X X T W ) + i = 1 m x ( i ) T x ( i )
i = 1 m x ( i ) T x ( i ) is the covariance matrix of sample data, W is the composition of each orthogonal standard basis wj, which is a constant; therefore, we can get the minimum equivalent expression by fixing the value of the constant and changing the operation the covariance matrix. In this way, we get the matrix W composed of n’ eigenvectors, which is the matrix we need. The matrix we need is the matrix composed of the above n′ vectors. Through observation, we can find the eigenvector corresponding to the minimum W and the maximum n′ eigenvalues of the covariance matrix XXT. As for the processing method of the original data group, the dimensionality reduction of the original data can be realized only by using. PCA is a statistical analysis method, which separates multiple variables into a few comprehensive indicators. It can optimize the parameter selection and improve the prediction accuracy of the model [39].

2.2. GRNN

GRNN is based on nonparametric kernel regression, and the sample data are used as a posteriori probability verification condition and nonparametric estimation [38]. The correlation density function between dependent variables and independent variables in GRNN network is calculated from the training samples; therefore, the regression value of the dependent variable to the independent variable is calculated. Supposed that two random variables x and y are in GRNN neural network, the joint probability density function is f (x, y), and the observation sample X, the conditional mean is
Y ¯ = E ( y | X ) = + y f ( X ,   y ) d y + f ( X ,   y ) d y
For the unknown probability density function f(x,y), it can be obtained by nonparametric estimation based on the observed samples of X and y,
f ¯ ( X , Y ) = 1 2 π ( p + 1 2 ) δ ( p + 1 ) n × i = 1 n e x p [ ( X X i ) T ( X X i ) 2 δ 2 ] e x p [ ( Y Y i ) 2 δ 2 ]
wherein, the variables Xi and Yi represent the observed values of random variables X and Y respectively; variable δ represents the smoothing factor; The variable n represents the number of samples; The variable p represents the dimension of the random variable x.
Y ¯ = i = 1 n { e x p [ ( X X i ) T ( X X i ) 2 δ 2 ] + y e x p [ ( y Y i ) 2 2 δ 2 ] d y } i = 1 n { e x p [ ( X X i ) T ( X X i ) 2 δ 2 ] + e x p [ ( y Y i ) 2 2 δ 2 ] d y }
after simplified,
Y ¯ = i = 1 n Y i e x p [ ( X X i ) T ( X X i ) 2 δ 2 ] i = 1 n e x p [ ( X X i ) T ( X X i ) 2 δ 2 ]

2.3. Prediction Model Based PCA-GRNN

Figure 2 illustrates the schematic diagram of the prediction steps based on the PCA-GRNN model, and the steps are described directly in the processes. Step 1 combines survey data with those from the literature, Step 2 assigns values to the primary influencing factors and perform standardization and dimensionless processing, Step 3 uses PCA to process curve fitting data analysis, Step 4 uses the above optimized index data for GRNN cycle training, combining the known survey data to test the prediction results of the training model and determine the error with optimal smoothing factor SPREAD, and, finally, Step 5 applies the optimized PCA-GRNN model to predict the car sales.

3. Based Historic Data

3.1. Global Market Status of EVs

Figure 3 shows the sales data of EVs in the previous 11 years, obtained from the global market reported at “2020–2026 China New Energy Vehicle Industry Development Risk Assessment and Development Prospect Analysis Report” and Global EV outlook 2021 by International Energy Agency [40]. The global sales of EVs in 2010 was about 17.0 thousand, and then grown up to 40.0 thousand in 2011. In 2012, the number was 100.0 thousand, and that kept growing up to 549.0 thousand in 2015. It was 774.4 thousand in 2016, and 1224.1 thousand in 2017; the sales volume then quickly increased above 2000 thousand in 2018, before a slow increase in 2019; however, fast growth was again found in 2020, which reached 3240.0 thousand. According to data reported in Figure 3, the annual growth rate of the sales of EVs from 2011 to 2020 is presented in Figure 4. In the initial years (from 2011 to 2013), the growth rates were above 100% due to relatively small sales volume, however, in 2014 it decreased to about 40%. In 2015, the growth rate of EVs in the world was 74.1%. The growth rate in 2016 decreased to 41.0%, and then increased to 58.1% in 2017, further to 64.8% in 2018, but surprisingly in 2019, the increase rate was only 9.5%. In 2020, the sales growth rate of EVs increased to 43.3%. These results indicate that there is not a disciplinary rule on the increase rate concerning the sales of EVs that could be obtained.

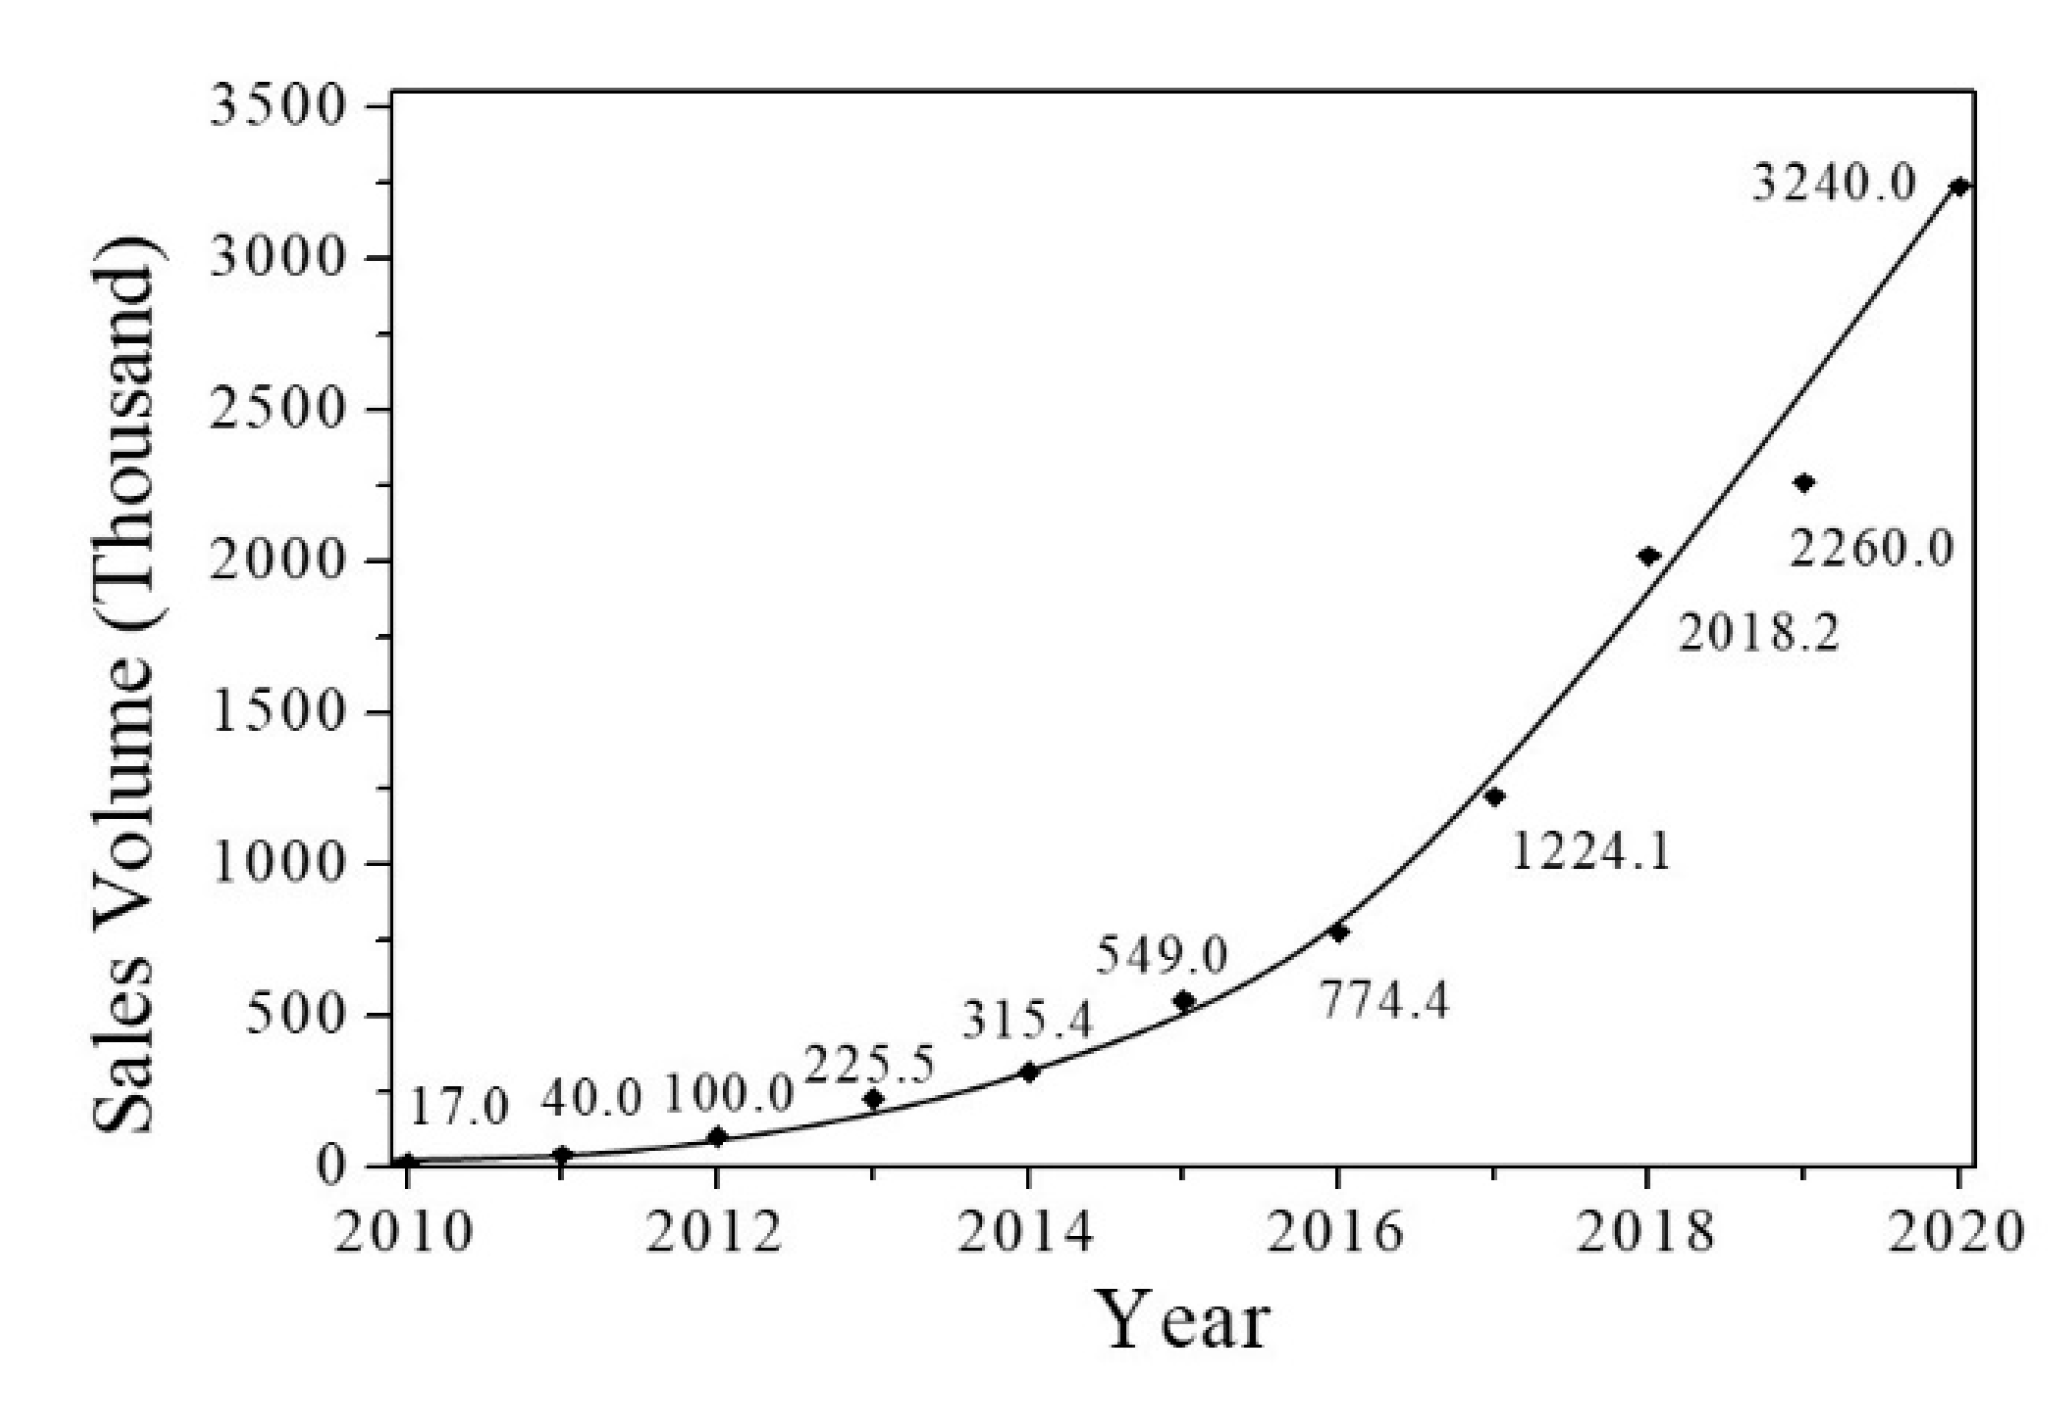
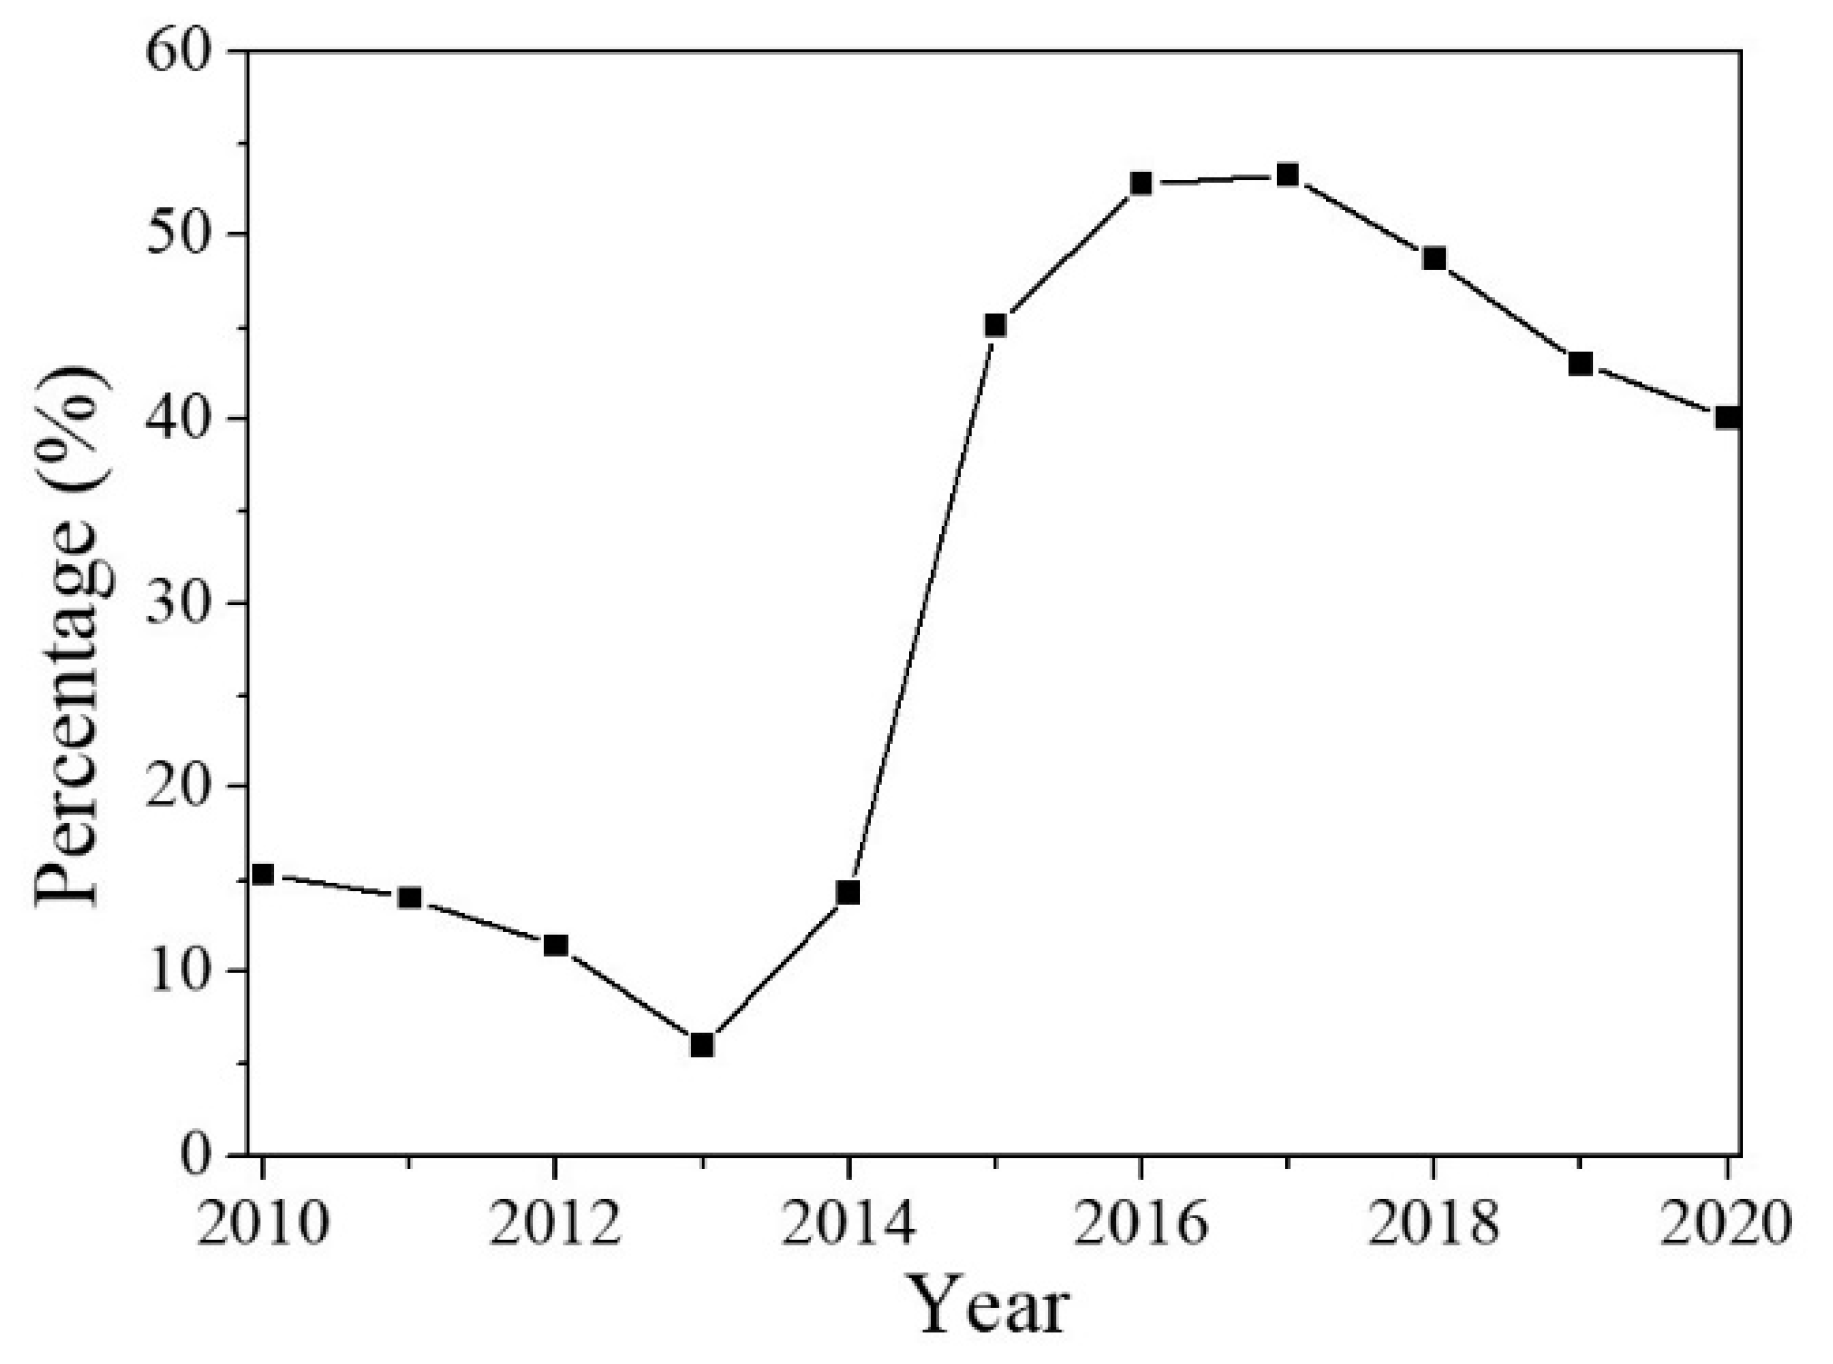
3.2. Market Status of EVs in China

As shown in Figure 5, in 2010, the sales was only 2.6 thousand. In 2014, the sales volume of EVs in China was about 45.0 thousand, which then increased very quickly to 247.5 thousand in 2015, 409.0 thousand in 2016, and 652.0 thousand in 2017. After a rapid increase in 2018, reaching 983.7 thousand, which differed from the sales volume of the world, a slow decrease is found in 2019, down to 972.0 thousand. It is surprising that in 2020, the sales of EVs increased to 1300.0 thousand. By comparing Figure 3 and Figure 5, one may see that in Figure 3 the fast increase in sales of EVs in 2018 is mostly contributed by the China market: the ratio is about 41.8%.
Figure 6 shows the annual growth rate of EVs in China. Before 2015, the growth rate of sales of EVs was almost above 100%, except for 2013 at 9.3%, which is much lower than the percentage for the world. This suggests that the development of EVs in China fell slightly behind the world. After 2016, the growth rate of the sales of EVs in China tended to be a rational digit, which was between 30% and 60%, except for −1.2% in 2019. This is also the main reason that caused the dramatical decrease in 2019 in the world.
The sales ratio in China compared with the global sales is accounted for and reported on in Figure 7, which was about 15% in 2010, before decreasing to 6% in 2013. The proportion slowly increased to 14.3% in 2014 and then 45.1% in 2015. In 2016, the proportion was 52.8%, then reaching a maximum of 53.3% in 2017. After that, the ratio decreased to about 49%, and then it stayed above 40% from then on. The results indicate that the sales volume of EVs in China after 2016 has always ranked first in the world, making a great contribution to the global sales of EVs.

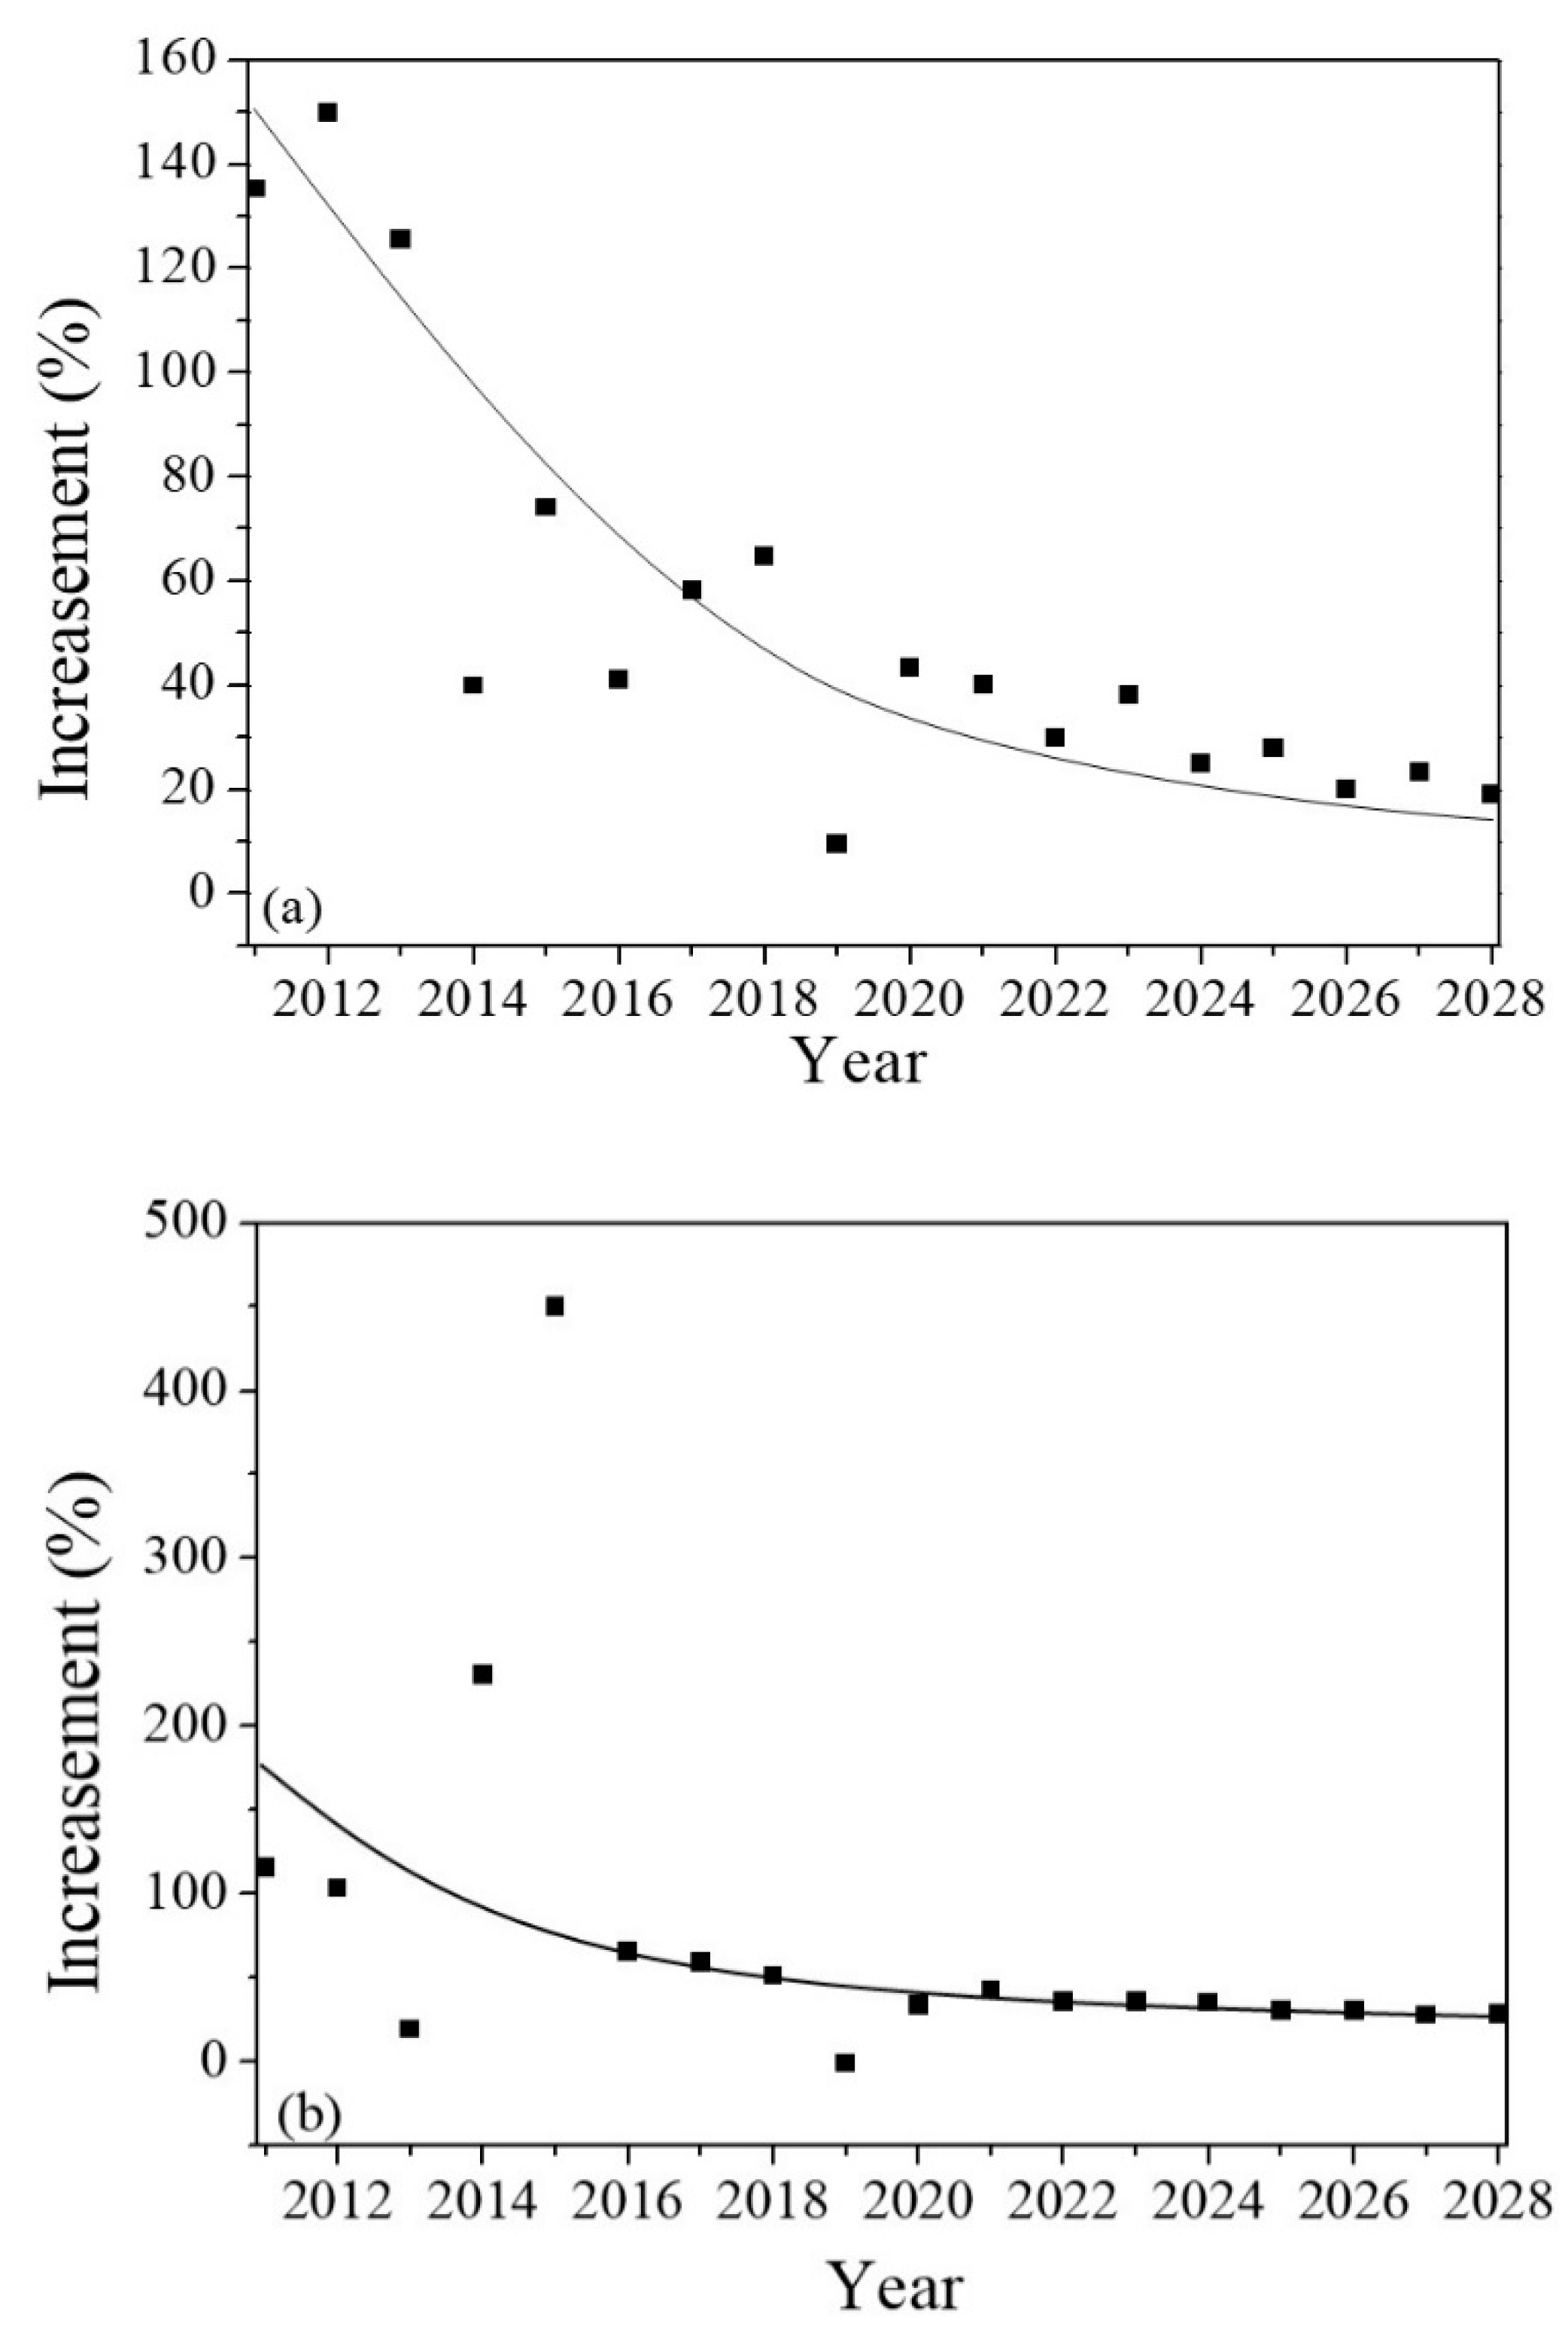
4. Results and Discussion

We summarize the sales of EVs in the recent 11 years from 2010 to 2020, which are, therefore, input as the model data, and then conduct dimension reduction output via the PCA model, followed by calculations with GRNN. It can simulate and calculate the sales of EVs in China in the next few years.
According to the GRNN formulas, to calculate the values with m dimensionality based on Equation (8)
C x x m ( τ ) = 1 / n i = 0 n 1 j = 1 m 1 ( x i x ¯ ) ( x i + j τ x ¯ )
and then perform data preprocessing,
X t = X t ( X m a x X m i n ) + X m i n
Finally, calculate the optimal smoothing parameter α = 0.3251, since λ ∈ [0,1], we, thus, take λ = 0.3, which could better reflect the accuracy of the sales forecasts in recent years by considering both the sales volumes and the annual increase rates. The simulated curves are, therefore, presented in Figure 3, Figure 4, Figure 5, Figure 6. As m = 8, according to Equation (8), the value is close to saturation, which means that in this model, we could forecast the sales volume of EVs in the coming 8 years. Through the above PCA decomposition of the sales data samples of the world and China’s EVs from 2010 to 2020, a set of dimensionality-reduced output samples are obtained. The output sample data is calculated using GRNN, and the regression numbers of the sales volume of EVs in the world and China, with the respect year, are obtained. Substitute each number into the GRNN algorithm model, and the output of the forecasted volume for the sales of EVs in the world and China could be obtained, as shown in Figure 8 and Figure 9. We have compared the predicted the sales of EVs in 2021 (4536.5 thousand) with the statistic number in the first three quarters of 2021 (4300 thousand) in the world, which is rather close and reasonable according to the “China New Electric Vehicles Industry Development Report (2021)” by China’s Car Technology Research Center Co., Ltd. Tianjin, China This confirms that the parameters we set are suitable for the current study.
The sales of EVs in the world have also increased steadily per year as shown in Figure 8. In 2021, the sales volume is about 4536.5 thousand, in 2024 the number would be 10,000 thousand, and the number would reach 22,687.4 thousand in 2028. The annual increase rate is shown in Figure 10; one may find that the annual growth rate tends to decrease along with the year. This is because although the sales volume keeps growing every year, the refereed value of the sales of EVs increases as well, which leads to the decrease of the annual growth rate. This also satisfies the market principle that the sales market would gradually tend to saturation with the year increasing. In 2028, the annual growth rate would be about 20%.
With the encouragement of national policies and the improvement of people’s awareness of environmental protection, the market prospects of the EVs in China are very promising. Through the analysis of the sales of EVs in China, it can be concluded that the sales of EVs will keep rising in the next few years. As seen in Figure 9, the sales volume of EVs is increasing per year. In 2021, the sales of EVs will reach about 2000 thousand. In 2025, it will be more than 6300 thousand, and then beyond 13,000 thousand in 2028. At present, there are several research institutions have made predictions about the sales of EVs in China, such as the “2020–2026 China New Energy Vehicle Industry Development Risk Assessment and Development Prospect Analysis Report”, etc. We have compared our prediction results with the above report and find that the quantities obtained in current work are a little bit larger than those in above report. This may be due to that we have collected more historic data and also the model applied in this work is based on the computer self-learning technology, the effects of political and economic policies are not considered yet. The forecasted annual increase rate of the sales of EVs is shown in Figure 11. We can see that similar to the growth rate in the world, it also decreases generally per year. In 2021, it is about 43%, and about 37% in 2024. After 2024, a fast decrease is found. In 2028 it is about 30%.
Figure 12 shows the prediction of the ratio of the sales of EVs between China and the world. Compared with the global sales of EVs, China’s sales volume is about 43% in 2021, which increases to 49% in 2025. After 2025, the ratio is above 50% and get about 60% in 2028, which is far ahead of other countries in the world, playing a leading role in the development of EVs. This result indicates that in the next few years, the new market of EVs is in China. However, China is not a large R&D country with a large market for EVs, so the lack of necessary technical support may be the biggest bottleneck for the development of EVs in China in the future.
In order to detect the reliability of the artificial intelligence program, the annual growth rate in the world and in China, based on both the historic and predicted data, is presented in Figure 13. Both the growth rates decrease each year, and both are rather catered to the previously historic data, as the prediction results inosculate well in the fitted curves. These results partially prove that the model used in this study is dependable.
Promotion of EVs would reduce the emissions of health-harmful pollutants and greenhouse gas; moreover, the development of EVs with new technology provides sources of investment and, therefore, enhances the domestic employment rate. The sales forecast of EVs plays an important role not only in business strategy but also in technology tactics. Presently, we only used the univocal model to simulate the sales of EVs. It is true that multivariate models would result in a better forecasting performance than the univariate ones. Next, the exogenous factors that influence the sales market of EVs should also be considered, which generally include consumer confidence, producer and retailer prices, and world economic fluctuations, as well as fuel prices. For a market participant who concentrates on the generating revenue, they need to focus on the variation tendency of the market demand by analyzing the economic indicators; while for a policy maker, stimulated strategies can be formulated relying on the multivariate models, such as employment encouragements, subsidies, and tax adjustment. In this case, the results presented in this work are quite useful for market participants as well as policy makers to make better economic decisions and political guidelines, respectively.

5. Conclusions and Policy Implications

The sales of EVs in China have been forecasted by a model combining PCA and GRNN. The results confirm a positive future for the markets for EVs in China and in the world, which is consistent with what is expected by the government in its strategic plan. The EVs market in China should be the biggest one in the next few years, which is above a 50% share of the world market. Thus, members of the supply chains of EVs as well as policy makers are able to actualize reasonable producing, regulating, and retailing plans. However, there is the requirement for coordination at the national level concerning the sequence of adoption of EVs, since the EVs market is strongly impacted by national policy, which could be greatly increased if governments restrict greenhouse gases emissions and accelerate the efforts to reach climate aims. Moreover, the governmental policy on electricity generation and its cost would also affect the markets for EVs. In addition, the development of new type of rechargeable batteries (such as the sodium battery) would further benefit the growth of EVs, as advances in battery technology and mass manufacturing will continuously drive down the cost of EVs.

Limitations of the Study

Only limited data are applied, and one-step-ahead forecasting is considered in this paper. Nevertheless, our model does not consider the unobserved/unexpected multiple variables, such as policies and regulations, the fluctuation of oil prices, electricity grid construction, electricity cost, and consumer psychology; moreover, the challenges of batteries (raw material shortage), the automotive industry (chip shortage), and grid charging networks [41], as well as their impacts on the model results are all missing. Thus, future studies on the multivariate model for the sales forecast of EVs are expected.

Author Contributions

Conceptualization, W.C.; methodology, W.C.; software, M.W.; formal analysis, M.W.; investigation, M.W.; resources, W.C.; data curation, W.C; writing—original draft preparation, M.W.; writing—review and editing, W.C.; funding acquisition, W.C. All authors have read and agreed to the published version of the manuscript.

Funding

This research was funded by the Starting Research Fund from Jimei University and Xiamen University Malaysia.

Institutional Review Board Statement

Not applicable.

Informed Consent Statement

Not applicable.

Data Availability Statement

Not applicable.

Conflicts of Interest

The authors declare no conflict interest.

References

  1. Wang, Y.; Sun, X.; Wang, B.; Liu, X. Energy saving, GHC abatement and industrial growth in OECD countries: A green productivity approach. Energy 2020, 194, 116833. [Google Scholar] [CrossRef]
  2. Solarin, S.A. An environmental impact assessment of fossil fuel subsidies in emerging and developing economics. Environ. Impact Assess. Rev. 2020, 85, 106443. [Google Scholar] [CrossRef]
  3. Zhou, G.; Ou, X.; Zhang, X. Development of electric vehicles use in China: A study from the perspective of life-cycle energy consumption and greenhouse gas emissions. Energy Policy 2013, 59, 875–884. [Google Scholar] [CrossRef]
  4. He, S.; Guo, K. What factors contribute to the mutual dependence degree of China in its crude oil trading relationship with oil-exporting countries. Energy 2021, 228, 120547. [Google Scholar] [CrossRef]
  5. Wang, Q.; Li, S.; Li, R. China’s dependency on foreign oil will exceed 80% by 2030: Developing a novel NMGM-ARIMA to forecast China’s foreign oil dependence from two dimensions. Energy 2018, 163, 151–167. [Google Scholar] [CrossRef]
  6. Jakober, C.A.; Robert, M.A.; Riddle, S.G.; Destaillats, H.; Charles, M.J.; Green, P.G.; Kleeman, M.J. Carbonyl emissions from gasoline and diesel motor vehicles. Envirom. Sci. Technol. 2008, 42, 4697–4703. [Google Scholar] [CrossRef] [Green Version]
  7. Huang, W.; Fan, H.; Qiu, Y.; Cheng, Z.; Xu, P.; Qian, Y. Causation mechanism analysis for haze pollution related to vehicle emission in Guangzhou, China by employing the fault tree approach. Chemosphere 2016, 151, 9–16. [Google Scholar] [CrossRef]
  8. Wang, M.; Tian, P.; Wang, L.; Yu, Z.; Du, T.; Chen, Q.; Guan, X.; Guo, Y.; Zhang, M.; Tang, C.; et al. High contribution of vehicle emissions to fine particulate pollutions in Lanzhou, Northwest China based on high-resolution online data source appointment. Sci. Total Environ. 2021, 798, 149310. [Google Scholar] [CrossRef]
  9. Hidrue, M.K.; Parsons, G.R.; Kempton, W.; Gardner, M.P. Willingness to pay for electric vehicles and their attributes. Resour. Energy Econ. 2011, 33, 686–705. [Google Scholar] [CrossRef] [Green Version]
  10. García, A.; Monsalve-Serrano, J.; Sari, R.L.; Tripathi, S. Life cycle CO2 footprint reduction comparison of hybrid and electric buses for bus transit networks. Appl. Energy 2021, 308, 118354. [Google Scholar] [CrossRef]
  11. Shafique, M.; Azam, A.; Rafiq, M.; Luo, X. Life cycle assessment of electric vehicles and internal combustion engine vehicles: A case study of Hong Kong. Res. Transport. Econom. 2022; in press. [Google Scholar] [CrossRef]
  12. Li, Y.; Taghizadeh-Hesary, F. The economic feasibility of green hydrogen and fuel cell electric vehicles for road transport in China. Energy Policy 2022, 160, 112703. [Google Scholar] [CrossRef]
  13. Shafique, M.; Luo, X. Environmental life cycle assessment of battery electric vehicles from the current and future energy mix perspective. J. Environ. Manag. 2022, 303, 114050. [Google Scholar] [CrossRef] [PubMed]
  14. Fuinhas, J.A.; Koengkan, M.; Leitão, N.C.; Nwani, C.; Uzuner, G.; Dehdar, F.; Relva, S.; Peyel, D. Effect of battery electric vehicles on greenhouse gas emissions in 29 European Union countries. Sustainability 2021, 13, 13611. [Google Scholar] [CrossRef]
  15. Serradilla, J.; Wardle, J.; Blythe, P.; Gibbon, J. An evidence-based approach for investment in rapid-charging infrastructure. Energy Policy 2017, 106, 514–524. [Google Scholar] [CrossRef]
  16. Duan, Z.; Gutierrez, B.; Wang, L. Forecasting plug-in electric vehicle sales and the diurnal recharging load curve. IEEE Trans. Smart Grid 2014, 5, 527–535. [Google Scholar] [CrossRef]
  17. Zhang, Y.; Zhong, M.; Geng, N.; Jiang, Y. Forecasting electric vehicles sales with univariate and multivariate time series models: The case of China. PLoS ONE 2017, 12, e0176729. [Google Scholar] [CrossRef]
  18. Zhu, J.; Yang, Z.; Mourshed, M.; Guo, Y.; Zhou, Y.; Chang, Y.; Wei, Y.; Feng, S. Electric vehicle charging load forecasting: A comparative study of deep learning approaches. Energies 2019, 12, 2692. [Google Scholar] [CrossRef] [Green Version]
  19. Mao, M.; Zhang, S.; Chang LHatziargyriou, N.D. Schedulable capacity forecasting for electric vehicles based on big data analysis. J. Mod. Power Syst. Clean Energy 2019, 7, 1651–1662. [Google Scholar]
  20. Liu, Z.; Zhu, Z.; Gao, J.; Xu, C. Forecast methods for time series data: A survey. IEEE Access 2021, 9, 91896–91912. [Google Scholar] [CrossRef]
  21. Bilgil, H. New grey forecasting model with its application and computer code. AIMS Math. 2021, 6, 1497–1514. [Google Scholar] [CrossRef]
  22. Luo, Z.; Guo, W.; Liu, Q.; Zhang, Z. A hybrid model for financialtime-seriesforecasting based on mixed methodologies. Expert Syst. 2021, 38, e12633. [Google Scholar] [CrossRef]
  23. Smyl, S. A hybrid method of exponential smoothing and recurrent neural networks for time series forecasting. Int. J. Forecast. 2020, 36, 75–85. [Google Scholar] [CrossRef]
  24. Kim, Y.; Hur, J. An ensemble forecasting model of wind power outputs based on improved statistical approaches. Energies 2020, 13, 1071. [Google Scholar] [CrossRef] [Green Version]
  25. Alerskans, E.; Kaas, E. Local temperature forecasts based on statistical post-processing of numerical weather prediction data. Meteorol. Appl. 2021, 28, e2006. [Google Scholar] [CrossRef]
  26. Wu, D.; Zeng, H.; Lu, C.; Boulet, B. Two-stage energy management for office buildings with workplace ev charging and renewable energy. IEEE Trans. Transp. Electrif. 2017, 3, 225–237. [Google Scholar] [CrossRef]
  27. Wu, S.; Zeng, J.; Xie, H.; Ng, S.H. Capsaicin determination and chili sauce discrimination using low-cost and portable electrochemical sensors based on all graphite pencil electrodes. Anal. Methods 2016, 8, 7025–7029. [Google Scholar] [CrossRef]
  28. Liu, P.; Zhou, X.; Li, Y.; Li, M.; Yu, D.; Liu, J. The application of principal component analysis and non-negative matrix factorization to analyze time-resolved optical waveguide absorption spectroscopy date. Anal. Methods 2013, 5, 4454–4459. [Google Scholar] [CrossRef]
  29. Yang, Z.; Zhou, Q.; Wu, X.; Zhao, Z.; Tang, C.; Chen, W. Detection of water content in transformer oil using multi frequency ultrasonic with PCA-BPNN. Energies 2019, 12, 1379. [Google Scholar] [CrossRef] [Green Version]
  30. Specht, D.F. A general regression neural network. IEEE Trans. Neural Netw. 1991, 2, 568–576. [Google Scholar] [CrossRef] [Green Version]
  31. Zhao, H.; Hou, Q.; Hong, Y.; Liu, W.; Tong, F. Determination of calcium carbonate and styrene-butadiene latex content in the coating layer of coated paper. J. Ind. Eng. Chem. 2014, 20, 1571–1576. [Google Scholar] [CrossRef]
  32. Liu, B.; Zhou, P.; Liu, X.; Sun, X.; Li, H.; Lin, M. Detection of pesticides in fruit by surface-enhanced Raman spectroscopy coupled with gold nanostructures. Food Bioprocess Technol. 2013, 6, 710–718. [Google Scholar] [CrossRef]
  33. Niu, D.; Liang, Y.; Hong, W. Wind speed forecasting based on EMD and GRNN optimized by FOA. Energies 2017, 10, 2001. [Google Scholar] [CrossRef] [Green Version]
  34. Jensen, A.F.; Cherchi, E.; Mabit, S.L.; de Dios Ortúzar, J. Predicting the potential market for electric vehicles. Transp. Sci. 2016, 51, 427–440. [Google Scholar] [CrossRef] [Green Version]
  35. Glerum, A.; Stankovikj, L.; Thémans, M.; Bierlaire, M. Forecasting the demand for electric vehicles: Accounting for attitudes and perceptions. Transp. Sci. 2014, 48, 483–499. [Google Scholar] [CrossRef] [Green Version]
  36. Xing, Q.; Chen, Z.; Zhang, Z.; Huang, X.; Leng, Z.; Sun, K.; Chen, Y.; Wang, H. Charging demand forecasting model for electric vehicles based on online ride-hailing trip data. IEEE Access 2019, 7, 137390–137409. [Google Scholar] [CrossRef]
  37. Qi, J.; Jiang, G.; Li, G.; Sun, Y.; Tao, B. Surface EMG hand gesture recognition system based on PCA and GRNN. Neural Comput. Appl. 2020, 32, 6343–6351. [Google Scholar] [CrossRef]
  38. Ge, L.; Xian, Y.; Yan, J.; Wang, B.; Wang, Z. A hybrid model for short-term PV output forecasting based on PCA-GWO-GRNN. J. Mod. Power Syst. Clean Energy 2020, 8, 1268–1275. [Google Scholar] [CrossRef]
  39. Wang, X.; Sun, Y.; Li, S.; Meng, F. Hazard assessment of debris flows based on a PCA-GRNN model: A case study in Liaoning Province, China. Arab. J. Geosci. 2020, 13, 151. [Google Scholar] [CrossRef]
  40. International Energy Agency. Global EV Outlook 2021; IEA Publishing: Paris, France, 2021. [Google Scholar]
  41. Gerossier, A.; Girard, R.; Kariniotakis, G. Modeling and forecasting electric vehicle consumption profiles. Energies 2019, 12, 1341. [Google Scholar] [CrossRef] [Green Version]
Figure 1. The schematic diagram of the data distribution in a plane, these points scattered on the plane are regarded as the sample points of the data.
Sustainability 14 02206 g001
Figure 2. The processes of the PCA-GRNN model.
Sustainability 14 02206 g002
Figure 3. The sales volume of EVs per year in the world.
Sustainability 14 02206 g003
Figure 4. The annual increase rate of the sales of EVs per year in the world.
Sustainability 14 02206 g004
Figure 5. The sales volume of EVs in China from the year 2010 to 2020.
Sustainability 14 02206 g005
Figure 6. The annual increase rate of the sales of EVs per year in China.
Sustainability 14 02206 g006
Figure 7. The ratio of the sales volume of EVs between China and the world.
Sustainability 14 02206 g007
Figure 8. The forecast sales volume of EVs in the world from 2021 to 2028 with ±10% error.
Sustainability 14 02206 g008
Figure 9. The forecast sales volume of EVs in China from year 2021 to 2028 with ±10% error.
Sustainability 14 02206 g009
Figure 10. The forecast increased rate per year in the world.
Sustainability 14 02206 g010
Figure 11. The forecast increase rate per year in China in next few years.
Sustainability 14 02206 g011
Figure 12. The ratio of the forecasted sales volume of EVs between China and the world in few years.
Sustainability 14 02206 g012
Figure 13. The annual increase rates calculated from 2011 to 2028 (a) in the world and (b) in China.
Sustainability 14 02206 g013
Publisher’s Note: MDPI stays neutral with regard to jurisdictional claims in published maps and institutional affiliations.

