Article

Optimal Design of a Hybrid Solar PV/BG-Powered Heterogeneous Network

1
Department of Electrical and Electronic Engineering, Bangladesh University of Business and Technology, Dhaka 1216, Bangladesh
2
Discipline of Information Technology, Murdoch University, Murdoch, WA 6150, Australia
3
Department of Electrical Engineering, Faculty of Engineering, Jouf University, Sakaka 42421, Saudi Arabia
4
Interdisciplinary Research Center for Renewable Energy and Power Systems, King Fahd University of Petroleum & Minerals, Dhahran 31261, Saudi Arabia
5
School of Electrical, Computer and Telecommunications Engineering, University of Wollongong, Sydney, NSW 2522, Australia
6
Department of Electrical and Computer Engineering, University of Louisiana at Lafayette, Lafayette, LA 70504, USA
*
Authors to whom correspondence should be addressed.
Sustainability 2022, 14(4), 2201; https://doi.org/10.3390/su14042201
Submission received: 28 December 2021 / Revised: 10 February 2022 / Accepted: 11 February 2022 / Published: 15 February 2022

Abstract

:
The increased penetration of renewable energy sources (RESs) along with the rise in demand for wireless communication had led to the need to deploy cellular base stations powered by locally accessible RESs. Moreover, networks powered by renewable energy sources have the ability to reduce the costs of generating electricity, as well as greenhouse gas emissions, thus maintaining the quality of service (QoS). This paper examines the techno-economic feasibility of developing grid-tied solar photovoltaic (PV)/biomass generator (BG)-powered heterogeneous networks in Bangladesh, taking into account the dynamic characteristics of RESs and traffic. To guarantee QoS, each macro and micro-base station is supplied through a hybrid solar PV/BG coupled with enough energy storage devices. In contrast, pico and femto BSs are powered through standalone solar PV units due to their smaller power rating. A hybrid optimization model for electric renewables (HOMER)-based optimization algorithm is considered to determine the optimum system architecture, economic and environmental analysis. MATLAB-based Monte-Carlo simulations are used to assess the system’s throughput and energy efficiency. A new weighted proportional-fair resource method is presented by trading power consumption and communication latency in non-real-time applications. Performance analysis of the proposed architecture confirmed its energy efficiency, economic soundness, reliability, and environmental friendliness. Additionally, the suggested method was shown to increase the battery life of the end devices.

1. Introduction

The telecommunication sector of Bangladesh is growing at an exponential rate due to the rapid increment in mobile subscribers and the ever-increasing data demand. In other words, the nation is entering an era of very dense wireless networks with specialized needs such as tens of Gbps data rates and roughly 10 years of storage lifetime for low-power Internet of Things (IoT) devices [1,2]. The fast and widespread deployment of cellular base stations throughout the world has considerably increased energy consumption, thus depleting fossil fuel reserves and increasing greenhouse emissions (GHG). Furthermore, improved energy efficiency (EE), strong connection, and very low latency are projected to make 5G networks attractive, particularly for delay-sensitive and mission-critical applications [1,2]. Modern cellular networks must be developed in such a way as to meet the challenges of future demands [3]. The next phase is expected to come in the area of IoT technologies. IoT connections are expected to rise to 26.9 billion by the end of 2026 [3]. Overall, global mobile data traffic is expected to grow from roughly 51 exabytes (EB) per month in 2020 to over 226 EB per month in 2026. Other important factors for this huge number of users are the Quality of service (QoS) and the vast volumes of data demand. Heterogeneous networks (HetNets), i.e., networks offering a combination of a variety of wireless coverage zones, are cellular platforms addressing the fast-increasing traffic intensity. HetNets have to be built to cope with changing scenarios such as performing simultaneous activities of the macro-, micro-, pico-, and femtocells [4,5]. That is a radius that typically covers 5–30 km, 1–2 km, 200 m, and 10 m for macro-, micro-, pico-, and femtocells, respectively [4,5]. The coverage distance may vary depending on the frequency band, terrain, and physical obstacles. These cells use a proportionate amount of power along with coverage. Approximately 1.5 million 5G base stations and 6 million 4G base stations are now operational throughout the world [6]. Recently, telecom networks have been offering a range of applications that are shaping the modern world. Nowadays, a major topic is the widening deployment and monitoring of IoT devices. Moreover, IoT applications are near-future applications in industry, agriculture, health, education, transportation, finance, and the environment [7,8]. The third-generation partnership project (3GPP) uses a radio technology standard called narrowband IoT (NB-IoT) to allow internet connectivity in a huge number of low-performance devices [9,10]. This NB-IoT standard may be used to prolong battery life using the discontinuous reception (DRX) mechanism.
Cellular base stations consume about 57% of the energy of the cellular networks, making them major energy users [11]. The energy consumption and greenhouse gas emissions of cellular networks are estimated to be roughly 130 TWh and 110 MtCO2e per year, respectively. When mobile phone emissions are added, the overall annual carbon footprint reaches the vicinity of 200 MtCO2e [3]. This amount has been growing at a 10% annual rate [12]. The international energy agency (IEA) has predicted in its 2018 world energy outlook (WEO2018) a 27% increase in global energy consumption from 2017 to 2040, which is equal to 3743 million tons of oil [13]. According to [14], the information and communication technology (ICT) sector consumes roughly 5% to 10% of the worldwide electrical generation and contributes about 2% to 4% of the global CO2 emissions. Moreover, the worldwide reserves of coal, oil, and natural gas continue to decrease drastically, triggering the need for alternative energy sources, such as RES [15,16,17]. However, maintaining a high quality of service while lowering costs is a challenging problem for mobile industries. Powering BSs using locally available renewable energy sources is a potential solution to the problem. Efficient use of renewable energy is therefore one of the key priorities for the mobile industry to reduce costs and emissions while guaranteeing QoS. Consequently, it is necessary to incorporate sources of locally available RESs with conventional energy/electrical grid systems [15,16,17].
Overall, harvesting energy from locally accessible renewable energy sources is becoming a popular and established technique. Firstly, it lessens the reliance on fossil fuels as a sole source of energy. Secondly, these sources are abundant all around the globe. Thirdly, by lowering power generation costs and lowering carbon content, a large quantity of green energy may be harvested from renewable energy sources. Despite the above benefits, there are significant problems associated with generating energy, such as weather conditions and the dynamic nature of renewable energy sources, which can result in energy shortages or outages and negatively impact the QoS. However, combining multiple sources by integrating renewable energy sources with nonrenewable energy sources and suitable energy storage devices can improve QoS. The primary goal of the renewable-energy-powered cellular BS is currently to produce a green mobile communication framework with a minimum net cost.
The main focus of this paper is to develop an energy-efficient hybrid supply system to power the green cellular network in Bangladesh, taking into account the locally accessible renewable energy sources. Its main contributions are as follows:
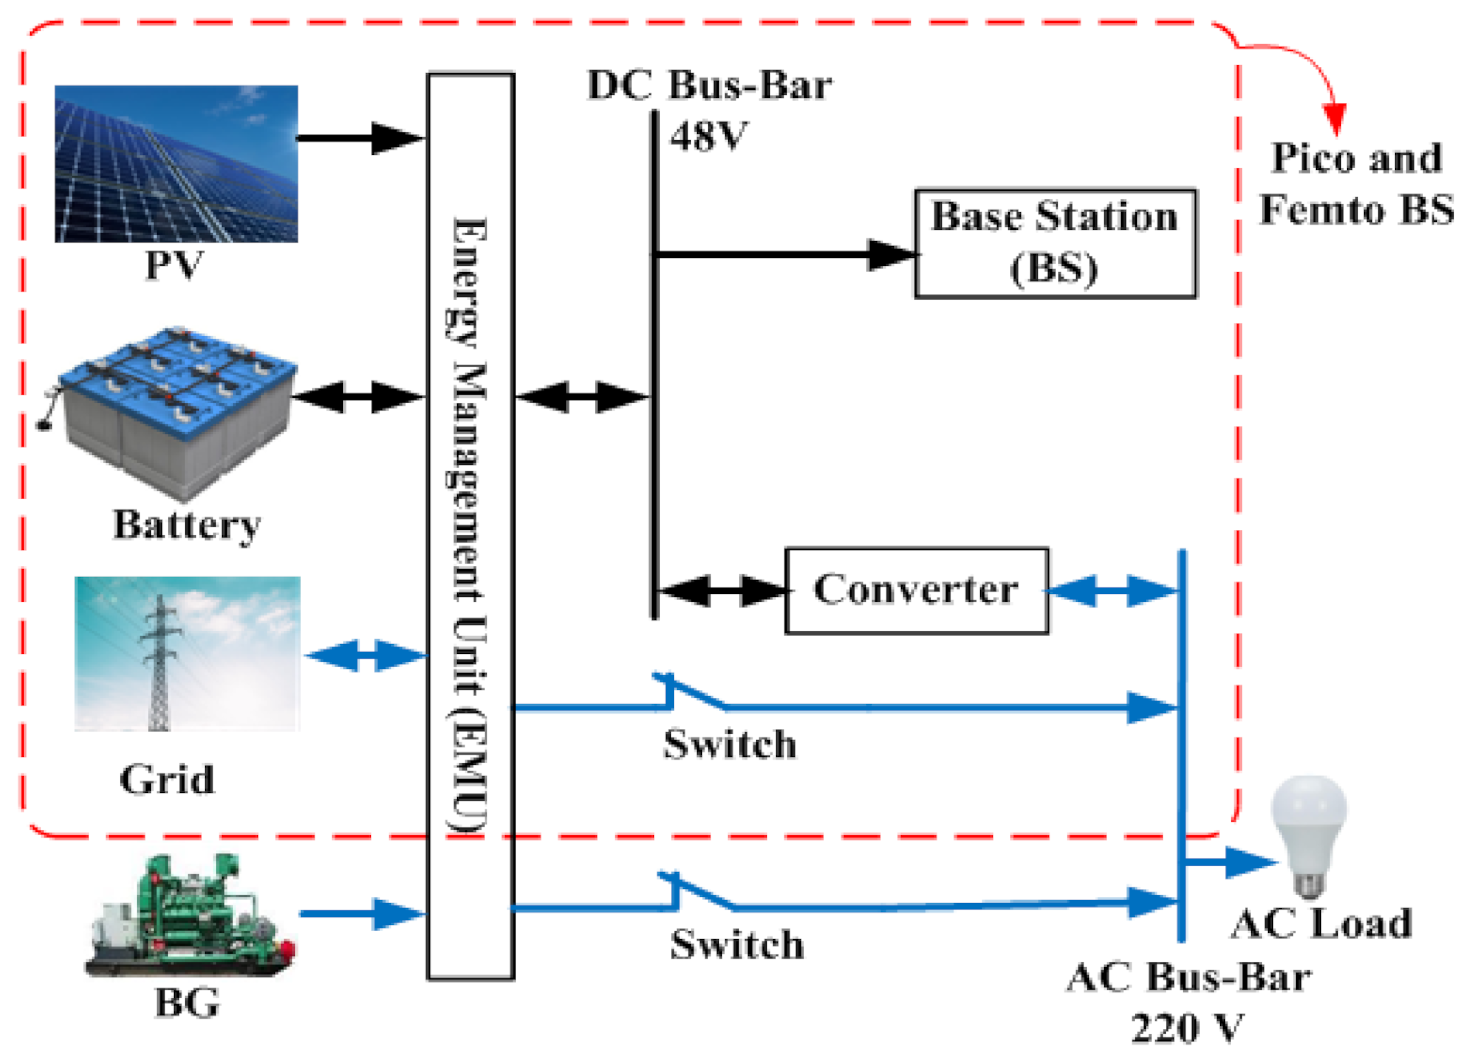
  • It proposes a hybrid solar PV and biomass-based energy supply system with enough energy storage devices for the long-term powering of heterogeneous cellular networks.
  • Using HOMER optimization software, it investigates the techno-economic viability of the proposed architecture in the context of various system bandwidths.
  • MATLAB-based Monte-Carlo simulations were used to evaluate the network’s performance in terms of data rate and energy efficacy while considering dynamic traffic profiles.
  • In contrast to previous concepts [18], it proposes a sleep mode mechanism to schedule bandwidth for NRT as well as IoT applications, thus resulting in considerable power savings and acceptable delays.
The remainder of the paper is organized as follows. A comprehensive review of the relevant literature is included in Section 2. The proposed HetNet architecture is detailed in Section 3. The cost modeling and optimization formula for the hybrid supply system are described in Section 4. The performance of the HetNet architecture is assessed in Section 5. Several key factors, including optimum system architecture, economic issues, wireless issues, and environmental issues are considered in the performance analysis. Conclusions are finally given in Section 6.

2. Literature Review

A growing interest in research is the effective use of renewable energy in cellular mobile technology. In addition, the future mobile industry will be strongly affected by the massive IoT devices deployment. Authors in [19,20] presented a solar PV-powered mobile base station in conjunction with sufficient energy storage devices. The technical and economic feasibility of the solar PV-powered cellular network has been examined thoroughly, taking into consideration the variation of solar radiation and traffic. In References [21,22], the authors used the HOMER platform to find the best system design and technical criteria for deploying hybrid solar PV/diesel generator (DG)-powered off-grid BSs across the world. The integration of solar PV with DG might reduce renewable energy output variations and increase the quality of service, but it partially increases DG-related issues, including high fuel prices, operation, and maintenance costs (OMC), and carbon emissions. In addition, fuel transfer to the DG is not economically efficient in remote regions. The combined utilization of multiple sources to achieve a sustainable and reliable energy source for BSs has been investigated in [23,24,25]. For a non-grid homogenous cellular network, a hybrid solar PV with a biomass generator (BG) supply scheme was developed in [26]. The integration of solar PV with biomass resources for establishing a long-term sustainable and reliable power station has been thoroughly investigated in reference [27]. In this work, the fundamental problems of developing a hybrid solar PV/biomass-focused power plant were investigated, and several significant solutions were proposed. A hybrid solar PV/wind turbine (WT)-powered macro-BS has been suggested in [28] considering the dynamic profile of renewable energy sources in Bangladesh. The works [25] and [29] employ a network with and without an energy sharing framework for the installation of the hybrid solar PV and WT-enabled homogenous network. Combining renewable energy with storage devices can improve reliability and minimize the energy gap between demand and supply, as shown in reference [30]. Being inspired by the potential benefits of renewable energy, Nokia Siemens has installed a hybrid solar PV/WT-powered base station in an urban location in Germany [31].
In References [29,32,33], energy sharing among neighboring base stations has been employed using resistive power lines or the intelligent grid. Average energy affinity (AEA) and stochastic energy affinity (SEA) measures are used to develop agglomerative and divisive hierarchical clustering algorithms to provide BSs with an energy-sharing model [29]. To achieve a fair decrease in energy usage and emissions of GHGs, a renewable energy-based community energy plan has been developed in [34]. In [35], the researchers reported an optimal common solar PV framework throughout society. Reference [32] proposes an optimum energy cooperation architecture among cellular BSs, which incorporates both renewable energy and grids via physically linked resistive power lines. A macro-BS energy collaboration model is shown in reference [33]. According to the aforementioned research articles, onsite green energy exchange amongst BSs is cost-effective and sustainable.
Traditional macrocell designs are often built to cater to broader spectral regions, which frequently fail to provide the throughput required to provide smooth broadband service to uplink customers. Furthermore, users often move away from the macro-BS, causing significant inter-cell interference. Under the typical macrocell scenario, the lack of interior infiltration and the formation of dead patches significantly limit indoor coverage. Heterogeneous networks provide considerable network performance leaps through larger network capacity and improved coverage as a potential way to tackle these difficulties [4,5,36]. HetNet is a multi-tier cellular network in which macro-base stations serve as mother base stations and offer a consistent coverage area. Here, micro-and pico/femtocells serve as supporting BSs, consuming less energy due to their lower coverage area. As a result, HetNets can increase frequency reuse, and the different cells create hotspots that reduce the lack of cellular network coverage in dead places, saving energy and expanding the coverage area. Reference [36] describes a load-balancing approach that can help to improve HetNets’ ranges.
The tradeoff between multiple QoS criteria for individual applications may be optimized using an effective resource scheduling technique. Reference [37] developed a minimum assured resource scheduling technique for NRT users. Reference [38] has provided a queue-size-aware, channel-adapted, and buffer-aware (CABA) packet scheduling algorithm. However, this solution cannot make use of all of the benefits of the popular proportional fair (PF) scheduler. Authors in [39] proposed a radio resource allocation architecture to assure proportionate fairness among the end-users. The impacts of the DRX setting on UE energy savings and delay were investigated by the authors in [40,41]. As seen in [42], Nokia has performed research on industrial DRX. It is generally understood that a tradeoff is always present between power savings and delay. Numerous DRX techniques are introduced in [43,44] to optimize the tradeoff.

3. System Description

This section provides a brief description of renewable energy resources in Bangladesh followed by a brief description of the system.

3.1. Opportunities and Potential of Renewable Energy in Bangladesh

The chosen location for this work is Bangladesh’s rural areas since it provides the enormous potential of generating electricity from locally accessible RESs. Some of the most commonly available sources in Bangladesh are solar, wind, hydro, and biomass [45]. A brief description of the potential of solar and biomass (agricultural leftover) energy in Bangladesh is provided below.

3.1.1. Solar PV Energy

Bangladesh is a tropical country that lies between 20″34′ and 26″38′ North Latitude and 88″01′ and 92″41′ East Longitude. The country has a lot of potential for harvesting renewable energy from the sunlight. The daily average solar radiation of Bangladesh is 4.59 kWh/m2/day, while solar intensity remains in the range of 4–6.5 kWh/m2/day, according to NASA’s database [14]. Bangladesh has the potential to receive around 70 PWh of solar energy annually, which can fulfill the entire country’s electrical load [46]. Standalone solar PV-powered base stations are already deployed as a result of the aforesaid prospective solution. According to the authors of [20], in Bangladesh, around 521 solar PV-powered base stations were installed in the year 2015, and telecom companies are working to increase that number.

3.1.2. Biomass Energy

Bangladesh has a lot of biomass resources that might be used to generate electricity. Agricultural residue, animal dung, chicken droppings, and other biomass sources are the most readily available in the country. Agricultural residue is the most available resource for biomass in this agricultural country, with rice husk playing a key role. As per Bangladesh’s ‘Rice Mills Owners Association’, the country has roughly 540 rice mills, each with a capacity of 30 tons per day and the potential to produce 171 MW per day [47,48]. In fiscal year (FY) 2012–2013, roughly 90.21 million tons of biomass were accessible in Bangladesh, with a 1344.99 PJ energy potential, which is equivalent to 373.71 TWh of electrical energy [49]. Reference [50] forecasts that Bangladesh will be capable of generating 7682 GWh of energy from rice husk in 2030.

3.2. System Description

Figure 1 depicts the schematic diagram of the proposed HetNet driven by the grid-tied hybrid solar PV/BG system. HetNet comprises different types of BSs equipped to meet the necessary data demands and has a specific size and power consumption. In general, a narrow area covering a small-size BS needs low-radiated power. The pico- and femto-BSs are therefore supplied with standalone solar PV, which consumes little power. A battery bank is linked to guarantee a constant energy supply, to counteract the RES deficiency or failure. The energy supply is regulated by an energy management unit (EMU) for each base station.
The major components of the system along with their mathematical models are briefly described below.

3.2.1. Solar PV System

The solar photovoltaic module harnesses the energy from the sun and converts it into electric energy. Based on the specifications and capital cost, a ‘Sharp ND-250QC’ model is considered for this work. The generated energy from the sun can be expressed as follows [51]:
E P V = R P V × P S H × η P V × 365   day / year
where RPV is the rated size, and PSH is the peak solar hour to average direct sunlight per day in kWh/m2/day.

3.2.2. BG System

The average biomass availability of the selected region is 9 tons per day. The amount of power and energy generated from a biomass generator is given by Equations (2) and (3), respectively [49,52]:
P B M = T B M ( t o n s / y e a r ) × C V B M × η B M × 1000 365 × 860 × ( o p e r a t i n g   h o u r   p e r   d a y )
E B M = P B M ( 365 × 24 × C f )
where Cf corresponds to the ratio between the actual and maximum energy achievable, known as the capacity factor.

3.2.3. Storage System

The backup capacity of the battery storage depends largely on the autonomy. The duration of supply provided by the battery bank without outside support may be calculated as follows [51]:
B A u t = N B a t t × V n o m × Q n o m ( 1 S O C min 100 ) ( 24   h / day ) P B S
where V n o m is the nominal voltage of a single battery (V), Q n o m is the nominal capacity of a single battery (Ah), and the battery S O C min indicates the lower threshold limit of the battery’s discharge [51]:
L B a t t = min N B a t t × Q L i f e t i m e Q T h r p t , R B a t t , f
where L B a t t is the lifetime throughput of a single battery (kWh), Q L i f e t i m e is the annual throughput (kWh/year) of the battery, and R B a t t , f is the float life of the battery bank in a year.

3.2.4. BS Load System

The optimal size of the hybrid supply system depends mostly on the cellular network’s power demand. The overall energy consumption of a base station can be expressed as follows [53,54]:
P i n = M sec ( P 1 + Δ p P max ( χ 1 ) ) If   0 < χ 1 = M sec P s l e e p If   χ = 0
where P 1 = P 0 + Δ p P max represents the peak power consumed by the BS, Δ p is the power slope depends upon the load, P 0 is the power consumed at the idle state, P s l e e p is the power drawn at sleep mode, and χ represents traffic load. The base station parameters along with the power consumed by the major components of the BSs from different system bandwidths are obtained from references [53,54].

3.2.5. Power Grid

The power grid is typically an interconnected structure that delivers power to the load. In this study, the suggested hybrid solar PV/BG system supplies surplus power to the grid.

3.3. Energy Sharing Model

If the case is an on-grid condition, energy can be shared between a network connection system and the electrical grid system. The algorithm of the proposed system is illustrated using the flowchart in Figure 2. Three separate scenarios occur for the state of the grid.
Case I: Generation is higher than demand (EGen > ED):
If EGen > ED, the green energy is enough to meet the BS’s own need for energy. Surplus energy is stored in the battery bank for backup power supply and energy for sharing. The amount of energy share and the loss of power supply probability of the system can be expressed as follows:
E S h a r e = E G e n E B S E L o s s e s
L P S ( t ) = 0
where ED is the summation of EBS and ELoss, and LPS represents the loss of power supply probability. A reliable system must have an LPS that is either zero or greater than zero.
Case II: Generation is equal to demand (EGen = ED):
If EGen = ED, then the green electricity generated is supplied to the base station, and the battery bank is ready to provide backup power, which means EShare = 0, LPS (t) = 0.
Case III: Generation is lower than demand (EGen < ED):
If EGen < ED, the harvested green energy cannot fully meet the BS energy need. Therefore, backup power is provided by the battery bank, and the remaining energy is received from the electrical grid.

3.4. Wireless Performance Metrics

The wireless network performance is measured using throughput and energy efficiency measurements. The total achievable throughput ( R t o t a l ( t ) ) of the network can be expressed as follows [30]:
R t o t a l ( t ) = k 1 U i = 1 N B W log 2 ( 1 + S I N R i , k )
where N is the number of BSs, U is the number of end-users, and S I N R i , k is the received signal-to-interference-plus-noise-ratio at the kth end-users served by base station BSi.
The ratio of total power and network power consumption can be expressed as energy efficiency (EE). The EE metric at time t can be represented by [25]:
η E E = R T o t a l ( t ) P B S ( t )
where P B S ( t ) is the total power consumed in all BSs at time t and can be calculated using Equation (6).

3.5. Resource Scheduling

In long-term evolution (LTE), especially for non-real-time (NRT) or IoT applications, the discontinuous reception (DRX) mechanism has been implemented to optimize the end-users’ battery lifetime. However, power consumption and wake-up delays are always trade-offs for end users. Consequently, the optimization of the DRX mechanism is required. A modified DRX Algorithm targeting NRT applications is suggested. This latter aims at improving battery life whilst achieving permissible delays. Without the DRX mechanism, user equipment had to continuously be in the ‘ON’ state, even if there is no traffic, which increases battery consumption drastically. The algorithm describes the communication state between BS and IoT applications. An inactivity timer starts after the end of the ‘ON’ state (active data transfer). When the inactivity timer advances to its expiration with no UL/DL data transfer request, the sleep mode mechanism will start again.
The current DRX model initiates through short sleep time ( τ S ). If it can end successfully without any UL packet arrival or DL packet arrival during paging, long sleep time ( τ T ) initiates. On the other hand, the proposed DRX mechanism initiates a sleep time interval that keeps growing from a short to long cycle timer with a step size τ S T . If, throughout this time, data transfer requests arrive, the fall will be followed by a rise again. Here, a number of cycles (n) are needed to reach from τ S to τ L or vice versa. However, once the UL packet transfer request has been detected within the DRX period or the DL/UL packet transfer request has been detected within the paging interval, an instant on period timer will initiate, and the sequence will keep rotating. The algorithm of the proposed DRX mechanism is depicted in the flowchart of Figure 3.
Here, an M/G/1 queue model has been used to model the packet arrival and service rate, Markovian (Poisson process) for the packet arrival rate ( λ ), general distribution for service rate ( μ ), and the server is singular. The equation for calculating the percentage of power-saving calculation has been modified from [55]:
P S a v e ( % ) = [ 1 [ E [ T D a t a ] E [ T T o t a l ] + P W a t t × E [ T W a t t ] P D a t a × E [ T T o t a l ] + P O F F × E [ T O F F ] P D a t a × E [ T T o t a l ] ] ] × 100

4. Simulation Setup, Cost Modeling, and Optimization

4.1. Simulation Setup

The project lifetime and the yearly interest rate were assumed to be 20 years and 6.75%, respectively, for the HOMER simulation set-up, which shows the long-term viability of the proposed system. Furthermore, solar panel double-axis tracking is modeled, and appropriate battery storage is linked to supply the BS load requirement. To meet the energy demand of the BSs and to ensure backup power at a reduced net present cost, HOMER optimization software is used. Figure 4 and Figure 5 illustrate the HOMER layout of the system for macro-, micro-, pico-, and femto-BSs under 10 MHz bandwidth. The base stations are mainly DC load, and it varies over time due to the dynamic character of the traffic intensity. It also consists of a 30W AC lamp, and with the continuous use of the light from 6 p.m. to 6 a.m., the AC load stays constant. Table 1 presents the technical parameters along with their respective values for the HOMER simulation configuration. The following are the system’s parameters of the renewable energy sources: Solar radiation: 4.59 kWh/m2/day; Biomass availability: 9 tons/day. The interest rate is 6.75%.

4.2. Cost Modeling

The net present cost (NPC) is the summation of associated costs (such as capital cost (CC), replacement cost (RC), operation and maintenance cost (OMC), fuel cost (FC), and salvage value (SV) that arise within the entire project. The use of biomass in biomass generators involves a significant fuel cost, and the NPC of the suggested system can be expressed as follows [51]:
NPC = TAC CRF = CC + RC + OMC + FC SV
The acronyms TAC and CRF are the total system cost and recovery elements annually that can be computed using (12) and (13) [51]:
TAC = TAC CC + TAC RC + TAC OMC
CRF = i ( 1 + i ) N ( 1 + i ) N 1
where N is the project’s lifespan and i the real yearly rate. Rescue values are called the costs after the endeavor and are estimated by the following equation [51]:
SV = C R C C R L C L
where C R C , C R L , and C L are the replacement cost, remaining lifetime, and lifetime of the component, respectively.
The cost of energy (COE) is a metric that measures the cost of producing a unit of electricity, which is expressed in dollars per kilowatt-hour (kWh) as follows [51]:
C O E = NPC × CRF E G e n

4.3. Optimization

The challenge of designing a hybrid renewable energy generation model is stated as an optimization problem that has the goal of decreasing NPC while taking into account a variety of schemes and operation limitations. The major objective of this research is to reduce NPC by minimizing energy shortages/outages and grid pressure by maximizing the use of renewable energy. The objective function of the system is expressed as follows [25]:
Minimize NPC
  Subject   to E P V + E B G > E B S
E P V + E B G + E B a t t = E B S + E L o s s e s
E S u r p l u s = E G e n E B S E L o s s e s
E B a t t min E B a t t E B a t t max
where ( E L o s s e s ) is the summation of losses from converter and battery. The complementary effect of solar PV and biomass generators can fulfill the base station energy demand and ensure 100% energy availability as presented in constraint (17a). The combined utilization of solar PV and BG in addition to battery storage can supply the load requirement and associated losses as stated in constraint (17b). According to constraints (17c), a certain percentage of surplus electricity is put in storage in the battery, and the remaining portion is conveyed to the electrical grid. The constraint (17d) specifies that the storage capacity must not exceed the upper edge nor fall below the lower limit.

5. Performance Analysis

Several key factors, including optimum system architecture, economic issues, wireless issues, and environmental issues, are highlighted in this section. The HOMER is chosen to analyze the proposed hybrid supply system’s optimal design and technical requirements for on-grid situations to minimize the cost of electricity and greenhouse gas emissions over 20 years. Using MATLAB-based Monte Carlo simulations, the wireless network was fully assessed. Throughput and energy efficiency measures were considered as performance metrics.

5.1. Optimal System Architecture

Table 2 summarizes the optimal size of different components for diverse system bandwidths under average solar radiation. In the HOMER software, the simulation was performed considering the dynamical behavior of renewable sources and data traffic. Due to the growing quantity of energy consumption, a larger solar PV panel size is necessary for higher system bandwidths (for macro- and micro-BS). In addition, the optimal size of the other system components remains unchanged as system bandwidth changes. This means that the proposed system can satisfy the energy demand of the BS under various bandwidth situations without altering system components on a significant scale.

5.2. Energy Issue

The annual energy consumed (DC and AC load), surplus energy, and shared energy for the different networks with a 10 MHz bandwidth are summarized in Table 3.
The monthly statistics of power contribution by the different supply systems are presented in Figure 6, Figure 7, Figure 8 and Figure 9 for the macro-, micro-, pico-, and femto-base stations, respectively. Those figures were obtained using data considering the dynamic profile of renewable energy sources with an average solar intensity of 4.59 kWh/m2/day and a 10 MHz system bandwidth. In line with our expectations, ideal renewables such as solar photovoltaics contribute more energy throughout the year. However, owing to the effective utilization of renewable energy, the biomass generator delivers less energy. It is also seen that no electrical grid energy was utilized for the maximal use of renewables. The fundamental purpose of the electric grid system is to sell the extra energy from renewables and to receive energy back in the event of a shortage or failure of renewable energy and storage system. The introduced system can decrease capital cost and carbon emissions since, under all situations, solar PV provides the most energy.
A comprehensive comparison of the yearly energy breakdown by the hybrid supply system under different system bandwidths are shown in Figure 10, Figure 11, Figure 12 and Figure 13, for macro-, micro-, pico-, and femto-base stations, respectively. The following are detailed energy calculations for the 10 MHz system bandwidth from the solar PV panels, and biomass generators.
Solar PV: As referred to in Table 2, the optimum size of the solar PV panel is 3 kW for the macro-BS system under a 10 MHz bandwidth. The year-round energy produced through the solar PV module can be approximated using (1): 3 kW × 4.59 × 0.9 × 365 days/year = 4523.44 kWh. Furthermore, due to the two-axis tracking mode, this value will be 6486 kWh.
Biomass Generator: The optimal size of the biomass generator is 1 kW. The running hours of the BG are 5342 h per year (14.632 h per day) and the used up bio-feedstock is 3.46 tones/year as obtained from HOMER simulation under macro-BS. Therefore, the annual generated power is calculated using (2) as follows: PBG = (3.46 tones/year (TBM) × 3411.33 Kcal/Kg (CVBM) × 0.30 (hBG) × 1000)/(365 × 860 × 14.632 h (top)) = 0.770 kW.
In contrast, the generated energy is assessed using (3) as follows: EBG = 0.770 kW (PBG) × 365 × 24 × 0.50 (capacity factor) = 3416 kWh/year for macro-BS, under 10 MHz bandwidth. In a similar procedure, the year-on-year energy produced by the other system configurations is computed.
The fuel of the biomass generators is organic feedstock. The amount of energy harvested from the solar PV/BG system is linearly related to the amount of bio-feedstock consumption and base station energy demand. The quantity of organic feedstock used by the hybrid solar PV/BG system under different system bandwidths is illustrated in Figure 14. It is observed that a larger quantity of biomass was used by the PV/BG solar system, which was linked to grid sharing. In particular, the networked system always generates higher energy than is necessary. The extra energy is therefore conveyed to the electrical network, which reduces grid pressures as well as the cost of capital through the maximum use of renewable energy sources.
For a macro-base station under 10 MHz system bandwidth, the total number of batteries required is 32:8 in series and 4 in parallel to support the load demand in case of the shortage/failure of renewable energy. Due to better features of charge and discharge rate, the “Trojan L16P” battery has been selected. Using (4) HOMER determines the autonomy of the battery bank by 80.9 h. The yearly battery bank’s autonomy under various network topologies is displayed in Figure 15. According to (5), the battery’s throughput is proportional to the BS energy needs, while its autonomy is inversely proportionate. Therefore, the larger bandwidth of the system shows a lower battery autonomy value and a higher battery performance. Furthermore, a good battery bank modeling and the battery bank charge/discharge rating can enhance the reliability of the renewable-energy-driven supply system.
The monthly statistics of renewable energy sold to the electrical grid system under different network conditions are shown in Table 4. In line with our expectations, after meeting the needed energy demand of the BSs, the grid-connected hybrid solar PV/BG system may share a considerable amount of renewable energy with the power grid system. On the other hand, Figure 16 displays the sold energy at various system bandwidths. In the case of the macro-base station system, the solar PV/BG may return about 3172 kWh of energy per year, according to the data provided in Table 4, through the selling of excess energy to the electric grids system. It is also observed that in pico- and femto-base station cases, the amount of sold energy is comparatively higher due to the lower value of the load demand. However, the solar PV/BG system can transfer a greater amount of renewable energy to the grid, therefore reducing energy costs and grid pressure. Therefore, three objectives can be achieved with the energy generated: (i) A significant part of the energy generation is required to meet the BS load demand; (ii) in the battery system, a certain amount of extra energy is kept to support the system during shortages/outage of renewable energy; (iii) to ensure the stability of the supply via a thoroughgoing use of renewable energy sources, the residual quantity of energy is conveyed to the electrical grid.

5.3. Economic Issue

In order to build a cost-effective hybrid supply system, the results of the HOMER optimization software are used in this section to examine various expenses connected with the hybrid solar PV/BG system. Critical studies of these costs have been conducted, considering the dynamic character of renewable energy sources in various network topologies.
The nominal cash flow summary of the proposed system under a 10 MHz system bandwidth is shown in Figure 17, Figure 18, Figure 19 and Figure 20 for macro-, micro-, pico-, and femto-base stations, respectively. The results were obtained by modeling the system in HOMER using the average solar radiation profile and biomass availability in the selected location. It is seen that, as compared to other types of components, the battery bank has a greater cost since the battery’s lifetime is shorter than the project’s term. It should be noted that the grid system has a negative NPC value because a larger volume of excess energy is sold to the grid.
Figure 21 depicts a comparison of NPC for the various network topologies. With the escalation of system bandwidth, all NPC curves are decreased linearly to meet the increased energy requirement. In addition, the NPC curve of the macro-BS system has a lower value as compared to the other system, which indicates that higher system bandwidth and energy trading strategy may decrease capital costs considerably. In this research on maximizing the use of renewable energy sources and increasing system dependability, the energy trading strategy for the grid is thoroughly studied.
The quantitative comparison of the per-unit capital cost of power generation in different network topologies of the proposed system is illustrated in Figure 22. Note that, in line with the theory, a reduced energy generation price value is achieved for the greater system bandwidth. In addition, the costs of generating electricity for the smaller system are greater than those of the larger size system because, as indicated previously, NPC is more involved in the larger base station.

5.4. Wireless Issue

The wireless network performance considering several system bandwidths is illustrated in Figure 23 and Figure 24 respectively. The performance indicators were assessed in light of the two-tier LTE hexagonally shaped mobile network with 19 base stations. The throughput indicates the number of bits per second transferred. Instead, the word “energy efficiency” quantifies the number of bits sent per watt, equal to the ratio of overall throughput to the total output essential for the base station. A system that delivers higher throughput and energy efficiency performance is always desirable. Figure 23 demonstrates that the given system has enough throughput performance and is similar to the traffic intensity profile. In addition, the larger system bandwidth gives a better value to the output performance because of the higher energy consumption. As referred to in (10), the energy efficiency is in a straight line related to the network’s performance. This results in increased energy efficiency curves with an increase in bandwidth, as seen in Figure 24.

5.5. Environmental Issue

As an ideal renewable energy source, solar PV does not contribute to the emission of any carbon content, whereas the biomass generator releases a tiny amount of carbon content during the processing of the biomass [56]. Controlling waste from the biomass generator system and telecommunication equipment can help green mobile communication become more sustainable. The statistics for the emissions produced by the proposed system under different system bandwidths are shown in Figure 25. The emission statistics demonstrate a clear ratio with BG’s organic feedstock consumption by increasing system BW. Table 5 summarizes the specifics of the pollutants released by the biomass generator with system bandwidth under 10 MHz. This pollution may be reduced to a minimum value with the introduction of new technology. The negative sign of the emissions implies that a grid-connected solar PV/BG system may considerably reduce carbon emissions by sharing extra green energy with the electrical grid. Finally, the suggested method may preserve the environment indirectly by lowering the use of rice husk (the major source of biomass), as demonstrated in Table 6.

5.6. Power Saving Issue

In this work, the performance comparison among existing and proposed sleep mode algorithms has been evaluated through the assumptions described in Table 7. According to the 3GPP TS 23.203 technical specifications, the permissible delay for non-real-time applications is 107 ms, though for specifically IoT applications this is more tolerable. By using the suggested IoT resource schedule algorithm, the proposed model produced greater power saving with a permitted delay, as seen in Figure 26 and Figure 27. Figure 26 demonstrates the proportion of consumption over packet arrival rates. The proposed method consumes less amount of energy than the existing method. In the existing method, if the number of short-cycle is 1 or 2 with a low packet arrival rate, the simulation shows a better result in terms of power consumption than the proposed one. But it is a very small region and if we assume the delay limit is 107 ms, it will be not acceptable because, from Figure 28, we can see that it crosses the delay limit. Therefore, the downlink latency (delay) and the power-saving speed are mutually acceptable. From assumption 2, the results are illustrated in Figure 28 and Figure 29. Here, the percentage of power consumption is greatly improved using the proposed method for a long-range packet arrival rate. For N = 1, 2, or 3, existing methods perform slightly better, as illustrated in Figure 28. However, concerning packet delay, as illustrated in Figure 29, this region is unacceptable. Therefore, the proposed method is the best choice. From the above analysis, it can be concluded that the proposed method outperforms existing models for NRT applications.

5.7. Feasibility Comparison

In order to ensure the effectiveness of the proposed approach, we compared it to some key approaches from the literature. The findings are summarized in Table 8.
From our literature review leading to the above comparison analysis, we noticed that most studies have focused on the key obstacles of establishing a green cellular network that included solar PV and wind turbines as well as a backup system. Furthermore, many of them did not analyze the system for heterogeneous networks. To the best of our knowledge, we are the first to develop a techno-economic and energy efficiency analysis integrating solar PV/BG system with electrical grid system for heterogeneous networks, in addition to the proposed sleep algorithm for IoT applications. Additionally, the suggested system was found to have only have a net present cost of about USD 21,445 and an energy-generating cost of USD 0.379/kWh for the macro-base station. Furthermore, a steady decline in per-unit energy generation cost has been found in response to higher system bandwidth, resulting in lower carbon footprints.

6. Conclusions

This paper proposed a hybrid solar PV/BG-powered heterogeneous cellular network in conjunction with sufficient energy storage devices. Various key performance parameters, including optimal sizing, per unit energy generation cost, harvested energy, shared energy, energy efficiency, and carbon footprints, were evaluated to ensure the viability of the proposed system. To determine the best criteria, extensive simulations were carried out under diverse network circumstances using HOMER optimization software. Simulation results show that locally available renewable energy sources are adequate to supply the heterogeneous network without external support. By ensuring minimal net present cost and per unit capital cost, the proposed system offers sustainable and reliable green mobile communication throughout the year. Moreover, the suggested system would drastically lower carbon footprints, thus resulting in better ecological sustainability compared to conventional power supply options. In addition, appropriate energy storage devices and energy selling mechanisms to the grid improve the reliability of the system by preserving the zero-percent energy shortage/outage. Under a 10MHz macro-configuration, the hybrid system produces 9902 kWh of total energy (66% from solar PV and 34% from BG) and 667 kWh of surplus energy. The numerical results also reveal that the green energy sharing policy attained energy sharing, yielding up to 3172 kWh and GHG saving around 2012 Kg per year. Additionally, if the hybrid supply system fails to meet the BS energy requirement, the energy storage device can feed the macro- and micro-BSs for 57 h and 255 h, respectively. Moreover, via the effective use of renewable energy, the throughput, and energy efficiency analysis ensures a satisfactory level of wireless performance and data demand. In comparison with the previous approaches, the suggested resource planning algorithm for NRT applications saved a significant amount of electricity.

Author Contributions

Conceptualization, M.S.H., K.Z.I. and A.G.A.; methodology, A.G.A. and M.S.; software, M.S.H. and K.Z.I.; validation, M.S.H., M.S. and M.R.I.; formal analysis, M.S.H. and A.G.A.; investigation, A.G.A. and M.R.I.; resources, M.R.I. and A.F.; data curation, M.S. and A.G.A.; writing—original draft preparation, M.S.H. and A.G.A.; writing—review and editing, K.Z.I., A.F. and M.R.I.; visualization, M.R.I. and A.F.; supervision, M.R.I. and A.F.; project administration, M.S.H. and M.R.I.; funding acquisition, M.R.I. and A.F. All authors have read and agreed to the published version of the manuscript.

Funding

The authors extend their appreciation to the Deputyship for Research & Innovation, Ministry of Education in Saudi Arabia for funding this research work through project number 375213500.

Conflicts of Interest

The authors declare no conflict of interest.

Nomenclature

Summary of the notations and symbols.
Notations/SymbolsMeaning
BGBiomass generator
BSBase station
BWBandwidth
COECost of energy
DGDiesel generator
DRXDiscontinuous reception
EEEnergy efficiency
GHGGreenhouse gas
HetNetHeterogeneous network
IoTInternet of Things
NPCNet present cost
NRTNon-real-time
PVPhotovoltaic
QoSQuality of service
WTWind turbine
NbattNumber of batteries
χ Traffic rate

References

  1. Jiang, W.; Han, B.; Habibi, M.A.; Schotten, H.D. The Road Towards 6G: A Comprehensive Survey. IEEE Open J. Commun. Soc. 2021, 2, 334–366. [Google Scholar] [CrossRef]
  2. Han, D.; Li, S.; Peng, Y.; Chen, Z. Energy Sharing-Based Energy and User Joint Allocation Method in Heterogeneous Network. IEEE Access 2020, 8, 37077–37086. [Google Scholar] [CrossRef]
  3. Ericsson 2020 Mobility Report Summary. Available online: https://www.microwavejournal.com/blogs/9-pat-hindle-mwj-editor/post/34139-ericsson-2020-mobility-report-summary?gclid=Cj0KCQiA15yNBhDTARIsAGnwe0VcFe1y1xFyFJcUPPEMSFFiBVJ1dosg2wE8eONvi7bNS9Gh4kz-HNQaAsj3EALw_wcB (accessed on 20 December 2021).
  4. Jiang, Y.; Zou, Y.; Guo, H.; Tsiftsis, T.A.; Bhatnagar, M.R.; de Lamare, R.C.; Yao, Y.-D. Joint Power and Bandwidth Allocation for Energy-Efficient Heterogeneous Cellular Networks. IEEE Trans. Commun. 2019, 67, 6168–6178. [Google Scholar] [CrossRef]
  5. Li, Y.; Zhang, H.; Wang, J.; Cao, B.; Liu, Q.; Daneshmand, M. Energy-Efficient Deployment and Adaptive Sleeping in Heterogeneous Cellular Networks. IEEE Access 2019, 7, 35838–35850. [Google Scholar] [CrossRef]
  6. Why China’s Mobile Coverage Is Superior to That of the US. Available online: https://www.globaltimes.cn/content/1172513.shtml (accessed on 20 December 2021).
  7. Chettri, L.; Bera, R. A Comprehensive Survey on Internet of Things (IoT) Toward 5G Wireless Systems. IEEE Internet Things J. 2020, 7, 16–32. [Google Scholar] [CrossRef]
  8. Liu, S.; Liu, L.; Yang, H.; Yue, K.; Guo, T. Research on 5G Technology Based on Internet of Things. In Proceedings of the 2020 IEEE 5th Information Technology and Mechatronics Engineering Conference (ITOEC), Chongqing, China, 12–14 June 2020; pp. 1821–1823. [Google Scholar]
  9. Reddy, M.P.; Kumar, A.; Kuchi, K. Joint Control and Shared Channel Scheduling for Downlink in 3GPP Narrowband-IoT. In Proceedings of the 2020 International Conference on COMmunication Systems NETworkS (COMSNETS), Bengaluru, India, 7–11 January 2020; pp. 476–483. [Google Scholar]
  10. Manne, P.R.; Ganji, S.; Kumar, A.; Kuchi, K. Scheduling and Decoding of Downlink Control Channel in 3GPP Narrowband-IoT. IEEE Access 2020, 8, 175612–175624. [Google Scholar] [CrossRef]
  11. Wu, J.; Zhang, Y.; Zukerman, M.; Yung, E.K.-N. Energy-Efficient Base-Stations Sleep-Mode Techniques in Green Cellular Networks: A Survey. IEEE Commun. Surv. Tutor. 2015, 17, 803–826. [Google Scholar] [CrossRef]
  12. World’s Leading Mobile Operators to Disclose Climate Impacts as Part of New GSMA-Led Climate Action Roadmap. Available online: https://www.gsma.com/newsroom/press-release/worlds-leading-mobile-operators-to-disclose-climate-impacts-as-part-of-new-gsma-led-climate-action-roadmap/ (accessed on 20 December 2021).
  13. World Energy Outlook. 2018. Available online: https://www.iea.org/reports/world-energy-outlook-2018 (accessed on 20 December 2021).
  14. Jahid, A.; Shams, A.B.; Hossain, M.F. Dynamic Point Selection Comp Enabled Hybrid Powered Green Cellular Networks. Comput. Electr. Eng. 2018, 72, 1006–1020. [Google Scholar] [CrossRef]
  15. Jahid, A.; Monju, K.H.; Hossain, S.; Hossain, F. Hybrid Power Supply Solutions for Off-Grid Green Wireless Networks. Int. J. Green Energy 2019, 16, 12–33. [Google Scholar] [CrossRef]
  16. Hossain, M.S.; Jahid, A.; Rahman, M.F. Dynamic Load Management Framework for off-Grid Base Stations With Hybrid Power Supply. In Proceedings of the 4th International Conference on Electrical Engineering and Information & Communication Technology (iCEEiCT), Dhaka, Bangladesh, 13–15 September 2018; pp. 336–341. [Google Scholar] [CrossRef]
  17. Jahid, A.; Hossain, M.S.; Monju, M.K.H.; Rahman, M.F.; Hossain, M.F. Techno-Economic and Energy Efficiency Analysis of Optimal Power Supply Solutions for Green Cellular Base Stations. IEEE Access 2020, 8, 43776–43795. [Google Scholar] [CrossRef]
  18. 3GPP TS 43.013, Discontinuous Reception (DRX) in the GSM System. Status: Under Change Control, Rel. 4. 2016. Available online: https://portal.3gpp.org/desktopmodules/Specifications/SpecificationDetails.aspx?specificationId=2661 (accessed on 20 December 2021).
  19. Alsharif, M.H. Techno-Economic Evaluation of a Stand-Alone Power System Based on Solar Power/Batteries for Global System for Mobile Communications Base Stations. Energies 2017, 10, 392. [Google Scholar] [CrossRef] [Green Version]
  20. Chamola, V.; Sikdar, B. Solar Powered Cellular Base Stations: Current Scenario, Issues and Proposed Solutions. IEEE Commun. Mag. 2016, 54, 108–114. [Google Scholar] [CrossRef]
  21. Alsharif, M.H.; Nordin, R.; Ismail, M. Energy Optimisation of Hybrid Off-Grid System for Remote Telecommunication Base Station Deployment in Malaysia. EURASIP J. Wirel. Commun. Netw. 2015, 2015, 64. [Google Scholar] [CrossRef] [Green Version]
  22. Han, T.; Ansari, N. On Optimizing Green Energy Utilization for Cellular Networks with Hybrid Energy Supplies. IEEE Trans. Wirel. Commun. 2013, 12, 3872–3882. [Google Scholar] [CrossRef]
  23. Hossain, M.S.; Rahman, M.F. Hybrid Solar PV/Biomass Powered Energy Efficient Remote Cellular Base Stations. Int. J. Renew. Energy Res. 2020, 10, 329–342. [Google Scholar]
  24. Hossain, M.S.; Islam, K.Z.; Jahid, A.; Rahman, K.M.; Ahmed, S.; Alsharif, M.H. Renewable Energy-Aware Sustainable Cellular Networks with Load Balancing And Energy-Sharing Technique. Sustainability 2020, 12, 9340. [Google Scholar] [CrossRef]
  25. Jahid, A.; Monju, M.K.H.; Hossain, M.E.; Hossain, M.F. Renewable Energy Assisted Cost Aware Sustainable Off-Grid Base Stations with Energy Cooperation. IEEE Access 2018, 6, 60900–60920. [Google Scholar] [CrossRef]
  26. Hossain, M.S.; Jahid, A.; Islam, K.Z.; Rahman, M.F. Solar PV and Biomass Resources-Based Sustainable Energy Supply for Off-Grid Cellular Base Stations. IEEE Access 2020, 8, 53817–53840. [Google Scholar] [CrossRef]
  27. Mohaghegh, M.R.; Heidari, M.; Tasnim, S.; Dutta, A.; Mahmud, S. Latest Advances on Hybrid Solar–Biomass Power Plants. Energy Sources Part A Recovery Util. Environ. Eff. 2021, 1, 1–24. [Google Scholar] [CrossRef]
  28. Aziz, A.S.; Tajuddin, M.F.N.B.; bin Adzman, M.R. Feasibility Analysis of PV/Wind/Battery Hybrid Power Generation: A Case Study. Int. J. Renew. Energy Res. 2018, 8, 661–671. [Google Scholar]
  29. Farooq, M.J.; Ghazzai, H.; Kadri, A.; Elsawy, H.; Alouini, M.S. A Hybrid Energy Sharing Framework for Green Cellular Networks. IEEE Trans. Commun. 2017, 65, 918–934. [Google Scholar] [CrossRef] [Green Version]
  30. Al-Ghussain, L.; Samu, R.; Taylan, O.; Fahrioglu, M. Sizing Renewable Energy Systems with Energy Storage Systems in Microgrids for Maximum Cost-Efficient Utilization of Renewable Energy Resources. Sustain. Cities Soc. 2020, 55, 102059. [Google Scholar] [CrossRef]
  31. E-Plus, Nokia Siemens Networks Build Germany First Offgrid Base Station. Available online: http://www.nokiasiemensnetworks.com (accessed on 20 December 2021).
  32. Chia, Y.-K.; Sun, S.; Zhang, R. Energy Cooperation in Cellular Networks with Renewable Powered Base Stations. IEEE Trans. Wirel. Commun. 2014, 13, 6996–7010. [Google Scholar] [CrossRef] [Green Version]
  33. Jahid, A.; Ahmad, A.S.; Hossain, M.F. Energy Efficient BS Cooperation in DPS Comp Based Cellular Networks with Hybrid Power Supply. In Proceedings of the 2016 19th International Conference on Computer and Information Technology (ICCIT), Dhaka, Bangladesh, 18–20 December 2016; pp. 93–98. [Google Scholar]
  34. Ugwoke, B.; Corgnati, S.P.; Leone, P.; Borchiellini, R.; Pearce, J.M. Low Emissions Analysis Platform Model for Renewable Energy: Community-Scale Case Studies in Nigeria. Sustain. Cities Soc. 2021, 67, 102750. [Google Scholar] [CrossRef]
  35. Awad, H.; Gül, M. Optimisation of Community Shared Solar Application in Energy Efficient Communities. Sustain. Cities Soc. 2018, 43, 221–237. [Google Scholar] [CrossRef]
  36. Ye, Q.; Rong, B.; Chen, Y.; Al-Shalash, M.; Caramanis, C.; Andrews, J.G. User Association for Load Balancing in Heterogeneous Cellular Networks. IEEE Trans. Wirel. Commun. 2013, 12, 2706–2716. [Google Scholar] [CrossRef] [Green Version]
  37. Kim, D.H.; Kim, H.S.; Lee, D.W. Packet Scheduling Algorithm For NRT Service in Wireless System Supporting Integrated Services of RT and NRT Applications. In Proceedings of the 2007 International Symposium on Communications and Information Technologies, Sydney, NSW, Australia, 17–19 October 2007; pp. 500–504. [Google Scholar]
  38. Lin, Y.; Yue, G. Channel-Adapted and Buffer-Aware Packet Scheduling in LTE Wireless Communication System. In Proceedings of the 2008 4th International Conference on Wireless Communications, Networking and Mobile Computing, Dalian, China, 12–14 October 2008; pp. 1–4. [Google Scholar]
  39. Li, Q.; Hu, R.Q.; Qian, Y.; Wu, G. A Proportional Fair Radio Resource Allocation for Heterogeneous Cellular Networks with Relays. In Proceedings of the 2012 IEEE Global Communications Conference (GLOBECOM), Anaheim, CA, USA, 3–7 December 2012; pp. 5457–5463. [Google Scholar]
  40. Wang, H.-C.; Tseng, C.-C.; Chen, G.-Y.; Kuo, F.-C.; Ting, K.-C. Power Saving by LTE DRX Mechanism Using a Mixture of Short and Long Cycles. In Proceedings of the 2013 IEEE International Conference of IEEE Region 10 (TENCON 2013), Xi’an, China, 22–25 October 2013; pp. 1–6. [Google Scholar]
  41. Zhou, L.; Xu, H.; Tian, H.; Gao, Y.; Du, L.; Chen, L. Performance Analysis of Power Saving Mechanism with Adjustable DRX Cycles in 3GPP LTE. In Proceedings of the 2008 IEEE 68th Vehicular Technology Conference, Calgary, AB, Canada, 21–24 September 2008; pp. 1–5. [Google Scholar]
  42. Fowler, S.; Bhamber, R.S.; Mellouk, A. Analysis of Adjustable and Fixed DRX Mechanism for Power Saving in LTE/LTE-Advanced. In Proceedings of the 2012 IEEE International Conference on Communications (ICC), Ottawa, ON, Canada, 10–15 June 2012; pp. 1964–1969. [Google Scholar]
  43. Liu, Y.; Huynh, M.; Mangla, A.; Ghosal, D. Performance Analysis of Adjustable Discontinuous Reception (DRX) Mechanism in LTE Network. In Proceedings of the 2014 23rd Wireless and Optical Communication Conference (WOCC), Newark, NJ, USA, 9–10 May 2014; pp. 1–6. [Google Scholar]
  44. Karthik, R.M.; Chakrapani, A. Practical Algorithm for Power Efficient DRX Configuration in Next Generation Mobiles. In Proceedings of the 2013 Proceedings IEEE INFOCOM, Turin, Italy, 14–19 April 2013; pp. 1106–1114. [Google Scholar]
  45. Hossain, M.S.; Alharbi, A.G.; Islam, K.Z.; Islam, M.R. Techno-Economic Analysis of the Hybrid Solar PV/H/Fuel Cell Based Supply Scheme for Green Mobile Communication. Sustainability 2021, 13, 12508. [Google Scholar] [CrossRef]
  46. Mondal, M.A.H.; Islam, A.K.M.S. Potential and Viability of Grid-Connected Solar PV System in Bangladesh. Renew. Energy 2011, 36, 1869–1874. [Google Scholar] [CrossRef]
  47. Ahiduzzaman, M.; Islam, A.K.M.S. Energy Utilization and Environmental Aspects of Rice Processing Industries in Bangladesh. Energies 2009, 2, 134–149. [Google Scholar] [CrossRef]
  48. Huda, A.S.N.; Mekhilef, S.; Ahsan, A. Biomass Energy in Bangladesh: Current Status and Prospects. Renew. Sustain. Energy Rev. 2014, 30, 504–517. [Google Scholar] [CrossRef]
  49. Islam, M.S.; Akhter, R.; Rahman, M.A. A Thorough Investigation on Hybrid Application of Biomass Gasifier and PV Resources To Meet Energy Needs for a Northern Rural Off-Grid Region of Bangladesh: A potential solution to replicate in rural off-grid areas or not? Energy 2018, 145, 338–355. [Google Scholar] [CrossRef]
  50. Halder, P.K.; Paul, N.; Beg, M.R.A. Assessment of Biomass Energy Resources and Related Technologies Practice in Bangladesh. Renew. Sustain. Energy Rev. 2014, 39, 444–460. [Google Scholar] [CrossRef]
  51. Alsharif, M.H.; Kim, J. Hybrid Off-Grid SPV/WTG Power System for Remote Cellular Base Stations Towards Green and Sustainable Cellular Networks in South Korea. Energies 2017, 10, 9. [Google Scholar] [CrossRef] [Green Version]
  52. Chauhan, A.; Saini, R.P. A review on Integrated Renewable Energy System Based Power Generation for Stand-Alone Applications: Configurations, Storage Options, Sizing Methodologies and Control. Renew. Sustain. Energy Rev. 2014, 38, 99–120. [Google Scholar] [CrossRef]
  53. Holtkamp, H.; Auer, G.; Giannini, V.; Haas, H. A Parameterized Base Station Power Model. IEEE Commun. Lett. 2013, 17, 2033–2035. [Google Scholar] [CrossRef] [Green Version]
  54. Auer, G.; Giannini, V.; Desset, C.; Godor, I.; Skillermark, P.; Olsson, M.; Imran, M.A.; Sabella, D.; Gonzalez, M.J.; Blume, O.; et al. How Much Energy is Needed to Run a Wireless Network? IEEE Wirel. Commun. 2011, 18, 40–49. [Google Scholar] [CrossRef]
  55. Jin, S.; Qiao, D. Numerical Analysis of the Power Saving in 3GPP LTE Advanced Wireless Networks. IEEE Trans. Veh. Technol. 2012, 61, 1779–1785. [Google Scholar] [CrossRef] [Green Version]
  56. Alsharif, M.H.; Kannadasan, R.; Jahid, A.; Albreem, M.A.; Nebhen, J.; Choi, B.J. Long-Term Techno-Economic Analysis of Sustainable and Zero Grid Cellular Base Station. IEEE Access 2021, 9, 54159–54172. [Google Scholar] [CrossRef]
  57. Alsharif, M.H.; Kim, J.; Kim, J.H. Energy optimization Strategies for Eco-Friendly Cellular Base Stations. Energies 2018, 11, 1500. [Google Scholar] [CrossRef] [Green Version]
  58. Olatomiwa, L.; Mekhilef, S.; Huda, A.S.N.; Sanusi, K. Techno-Economic Analysis of Hybrid PV—Diesel-Battery and PV—Wind-Diesel-Battery Power Systems for Mobile BTS: The Way Forward for Rural Development. Energy Sci. Eng. 2015, 3, 271–285. [Google Scholar] [CrossRef]
  59. Amutha, W.M.; Rajini, V. Techno-Economic Evaluation of Various Hybrid Power Systems for Rural Telecom. Renew. Sustain. Energy Rev. 2015, 43, 553–561. [Google Scholar] [CrossRef]
  60. Asif, R.; Khanzada, F. Cellular Base Station Powered by Hybrid Energy Options. Int. J. Comput. Appl. 2015, 115, 35–39. [Google Scholar] [CrossRef]
  61. Alsharif, M.H.; Nordin, R.; Ismail, M. Green Wireless Network Optimisation Strategies Within Smart Grid Environments for Long Term Evolution (LTE) Cellular Networks in Malaysia. Renew. Energy 2016, 85, 157–170. [Google Scholar] [CrossRef]
Figure 1. Architecture of the proposed system.
Sustainability 14 02201 g001
Figure 2. Flow chart of the proposed system.
Sustainability 14 02201 g002
Figure 3. Proposed sleep algorithm for IoT applications.
Sustainability 14 02201 g003
Figure 4. Layout in HOMER under 10 MHz system BW (macro and micro): (a) For macro BS; (b) For micro BS.
Sustainability 14 02201 g004
Figure 5. Layout in HOMER under 10 MHz system BW (pico and femto): (a) For pico BS; (b) For femto BS.
Sustainability 14 02201 g005
Figure 6. Monthly power contribution for macro-BS under 10 MHz system BW.
Sustainability 14 02201 g006
Figure 7. Monthly power contribution for micro-BS under 10 MHz system BW.
Sustainability 14 02201 g007
Figure 8. Monthly power contribution for pico-BS under 10 MHz system BW.
Sustainability 14 02201 g008
Figure 9. Monthly power contribution for femto-BS under 10 MHz system BW.
Sustainability 14 02201 g009
Figure 10. Individual energy breakdown for macro-BS.
Sustainability 14 02201 g010
Figure 11. Individual energy breakdown for micro-BS.
Sustainability 14 02201 g011
Figure 12. Individual energy breakdown for pico-BS.
Sustainability 14 02201 g012
Figure 13. Individual energy breakdown for femto-BS.
Sustainability 14 02201 g013
Figure 14. Biomass consumed for the proposed grid-tied system.
Sustainability 14 02201 g014
Figure 15. Battery autonomy for the proposed gird-tied system.
Sustainability 14 02201 g015
Figure 16. Energy sold to the electrical grid by the HetNet under different system BW.
Sustainability 14 02201 g016
Figure 17. Cash flow summary of the grid-tied hybrid solar PV/BG system under macro-BS.
Sustainability 14 02201 g017
Figure 18. Cash flow summary of the grid-tied hybrid solar PV/BG system under micro-BS.
Sustainability 14 02201 g018
Figure 19. Cash flow summary of the grid-tied solar PV system under pico-BS.
Sustainability 14 02201 g019
Figure 20. Cash flow summary of the grid-tied solar PV system under femto-BS.
Sustainability 14 02201 g020
Figure 21. Net present cost of the HetNet under different system BW.
Sustainability 14 02201 g021
Figure 22. Cost of energy of the HetNet under different system BW.
Sustainability 14 02201 g022
Figure 23. Throughput performance over 24 h under 10 MHz BW.
Sustainability 14 02201 g023
Figure 24. Energy efficiency for different system BW.
Sustainability 14 02201 g024
Figure 25. Carbon footprints for the different system BW.
Sustainability 14 02201 g025
Figure 26. Percentage of power consumption vs. packet arrival rate (Assumption 1).
Sustainability 14 02201 g026
Figure 27. Overall packet delay vs. packet arrival rate (Assumption 1).
Sustainability 14 02201 g027
Figure 28. Percentage of power consumption v.s packet arrival rate (Assumption 2).
Sustainability 14 02201 g028
Figure 29. Overall packet delay vs. packet arrival rate (Assumption 2).
Sustainability 14 02201 g029
Table 1. HOMER simulation parameters and specifications [49,51,52].
ComponentsConstraintsValue
Solar PVOperational lifetime25 Years
Derating factor90%
System tracking2-Axis
CCUSD 1000/kW
RCUSD 1000/kW
OMC/YearUSD 10/Year
Biomass GeneratorEfficiency30%
Operational lifetime25,000 Hours
CCUSD 600/kW
RCUSD 600/kW
OMC/YearUSD 0.05/Hour
FCUSD 30/Tone
Electrical GridEnergy purchase priceUSD 0.122/kWh
Energy sellback priceUSD 0.110/kWh
Demand chargeUSD 0.350/kW/Month
BatteryRound trip efficiency85%
BSOCmin30%
Vnom6V
Qnom360 Ah
Lifetime throughput1075 kWh
CCUSD 300/Unit
RCUSD 300/Unit
OMC/YearUSD 10
ConverterEfficiency95%
Operational lifetime15 Years
CCUSD 400/kW
RCUSD 400/kW
OMC/YearUSD 10/Year
Table 2. Optimal system architecture of the gird-tied system under 10 MHz system BW.
BW
(MHz)
PV (kW)BG (kW)Battery (units)Converter (kW)
MacroMicroPicoFemtoMacroMicroPicoFemtoMacroMicroPicoFemtoMacroMicroPicoFemto
5322.52.511**3224881.51.51.51.5
1032.52.52.511**3224881.51.51.51.5
153.532.52.511.5**3224881.51.51.51.5
203.532.52.511.5**3224881.51.51.51.5
* Not applicable.
Table 3. Individual energy breakdown under 10 MHz BW.
ItemsMacroMicroPicoFemto
AC load (kWh/Yr)13013000
DC load (kWh/Yr)5110111712387
Surplus energy (kWh/Yr)637574847858
Sold energy (kWh/Yr)3172328739824007
Table 4. Monthly statistics of sold energy by the HetNet under 10 MHz system BW.
Month\BS TypeMacro (kWh)Micro (kWh)Pico (kWh)Femto (kWh)
January393395424426
February276277324326
March318322376378
April292315374376
May291306368370
June188206279281
July148163238241
August170192266268
September176186252255
October309315373375
November299300349350
December311310359361
Annual3172328739824007
Table 5. Carbon contents for the hybrid system under 10 MHz BW.
Carbon ParticlesValues
MacroMicroPicoFemto
Carbon dioxide−1999−2077−2516−2532
Carbon monoxide0.02250.001700
Unburned hydrocarbons0.002490.00018900
Particulate matter0.00170.00012800
Sulfur dioxide−8.69−9.01−10.9−11
Nitrogen oxides−4.05−4.39−5.34−5.37
Total−2012−2090−2532−2548
Table 6. Emissions by different sources [50].
FuelsEmissions (Kg/Kg Fuel)
Rice Husk1.49
Bituminous Coal2.46
Natural Gas1.93
Table 7. Simulation assumptions for sleep mode algorithm.
ParameterAssumption 1Assumption 2
τS (Short cycle timer length)20 ms10 ms
τL (Long cycle timer length)320 ms640 ms
τst (Step size timer)20 ms20 ms
τi (Inactivity timer)10 ms10 ms
χ (Packet arrival rate)0.05 to 0.5 packets/ms
μ (Service rate)100 packets/ms
N (No of short cycles)1 to 16
PData (Power consumption during ON period)500 mW
PInactive (Power consumption during inactivity timer)255 mW
POFF (Power consumption during DRX period)11 mW
Table 8. A comparison of our work with some published work.
ReferenceSoftware
Used
Optimal SizeBrief Summary of the Proposed Technique
[57]HOMER8.5 kW PV, 1 kW WT, and Nbatt = 64.
Proposed a solar PV and hybrid solar PV/WT system.
NPC of USD 30,975, excess energy of 4132 kWh/Yr.
No GHG.
[58]HOMER10 kW PV, 5.5 kW DG, and Nbatt = 64.
Proposed a hybrid solar PV/DG system.
NPC of USD 69,811, energy cost of USD 0.409/kWh.
Emits GHG.
[59]HOMER2 kW PV, 3 kW WT, and 2 kW FC
Proposed a hybrid solar PV/WT and solar PV/WT/FC system.
NPCs of USD 75,515, excess energy of 3926 kWh/Yr.
No GHG.
[60]HOMER5 kW PV, 1 kW WT, Nbatt = 16, and 3 kW DG
Proposed a hybrid solar PV/WT/DG system.
Energy cost of USD 0.839/kWh, excess energy of 3792.9 kWh/Yr
Emits GHG.
[61]HOMER2 kW PV, 1 kW WT, Nbatt = 3, and 1 kW Grid
Proposed a hybrid solar PV/WT/Grid system
NPC of USD 9459, energy cost of USD 0.133/kWh.
No GHG.
[25]HOMER
MATLAB
2 kW PV, 1 kW WT, and Nbatt = 32
Proposed a hybrid solar PV/WT system.
NPCs of USD 23,903, excess energy of 863 kWh/Yr.
No GHG.
[23]HOMER
MATLAB
3.5 kW PV, 1 kW BG, and Nbatt = 64
Proposed a hybrid solar PV/BG system for macro BS.
NPCs of USD 40,624, energy cost of 0.723 USD/kWh, excess energy of 2094 kWh/Yr.
Emits GHG.
[Approach proposed in this paper]HOMER
MATLAB
3 kW PV, 1 kW BG, and Nbatt = 32
Proposed a hybrid solar PV/BG/Grid system for HetNet.
NPCs of USD 21,445, energy cost of USD 0.379/kWh, GHG saving around 2012 Kg/Yr.
Save GHG by sharing the energy to the grid.
Publisher’s Note: MDPI stays neutral with regard to jurisdictional claims in published maps and institutional affiliations.

