
Carbon Management behind the Ambitious Pledge of Net Zero Carbon Emission—A Case Study of PepsiCo


Abstract
:1. Introduction
2. Overview of the Firm
3. Pledges and Targets
4. Emissions Estimates
4.1. Scope 1 and Scope 2

| Activity | 2017 Emissions (Metric Tons CO2 e) | 2018 Emissions (Metric Tons CO2 e) | 2019 Emissions (Metric Tons CO2 e) | 2020 Emissions (Metric Tons CO2 e) |
|---|---|---|---|---|
| Processing/manufacturing | 2,170,323 | 2,167,540 | 2,239,964 | |
| Distribution of commodity | 1,406,944 | 1,384,874 | 1,312,742 | |
| Total | 3,734,520 | 3,577,267 | 3,552,415 | 3,552,706 |
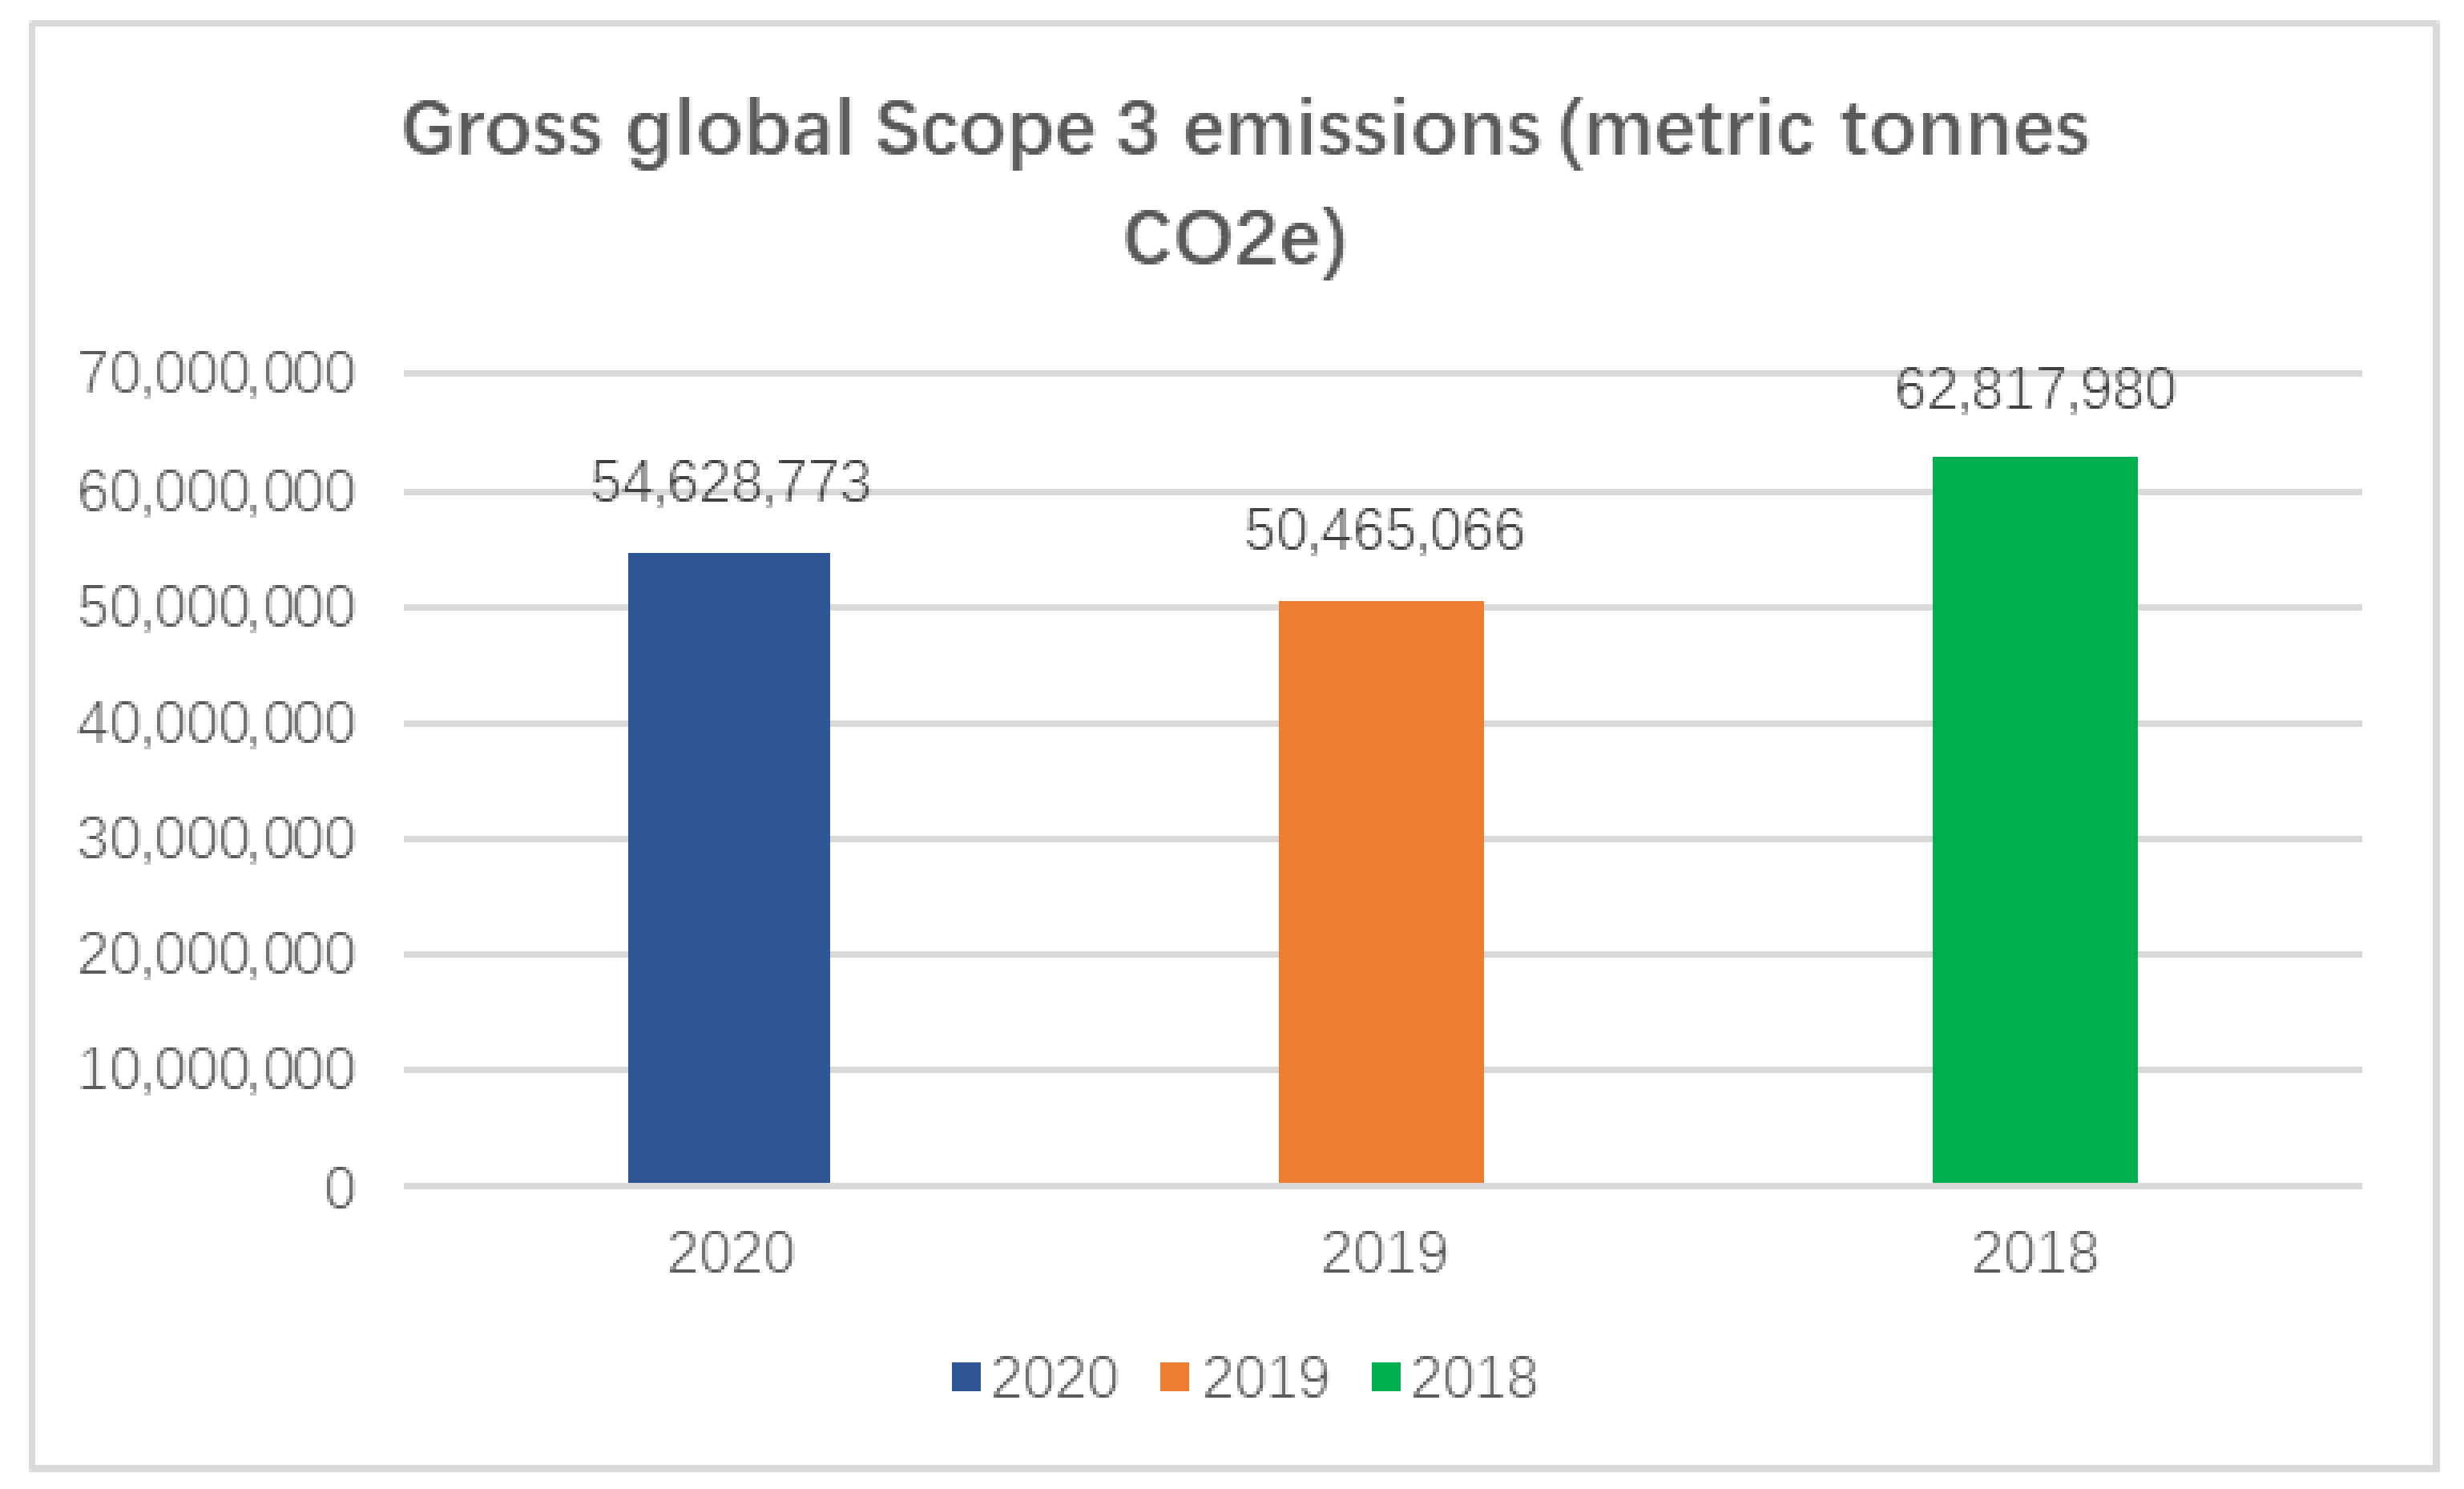
4.2. Scope 3
5. Emissions Reductions
5.1. More Efficient Production and Distribution Processes
5.2. Use of Lower-Emission Sources of Energy
5.3. Development of New Products or Services through R&D and Innovation
6. Performance Appraisal
7. Conclusions and Recommendation
Author Contributions
Funding
Institutional Review Board Statement
Informed Consent Statement
Data Availability Statement
Conflicts of Interest
Appendix A
| Source | Emissions Calculation Methodology | Calculation Formula |
|---|---|---|
| Purchased goods and services | Using procurement data and material-specific emission factors. | Total emissions of purchased goods are calculated as follows: ∑ (quantities of good purchased (e.g., kg) × supplier-specific emission factor of purchased good or service (e.g., kg CO2 e/kg)) |
| Capital goods | Using spend data on capital goods and EPA’s Extended Economic Input Output (EEIO) methodology emission factors. | Total emissions of capital goods are calculated as follows: ∑ (value of capital goods ($) × emission factor of capital goods per unit of economic value (kg CO2 e/$)) |
| Fuel-and-energy-related activities (not included in Scope 1 or 2) | Using actual fuel use data in our internal operations and using DEFRA upstream emission factors. |
× upstream fuel emission factor (kg CO2 e)/kWh)) where: upstream fuel emission factor = life cycle emission factor—combustion emission factor. |
∑ (electricity consumed (kWh) × upstream electricity emission factor (kgCO2 e)/kWh)) + (steam consumed (kWh) × upstream steam emission factor (kg CO2 e)/kWh)) + (heating consumed (kWh) × upstream heating emission factor (kg CO2 e)/kWh)) + (cooling consumed (kWh) × upstream cooling emission factor (kg CO2 e)/kWh)) where: upstream emission factor = life cycle emission factor—combustion emissions factor—T&D losses | ||
∑ (electricity consumed (kWh) × electricity life cycle emission factor ((kg CO2 e)/kWh) × T&D loss rate (%)) + (steam consumed (kWh) × steam life cycle emission factor ((kg CO2 e)/kWh) × T&D loss rate (%)) + (heating consumed (kWh) × heating life cycle emission factor ((kg CO2 e)/kWh) × T&D loss rate (%)) + (cooling consumed (kWh) × cooling life cycle emission factor ((kg CO2 e)/kWh) × T&D loss rate (%)) | ||
∑ (electricity purchased for resale (kWh) × electricity life cycle emission factor (kg CO2 e)/kWh)) + (steam purchased for resale (kWh) × steam life cycle emission factor (kg CO2 e)/kWh)) + (heating purchased for resale (kWh) × heating life cycle emission factor (kg CO2 e)/kWh)) + (cooling purchased for resale (kWh) × cooling life cycle emission factor (kg CO2 e)/kWh)) | ||
| Upstream transportation and distribution | Using a combination of actual miles and weight moved data and using EPA Smartway transportation emission factors as well as spend data and EPA EEIO methodology emission factors. | Emissions from road transport: = ∑ (mass of goods purchased (tonnes) × distance travelled in transport leg × emission factor of transport mode or vehicle type (kg CO2 e/tonne-km))Emissions from air transport: = ∑ (quantity of goods purchased (tonnes) x distance travelled in transport leg x emission factor of transport mode or vehicle type (kg CO2 e/tonne-km)) Emissions from sea transport: = ∑ (quantity of goods purchased (tonnes) x distance travelled in transport leg x emission factor of transport mode or vehicle type (kg CO2 e/tonne-km)) Total emissions from transport (upstream) are calculated as: = emissions from road transport + emissions from air transport + emissions from sea transport CO2 e emissions from distribution for each storage facility: emissions of storage facility (kg CO2 e) = (fuel consumed (kWh) × fuel emission factor (kg CO2 e/kWh)) + (electricity consumed (kWh) × electricity emission factor (kg CO2 e)/kWh) + (refrigerant leakage (kg) × refrigerant emission factor (kg CO2 e)/kg)) then, allocate emissions based on volume that company’s products take within storage facility: = (volume of reporting company’s purchased goods (m3)/ (total volume of goods in storage facility (m3)) finally, sum across all storage facilities: ∑ allocated emissions of storage facility |
| Waste generated in operations | Using waste generated and disposal methods that we keep track of internally and EPA WARM Tool waste emission factors. | Sum across waste treatment methods: ∑ (total mass of waste (tonnes) × proportion of total waste being treated by waste treatment method × emission factor of waste treatment method (kg CO2 e/tonne)) |
| Business travel | Using internal employee air travel data obtained from various systems around the globe and EPA emission factors for air travel. Rental car data obtained from suppliers or internal time and expense reports were used along with EPA EEIO emission factors. | CO2 e emissions from business travel Sum across vehicle types: ∑ (distance travelled by vehicle type (vehicle-km or passenger-km) × vehicle specific emission factor (kg CO2 e/vehicle-km or kg CO2 e/passenger-km)) + (optional) ∑ (annual number of hotel nights (nights) × hotel emission factor (kg CO2 e/night)) |
| Employee commuting | Using employee headcount data and estimations of commuting modes, distances and annual working days and DEFRA emission factors. | Calculating emissions from employee travel using the distance-based method the total distance travelled by rail (km) is calculated as: ∑ (daily one way distance between home and work (km) × 2 × 5 × number of commuting weeks per year) the total distance travelled by car (km) is calculated as: ∑ (daily one way distance between home and work (km) × 2 × 5 × number of commuting weeks per year) Total emissions from employee commuting for the reporting year is calculated as: ∑ (total distance travelled by vehicle type (vehicle-km or passenger-km) × vehicle specific emission factor (kg CO2 e/vehicle-km or kg CO2 e/passenger-km)) |
| Downstream transportation and distribution | Using distance travelled and weight moved data collected internally through our transportation management system as well as manual data collection. EPA Smartway emission factors are used for North American data and DEFRA emission factors are used for other regions. | Emissions from downstream transport: ∑ (quantity of goods sold (tonnes) × distance travelled in transport legs (km) × emission factor of transport mode or vehicle type (kg CO2 e/tonne-km)) |
| Processing of sold products | Using information on the volume of products manufactured by co-packers and an estimation of fuel and energy used based on company-owned KPIs on energy use per unit production and IEA electricity grid factors and DEFRA fuel emission factors. | Emissions from fuel consumed: ∑ (quantity of fuel consumed (e.g., litre) × emission factor for fuel source (e.g., kg CO2 e/litre)) Emissions from electricity consumed: ∑ (quantity of electricity consumed (e.g., kWh) × emission factor for electricity (e.g., kg CO2 e/kWh)) Emissions from waste output: ∑ (mass of waste output (kg) × emission factor for waste activity (kg CO2 e/kg)) Total emissions from processing of sold intermediate products = emissions from fuel + emissions from electricity + emissions from waste |
References
- IPCC. Special Report—Global Warming of 1.5 °C. Available online: https://www.ipcc.ch/sr15/ (accessed on 8 September 2021).
- Rogelj, J.; Geden, O.; Cowie, A.; Reisinger, A. Net-Zero Emissions Targets Are Vague: Three Ways to Fix. Nature 2021, 591, 365–368. [Google Scholar] [CrossRef] [PubMed]
- Fankhauser, S.; Smith, S.; Allen, M.; Axelsson, K.; Hale, T.; Hepburn, C.; Kendall, J.; Khosla, R.; Lezaun, J.; Mitchell-Larson, E.; et al. The Meaning of Net Zero and how to Get it Right. Nat. Clim. Chang. 2021, 12, 15–21. [Google Scholar] [CrossRef]
- UNCC. The Paris Agreement. Available online: https://unfccc.int/process-and-meetings/the-paris-agreement/the-paris-agreement (accessed on 8 September 2021).
- Davis, S.J.; Lewis, N.S.; Shaner, M.; Aggarwal, S.; Arent, D.; Azevedo, I.L.; Benson, S.M.; Bradley, T.; Brouwer, J.; Chiang, Y.-M.; et al. Net-Zero Emissions Energy Systems. Sci. Am. Assoc. Adv. Sci. 2018, 360, 1419. [Google Scholar] [CrossRef] [PubMed] [Green Version]
- Harangozo, G.; Szigeti, C. Corporate Carbon Footprint Analysis in Practice—With a Special Focus on Validity and Reliability Issues. J. Clean. Prod. 2017, 167, 1177–1183. [Google Scholar] [CrossRef]
- Demaria, S.; Rigot, S. Corporate Environmental Reporting: Are French Firms Compliant with the Task Force on Climate Financial Disclosures’ Recommendations? Bus. Strategy Environ. 2021, 30, 721–738. [Google Scholar] [CrossRef]
- Caldecott, B. Stranded Assets and the Environment Risk, Resilience and Opportunity, 1st ed.; Routledge: London, UK, 2018; p. 16. [Google Scholar]
- PepsiCo. 2020 Sustainability Report. Available online: https://www.pepsico.com/sustainability-report/strategy (accessed on 8 September 2021).
- PepsiCo. Climate Change. Available online: https://www.pepsico.com/esg-topics-a-z/climate-change (accessed on 13 September 2021).
- The Climate Pledge. Net Zero Carbon by 2040. Available online: https://www.theclimatepledge.com/ (accessed on 7 September 2021).
- PepsiCo, Inc. CDP Climate Change Questionnaire 2021. Available online: https://www.pepsico.com/docs/album/esg-topics-policies/2021-cdp-climate-response.pdf (accessed on 11 September 2021).
- PepsiCo, Inc. CDP Climate Change Questionnaire 2019. Available online: https://www.pepsico.com/docs/album/esg-topics-policies/2019-cdp-climate-response.pdf (accessed on 11 September 2021).
- PepsiCo, Inc. CDP Climate Change Questionnaire 2020. Available online: https://www.pepsico.com/docs/album/esg-topics-policies/2020-cdp-climate-response.pdf (accessed on 11 September 2021).
- Grubler, A.; Wilson, C.; Bento, N.; Boza-Kiss, B.; Krey, V.; McCollum, D.L.; Rao, N.D.; Riahi, K.; Rogelj, J.; De Stercke, S.; et al. A Low Energy Demand Scenario for Meeting the 1.5 °C Target and Sustainable Development Goals without Negative Emission Technologies. Nat. Energy 2018, 3, 515–527. [Google Scholar] [CrossRef]
- PepsiCo. 2020 Sustainability Performance Metrics. Available online: https://www.pepsico.com/docs/album/sustainability-report/2020-csr/2020-sustainability-performance-metrics-sheet.pdf (accessed on 7 September 2021).
- EPA. Managing Supply Chain Greenhouse Gas Emissions—Lessons Learned for the Road Ahead. Available online: https://www.epa.gov/sites/default/files/2015-07/documents/managing_supplychain_ghg.pdf (accessed on 7 September 2021).
- Nestlé. Accelerate, Transform, Regenerate: Nestlé’s Net Zero Roadmap. Available online: https://www.nestle.com/sites/default/files/2021-03/creating-shared-value-report-2020-en.pdf (accessed on 16 September 2021).
- Coca-Cola 2020 Business & Environmental, Social and Governance Report. Available online: https://www.coca-colacompany.com/content/dam/journey/us/en/reports/coca-cola-business-environmental-social-governance-report-2020.pdf (accessed on 16 September 2021).
- Tyson Foods. Progress: Protecting Our Planet Conserving Natural Resources. Tyson 2020 Sustainability Progress Report. Available online: https://www.tysonsustainability.com/progress-report/progress/natural-resources (accessed on 16 September 2021).


| Business Division | Scope 2, Location-Based (Metric Tons CO2 e) | Scope 2, Market-Based (Metric Tons CO2 e) |
|---|---|---|
| Africa, Middle East and South Asia | 419,016 | 419,016 |
| Asia Pacific, Australia and New Zealand, and China | 87,062 | 85,393 |
| Europe | 290,672 | 206,232 |
| Frito-Lay North America | 316,792 | 25,546 |
| Latin America | 183,545 | 100,951 |
| PepsiCo Beverages North America | 321,286 | 8,189 |
| PepsiCo Global Concentrate Solutions | 12,059 | 10,937 |
| Quaker Foods North America | 89,177 | 1134 |
| Source | 2020 | 2019 | 2018 |
|---|---|---|---|
| Purchased goods and services | 36,519,067 | 33,599,797 | 39,026,490 |
| Capital goods | 989,112 | 600,278 | 1,698,930 |
| Fuel-and-energy-related activities (not included in Scope 1 or 2) | 1,566,238 | 946,616 | 603,560 |
| Upstream transportation and distribution | 1,773,024 | 720,951 | 1,161,810 |
| Waste generated in operations | 48,947 | 25,353 | 60,360 |
| Business travel | 137,668 | 140,452 | 121,070 |
| Employee commuting | 150,635 | 201,663 | 506,710 |
| Downstream transportation and distribution | 10,240,708 | 11,088,559 | 9,964,010 |
| Processing of sold products | 223,702 | 231,426 | 3,046,900 |
| End of life treatment of sold products | 1,179,467 | 811,130 | 1,195,840 |
| Franchises | 1,651,219 | 1,843,424 | 1,418,720 |
| Investments | 148,986 | 255,417 | 2,730,730 |
| Other (downstream) | 0 | 0 | 1,282,850 |
| Initiative Category and Initiative Type | Estimated Annual CO2 e Savings (Metric Tonnes CO2 e) | Scope(s) | Annual Monetary Savings (US $) | Investment Required (US $) |
|---|---|---|---|---|
| Energy efficiency in buildings Combined heat and power (cogeneration) | 7810 | Scope 1 Scope 2 (market-based) | 2,268,598 | 11,791,772 |
| Energy efficiency in buildings Heating, Ventilation and Air Conditioning (HVAC) | 2128 | Scope 1 Scope 2 (market-based) | 421,567 | 2,149,012 |
| Energy efficiency in buildings Insulation | 1948 | Scope 1 Scope 2 (market-based) | 166,485 | 790,151 |
| Energy efficiency in buildings Lighting | 1023 | Scope 2 (market-based) | 169,534 | 990,453 |
| Energy efficiency in production processes Compressed air | 2633 | Scope 2 (market-based) | 262,631 | 1,356,136 |
| Energy efficiency in production processes Cooling technology | 2223 | Scope 1 Scope 2 (market-based) | 252,610 | 1,343,917 |
| Energy efficiency in production processes Fuel switch | 583 | Scope 1 | 33,617 | 167,436 |
| Energy efficiency in production processes Machine/equipment replacement | 6305 | Scope 1 | 907,884 | 5,397,549 |
| Energy efficiency in production processes Process optimization | 18,106 | Scope 1 Scope 2 (market-based) Scope 3 | 2,862,834 | 12,139,619 |
| Energy efficiency in production processes Smart control system | 7903 | Scope 1 Scope 2 (market-based) | 292,924 | 1,918,890 |
| Energy efficiency in production processes Waste heat recovery | 4333 | Scope 1 | 577,112 | 2,841,703 |
| Total | 54,995 | 8,215,796 | 40,886,638 |
| Initiative Category and Initiative Type | Estimated Annual CO2 e Savings (Metric Tonnes CO2 e) | Scope(s) | Annual Monetary Savings (US $) | Investment Required (US $) |
|---|---|---|---|---|
| Low-carbon energy consumption Biogas | 484 | Scope 1 | 377,830 | 1,698,000 |
| Low-carbon energy generation Solar heating and cooling | 120 | Scope 1 Scope 2 (market-based) | 14,104 | 65,706 |
| Low-carbon energy generation Solar PV | 10,873 | Scope 2 (market-based) | 2,252,856 | 12,811,075 |
| Total | 11,477 | 2,644,790 | 14,574,781 |
| Initiative Category and Initiative Type | Estimated Annual CO2 e Savings (Metric Tonnes CO2 e) | Scope(s) | Annual Monetary Savings | Investment Required |
|---|---|---|---|---|
| Waste reduction and material circularity Product/component/material recycling | 190,958 | Scope 3 | 0 | 0 |
| Waste reduction and material circularity Product/component/material reuse | 172,844 | Scope 3 | 0 | 0 |
| Total | 363,802 | 0 | 0 |
Publisher’s Note: MDPI stays neutral with regard to jurisdictional claims in published maps and institutional affiliations. |
© 2022 by the authors. Licensee MDPI, Basel, Switzerland. This article is an open access article distributed under the terms and conditions of the Creative Commons Attribution (CC BY) license (https://creativecommons.org/licenses/by/4.0/).
Share and Cite
Qian, D.; Dargusch, P.; Hill, G. Carbon Management behind the Ambitious Pledge of Net Zero Carbon Emission—A Case Study of PepsiCo. Sustainability 2022, 14, 2171. https://doi.org/10.3390/su14042171
Qian D, Dargusch P, Hill G. Carbon Management behind the Ambitious Pledge of Net Zero Carbon Emission—A Case Study of PepsiCo. Sustainability. 2022; 14(4):2171. https://doi.org/10.3390/su14042171
Chicago/Turabian StyleQian, Duan, Paul Dargusch, and Genia Hill. 2022. "Carbon Management behind the Ambitious Pledge of Net Zero Carbon Emission—A Case Study of PepsiCo" Sustainability 14, no. 4: 2171. https://doi.org/10.3390/su14042171